
Using Geochemical and Environmental Isotopic Tracers to Evaluate Groundwater Recharge and Mineralization Processes in Qena Basin, Eastern Nile Valley, Egypt

 ,
,
Abstract
:1. Introduction

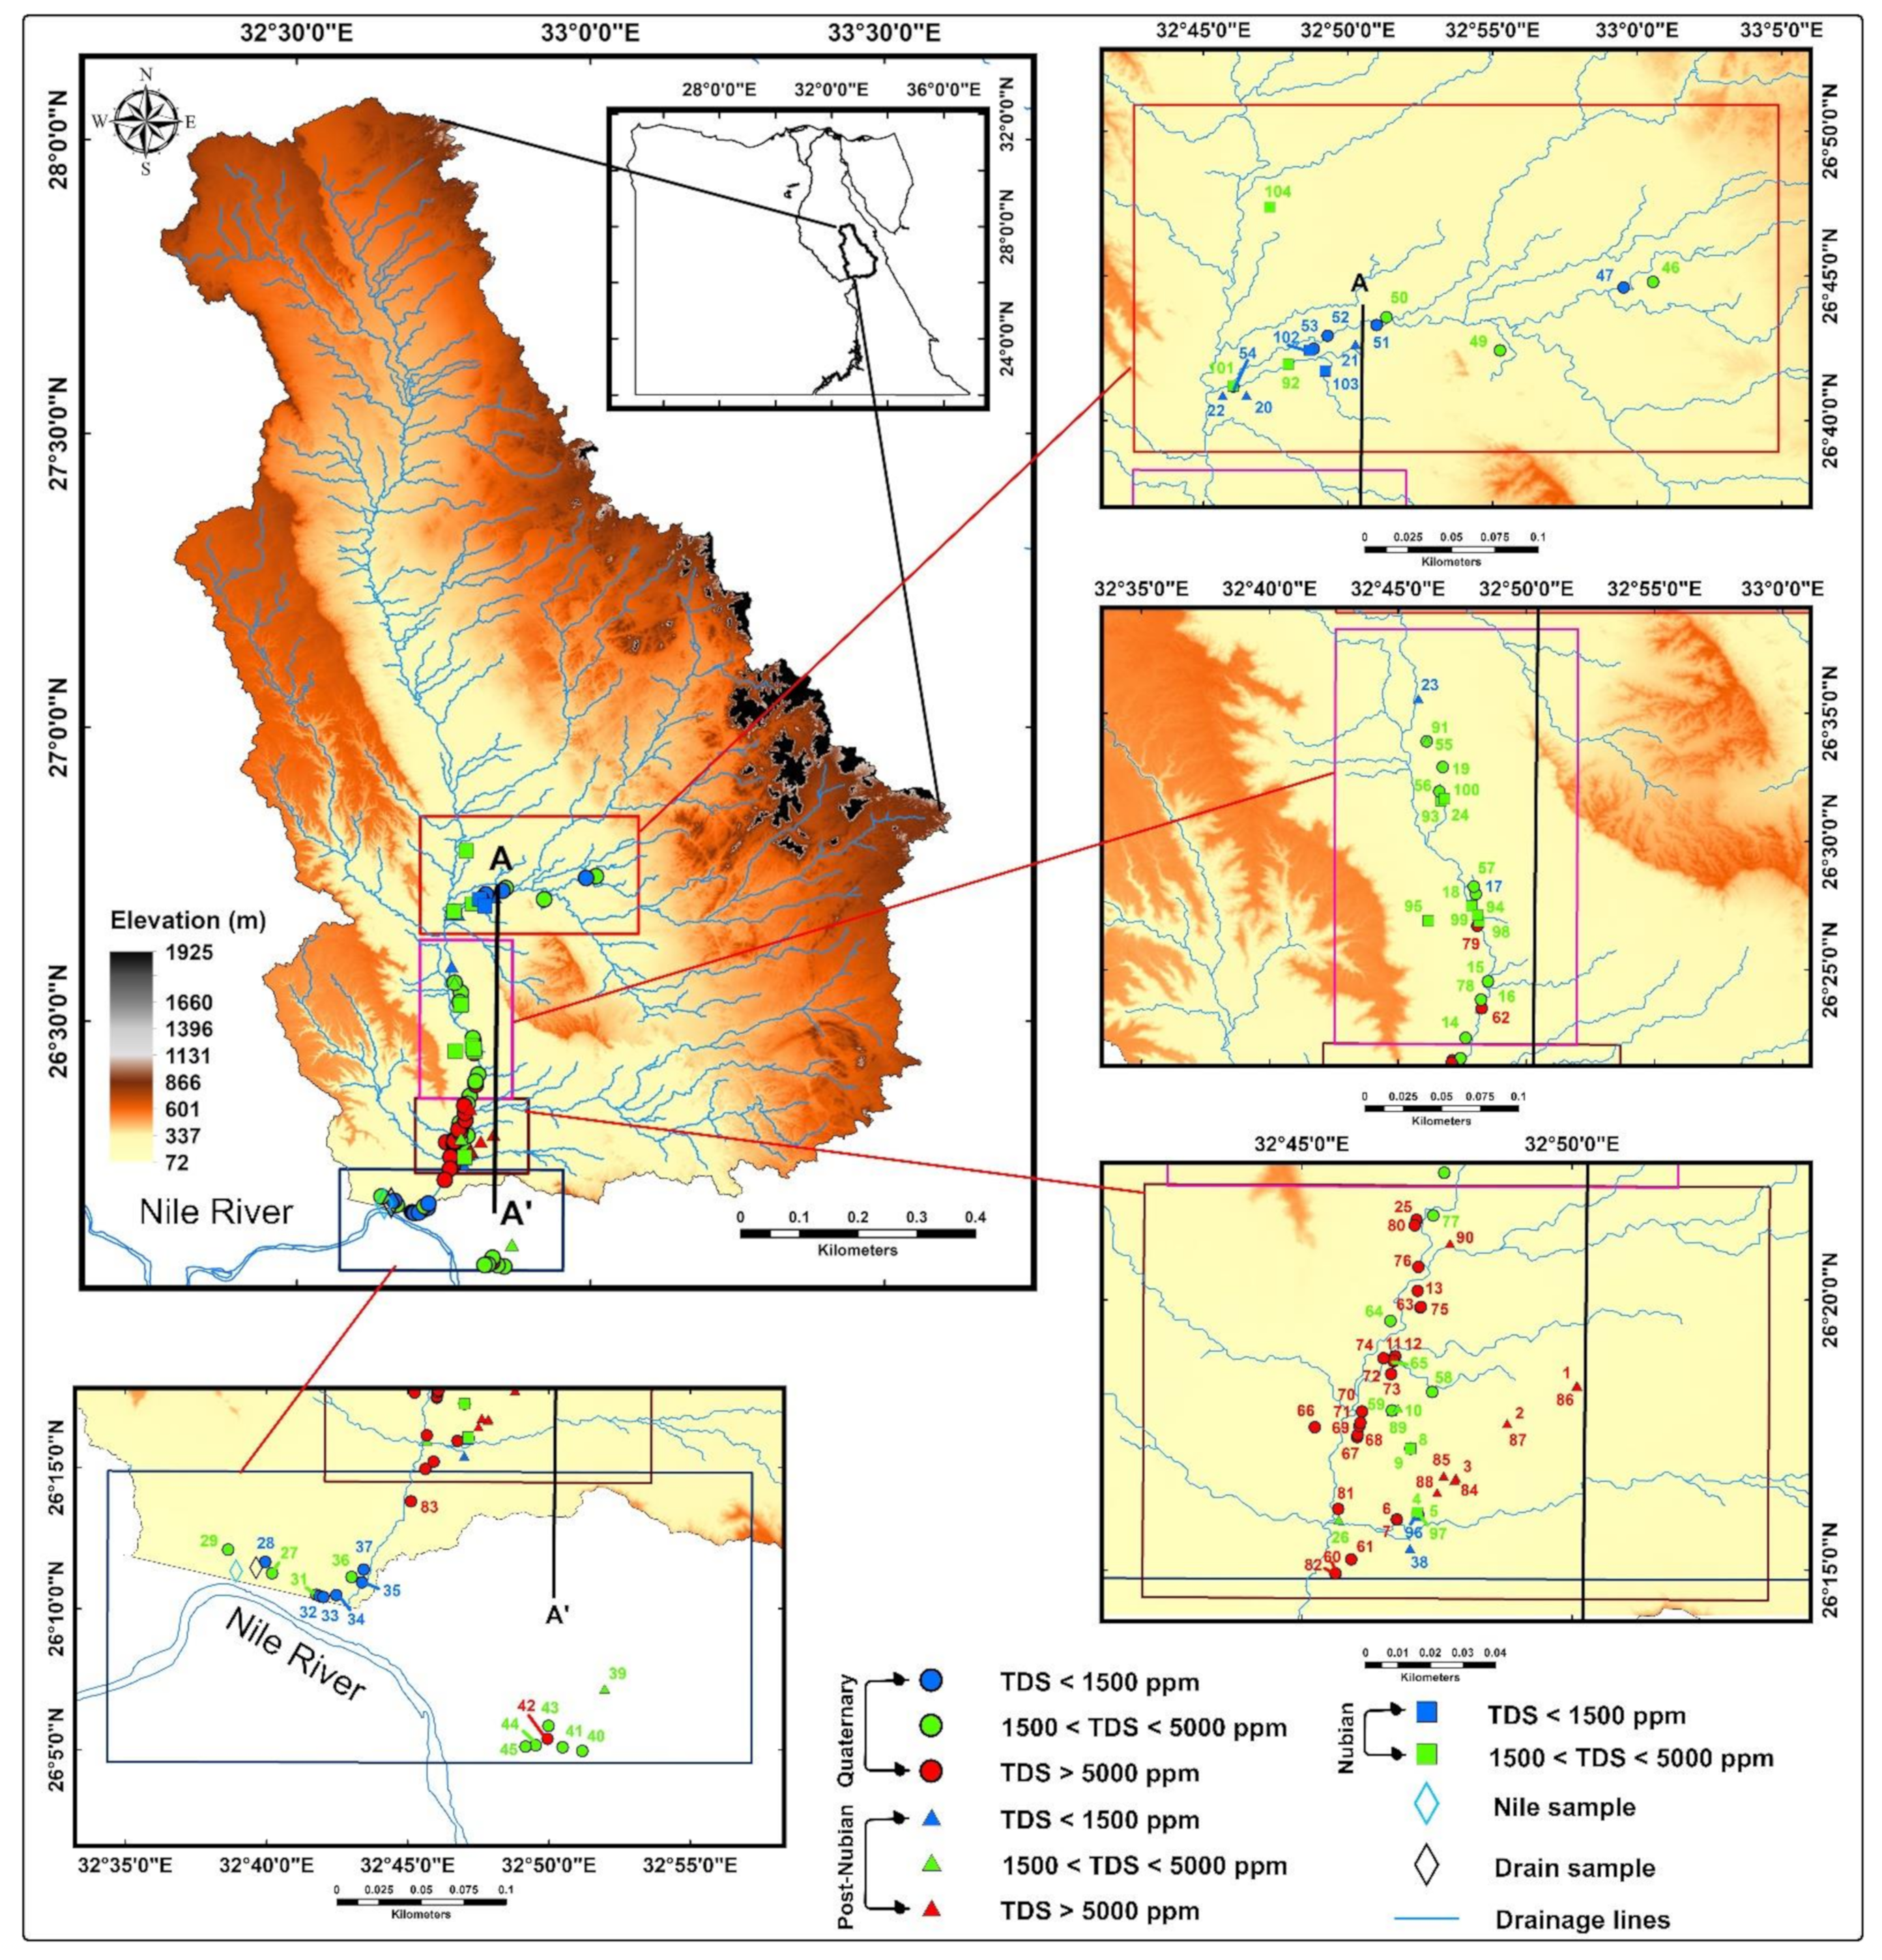
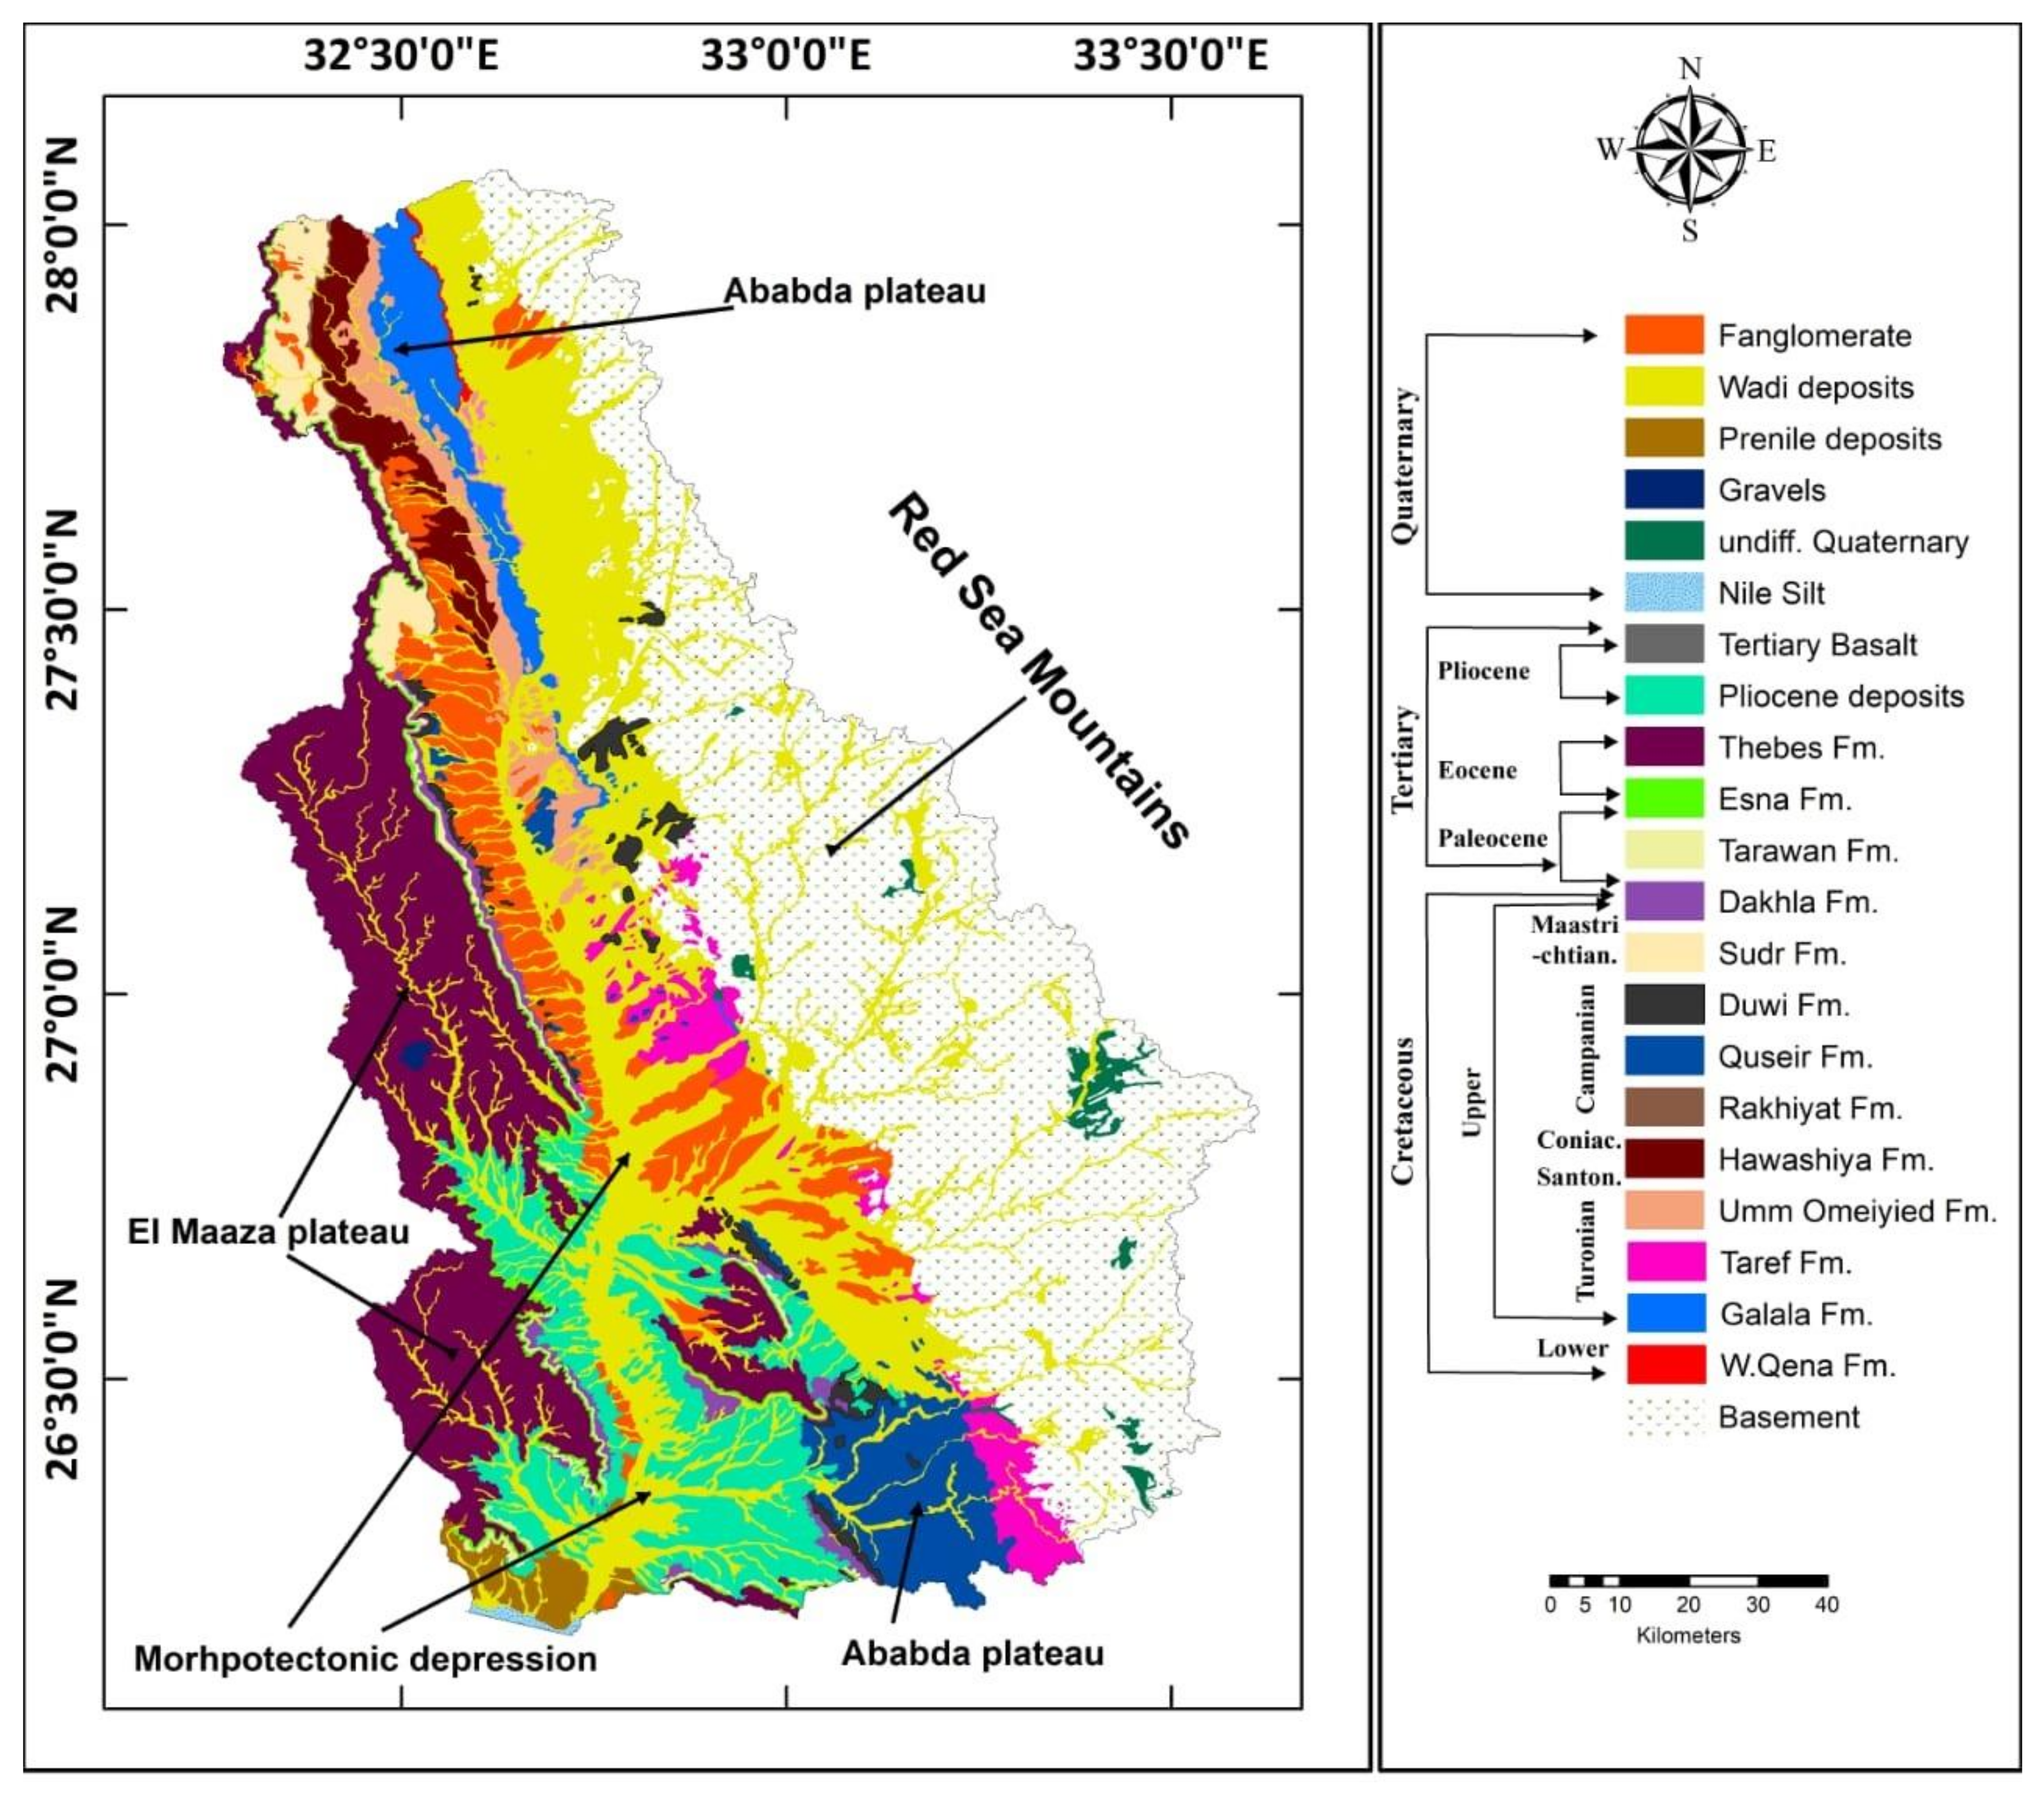
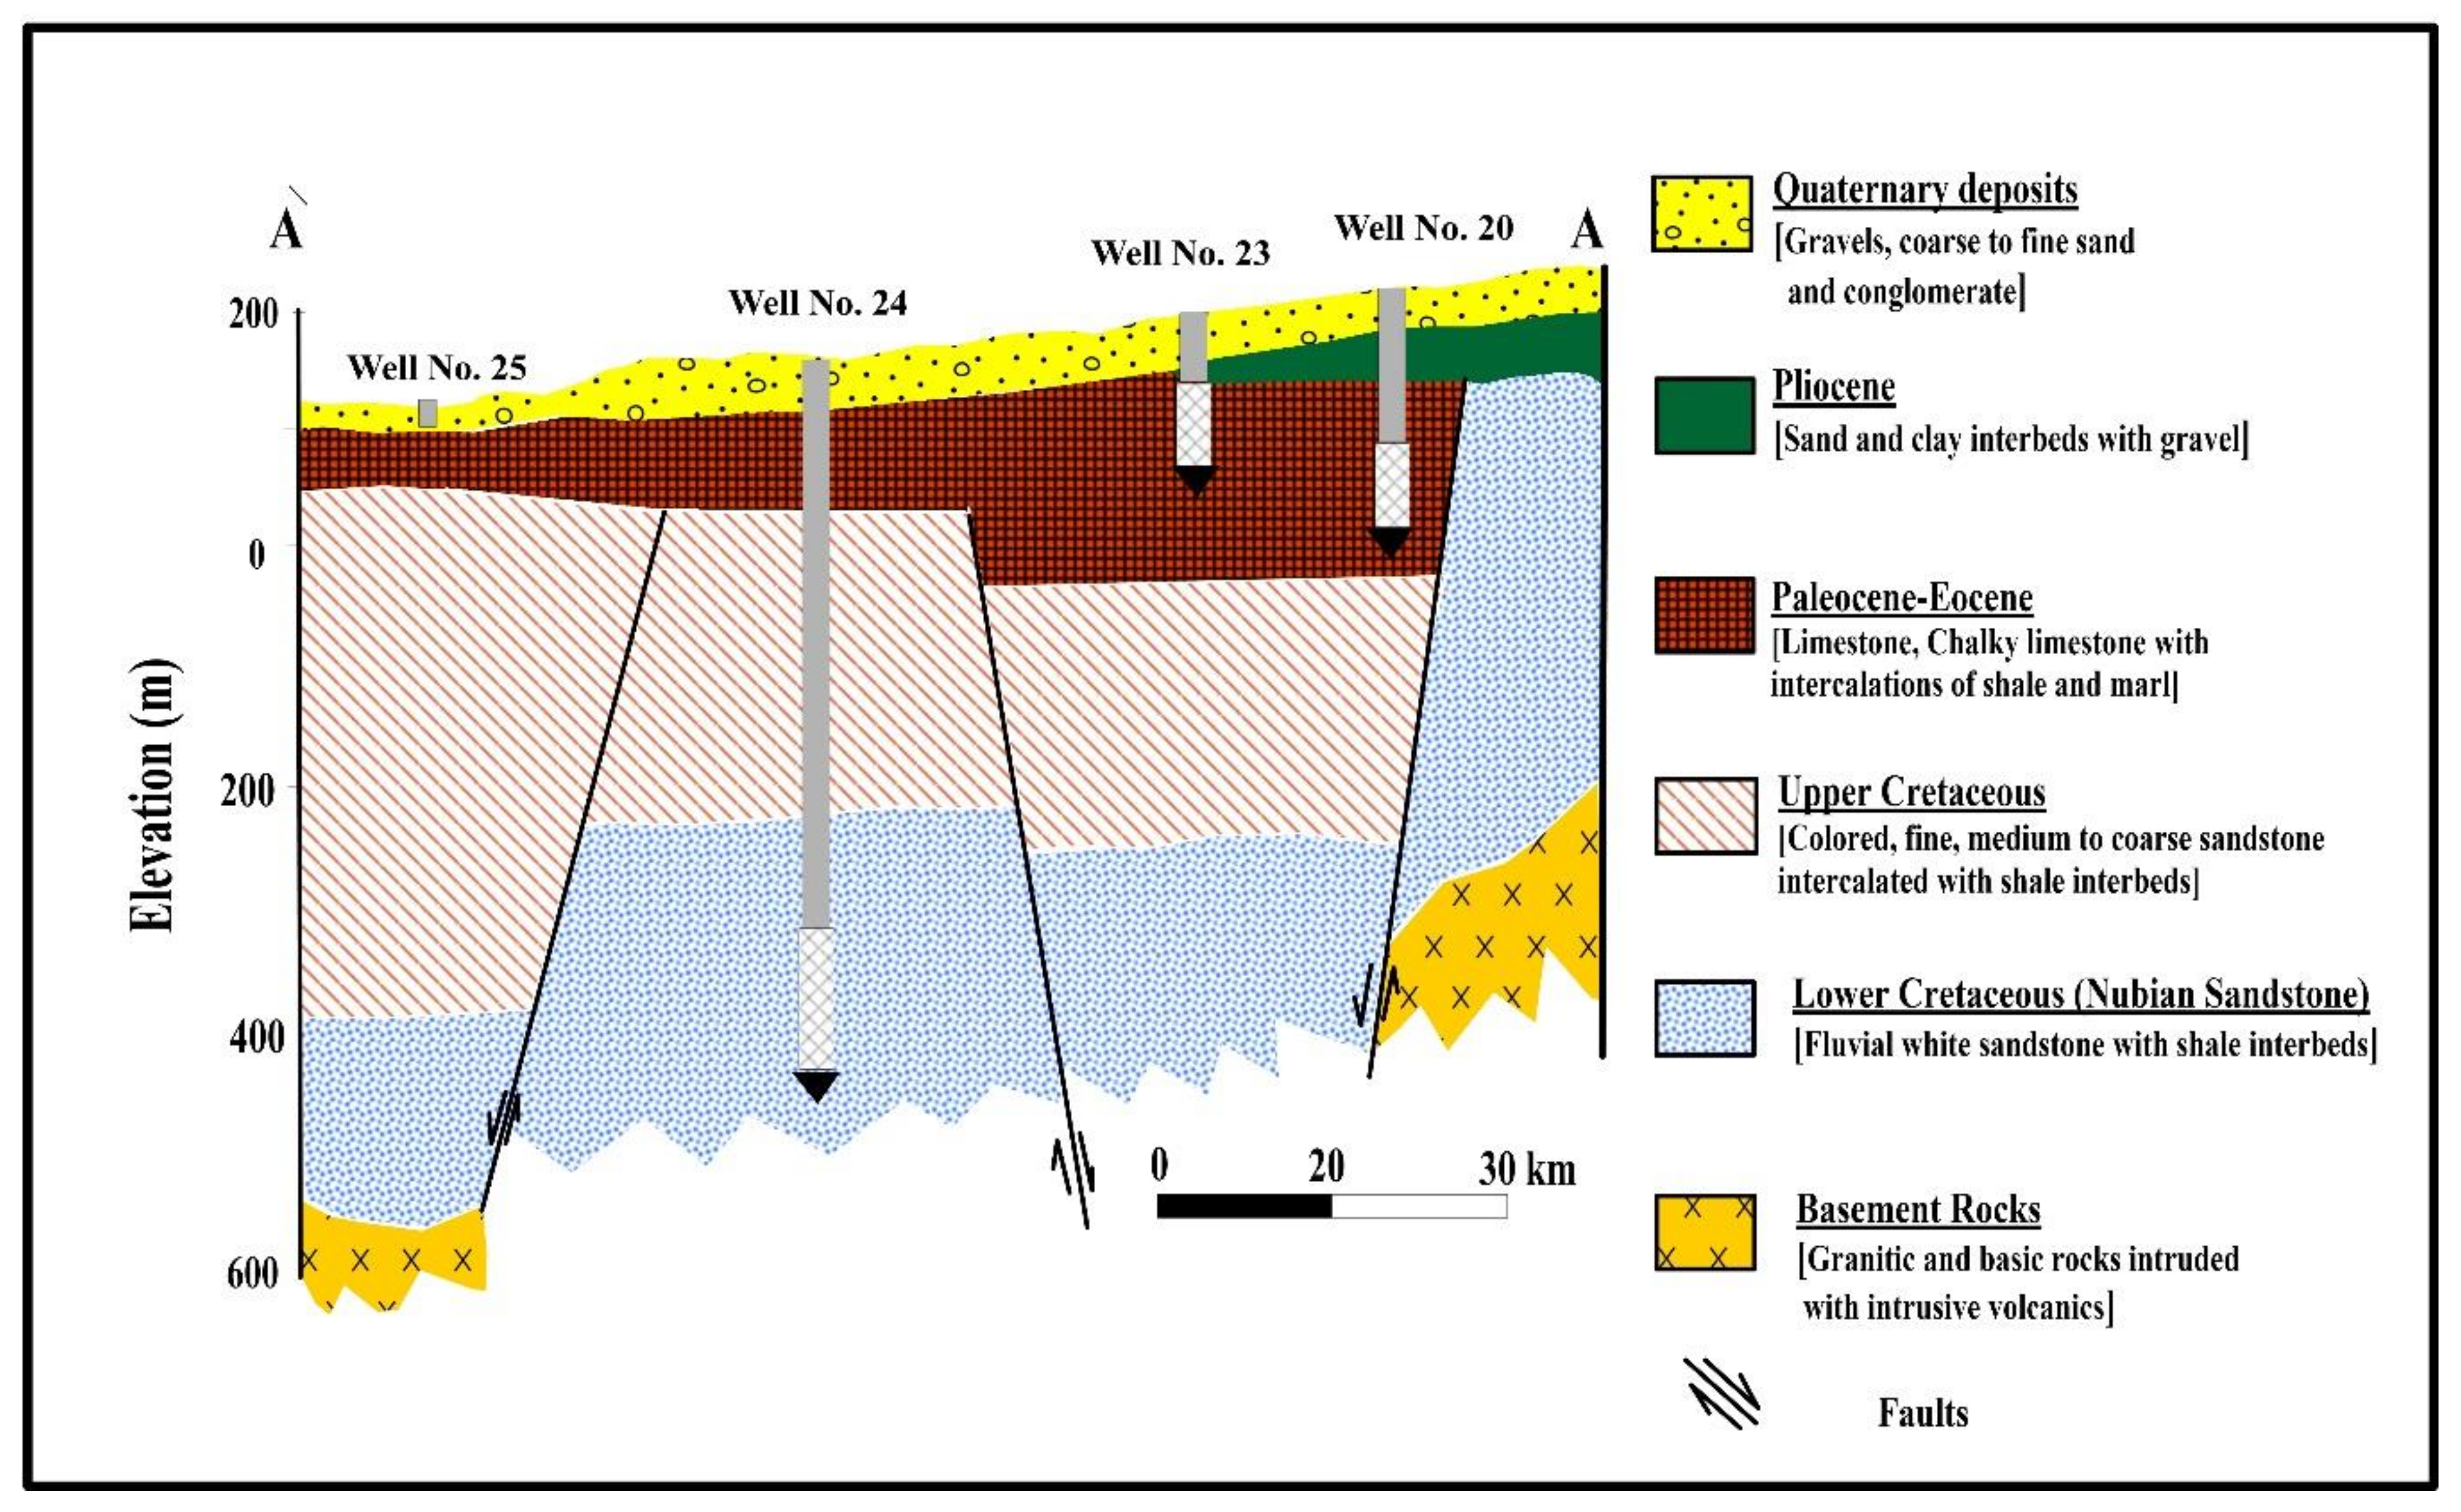
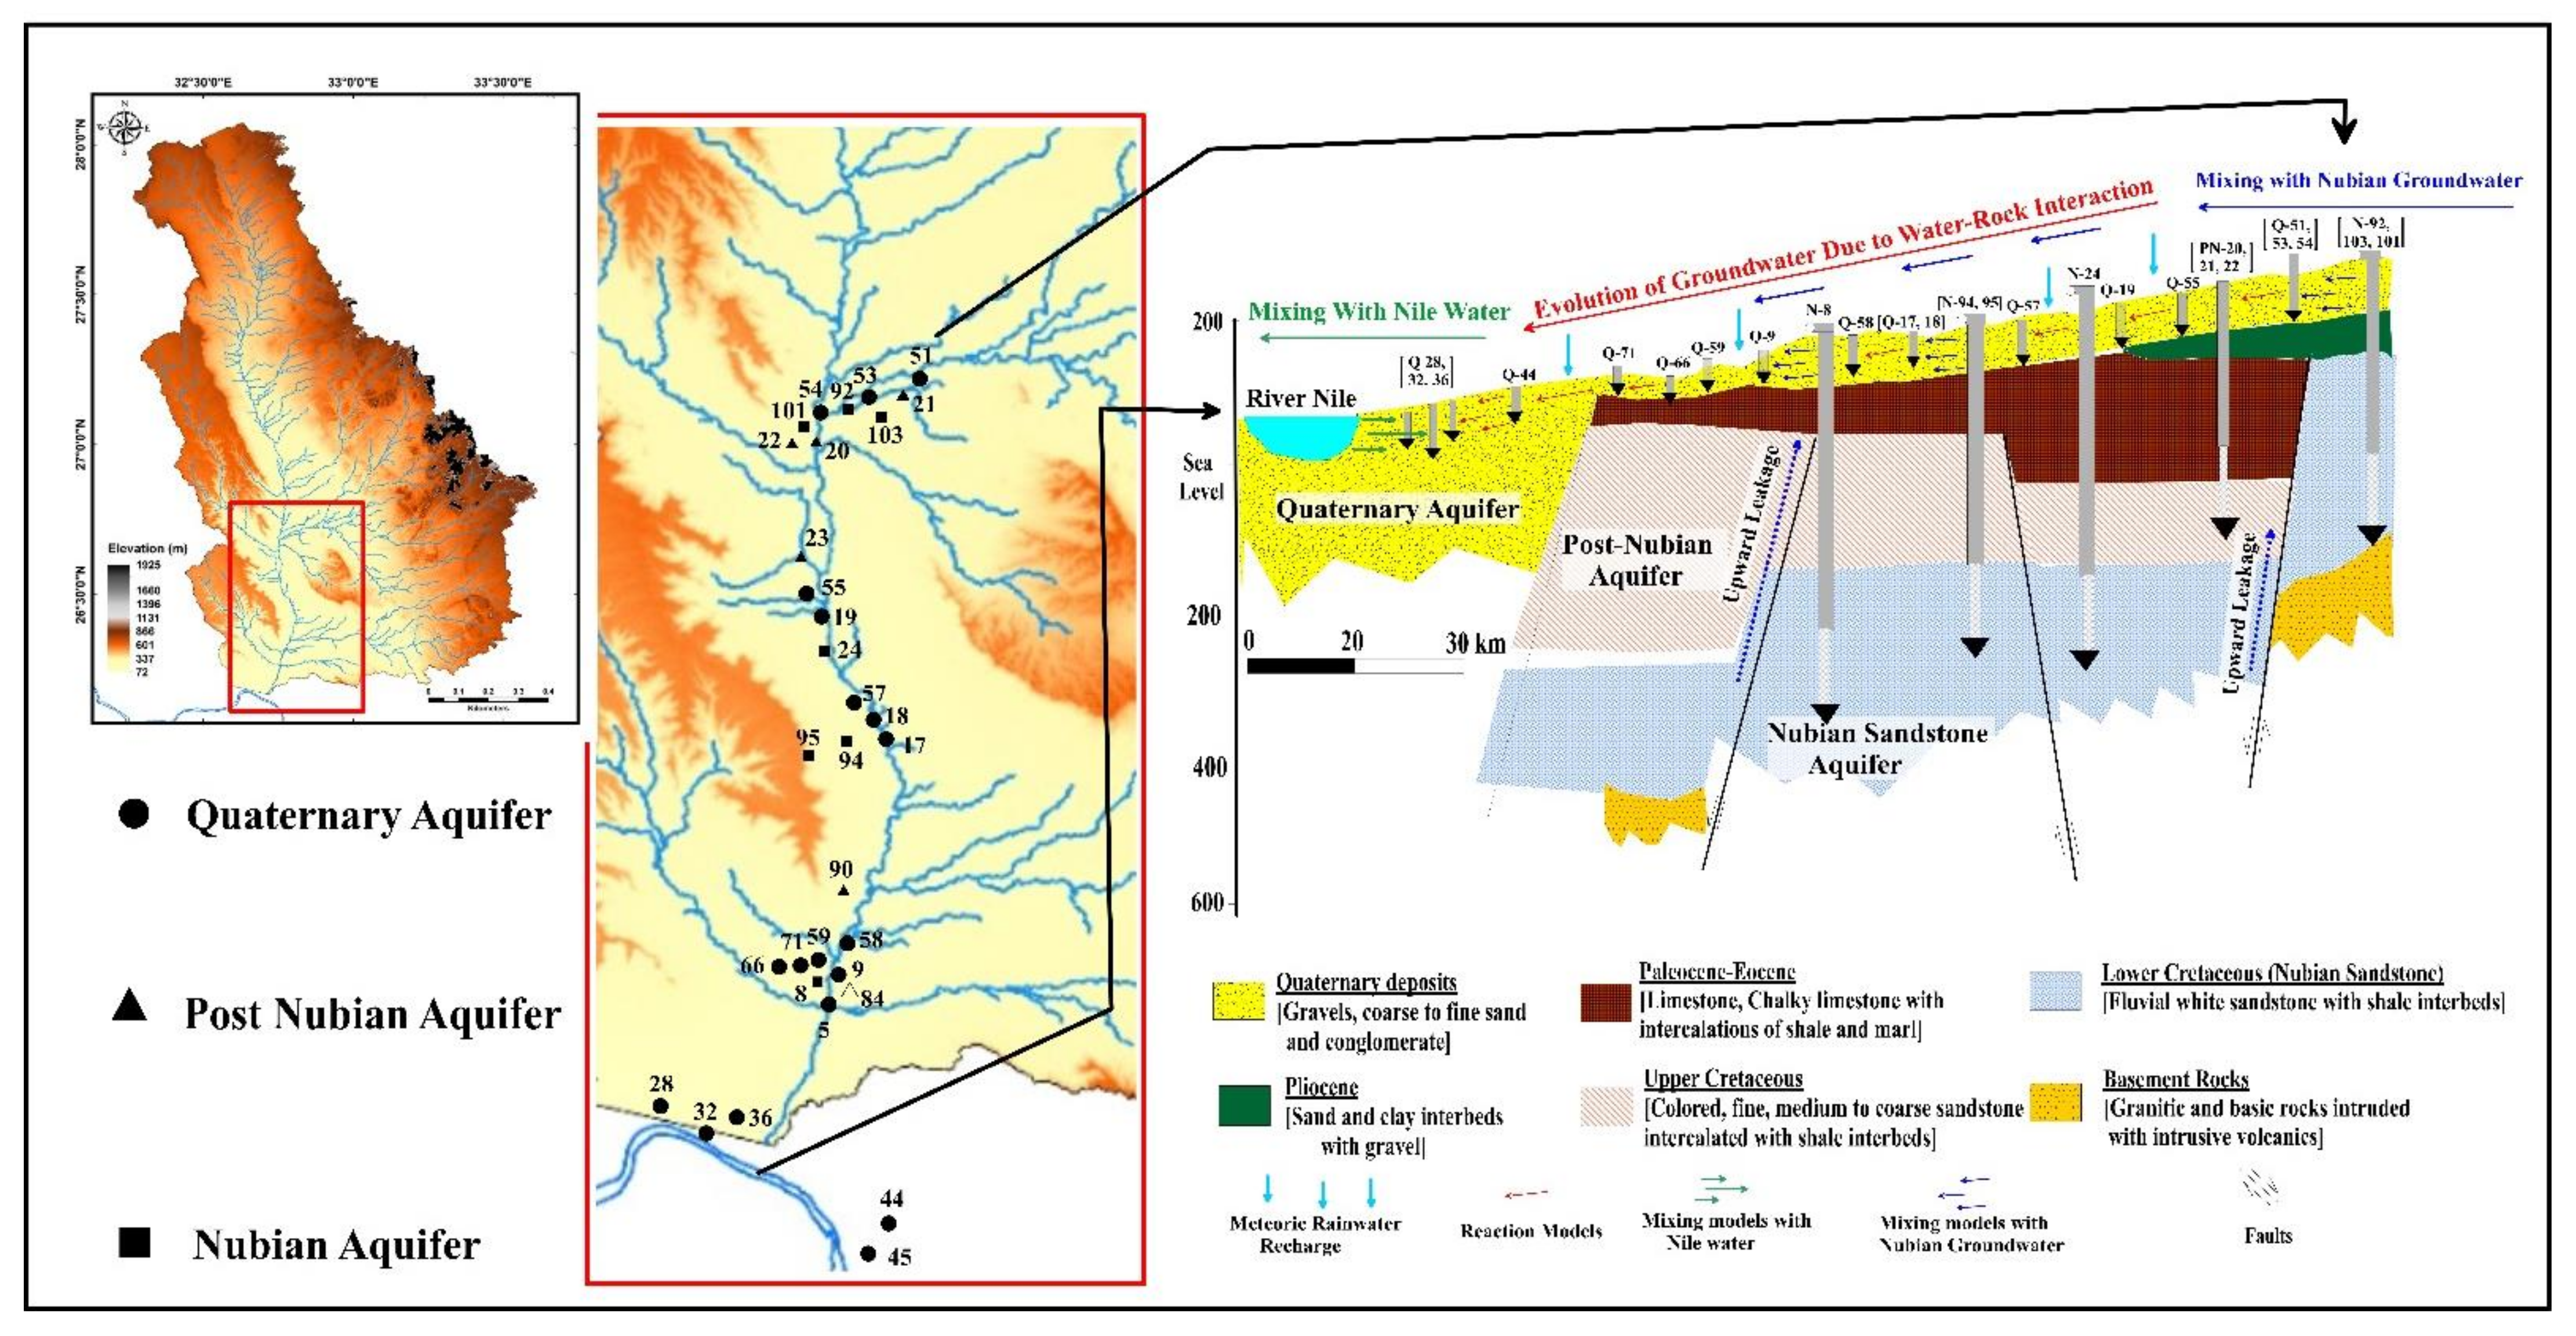
2. Geomorphology, Geology, and Hydrogeology

3. Methodology
4. Results
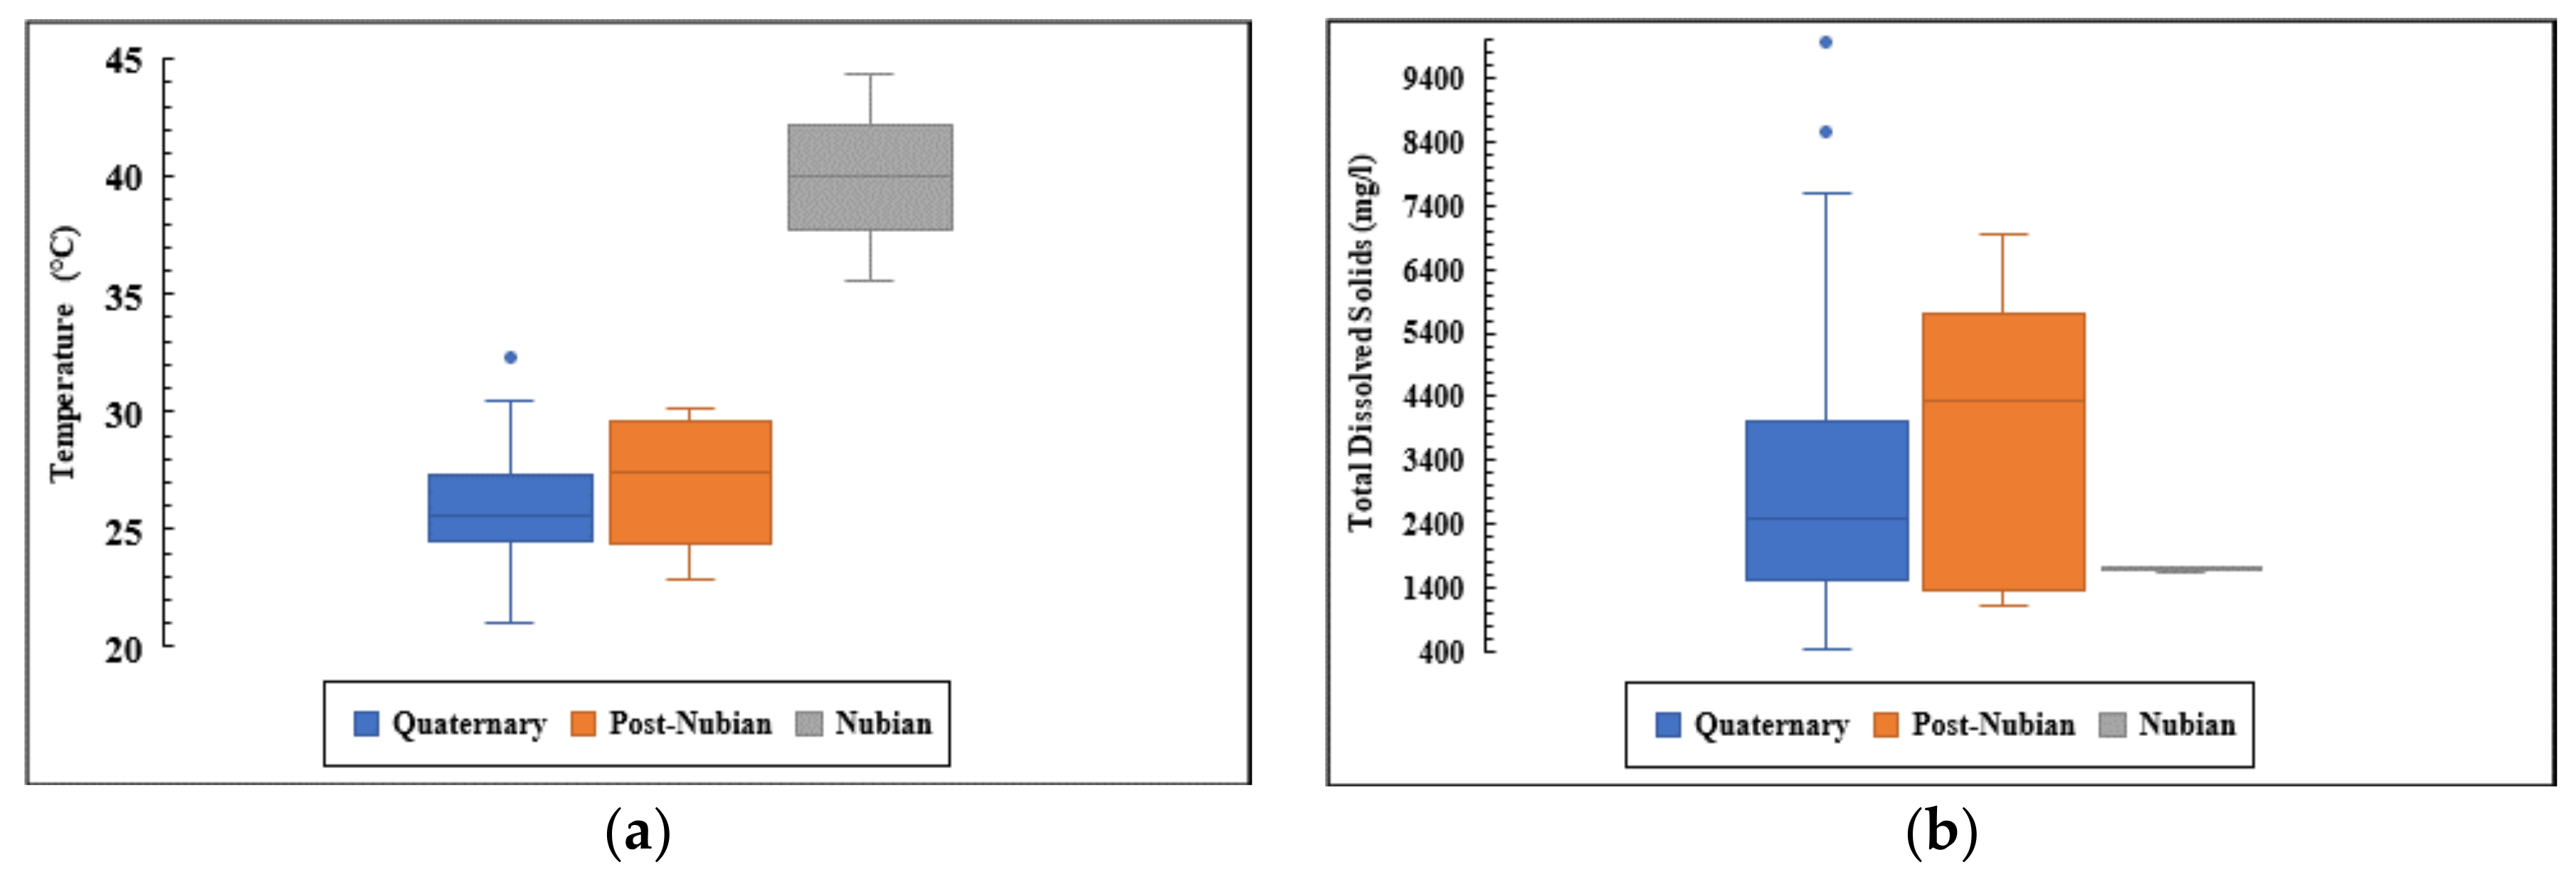
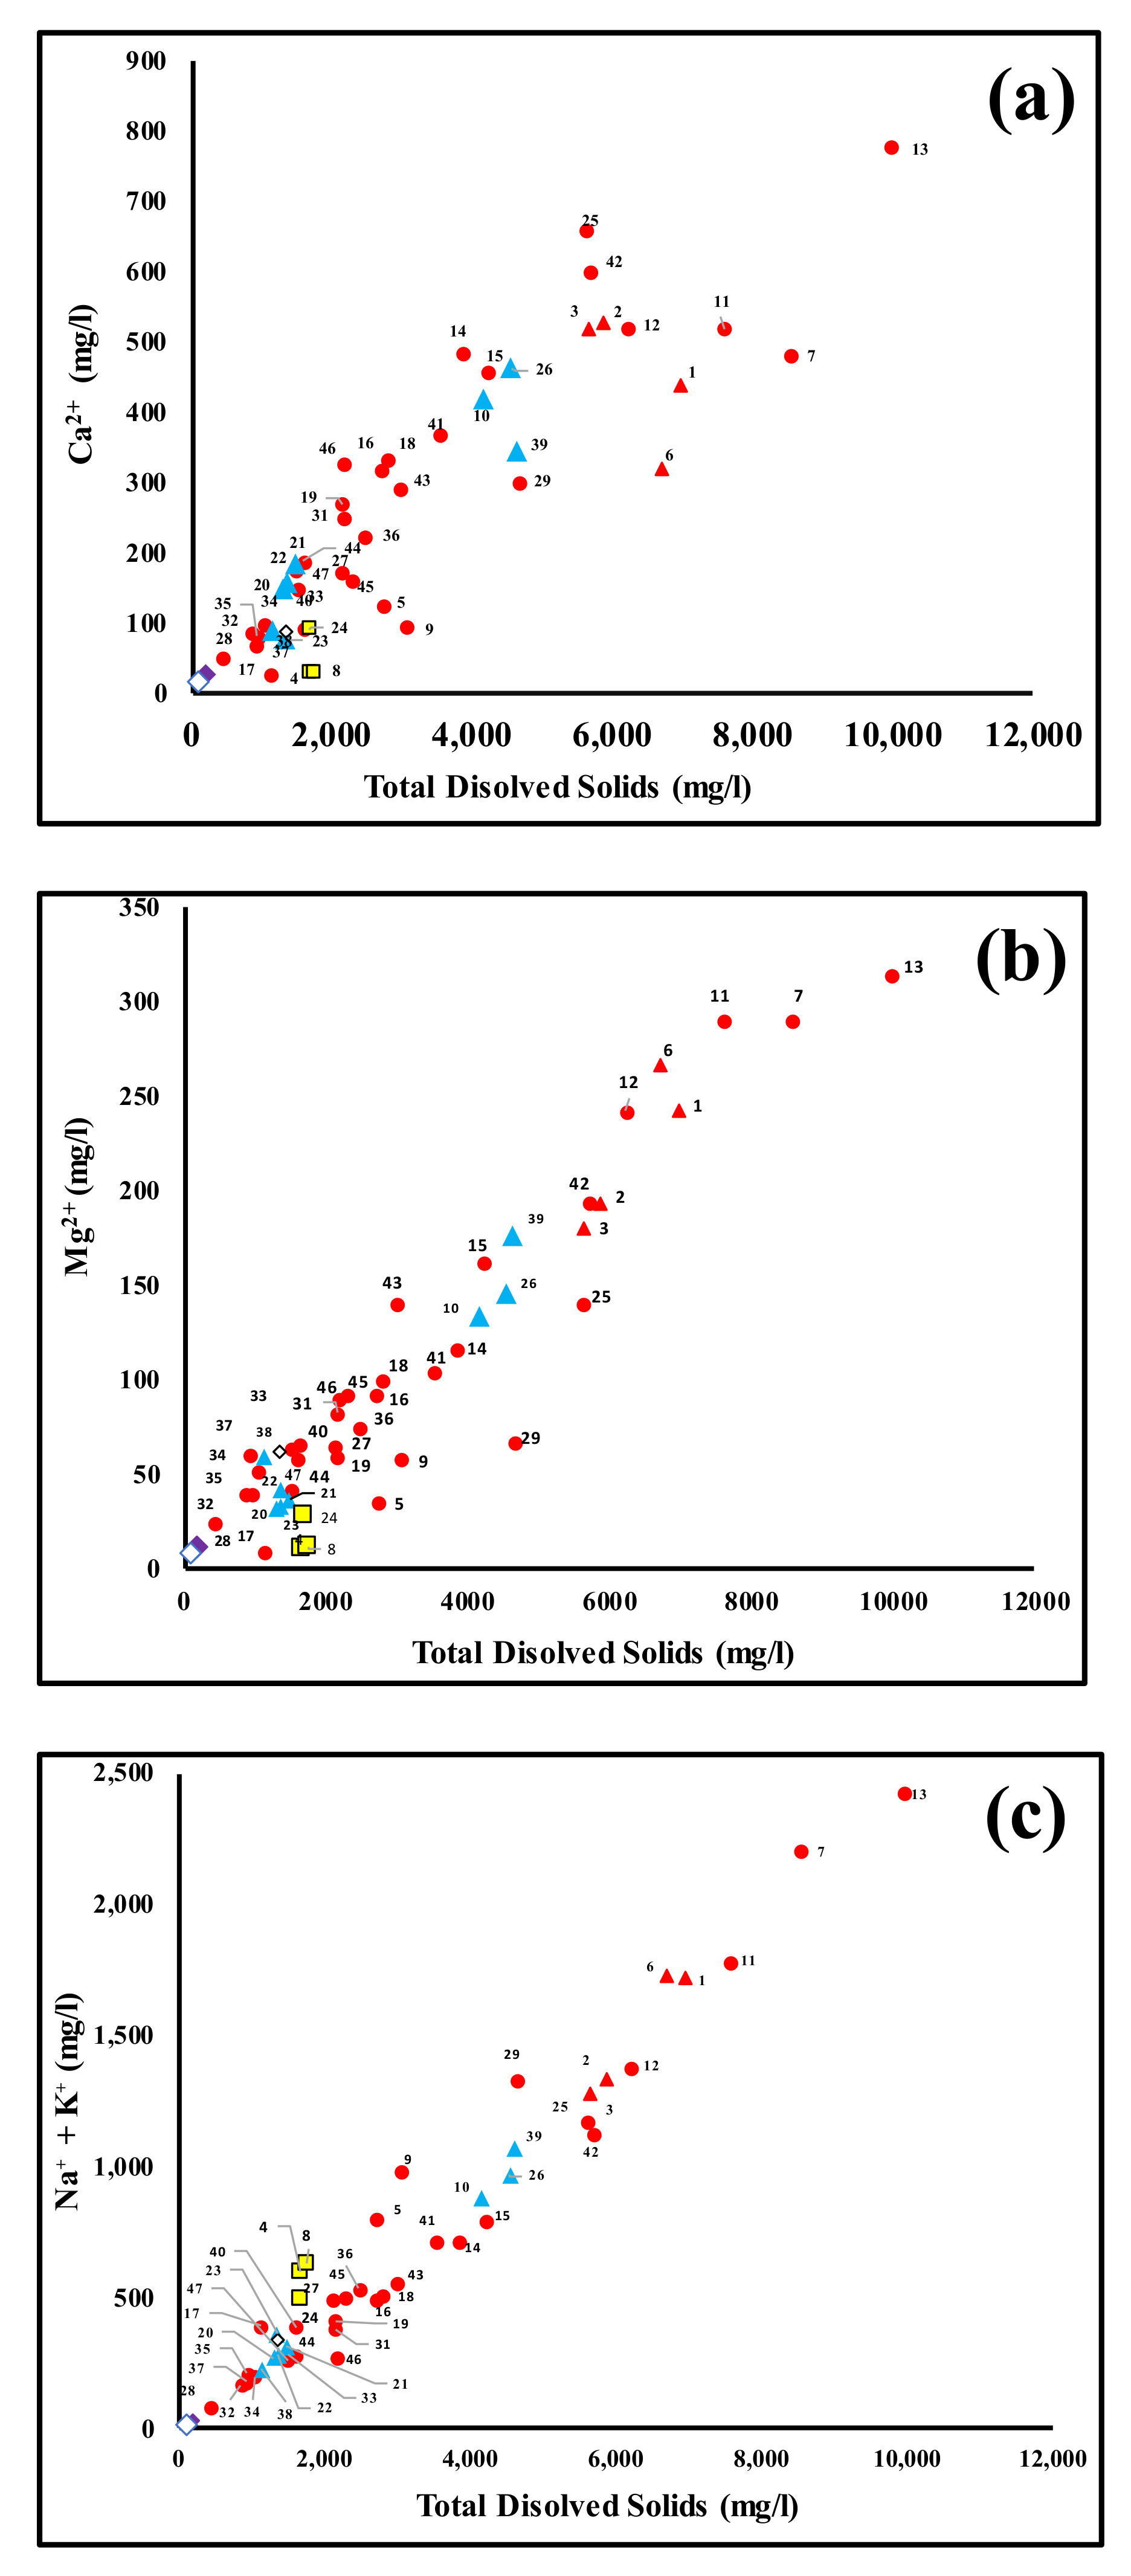
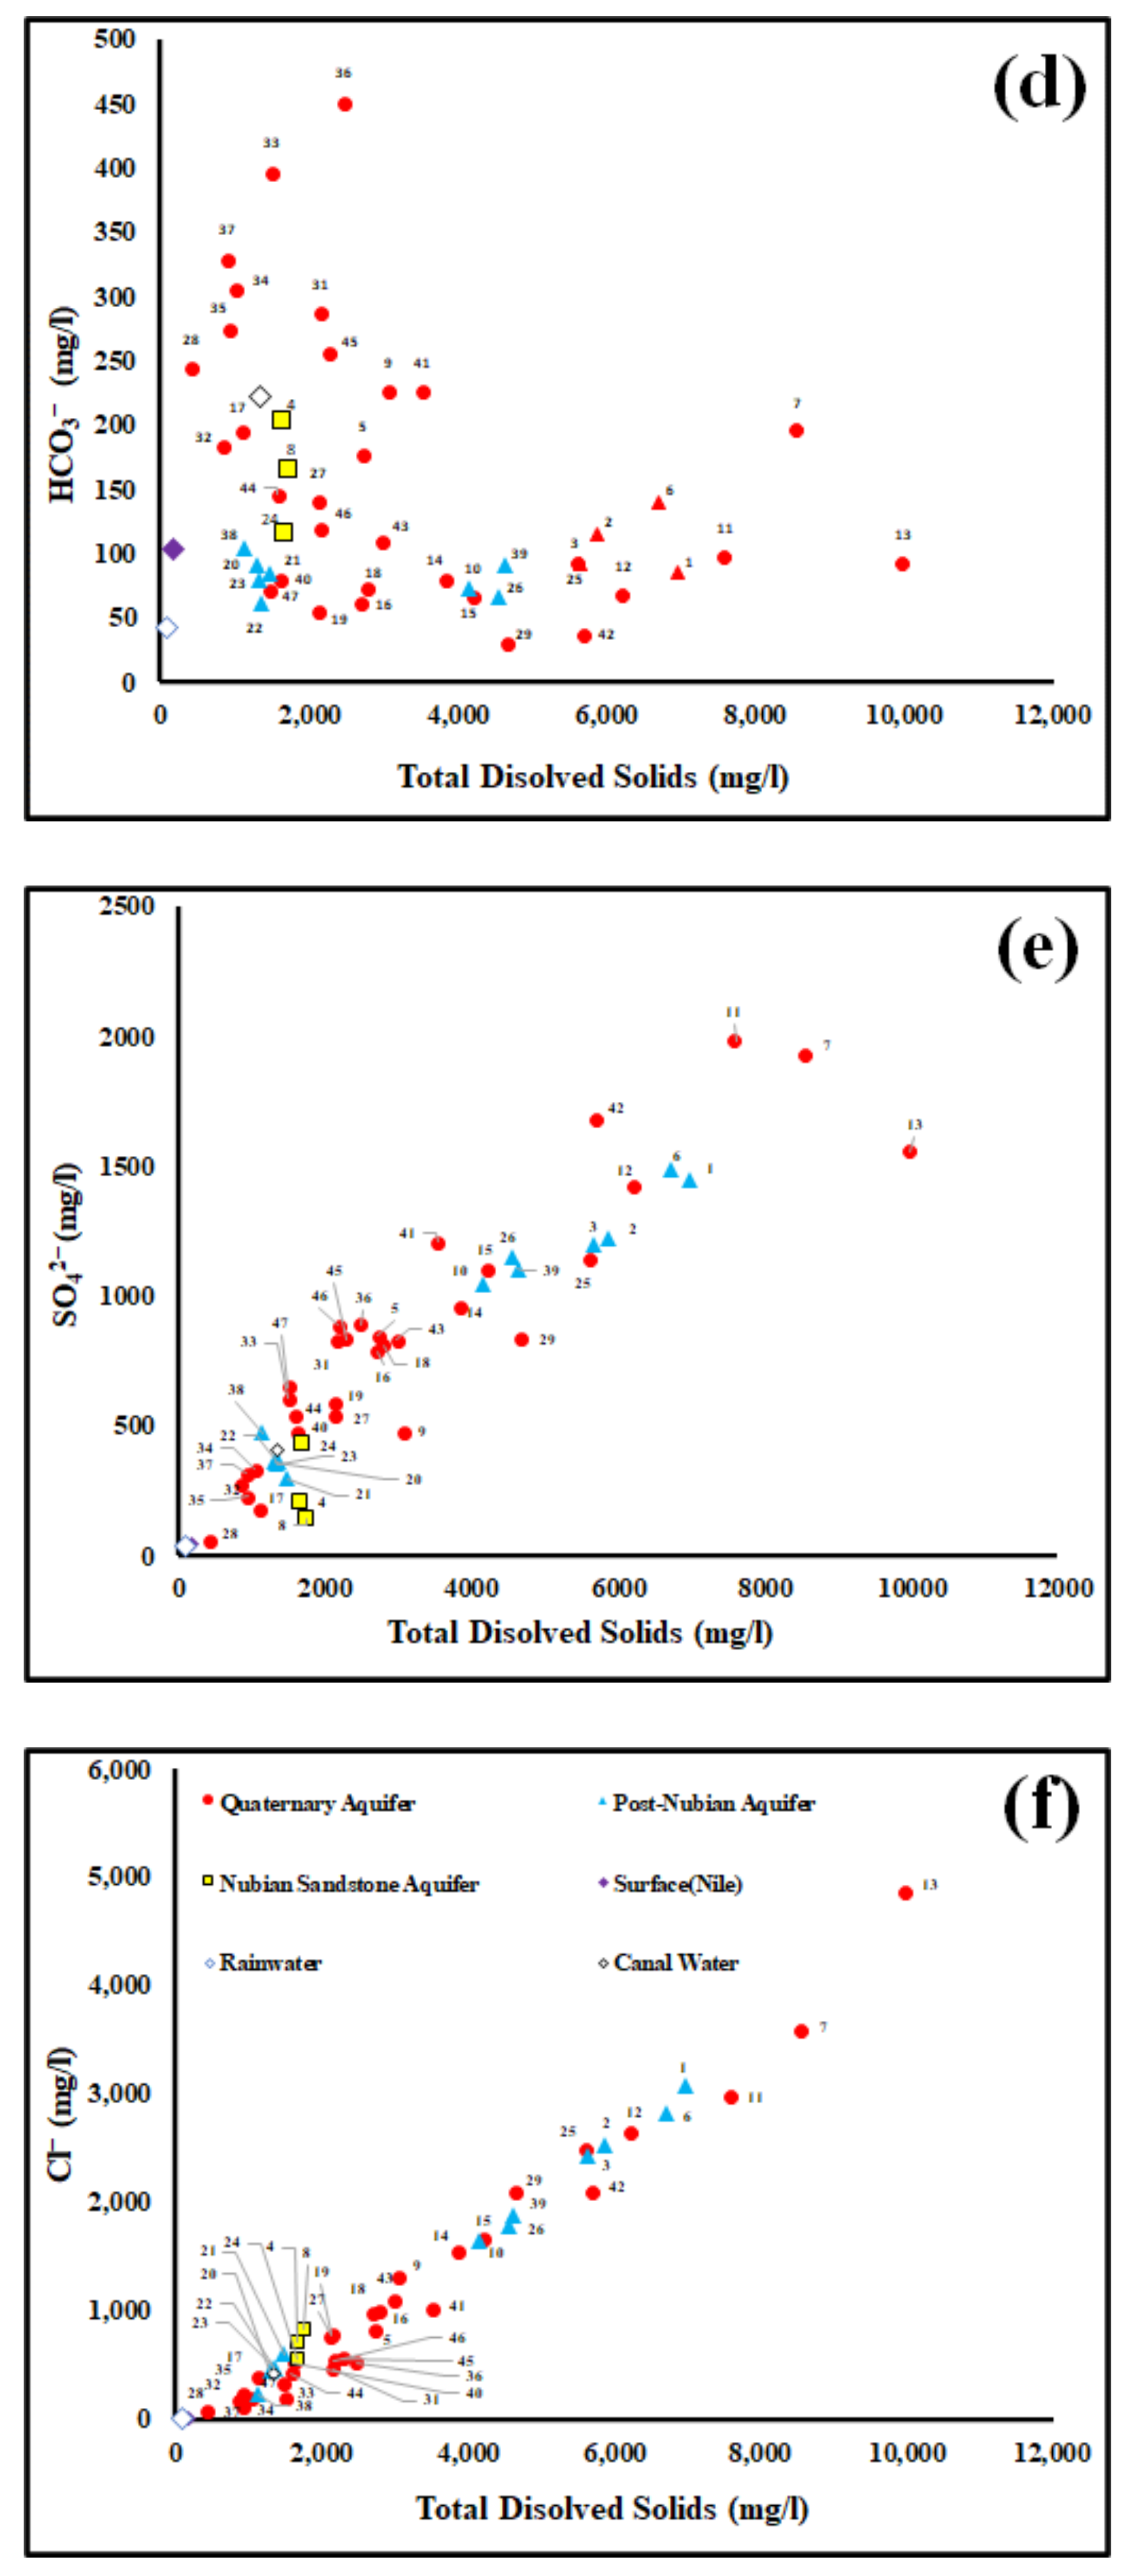
4.1. Groundwater Chemistry
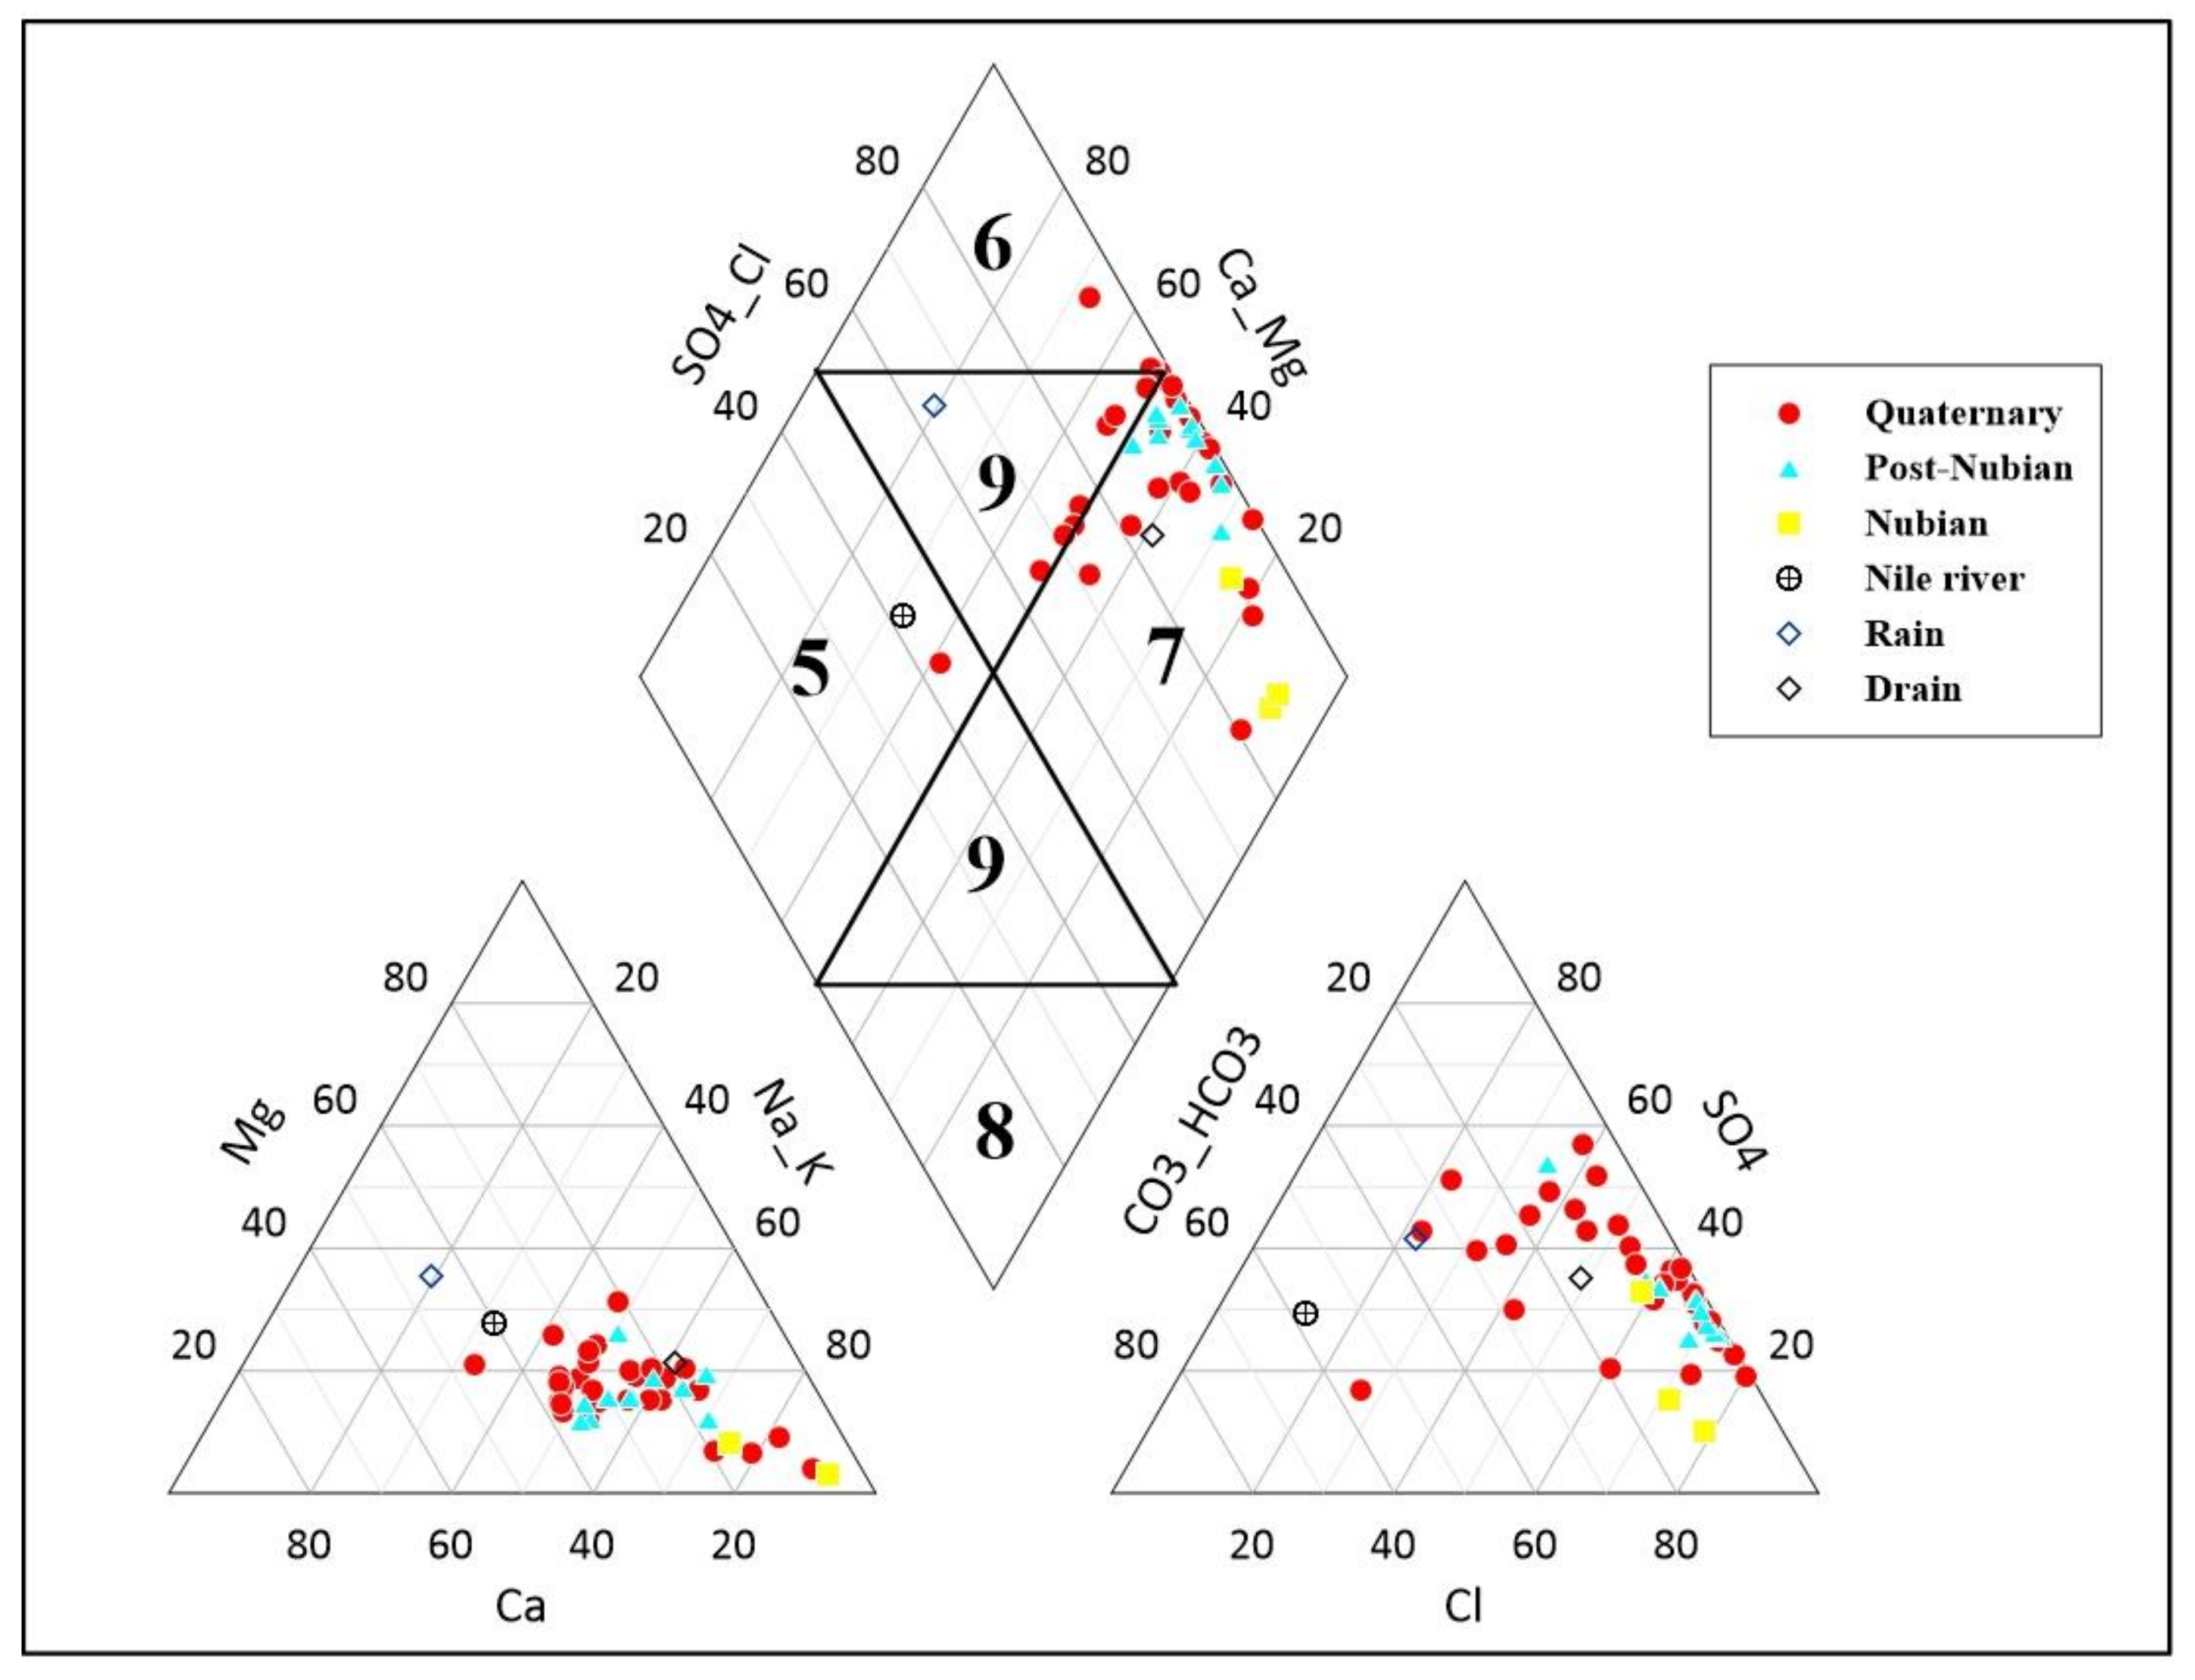
4.2. Chemical Water Types
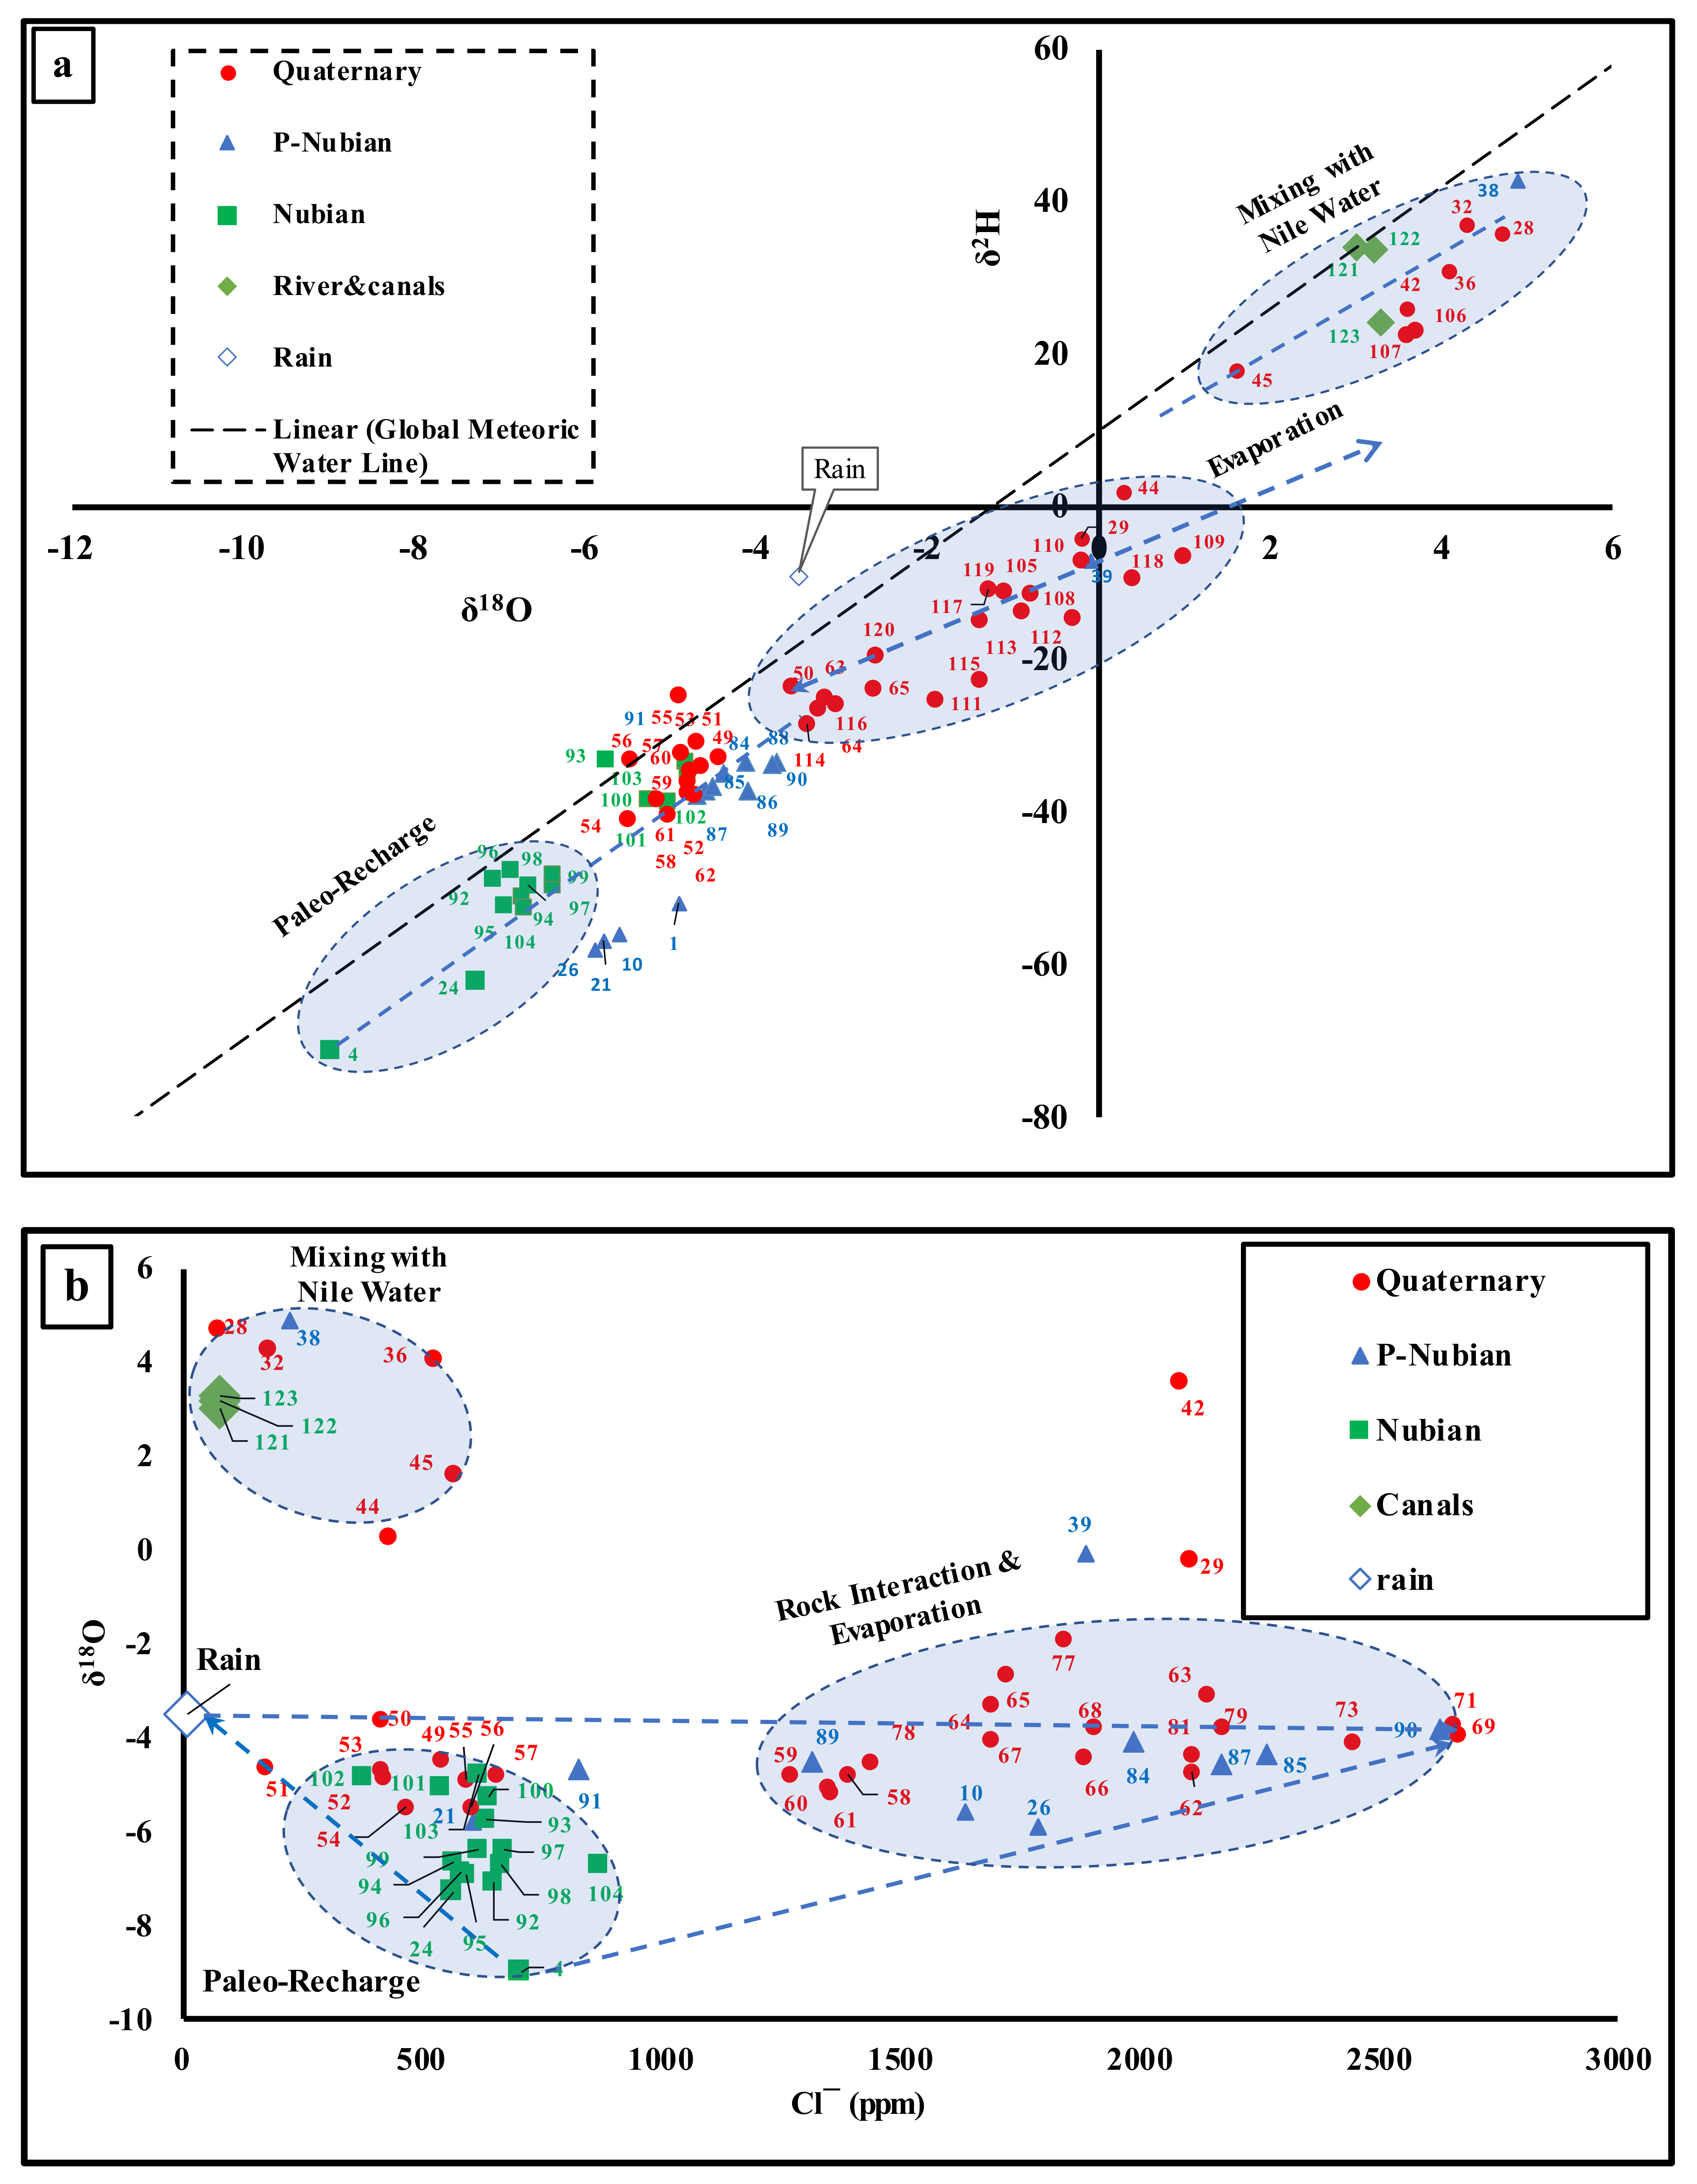
4.3. Environmental Isotopes
5. Discussion
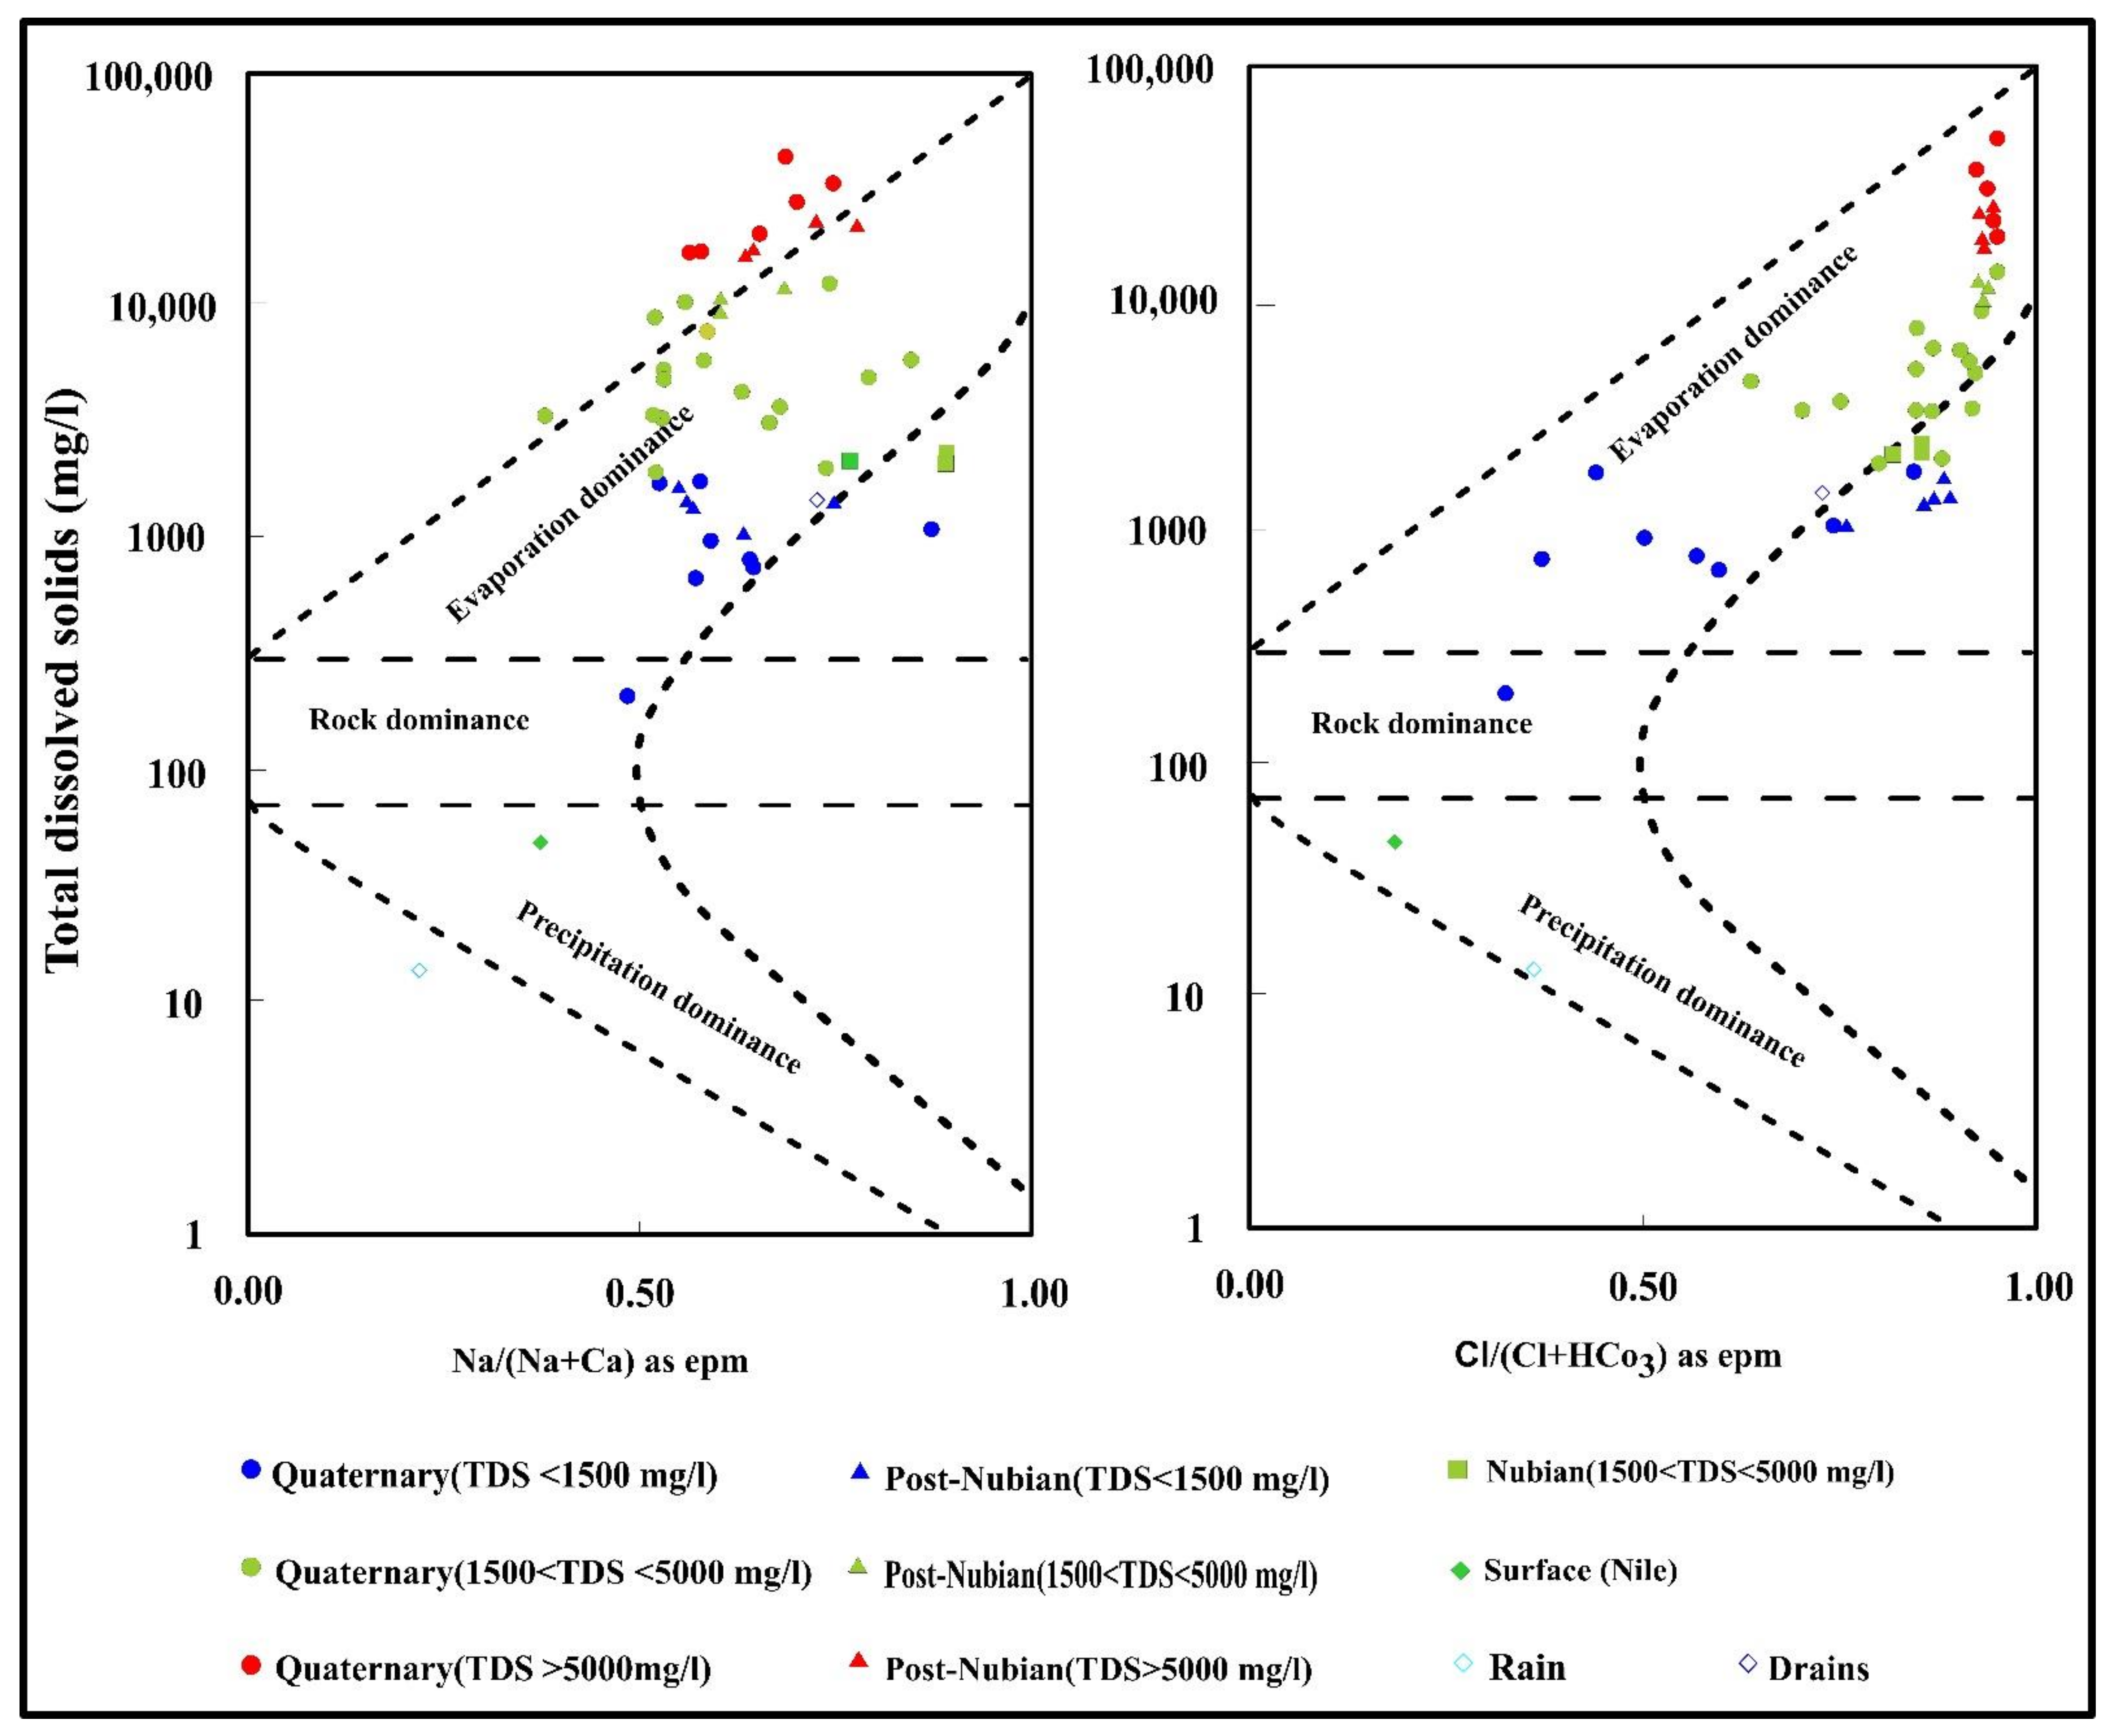
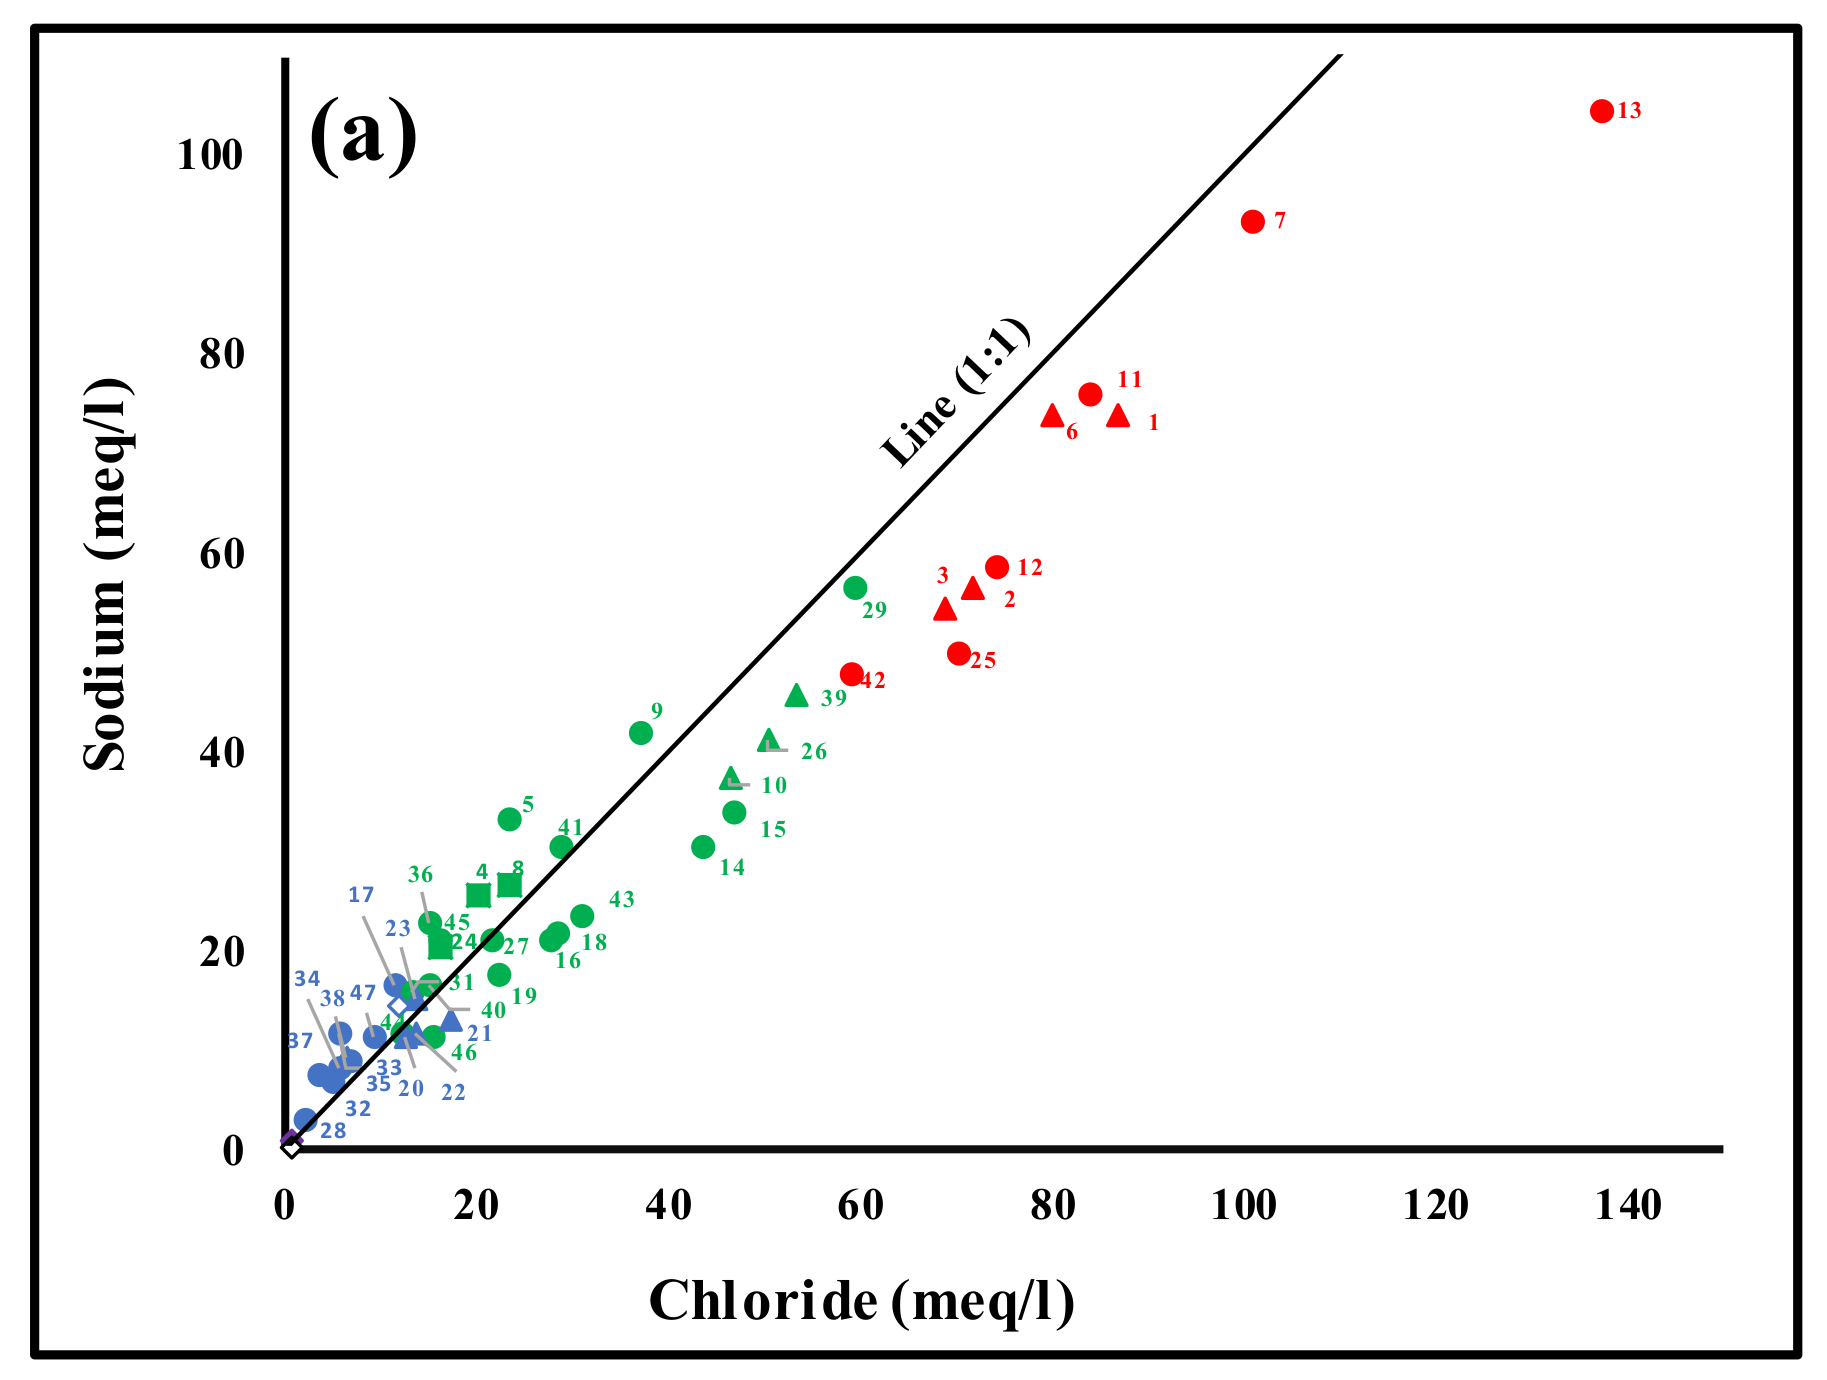
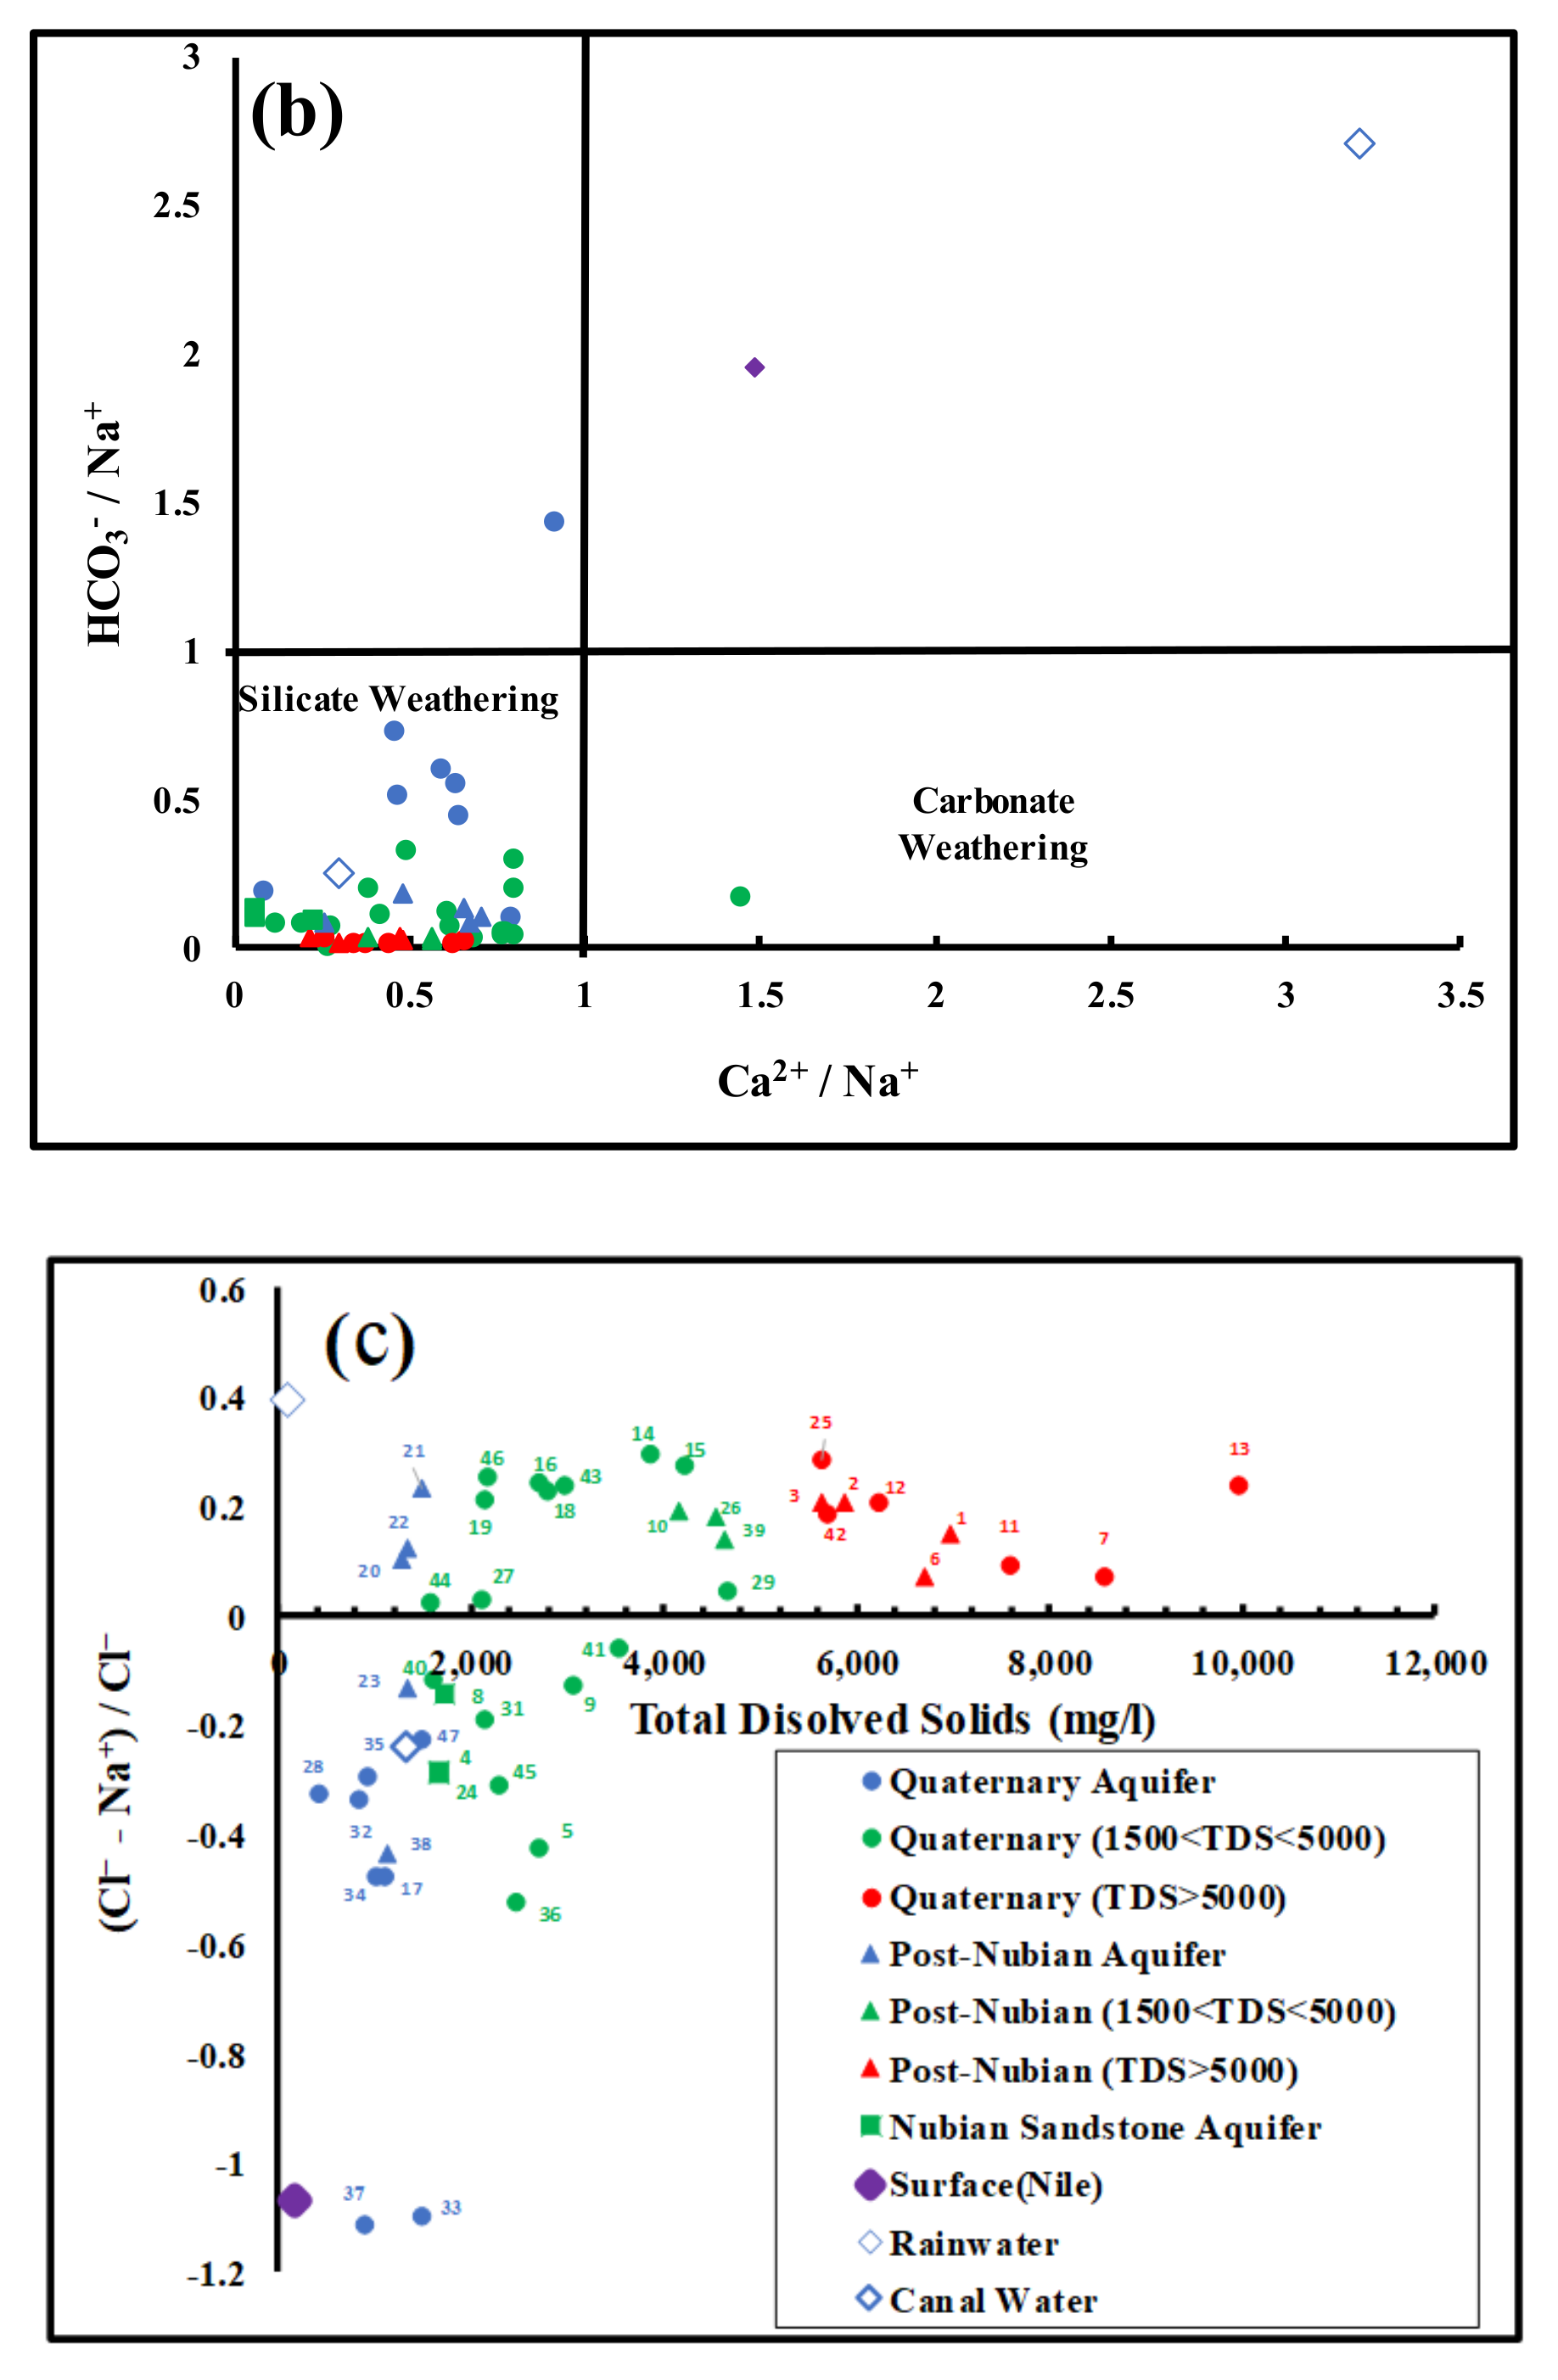
5.1. Geochemical Processes Affecting Groundwater
5.2. Groundwater Recharge Mechanism
5.3. Water–Rock Interaction and Mixing Model
6. Conclusions
Author Contributions
Funding
Institutional Review Board Statement
Informed Consent Statement
Data Availability Statement
Conflicts of Interest
References
- Said, R. The Geology of Egypt; Elsevier: Amesterdam, The Netherlands, 1962; p. 377. [Google Scholar]
- Abdel-Fattah, M.; Saber, M.; Kantoush, S.A.; Khalil, M.F.; Sumi, T.; Sefelnasr, A.M. A hydrological and geomorphometric approach to understanding the generation of wadi flash floods. Water 2017, 9, 553. [Google Scholar] [CrossRef] [Green Version]
- Milewski, A.; Sultan, M.; Yan, E.; Becker, R.; Abdeldayem, A.; Soliman, F.; Abdel Gelil, K. A remote sensing solution for estimating runoff and recharge in arid environments. J. Hydrol. 2009, 373, 1–14. [Google Scholar] [CrossRef]
- Moneim, A.A. Hydrogeological conditions and aquifers potentiality for sustainable development of the desert areas in Wadi Qena, Eastern Desert. Egypt. Arab. J. Geosci. 2014, 7, 4573–4591. [Google Scholar] [CrossRef]
- Aggour, T.A. Impact of Geomorphological and Geological Setting on Groundwater in Qena-Safaga District, Central Eastern Desert, Egypt. Ph.D. Thesis, Faculty of Science, Ain Shams University, Cairo, Egypt, 1997; p. 355. [Google Scholar]
- Moneim, A.A. Overview of the geomorphological and hydrogeological characteristics of the Eastern Desert of Egypt. Hydrogeol. J. 2005, 13, 416–425. [Google Scholar] [CrossRef]
- Negrel, P.; Lemiere, B.; de Grammont, H.M.; Billaud, P.; Sengupta, B. Hydrogeochemical processes, mixing and isotope tracing in hard rock aquifers and surface waters from the Subarnarekha River basin, (east Singhbhum District, Jharkhand state, India). Hydrogeol. J. 2007, 15, 1535–1552. [Google Scholar] [CrossRef]
- Londono, O.M.Q.; Martinez, D.E.; Dapena, C.; Massone, H. Hydrogeochemistry and isotope analyses used to determine groundwater recharge and flow in low-gradient catchments of the province of Buenos Aires, Argentina. Hydrogeol. J. 2008, 16, 1113–1127. [Google Scholar] [CrossRef]
- Wang, L.; Dong, Y.; Xu, Z.; Qiao, X. Hydrochemical and isotopic characteristics of groundwater in the north-eastern Tennger Desert, northern China. Hydrogeol. J. 2017, 25, 2363–2375. [Google Scholar] [CrossRef]
- Sami, K. Recharge mechanisms and geochemical processes in a semi-arid sedimentary basin, Eastern Cape, South Africa. J. Hydrol. 1992, 139, 27–48. [Google Scholar] [CrossRef]
- Schuh, W.M.; Klinkebiel, D.L.; Gardner, J.C.; Meyer, R.F. Tracer and Nitrate Movement to Groundwater in the Northern Great Plains. J. Environ. Qual. 1997, 26, 1335–1347. [Google Scholar] [CrossRef]
- Aghazadeh, N.; Mogaddam, A.A. Investigation of hydrochemical characteristics of groundwater in the Harzandat aquifer, Northwest of Iran. Environ. Monit. Assess. 2011, 176, 183–195. [Google Scholar] [CrossRef]
- Kuldip, S.; Hundal, H.S.; Dhanwinder, S. Geochemistry and assessment of hydrogeochemical processes in groundwater in the Southern part of Bathinda district of Punjab, northwest India. Environ. Earth Sci. 2011, 64, 1823–1833. [Google Scholar] [CrossRef]
- Cloutier, V.; Lefebvre, R.; Savard, M.M.; Bourque, E.; Therrien, R. Hydrogeochemistry and groundwater origin of the Basses– Laurentides sedimentary rock aquifer system, St. Lawrence Lowlands, Quebec, Canada. Hydrogeol. J. 2006, 14, 573–590. [Google Scholar] [CrossRef]
- Eissa, M.A.; Thomas, J.M.; Pohll, G.; Hershey, R.L.; Dahab, K.A.; Dawoud, M.I.; ElShiekh, A.; Gomaa, M.A. Groundwater resource sustainability in the Wadi Watir Delta, Gulf of Aqaba, Sinai, Egypt. Hydrogeol. J. 2013, 21, 1833–1851. [Google Scholar] [CrossRef]
- Eissa, M.A.; Shawky, H.; Samy, A.; Khalil, M.M.; El Malky, M. Geochemical and Isotopic Evidence of Groundwater Salinization Processes in El Dabaa Area, Northwestern Coast, Egypt. Geosciences 2018, 8, 392. [Google Scholar] [CrossRef] [Green Version]
- Eissa, M.; Ali, M.; Zaghlool, E.; Stash, O.S. Hydrochemical and stable isotopes indicators for detecting sources of groundwater contamination close to Bahr El-Baqar drain, eastern Nile Delta, Egypt. Water Sci. 2019, 33, 54–64. [Google Scholar] [CrossRef] [Green Version]
- Mook, W. Environmental isotopes in the hydrological cycle: Principles and applications. In Introduction: Theory, Methods; International Atomic Energy Agency (IAEA): Vienna, Austria, 2000. [Google Scholar]
- Subyani, A.M. Use of chloride-mass balance and environmental isotopes for evaluation of groundwater recharge in the alluvial aquifer, Wadi Tharad, western Saudi Arabia. Environ. Geol. 2004, 46, 741–749. [Google Scholar] [CrossRef]
- Lapworth, D.J.; MacDonald, A.M.; Tijani, M.N.; Darling, W.G.; Gooddy, D.C.; Bonsor, H.C.; Araguas-Araguas, L.J. Residence times of shallow groundwater in West Africa: Implications for hydrogeology and resilience to future changes in climate. Hydrogeol. J. 2013, 21, 673–686. [Google Scholar] [CrossRef] [Green Version]
- Wang, L. Sea lanes and Chinese national energy security. J. Coast. Res. 2015, 73, 572–576. [Google Scholar] [CrossRef]
- Wang, L.; Quant, R.; Kolios, A. Fluid structure interaction modelling of horizontal-axis wind turbine blades based on CFD and FEA. J. Wind. Eng. Ind. Aerodyn. 2016, 158, 11–25. [Google Scholar] [CrossRef] [Green Version]
- Moneim, A.A.; Seleem, E.M.; Zeid, S.A.; Samie, S.A.; Zaki, S.; El-Fotoh, A.A. Hydrogeochemical characteristics and age dating of groundwater in the Quaternary and Nubian aquifer systems in Wadi Qena, Eastern Desert, Egypt. Sustain. Water Resour. Manag. 2015, 1, 213–232. [Google Scholar]
- Hussien, M.H.; Kehew, A.E.; Aggour, T.A.; Korany, E.; Abotalib, Z.A.; Hassanein, A.; Morsy, S. An integrated approach for identification of potential aquifer zones in structurally controlled terrain: Wadi Qena basin, Egypt. Catena 2017, 149, 73–85. [Google Scholar] [CrossRef]
- Hussien, M.H. Development of The Water Resources In Wadi Qena Basin, Eastern Desert, Egypt. Ph.D. Thesis, Faculty of Science Ain Shams University, Cairo, Egypt, 2017. [Google Scholar]
- Issawi, B.; Jux, U. Contributions to the stratigraphy of the paleozoic rocks in Egypt. Egypt. Geol. Surv. 1982, 62, 28. [Google Scholar]
- Soliman, M.A.; Habib, M.F.; Ahmed, E.A. Sedimentologic and tectonic evolution of the Upper Cretaceous-Lower Tertiary succession at Wadi Qena, Egypt. Sediment. Geol. 1986, 46, 111–133. [Google Scholar] [CrossRef]
- Said, R. The Geology of Egypt; Balkema/Rotterdam/Brookfield: Amsterdam, The Netherlands, 1990; p. 734. [Google Scholar]
- El Basely, M.I. Quaternary Geology of Some Selected Drainage Basins in Upper Egypt (Qena-Idfu Area). Ph.D. Thesis, Cairo University, Cairo, Egypt, 1994; p. 242. [Google Scholar]
- Hendriks, F.; Kallenbach, H.; Philobbos, E.R. Cretaceous to Early Tertiary Continental and marginal marine sedimentary environments of southeastern Egypt. J. Afr. Earth Sci. 1990, 10, 229–241. [Google Scholar] [CrossRef]
- Nagm, E.; Wilmsen, M. Studied Late Cenomanian–Turonian (Cretaceous) ammonites from Wadi Qena, central Eastern Desert, Egypt: Taxonomy, bio- stratigraphy and palaeobiogeographic implications. Acta Geol. Pol. 2012, 62, 63–89. [Google Scholar]
- El-Gaby, S.; List, F.K.; Tehrani, R. Geology, evolution and metallogenesis of the Pan-African belt in Egypt. In The Pan-African Belt of Northeast Africa and Adjacent Areas: Tectonic Evolution and Economic Aspects of a Late Proterozoic Oregon; F. Vieweg: Berlin, Germany, 1988; pp. 17–68. [Google Scholar]
- Sultan, M.; Arvidson, R.E.; Duncan, I.J.; Stern, R.J.; El Kaliouby, B. Extension of the Najd shear system from Saudi Arabia to the Central Eastern Desert of Egypt based on integrated field and Landsat observations. Tectonics 1988, 7, 1291–1306. [Google Scholar] [CrossRef] [Green Version]
- Akawy, A. Structural geomorphology and neotectonics of the Qina-Safaja district, Egypt. Neues Jahrb. Geol. Paläontologie-Abh. 2002, 226, 95–130. [Google Scholar] [CrossRef]
- Akawy, A.; El-Din, K.G. Middle Eocene to recent tectonics in the Qina area, Upper Egypt. Neues Jahrb. Geol. Paläontologie-Abh. 2006, 240, 19–51. [Google Scholar] [CrossRef]
- CONOCO. Geological Map of Egypt, Scale 1: 500,000, Assiut and Beni Suef; The Egyptian General Petroleum Corporation (EGPC): Cairo, Egypt, 1987. [Google Scholar]
- General Authority for Rehabilitation Projects and Agricultural Development (GARPAD). Wadi El Matulli, Hydrogeological studies. Catena 2017, 149, 73–85. (In Arabic) [Google Scholar]
- Research Institute of Groundwater (RIGW). Hydrogeological map of Wadi Qena; RIGW: Cairo, Egypt, 1998.
- ASTM (American Society for Testing and Materials). Annual Book of ASTM Standards; ASTM: Baltimore, MD, USA, 2002; Volume 11, 939p.
- Richards, I.A. Diagnosis and Improvement of Saline and Alkali Soils, Handbook No. 60; United States Department of Agriculture (USDA): Washington, DC, USA, 1954; p. 160.
- Plummer, L.N.; Prestemon, E.C.; Parkhurst, D.L. An interactive code (NETPATH) for modeling net geochemical reactions along a flow path, version 2.0. Water-Resour. Investig. Rep. 1994, 94, 4169. [Google Scholar]
- Yousif, M.; Oguchi, T.; Anazawa, K.; Ohba, T. Geospatial Information and Environmental Isotopes for Hydrogeological Evaluation: Ras Alam El Rum, Northwestern Coast of Egypt. Nat. Resour. Res. 2014, 23, 423–445. [Google Scholar] [CrossRef]
- Bloomfield, J.P.; Jackson, C.R.; Stuart, M.E. Changes in groundwater levels, temperature and quality in the UK over the 20th century: An assessment of evidence of impacts from climate change. In A Climate Change Report Card for Water Working Technical Paper; British Geological Survey, Kingsley Dunham Centre: Keyworth, UK, 2013; p. 14. [Google Scholar]
- Drever, J. The Geochemistry of Natural Water, Surface and Ground Water Environments, 3rd ed.; Prentice Hall: Hoboken, NJ, USA, 1997; p. 436. [Google Scholar]
- Chebotarev, I.I. Metamorphism of natural waters in the crust of weathering. Geochim. Cosmochim. Acta 1955, 8, 137–170 & 198–212. [Google Scholar] [CrossRef]
- Piper, A.M. A graphic procedure in the geochemical interpretation of water analysis. Eos Trans. Am. Geophys. 1944, 25, 914–928. [Google Scholar] [CrossRef]
- Hem, J.D. Study and Interpretation of the Chemical Characteristics of Natural Water; Department of the Interior, US Geological Survey: St. Alexandria, VA, USA, 1985; p. 2254.
- Mohallel, S.A. Applications of Hydrogeochemical Modeling to Evaluate Water Resources in the Area between Edfu and Aswan, Eastern Desert, Egypt. Ph.D. Thesis, Faculty of Science (Boys) Al-Azhar University, Cairo, Egypt, 2013. [Google Scholar]
- Dansgaard, W. Stable Isotopes in Precipitation; Wiley: Hoboken, NJ, USA, 1964; Volume 16, pp. 436–468. [Google Scholar]
- Clark, I.; Fritz, P. Nitrogen cycling in rural watershed. In Environmental Isotopes in Hydrogeology; CRC Press: Boca Raton, FL, USA, 1997; pp. 148–151. [Google Scholar]
- Mohammed, A.M.; Krishnamurthy, R.V.; Kehew, A.E.; Crossey, L.J.; Karlstrom, K.K. Factors affecting the stable isotopes ratios in groundwater impacted by intense agricultural practices: A case study from the Nile Valley of Egypt. Sci. Total Environ. 2016, 15, 707–715. [Google Scholar] [CrossRef] [PubMed]
- Craig, H. Isotopic variations in meteoric waters. Science 1961, 133, 1702–1703. [Google Scholar] [CrossRef] [PubMed]
- Gibbs, R.J. Mechanisms controlling world’s water chemistry. Science 1970, 170, 1088–1090. [Google Scholar] [CrossRef] [PubMed]
- Sukhija, B.S.; Varma, V.N.; Nagabhushanam, P.; Reddy, D.V. Differentiation of palaeomarine and modern seawater intruded salinities in coastal groundwaters (of Karaikal and Tanjavur, India) based on inorganic chemistry, organic biomarker fingerprints and radiocarbon dating. J. Hydrol. 1996, 174, 173–201. [Google Scholar] [CrossRef]
- Vengosh, A.; Spivack, A.J.; Artzi, Y.; Ayalon, A. Geochemical and boron, strontium, and oxygen isotopic constraints on the origin of the salinity in groundwater from the Mediterranean coast of Israel. Water Resour. Res. 1999, 35, 1877–1894. [Google Scholar] [CrossRef]
- El Moujabber, M.; Samra, B.B.; Darwish, T.; Atallah, T. Comparison of different indicators for groundwater contamination by seawater intrusion on the Lebanese coast. Water Resour. Manag. 2006, 20, 161–180. [Google Scholar] [CrossRef]
- Kouzana, L.; Mammou, A.B.; Felfoul, M.S. Seawater intrusion and associated processes: Case of the Korba aquifer (Cap-Bon, Tunisia). Comptes Rendus Geosci. 2009, 341, 21–35. [Google Scholar] [CrossRef]
- Mayback, M. Global chemical weathering of surficial rocks estimated from river dissolved loads. Am. J. Sci. 1987, 287, 401–428. [Google Scholar] [CrossRef]
- Hershey, R.L.; Heilweil, V.M.; Gardner, P.; Lyles, B.F.; Earman, S.; Thomas, J.M.; Lundmark, K.W. Ground-Water Chemistry Interpretations Supporting the Basin and Range Regional Carbonate-Rock Aquifer System (BARCAS) Study, Eastern Nevada and Western Utah; Desert Research Institute: Reno, NV, USA, 2007; p. 86. [Google Scholar]
- Back, W.; Hanshaw, B.B.; Plummer, L.N.; Rahn, P.H.; Rightmire, C.T.; Rubin, M. Process and rate of dedolomitization: Mass transfer and 14C dating in a regional carbonate aquifer. Geol. Soc. Am. Bull. 1983, 94, 1415–1429. [Google Scholar] [CrossRef]


| No. | Aquifer | pH | DTW (m) | TD (m) | Temp (°C) | DO | TDS | Ca | Mg | Na | K | CO3 | HCO3 | SO4 | Cl | Si | NO3 |
|---|---|---|---|---|---|---|---|---|---|---|---|---|---|---|---|---|---|
| mg/L | |||||||||||||||||
| 5 | Quaternary | 6.8 | 2.5 | 4 | 24.1 | 2.85 | 2716 | 123 | 35 | 760 | 36 | 0 | 177 | 850 | 824 | 12.5 | 9.80 |
| 7 | Quaternary | 7.2 | 3 | 4 | 25 | 2.13 | 8564 | 478 | 290 | 2150 | 47 | 0 | 195 | 1926 | 3574 | 9.8 | 12.60 |
| 9 | Quaternary | 7.8 | 3 | 6 | 22.6 | 3.24 | 3059 | 96 | 58 | 960 | 24 | 18 | 226 | 475 | 1316 | 11.2 | 11.20 |
| 11 | Quaternary | 7.4 | 4 | 5 | 24.5 | 3.4 | 7593 | 517 | 290 | 1750 | 23 | 0 | 98 | 1985 | 2979 | 15.6 | 14.00 |
| 12 | Quaternary | 7.6 | -- | -- | 25.7 | 3.14 | 6226 | 517 | 242 | 1350 | 23 | 6 | 67 | 1423 | 2631 | 8.2 | 12.60 |
| 13 | Quaternary | 7.1 | 5 | 6.5 | 27.5 | 2.4 | 9976 | 776 | 315 | 2400 | 22 | 0 | 92 | 1556 | 4862 | 15.3 | 12.60 |
| 14 | Quaternary | 7.1 | 4 | 6 | 27.5 | 2.45 | 3849 | 484 | 116 | 700 | 11 | 0 | 79 | 960 | 1539 | 16.1 | 9.80 |
| 15 | Quaternary | 7.2 | 5.5 | 7 | 28.9 | 3.17 | 4214 | 458 | 162 | 780 | 14 | 0 | 67 | 1105 | 1662 | 12.4 | 7.00 |
| 16 | Quaternary | 7.2 | -- | -- | 28 | 3.17 | 2703 | 319 | 92 | 480 | 9 | 0 | 61 | 790 | 983 | 8.5 | 4.20 |
| 17 | Quaternary | 7.8 | 20 | -- | 32.3 | 0.45 | 1111 | 26 | 9 | 380 | 9 | 12 | 195 | 180 | 397 | 6.7 | 5.60 |
| 18 | Quaternary | 7.4 | -- | -- | 26 | 2.9 | 2790 | 331 | 100 | 500 | 9 | 0 | 73 | 811 | 1003 | 9.3 | 8.40 |
| 19 | Quaternary | 7.3 | -- | -- | 30.5 | 2.79 | 2138 | 269 | 58 | 400 | 8 | 0 | 55 | 591 | 784 | 11.1 | 9.80 |
| 25 | Quaternary | 7.1 | 6 | 8 | 27.3 | 2.45 | 5631 | 657 | 140 | 1150 | 15 | 0 | 92 | 1141 | 2482 | 15.8 | 12.60 |
| 27 | Quaternary | 7.5 | 6 | 28 | 21 | 2.9 | 2117 | 172 | 64 | 480 | 14 | 12 | 140 | 541 | 765 | 9.1 | 9.80 |
| 28 | Quaternary | 7.6 | -- | -- | 21 | 1.2 | 427 | 51 | 24 | 64 | 16 | 12 | 244 | 63 | 74 | 14.1 | 11.20 |
| 29 | Quaternary | 7.1 | 17.5 | -- | 27.1 | 0.9 | 4650 | 299 | 66 | 1300 | 31 | 0 | 31 | 835 | 2104 | 6.3 | 9.80 |
| 31 | Quaternary | 7 | 3 | 6 | 25.2 | 1 | 2148 | 249 | 82 | 360 | 17 | 0 | 287 | 830 | 467 | 25.8 | 12.60 |
| 32 | Quaternary | 7.3 | 6 | 7 | 24.4 | 1.59 | 849 | 86 | 39 | 155 | 9 | 12 | 183 | 278 | 179 | 16.5 | 19.60 |
| 33 | Quaternary | 7.2 | 1.9 | -- | 22.4 | 2.9 | 1492 | 147 | 63 | 270 | 9 | 0 | 397 | 606 | 199 | 23.3 | 8.40 |
| 34 | Quaternary | 7.2 | 3.6 | -- | 26 | 1.5 | 1030 | 97 | 52 | 190 | 8 | 0 | 305 | 333 | 199 | 21.8 | 7.00 |
| 35 | Quaternary | 7.2 | -- | -- | 25.2 | 1.59 | 933 | 80 | 39 | 200 | 7 | 0 | 275 | 230 | 238 | 19.3 | 4.20 |
| 36 | Quaternary | 7 | -- | -- | 26.5 | 1.9 | 2473 | 221 | 75 | 520 | 14 | 0 | 451 | 892 | 526 | 26.7 | 7.00 |
| 37 | Quaternary | 7.1 | -- | -- | 25.5 | 1.53 | 914 | 67 | 60 | 170 | 9 | 0 | 329 | 320 | 124 | 23.8 | 4.20 |
| 40 | Quaternary | 8.3 | -- | -- | 4.4 | 1607 | 90 | 66 | 380 | 8 | 18 | 79 | 479 | 526 | 18.9 | 0.00 | |
| 41 | Quaternary | 7.3 | -- | -- | 25.6 | 2.6 | 3523 | 367 | 104 | 700 | 14 | 0 | 226 | 1208 | 1018 | 30.3 | 5.60 |
| 42 | Quaternary | 8.6 | -- | -- | -- | 7.8 | 5705 | 598 | 194 | 1100 | 21 | 12 | 37 | 1678 | 2085 | 15.4 | 19.60 |
| 43 | Quaternary | 7.9 | -- | -- | -- | 4.13 | 2978 | 289 | 140 | 540 | 13 | 18 | 110 | 830 | 1092 | 20.8 | 0.00 |
| 44 | Quaternary | 8.1 | -- | -- | -- | 4.4 | 1586 | 188 | 58 | 270 | 12 | 18 | 146 | 540 | 427 | 6.3 | 2.80 |
| 45 | Quaternary | 7.3 | -- | -- | 25.1 | 2.6 | 2280 | 159 | 92 | 480 | 21 | 0 | 256 | 834 | 566 | 8.4 | 12.60 |
| 46 | Quaternary | 7.1 | -- | -- | -- | -- | 2170 | 326 | 90 | 260 | 7 | 0 | 120 | 888 | 539 | 9.3 | |
| 47 | Quaternary | 7.3 | 1485 | 175 | 42 | 256 | 5 | 0 | 72 | 650 | 322 | 10.3 | |||||
| 1 | P-Nubian | 7.1 | 76 | -- | 25 | 3.54 | 6969 | 438 | 242 | 1700 | 18 | 0 | 85 | 1450 | 3078 | 14.7 | 8.40 |
| 2 | P-Nubian | 7.1 | 30 | 72 | 24.2 | 1.91 | 5871 | 528 | 194 | 1300 | 31 | 0 | 116 | 1227 | 2534 | 12.5 | 33.60 |
| 3 | P-Nubian | 7.1 | 70 | 125 | 30.1 | 1.8 | 5649 | 518 | 179 | 1250 | 23 | 0 | 92 | 1200 | 2433 | 12.2 | 12.60 |
| 6 | P-Nubian | 7.2 | 51 | 95 | 29.1 | 1.82 | 6707 | 319 | 266 | 1700 | 29 | 0 | 140 | 1490 | 2833 | 11.3 | 11.20 |
| 10 | P-Nubian | 7.2 | 40 | 110 | 29.7 | 3.31 | 4152 | 418 | 133 | 860 | 15 | 0 | 73 | 1051 | 1638 | 13.6 | 5.60 |
| 20 | P-Nubian | 7.2 | 48 | 160 | 29.9 | 1.3 | 1299 | 147 | 31 | 260 | 7 | 0 | 92 | 361 | 447 | 12.9 | 9.80 |
| 21 | P-Nubian | 7.1 | 50 | 200 | 24.2 | 3.1 | 1478 | 183 | 36 | 300 | 10 | 0 | 85 | 300 | 606 | 9.8 | 8.40 |
| 22 | P-Nubian | 8 | 60 | 170 | 22.9 | 3.9 | 1353 | 157 | 41 | 270 | 10 | 6 | 61 | 361 | 477 | 11.4 | 4.20 |
| 23 | P-Nubian | 6.7 | 28 | 115 | 28.1 | 1.59 | 1339 | 78 | 32 | 350 | 7 | 0 | 79 | 356 | 477 | 7.9 | 5.60 |
| 26 | P-Nubian | 7.4 | 35 | 75 | -- | 2.83 | 4546 | 462 | 145 | 950 | 17 | 0 | 67 | 1151 | 1787 | 11.5 | 4.20 |
| 38 | P-Nubian | 8.1 | 47 | 90 | -- | -- | 1134 | 88 | 59 | 210 | 13 | 12 | 104 | 475 | 226 | 15.7 | 2.80 |
| 39 | P-Nubian | 7.6 | 40 | 70 | 26.8 | 3 | 4624 | 345 | 175 | 1050 | 16 | 0 | 92 | 1106 | 1887 | 15.5 | 16.80 |
| 4 | Nubian | 7.6 | Flowing | 800 | 44.4 | 0 | 1663 | 30 | 10 | 590 | 8 | 12 | 203 | 206 | 706 | 9.6 | 8.40 |
| 8 | Nubian | 8.2 | Flowing | 650 | 35.6 | 0 | 1737 | 31 | 11 | 610 | 19 | 18 | 165 | 141 | 826 | 9.5 | 8.40 |
| 24 | Nubian | 7.9 | 2 | 620 | 40 | 3 | 1676 | 92 | 27 | 470 | 21 | 12 | 116 | 430 | 566 | 9.0 | 7.00 |
| 30 | Surface (Nile) | 7.9 | 5 | 21.5 | 2.7 | 182 | 26 | 11 | 20 | 7 | 6 | 104 | 46 | 15 | 4.1 | 5.60 | |
| 48 | Canal Water | 8 | -- | -- | -- | -- | 1350 | 87 | 62 | 335 | 4 | 5 | 223 | 406 | 417 | 6.3 | -- |
| No. | Aquifer | Cl | δ18O | δ2H | No. | Aquifer | Cl | δ18O | δ2H | No. | Aquifer | Cl | δ18O | δ2H |
|---|---|---|---|---|---|---|---|---|---|---|---|---|---|---|
| ppm | (‰) | ppm | (‰) | (‰) | ppm | (‰) | ||||||||
| 28 * | Quaternary | 74 | 4.7 | 36 | 64 | Quaternary | 1692 | −3.27 | −26.36 | 94 | Nubian | 566 | −6.66 | −49.59 |
| 29 * | Quaternary | 2104 | −0.2 | −4 | 65 | Quaternary | 1719 | −2.64 | −23.86 | 95 | Nubian | 590 | −6.95 | −52.33 |
| 32 * | Quaternary | 179 | 4.3 | 37 | 66 | Quaternary | 1859 | −4.44 | −34.81 | 96 | Nubian | 580 | −6.87 | −47.65 |
| 36 * | Quaternary | 526 | 4.1 | 31 | 67 | Quaternary | 1689 | −4.04 | −34.74 | 97 | Nubian | 669 | −6.39 | −49.74 |
| 42 * | Quaternary | 2085 | 3.6 | 26 | 68 | Quaternary | 1902 | −3.79 | −34.19 | 98 | Nubian | 665 | −6.74 | −50.92 |
| 44 * | Quaternary | 427 | 0.3 | 2 | 69 | Quaternary | 2667 | −3.92 | −33.36 | 99 | Nubian | 617 | −6.39 | −48.21 |
| 45 * | Quaternary | 566 | 1.6 | 18 | 70 | Quaternary | 3407 | −2.73 | −29.55 | 100 | Nubian | 640 | −5.26 | −38.17 |
| 1 * | P-Nubian | 3078 | −4.9 | −52 | 71 | Quaternary | 2654 | −3.72 | −32.79 | 101 | Nubian | 541 | −5.05 | −38.54 |
| 10 * | P-Nubian | 1638 | −5.6 | −56 | 72 | Quaternary | 8783 | −2.06 | −27.52 | 102 | Nubian | 377 | −4.82 | −33.28 |
| 21 * | P-Nubian | 606 | −5.8 | −57 | 73 | Quaternary | 2445 | −4.08 | −33.49 | 103 | Nubian | 621 | −4.81 | −35.24 |
| 26 * | P-Nubian | 1787 | −5.9 | −58 | 74 | Quaternary | 5355 | −0.58 | −19.59 | 104 | Nubian | 869 | −6.72 | −52.46 |
| 38 * | P-Nubian | 226 | 4.9 | 43 | 75 | Quaternary | 4845 | −3.43 | −32.88 | 105 | Quaternary | 655 | −0.8 | −11.2 |
| 39 * | P-Nubian | 1887 | −0.1 | −7 | 76 | Quaternary | 4095 | −3.04 | −30.07 | 106 | Quaternary | 50 | 3.7 | 23.3 |
| 4 * | Nubian | 706 | −9 | −71 | 77 | Quaternary | 1844 | −1.89 | −30.24 | 107 | Quaternary | 46 | 3.6 | 22.5 |
| 24 * | Nubian | 566 | −7.3 | −62 | 78 | Quaternary | 1437 | −4.55 | −38.68 | 108 | Quaternary | 822 | −0.3 | −14.4 |
| 49 | Quaternary | 541 | −4.45 | −32.73 | 79 | Quaternary | 2173 | −3.8 | −32.61 | 109 | Quaternary | 1287 | 1 | −6.5 |
| 50 | Quaternary | 412 | −3.6 | −23.5 | 80 | Quaternary | 3132 | −4.02 | −34.55 | 110 | Quaternary | 851 | −0.2 | −6.9 |
| 51 | Quaternary | 173 | −4.64 | −33.85 | 81 | Quaternary | 2109 | −4.34 | −35.97 | 111 | Quaternary | 1158 | −1.9 | −25.3 |
| 52 | Quaternary | 420 | −4.87 | −32.34 | 82 | Quaternary | 3481 | −4.26 | −37.78 | 112 | Quaternary | 1280 | −0.9 | −13.7 |
| 53 | Quaternary | 413 | −4.69 | −30.87 | 83 | Quaternary | 3807 | −1.4 | −25.22 | 113 | Quaternary | 2580 | −1.4 | −14.8 |
| 54 | Quaternary | 464 | −5.51 | −40.87 | 84 | P-Nubian | 1988 | −4.12 | −33.34 | 114 | Quaternary | 601 | −3.4 | −28.4 |
| 55 | Quaternary | 592 | −4.9 | −24.78 | 85 | P-Nubian | 2269 | −4.38 | −34.82 | 115 | Quaternary | 531 | −1.4 | −22.5 |
| 56 | Quaternary | 605 | −5.48 | −33.15 | 86 | P-Nubian | 3279 | −4.11 | −37.11 | 116 | Quaternary | 1230 | −3.2 | −25.1 |
| 57 | Quaternary | 654 | −4.79 | −34.46 | 87 | P-Nubian | 2175 | −4.6 | −37.22 | 117 | Quaternary | 385 | −1.3 | −10.8 |
| 58 | Quaternary | 1390 | −4.81 | −37.3 | 88 | P-Nubian | 5323 | −3.78 | −33.37 | 118 | Quaternary | 525 | 0.4 | −9.2 |
| 59 | Quaternary | 1268 | −4.81 | −35.95 | 89 | P-Nubian | 1318 | −4.51 | −36.67 | 119 | Quaternary | 1300 | −1.1 | −11.1 |
| 60 | Quaternary | 1355 | −5.16 | −38.27 | 90 | P-Nubian | 2632 | −3.81 | −33.7 | 120 | Quaternary | 616 | −2.6 | −19.5 |
| 61 | Quaternary | 1348 | −5.05 | −40.28 | 91 | P-Nubian | 826 | −4.69 | −37.72 | 121 | Canal Water | 80 | 3 | 34.1 |
| 62 | Quaternary | 2110 | −4.72 | −37.63 | 92 | Nubian | 648 | −7.07 | −48.67 | 122 | Canal Water | 80 | 3.2 | 34 |
| 63 | Quaternary | 2142 | −3.08 | −25.89 | 93 | Nubian | 636 | −5.77 | −33.22 | 123 | Canal Water | 80 | 3.3 | 24.3 |
| Constraints | Phases | Processes |
|---|---|---|
| Calcium, Carbon, Magnesium, Potassium, Sodium, Sulfur, Chloride, Silica | Albite, Alunite, Calcite, Chlorite, (±) Dolomite, (−) Ca-Montmorillonite, K-Mica, Illite, Gypsum, Sio2, (+) Halite NaCl, (−) Anorthite, (±) Exchange | Reaction and/or Evaporation and Mixing |
| Model | Aquifer | Initial Water-1 | Initial Water-2 | Final Water | Mixing Percent | Phases Precipitated or Dissolved | ||||||||||||||
|---|---|---|---|---|---|---|---|---|---|---|---|---|---|---|---|---|---|---|---|---|
| Initial Water-1 | Initial Water-2 | Cal | Dol | Gyp | Hal | Si | Ilt | Chrt | Mont | Albt | An | Mic | Alun | Ex | Ev | |||||
| Reaction Models | Quaternary aquifer (Upstream) | 54 | None | 55 | -- | -- | 2.41 | −1.89 | 0.31 | 4.85 | 6.66 | -- | 0.35 | -- | −2.58 | -- | -- | −0.01 | -- | -- |
| 54 | None | 57 | -- | -- | -- | -- | 1.79 | 5.78 | 9.48 | -- | 0.37 | -- | −2.69 | −1.26 | -- | -- | 1.04 | |||
| 54 | None | 58 | -- | -- | −10.4 | 6.08 | 1.73 | 27.51 | 9.36 | -- | -- | −3.12 | -- | -- | −0.41 | -- | -- | |||
| 57 | None | 59 | -- | -- | 3.29 | -- | 9.64 | 17.44 | 22.83 | -- | 0.47 | -- | −8.08 | -- | -- | -- | 7.36 | -- | ||
| 59 | None | 66 | -- | -- | -- | −2.38 | 3.36 | 12.83 | -- | -- | 0.83 | -- | -- | −1.25 | -- | -- | −6.00 | 1.08 | ||
| 66 | None | 71 | -- | -- | 3 | −1.77 | -- | 6.66 | 12.25 | 0.31 | 0.25 | -- | −3.99 | -- | -- | -- | -- | 1.27 | ||
| Post-Nubian | 10 | None | 84 | -- | -- | 0.90 | -- | 4.90 | -- | 5.02 | -- | 0.38 | -- | -- | −3.13 | -- | -- | 3.4 | 1.22 | |
| 84 | None | 90 | -- | -- | -- | −0.16 | 6.79 | 14.89 | 5.32 | -- | -- | -- | −1.77 | -- | -- | −0.07 | 1.02 | 1.05 | ||
| Mixing Models | Quaternary aquifer (Upstream) | 8 | Rain | 9 | 87.2 | 12.8 | 1.36 | -- | 3.66 | 16.85 | -- | -- | 0.39 | -- | 1.84 | −3.39 | -- | -- | -- | -- |
| 94 | Rain | 17 | 69.50 | 30.50 | 1.25 | -- | -- | -- | -- | -- | −0.24 | −3.84 | 6.04 | −1.66 | -- | −0.22 | -- | -- | ||
| 95 | Rain | 18 | 21.40 | 78.60 | -- | -- | 7.79 | 24.55 | 22.11 | -- | 0.69 | −1.44 | −6.34 | -- | -- | -- | -- | |||
| 24 | Rain | 19 | 21.50 | 78.50 | -- | -- | 5.06 | 18.49 | 13.79 | -- | 0.39 | -- | 5.56 | 0.93 | -- | -- | -- | -- | ||
| 103 | Rain | 51 | 26.5 | 73.5 | 2.54 | -- | 4.62 | -- | -- | -- | 0.10 | −0.88 | 3.37 | −3.58 | -- | -- | -- | -- | ||
| 103 | Rain | 53 | 65.9 | 34.1 | 0.51 | -- | 2.68 | -- | -- | -- | 0.19 | -- | 1.28 | −2.20 | -- | −0.22 | -- | -- | ||
| 101 | Rain | 54 | 77 | 23 | −4.46 | 2.95 | -- | -- | -- | -- | −0.72 | -- | 5.19 | -- | −4.48 | −0.65 | -- | -- | ||
| Quaternary aquifer (Downstream) | 44 | Nile | 28 | 14.5 | 85.5 | −2.29 | 2.33 | -- | -- | -- | 0.09 | −0.42 | -- | 0.34 | -- | -- | −0.28 | -- | -- | |
| 44 | Nile | 32 | 39.7 | 60.3 | −1.15 | 1.22 | -- | -- | -- | −0.17 | −1.08 | 1.55 | -- | -- | 0.19 | -- | -- | |||
| 44 | Nile | 36 | 41 | 59 | −0.22 | 3.45 | -- | 9.66 | -- | −6.48 | -- | -- | 7.67 | -- | -- | 3.36 | -- | -- | ||
| 44 | Nile | 45 | 52 | 48 | -- | 1.25 | -- | 9.55 | -- | 0.22 | -- | 4.86 | -- | −5.11 | 2.78 | -- | -- | |||
| Post-Nubian | 101 | Rain | 20 | 82 | 18 | 0.88 | −0.57 | -- | -- | 2.02 | -- | 0.02 | -- | −0.66 | -- | -- | −0.46 | -- | -- | |
| 92 | Rain | 21 | 93.5 | 6.5 | 5.04 | −3.05 | -- | -- | 8.24 | -- | 0.47 | -- | −3.19 | -- | -- | −0.06 | -- | -- | ||
| 101 | Rain | 22 | 87.8 | 12.2 | 1.5 | −1.26 | -- | -- | -- | -- | 0.22 | 0.64 | −1.04 | −0.61 | -- | -- | -- | -- | ||
| Aquifer | Well No. | Mineral Phases | |||||||||||
|---|---|---|---|---|---|---|---|---|---|---|---|---|---|
| Cal | Dol | Gyp | Hal | Si | Ilt | Chrt | Mont | Albt | An | Mic | Alun | ||
| Quaternary | 5 | −0.66 | −1.53 | −0.86 | −4.86 | −0.96 | 6.12 | −5.48 | 6.90 | 0.88 | 0.26 | 13.93 | 6.92 |
| 9 | 0.34 | 0.79 | −1.21 | −4.56 | −0.99 | 5.05 | 3.60 | 5.07 | 0.99 | 0.26 | 12.05 | 0.66 | |
| 17 | 0.00 | −0.05 | −1.92 | −5.43 | −1.30 | 2.63 | 0.96 | 2.86 | −0.64 | −0.87 | 9.48 | −1.97 | |
| 18 | 0.01 | −0.15 | −0.53 | −4.97 | −2.77 | −1.26 | −3.28 | −0.96 | −4.76 | −2.83 | 6.60 | 2.30 | |
| 19 | −0.19 | −0.66 | −0.67 | −5.16 | −1.06 | 4.30 | 0.86 | 5.00 | 0.10 | 0.49 | 11.27 | 1.86 | |
| 28 | 0.13 | 0.25 | −1.96 | −6.89 | −0.89 | 5.81 | 1.19 | 6.12 | 0.28 | 0.49 | 12.99 | 0.82 | |
| 32 | −0.12 | −0.24 | −1.25 | −6.16 | −0.84 | 5.78 | 0.08 | 6.47 | 0.63 | 0.64 | 12.91 | 2.78 | |
| 36 | 0.23 | 0.34 | −0.63 | −5.23 | −0.65 | 6.63 | −0.81 | 7.50 | 1.59 | 1.18 | 13.83 | 4.94 | |
| 44 | 0.76 | 1.31 | −0.78 | −5.57 | −2.74 | −1.37 | 0.66 | −1.65 | −4.70 | −2.84 | 6.20 | −0.89 | |
| 45 | 0.14 | 0.38 | −0.77 | −5.22 | −2.76 | −0.81 | −4.43 | −0.68 | −4.72 | −3.12 | 7.31 | 3.60 | |
| 51 | −0.54 | −1.74 | −0.84 | −6.08 | −1.05 | 5.83 | −7.79 | 7.27 | 0.27 | 0.32 | 13.59 | 6.82 | |
| 53 | −0.09 | −0.53 | −0.26 | −5.48 | −1.04 | 6.08 | −2.46 | 7.01 | 1.04 | 0.78 | 13.66 | 6.39 | |
| 54 | 0.18 | 0.19 | −1.36 | −5.43 | −1.05 | 4.95 | 1.17 | 5.42 | 0.63 | 0.17 | 11.98 | 0.84 | |
| 55 | −0.88 | −2.14 | −1.18 | −5.21 | −1.05 | 5.85 | −6.41 | 7.10 | 0.63 | 0.21 | 13.55 | 6.02 | |
| 57 | −0.71 | −1.26 | −1.12 | −5.15 | −1.05 | 6.10 | −4.08 | 7.08 | 0.66 | 0.12 | 13.77 | 6.51 | |
| 58 | 0.04 | −0.03 | −0.32 | −4.58 | −1.04 | 6.08 | −2.07 | 6.99 | 0.94 | 0.63 | 13.62 | 6.53 | |
| 58 | −0.17 | −0.47 | −0.41 | −4.58 | −1.04 | 6.14 | −4.39 | 7.25 | 0.93 | 0.42 | 13.81 | 7.57 | |
| 71 | −0.14 | −58.00 | 0.23 | −4.13 | −1.03 | 6.31 | −1.85 | 7.03 | 1.15 | 0.86 | 13.98 | 7.09 | |
| 60 | 0.32 | 0.58 | 0.30 | −4.50 | −1.04 | 6.13 | −2.12 | 3.45 | 1.03 | 0.57 | 13.71 | 6.78 | |
| 66 | −0.21 | −0.65 | −0.10 | −4.39 | −1.04 | 6.33 | −2.04 | 7.00 | 1.02 | 0.76 | 2.04 | 7.05 | |
| Post-Nubian | 10 | −0.10 | −0.31 | −0.43 | −4.55 | −0.96 | 5.03 | 1.57 | 5.63 | 0.73 | 0.76 | 12.06 | 3.06 |
| 20 | −0.26 | −0.80 | −1.00 | −5.56 | −0.99 | 4.65 | −0.85 | 5.51 | 0.17 | 0.45 | 11.71 | 2.29 | |
| 21 | −0.37 | −1.11 | −1.00 | −5.37 | −0.96 | 5.57 | −2.26 | 6.45 | 0.53 | 0.65 | 12.94 | 3.87 | |
| 22 | 0.28 | 0.30 | −0.97 | −5.51 | −2.75 | −1.55 | −0.37 | −1.72 | −4.81 | −2.93 | 6.04 | −0.99 | |
| 23 | −1.12 | −2.24 | −1.25 | −5.40 | −1.19 | 4.62 | −5.85 | 5.80 | −0.29 | −0.33 | 12.20 | 5.50 | |
| 26 | −0.03 | −0.26 | −0.36 | −4.46 | −0.96 | 5.76 | 1.77 | 6.23 | 1.12 | 0.91 | 12.96 | 3.64 | |
| 90 | −0.10 | −0.47 | −0.10 | −4.09 | −1.03 | 6.33 | 1.88 | 7.02 | 1.19 | 0.80 | 14.01 | 7.21 | |
| 84 | −0.14 | −0.58 | 0.03 | −4.32 | −1.03 | 6.31 | −1.85 | 7.03 | 1.15 | 0.86 | 13.98 | 7.09 | |
| Nubian aquifer | 4 | −0.02 | −0.01 | −1.88 | −5.03 | −1.24 | 1.85 | 1.70 | 2.20 | −0.73 | −0.89 | 8.43 | −2.91 |
| 8 | 0.39 | 0.79 | −2.03 | −4.94 | −1.18 | 2.39 | 5.49 | 2.11 | −0.24 | −0.65 | 8.86 | −5.00 | |
| 24 | 0.42 | 0.76 | −1.16 | −5.22 | −1.23 | 2.25 | 5.24 | 2.13 | −0.67 | −0.38 | 8.79 | −3.02 | |
| 94 | −0.67 | −1.32 | −1.24 | −5.33 | −1.05 | 6.01 | −3.74 | 6.95 | 0.55 | 0.21 | 13.64 | 5.66 | |
| 95 | −0.56 | −1.13 | −1.36 | −5.28 | −1.05 | 5.89 | −3.85 | 6.95 | 0.59 | 0.22 | 13.46 | 5.24 | |
| 92 | −0.57 | −1.17 | −1.17 | −5.21 | −1.05 | 6.02 | −3.61 | 6.95 | 0.61 | 0.28 | 13.66 | 5.68 | |
| 101 | −0.54 | −1.33 | −0.83 | −5.37 | −1.05 | 6.07 | −4.02 | 6.97 | 0.53 | 0.41 | 13.78 | 6.20 | |
| 103 | −1.31 | −3.00 | −2.63 | −5.16 | −1.05 | 5.84 | −8.93 | 6.85 | 0.67 | −0.43 | 13.79 | 4.34 | |
| Rain | Rain | −1.25 | −2.53 | −2.87 | −8.85 | −2.71 | −1.13 | −7.88 | −0.05 | −6.20 | −3.57 | 6.65 | −0.35 |
| Nile | Nile | −0.15 | −0.37 | −2.25 | −8.07 | −2.74 | −1.35 | −3.30 | −1.34 | −5.78 | −3.42 | 6.44 | −1.52 |
Publisher’s Note: MDPI stays neutral with regard to jurisdictional claims in published maps and institutional affiliations. |
© 2022 by the authors. Licensee MDPI, Basel, Switzerland. This article is an open access article distributed under the terms and conditions of the Creative Commons Attribution (CC BY) license (https://creativecommons.org/licenses/by/4.0/).
Share and Cite
Reda, A.; Eissa, M.; Shamy, I.E.; Dotsika, E.; Saied, M.; Mosaad, S. Using Geochemical and Environmental Isotopic Tracers to Evaluate Groundwater Recharge and Mineralization Processes in Qena Basin, Eastern Nile Valley, Egypt. Appl. Sci. 2022, 12, 8391. https://doi.org/10.3390/app12178391
Reda A, Eissa M, Shamy IE, Dotsika E, Saied M, Mosaad S. Using Geochemical and Environmental Isotopic Tracers to Evaluate Groundwater Recharge and Mineralization Processes in Qena Basin, Eastern Nile Valley, Egypt. Applied Sciences. 2022; 12(17):8391. https://doi.org/10.3390/app12178391
Chicago/Turabian StyleReda, Amira, Mustafa Eissa, Ibrahim El Shamy, Elissavet Dotsika, Mostafa Saied, and Sayed Mosaad. 2022. "Using Geochemical and Environmental Isotopic Tracers to Evaluate Groundwater Recharge and Mineralization Processes in Qena Basin, Eastern Nile Valley, Egypt" Applied Sciences 12, no. 17: 8391. https://doi.org/10.3390/app12178391