Article

Research on Seismic Signal Analysis Based on Machine Learning

1
Lanzhou Geophysics National Observation and Research Station, Lanzhou 730000, China
2
Institute of Geophysics, China Earthquake Administration, Beijing 100081, China
3
Institute of AI for Education, East China Normal University, Shanghai 200062, China
4
School of Computer Science and Technology, East China Normal University, Shanghai 200062, China
5
Institute of Artificial Intelligence and Change Management, Shanghai University of International Business and Economics, Shanghai 200062, China
6
Chengdu Surveying Geotechnical Research Institute Co., Ltd. of MCC, Chengdu 610063, China
7
Department of Computer Science, Georgia State University, Atlanta, GA 30314, USA
*
Author to whom correspondence should be addressed.
These authors contributed equally to this work.
Appl. Sci. 2022, 12(16), 8389; https://doi.org/10.3390/app12168389
Submission received: 20 July 2022 / Revised: 11 August 2022 / Accepted: 12 August 2022 / Published: 22 August 2022
(This article belongs to the Special Issue Intelligent Computing and Remote Sensing)

Abstract

:
In this paper, the time series classification frontier method MiniRocket was used to classify earthquakes, blasts, and background noise. From supervised to unsupervised classification, a comprehensive analysis was carried out, and finally, the supervised method achieved excellent results. The relatively simple model, MiniRocket, is only a one-dimensional convolutional neural network structure which has achieved the best comprehensive results, and its computational efficiency is far stronger than other supervised classification methods. Through our experimental results, we found that the MiniRocket model could well-extract the decisive features of the seismic sensing signal. In order to try to eliminate the tedious work of making data labels, we proposed a novel lightweight collaborative learning for seismic sensing signals (LCL-SSS) based on the method of feature extraction in MiniRocket combined with unsupervised classification. The new method gives new vitality to the unsupervised classification method that could not be used originally and opens up a new path for the unsupervised classification of seismic sensing signals.

1. Introduction

In addition to natural earthquakes, the seismic sensing signals observed by the seismic observation also includes waveform information of artificial blasts, collapses, and other events (collectively referred to as non-natural earthquakes). If not handled properly, these waveform records mixed with unnatural seismic events can affect the research work of seismology [1]. The inclusion of artificial blast information in the regional earthquake catalogue leads to inaccurate seismic risk assessment [2]. Furthermore, the blast source is shallow and mainly occurs in the personnel activity area, so it has the characteristics of high intensity, which has a significant impact on the local production and life of local people [3].
In the recording of seismic sensing signals, non-natural seismic events such as blasts and collapses have certain commonalities with natural earthquakes. Especially in recent years, the emergence of various combined blast and mining area collapse events including multiple small collapses has made the waveforms recorded by seismometers extremely complex. It is difficult for seismic analysts to discriminate the specific types of seismic events only through the intuitive characteristics of signals exhibited in waveforms. Analysts may have different judgments about the types of given seismic event, which makes it difficult to identify non-natural seismic events such as blasts and collapses in a timely and effective manner [4].
Since the 1950s, the identification of natural earthquakes and artificial blast events has been widely and deeply studied. A variety of identification criteria have been proposed, including body wave magnitude: surface wave magnitude (mb:Ms) [5,6,7], complexity [8], cepstrum analysis [9], maximum ratio of S to P waves (S/P) [10,11,12,13], time–frequency analysis [14], the criteria extracted from the frequency domain, etc. [15]. These single eigenvectors are usually used alone at first. However, when the blast equivalent is small, the recognition effect is not good. What is more, the feature extraction methods used in these studies have been complicated, and developing an analytical solution of the overall relationship of these features proved to be difficult [16]. It is worth noting that seismic waveform data carry all the source information of seismic sensing signals and can be directly used to classify different types of earthquakes [17].
With the improvement of computer hardware level, a large amount of research on earthquake classification based on machine learning methods directly using a large number of waveform data has sprung up in the field of seismology. In recent years, however, as a multilayer neural network learning algorithm, machine learning has been widely used in the field of seismology because of its powerful ability to automatically extract features from input sample data [18,19,20,21]. In fact, the application of machine learning based methods in other fields can also provide us with reference, so that we can better carry out seismic signal research. EvoGAN extracts expression features through evolutionary algorithm(EA), and then inputs the features into GAN to accurately learn expression information [22]. GHNN based on graph signal processing theory uses two-channel filter bank to construct convolutional layers to process the characteristics of graph signals, and achieves better performances on the task of semi-supervised node classification [23]. In the practical application of natural earthquake and artificial blast classification and recognition, machine learning organically integrates the functions of feature extraction, feature selection, and feature classification and realizes the overall optimization of performance and efficiency. A convolutional neural network in a machine learning model effectively overcomes the problem of overfitting and has low training difficulty, so it has been widely applied in the field of seismic event research in recent years [18,19,20,21].
In this paper, we applied several powerful machine learning techniques to automatically classify noise, earthquake, and blast events, including a variety of classical convolutional neural networks and unsupervised learning methods. In particular, we advocated a two-step approach where feature learning is decoupled from classification or clustering. By adopting the efficient unsupervised method MiniRocket [24] for time series feature extraction, we could utilize the obtained features as prior for the consequent task, such as supervised classification and unsupervised clustering. Finally, we comprehensively evaluated the advantages of various models in terms of accuracy and computational efficiency. The main contributions of this study are as follows:
(1) The main goals of the paper were to provide a novel unsupervised classification method with high accuracy for real-time earthquake catalog elimination, such as blasting interference events, that expands the technical framework for real-time earthquake prediction, enriches the purification means of the earthquake catalog, and can also be reversed to provide an induced earthquake catalog for industrial production, such as coal mine and shale gas mining, filtering natural earthquakes and only retaining artificial earthquakes. Then, the risk of earthquake induced by industrial mining was analyzed to protect the safe mining.
(2) This paper proposed a two-step approach of pre-training feature learning and target task learning which can be either supervised or unsupervised—a lightweight collaborative learning model for seismic sensing signal classification (LCL-SSS). This method only uses a simple one-dimensional convolutional neural network structure to replace the multilayer convolutional neural network, which greatly improves the computational efficiency while the accuracy is consistent with other multilayer convolutional neural networks.
(3) Classical unsupervised methods, such as K-means, perform poorly in seismic sensing signal classification due to the complex time domain. In this paper, we used a one-dimensional convolutional neural network combined with an unsupervised classification method to extract the features of the seismic waveform, and a good classification effect was achieved. This provides a new reference for the study of seismic waveform classification in the future.

2. Application of Machine Learning Method in Seismology

2.1. Background

The advantage of machine learning techniques is that the main features of different types of data can be extracted directly from the data to be classified. By using this technique, we can come up with solutions without prior statistical distribution of features of different types of data, thus identifying some human experience to distinguish missing features in earthquake classes [18,25].
Feature extraction is a commonly used dimensionality reduction technique. Some of the most representative features are selected from the original feature space to express the dataset according to a certain evaluation criterion [26]. In the practical application of classification and recognition of natural earthquakes and other signals such as artificial blasts, machine learning organically unifies the functions of feature extraction, feature selection, and feature classification and realizes the overall optimization of performance and efficiency. Petrol et al. [25] first distinguished the seismic waveform and noise signal through a multilayer convolutional neural network (CNN). Zhao et al. [27] found that the CNN network had a good generalization ability for different types of earthquake and noise samples. Linville et al. [28] used convolution and recursive neural networks to classify local blasts and natural earthquakes and finally obtained 99% accuracy by taking the spectrum of seismic sensors as input. Wei et al. [3] converted the seismic waveform into a frequency spectrum as input. They used the ResNet network to classify seismic and blast events, and it worked very well. Kong et al. [29] combined convolutional neural networks and traditional physical features to distinguish blast events and also visualized neural networks. Tian et al. [30] used the input information, including the seismic waveform of multiple stations and the seismic time–frequency data of a single station, to classify the observation data of natural earthquakes and quarry blast recorded in Utah in 2012.

2.2. Machine Learning Methods

Machine learning methods can be divided into supervised (full label) and unsupervised methods (no label) according to the use of prior information, that is, the amount of existing labels of the data. Different data may have different effects on data feature extraction and classification [31]. The advantage of machine learning technology lies in that it can directly extract the main features of different types of data and apply them to data classification, and it can obtain different types of data without prior knowledge of the statistical distribution features of the solution. Therefore, some human experience could be recognized as a priori information to distinguish the characteristics of seismic waveform signals [18,29].

2.2.1. Supervised Learning Methods

Supervised learning is a method that uses an algorithm to map input feature vectors to output label vectors. These algorithms use known training samples (pairs; the number of samples) to optimize the model. Seismic waves are precisely a set of time series data arranged in chronological order, so they can be treated in this way. Convolution is a powerful tool for feature extraction in data mining. Since the establishment of AlexNet, the champion model of ILSVRC challenge in 2012, convolutional networks have developed rapidly. There are AlexNet [32], VGG [33], Inception [34], and ResNet [35]. The above network models all have a multilayer network structure. Although they have a good classification effect, the computational efficiency decreases with the deepening of the network. In addition, these models can only be used for supervised learning tasks, not large unlabeled datasets. The random convolution kernel transformation Rocket, however, uses a large number of random convolution kernels combined with linear classifiers (ridge regression or logistic regression). This method confirms that for relatively simple time series classification, better classification performance can be achieved without the establishment of a deep neural network [36]. Rocket is divided into two parts: the feature extraction part and the linear classification part. From the resulting feature map, Rocket returns the maximum value and a new feature, the proportion of positive values (PPV). Yet, MiniRocket is an improved method based on the Rocket method [36], with further improvements in computational efficiency [24].
MiniRocket is characterized by using only one-dimensional convolution, which has a good trade-off between classification accuracy and model complexity, and is currently the state-of-the-art for univariate time series, which can compute all kernels at once [37]. Like Rocket, MiniRocket is a transformation that produces some features, which are then used to train a linear classifier [24]. Instead of using both PPV and max (the maximum value of the resulting feature maps), MiniRocket only uses the PPV. So the dimension of the vector is reduced by half (about 10,000 dimensions instead of 20,000). MicroRocket is 75 times faster than Rocket when processing large datasets. To classify feature vectors, both Rocket and MiniRocket use simple ridge regression. In general, MiniRocket uses fewer feature dimensions, and it has significant improvements in reducing the amount of parameters, shortening training time, and improving classification accuracy [37].

2.2.2. Unsupervised Learning Methods

Unsupervised learning methods can directly learn patterns in datasets based on the similarity between samples without relying on known examples [20]. K-means algorithm is one of the most commonly used unsupervised classification methods in data mining. The K-means algorithm is a partition-based clustering algorithm, which uses distance as a measure of similarity between data objects. In other words, the smaller the distance between data objects, the higher their similarity, and the more likely they are to be in the same cluster. There are many ways to calculate the distance between data objects. The K-means algorithm usually uses Euclidean distance to calculate the distance between data objects [38].
Improving clustering performance usually can be done by reducing the dimensionality of the data and performing the clustering in the feature space instead of the data space [19]. In this paper, on the basis of predecessors, we propose a collaborative learning model suitable for the task of seismic sensing signal classification, that is, a two-step model of a pre-trained knowledge base based on supervised learning labels and an unsupervised learning method. This paper showed that this method can predict and obtain better recognition accuracy. Specifically, we used the MiniRocket method to directly extract the important features in the seismic sensing signals, and then used the K-means and cluster head methods for classification operations. The results showed that compared with the direct use of the unsupervised classification method, our method of MiniRocket feature extraction in MiniRocket combined with unsupervised classification proposed in this paper achieved great improvements and improved the classification accuracy of earthquake events.

3. Methodology

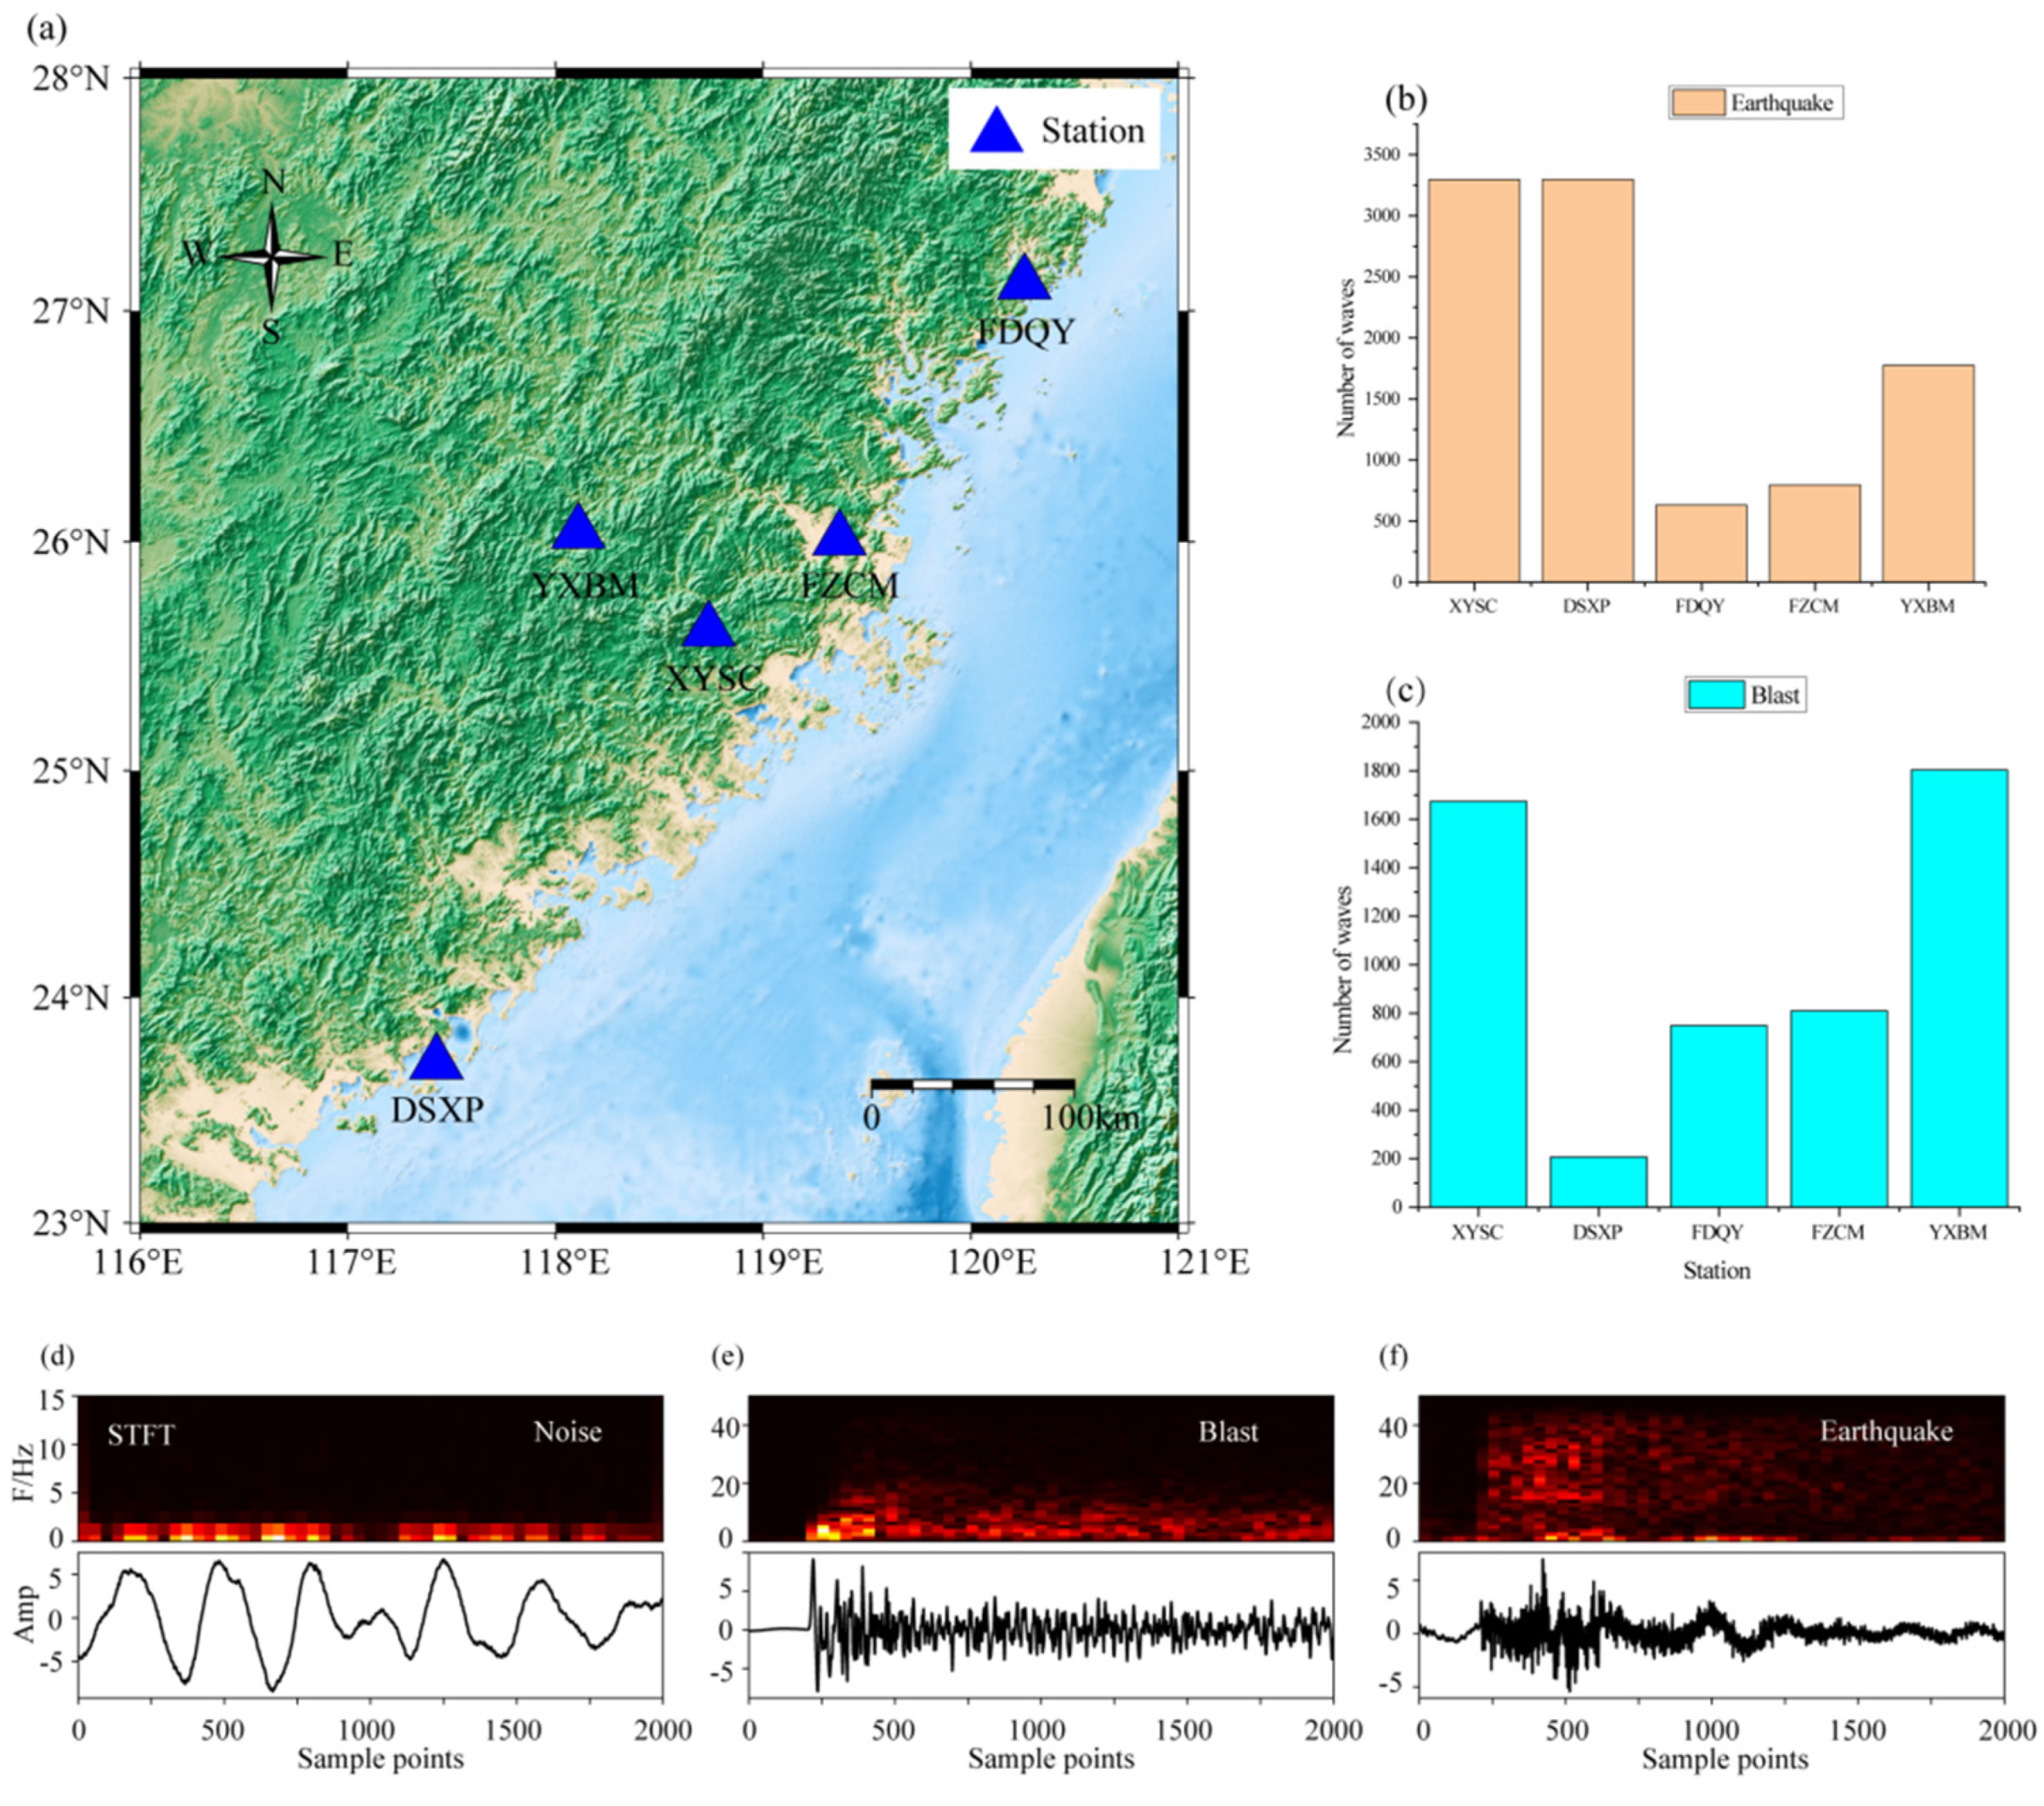
3.1. Description of the Dataset

Fujian Province has a large number of historical and modern earthquakes due to its proximity to the Taiwan subduction zone. There are four NE trending fault zones nearly parallel to the coastline and several NW trending faults almost perpendicular to the coastline. The continuous activity of these faults leads to frequent natural earthquakes in this area [39]. In addition, because Fujian is adjacent to the Taiwan Strait, it is a research area attracting many scholars to study the crust and upper mantle structure on both sides of the Taiwan Strait and adjacent areas by artificial blasting [39]. These blast data have caused great interference for the Fujian seismological network to accurately identify natural earthquake events. These abundant blasting data in this area provide a solid data basis for our work in this paper. The earthquakes and blast data recorded by XYSC, DSXP, FDQY, FZCM, and YXBM stations of the Fujian earthquake monitoring network from 2012 to 2019 were selected as the research object, as shown in Figure 1 and Table 1. These stations all use broadband recorders, which can save the frequency information of different earthquake types well.
The seismic waveforms containing the main information of event records with high recording quality and not submerged by noise were selected as input data of model training and testing for deep learning training. Each input seismic signal is 20 s of data, and the three channels (E-W, N-S, and Z) of the same station were combined into one vector data, that is, 6000 sampling point waveforms. The time series data recording of the seismic waveform started 2 s before the arrival of the nearest P wave and ended at least at the beginning and end attenuation of the S wave so as to ensure complete waveform recording in the time window. If the epicenter distance is too large, the complete S wave cannot be recorded within the 20 s time window. Therefore, we only kept stations with complete records to ensure that the selected stations were free of interruptions and interference within the 20 s time window. Each piece of waveform vector data was stored in the folder corresponding to the event type as a data unit processed by the neural network. A total of 9794 natural earthquakes, 5244 artificial blasts, and 7000 background noises were intercepted in this paper. In terms of label making, label 0 was set to earthquake events, label 1 was blast events, label 2 was background noise, and Figure 1 is the time–frequency diagram of the three types of data. From the time–frequency analysis, the frequency range of noise data was less than 5 Hz, the frequency range of blasts was about 0–20 Hz, and the frequency range of earthquakes was about 0–40 Hz (Figure 1).
We directly input the seismic event waveform into the deep learning network structure and then output its recognition results. Our network adopts many ‘convolution’ and ‘sampling’ operations, and then uses the fully connected layer to realize the mapping between the input data and the output target.

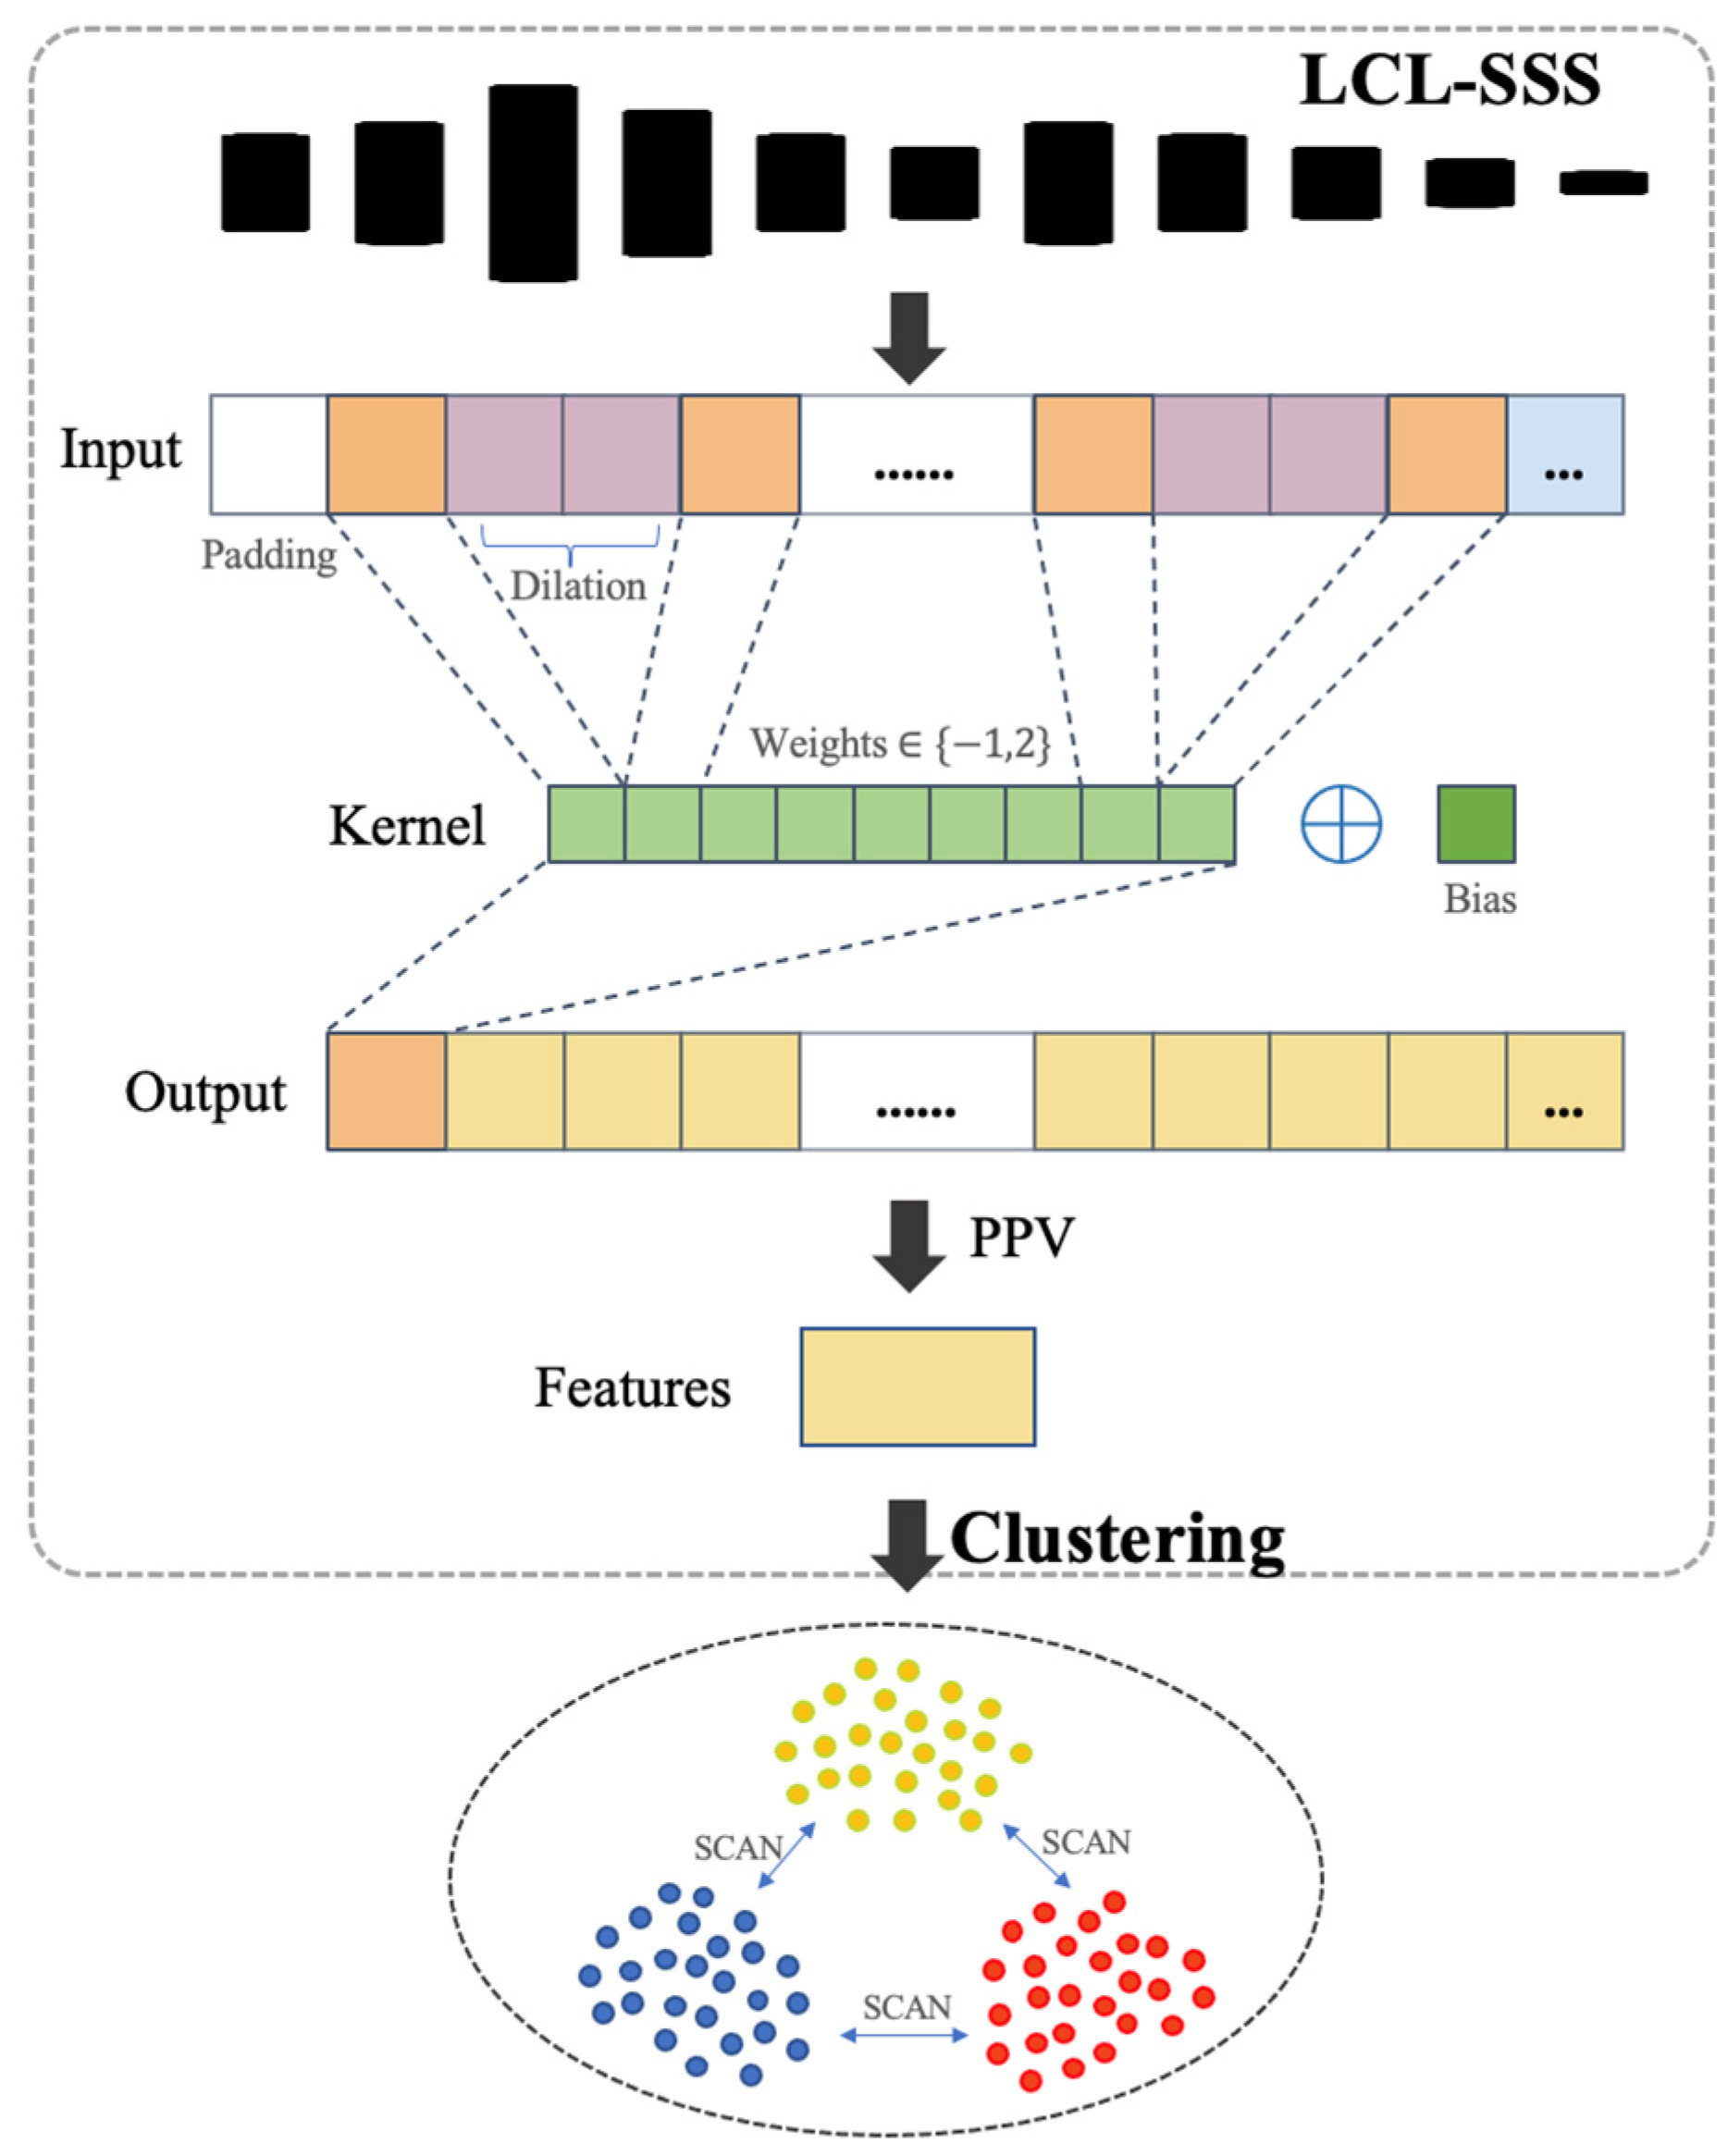
3.2. A Lightweight Collaborative Learning Model for Seismic Sensing Signal Classification (LCL-SSS)

Referring to the methods of Gansbeke et.al. [26], this paper proposes a collaborative learning classification based on a supervised learning based model, MiniRocket, and unsupervised learning-based clustering model. In the first step, feature representations of seismic waves are extracted by MiniRocket, where the random convolution kernel transformations are applied to the data. Adopting a relatively fixed set of kernels, MiniRocket is more deterministic, and then PPV features are computed for the next step. In the second step, seismic waves are classified by the unsupervised clustering algorithm. In the selection of the clustering algorithm, the simple application of K-means clustering, however, usually leads to cluster degradation. That is to say, a single cluster controls the trend of prediction or cluster disappearance, leading to the dominance of a single cluster over other clusters [26]. Therefore, we integrated the SCAN loss to the clustering methods to improve the uniformity of cluster distribution. Then, we took the collaborative learning classification method of MiniRocket + cluster head as an example to introduce the algorithm. The algorithm is introduced as follows.
Step1: MiniRocket: Extracting features of seismic waves
MiniRocket uses convolution kernel and transformed features to handle input seismic wave data and then uses the obtained features as input to train the clustering model. MiniRocket remove almost all randomness from Rocket.
As shown in Algorithm 1, Minirocket fixed the convolution kernel length, the value range of the kernel weight vector, and padding and only used PPV to obtain features. Therefore, the number of features extracted is about 10 K. The fixed length of kernel is 9, with weights restricted to two values, α = 1 and β = 2 , maintaining the balance between the accuracy and the computational complexity by using a small number of kernels. Dilations are in range of [ [ 2 0 ] , [ 2 2 2 · m a x / m ] , , [ 2 m · m a x / m ]   ] , where m is the max dilations per kernel, limited to 32. The exponents are uniformly spaced between 0 and m a x = l o g 2 l i n p u t   d a t a   l e n g t h 1 l k e r n e l   l e n g t h 1 = l o g 2 l i n p u t   d a t a   l e n g t h 1 9 1 . Bias values are calculated based on the convolution output, which is also used to compute features. In particular, when the fixed kernel and dilation are combined, the bias is extracted from the quantile of the convolution output of a randomly selected training sample. The process of one convolution operation for one training example is provided in Figure 2.
Algorithm 1: MiniRocket + Cluster head.
Step1: MiniRocket: Extracting features of seismic waves
Input: dataset X; neighbor numbers for each sample k
Output: features, F; cluster function Φ η ( F )
Set kernel weight W, each W has 6   α   and   3   β
For   X i X do
For each dilation do
    Precompute   possible   convolution   output   C α , C ^ γ
  For each kernel do
    Compute   C γ   based   on   C ^ γ and W
    For each channel do
       C p e r   c h a n n e l =   C α +   C γ
         C = sum (C_(per channel))
   End for
   bias B = quantiles(C, quantiles)
     F = PPV(C, B)
  End for
End for
End for
Return features F

Step2: Cluster head: Train clustering function Φ η ( F )
Integrate features to form tagged dataset F
For  X i F do
 Use Features to mine the top k nearest neighbors: N X i
Update   N F =   N F N X i  
End for
While SCAN_LOSS decreases do 
Update   Φ η with SCAN_LOSS
End while
Return  Φ η ( F )
First, we input our seismic wave data, X = [ X 0 , X 1 , , X n 1 ] , and precompute some outputs for each dilation of each sample data. For a given dilation and a given kernel, the kernel weight, W = [ w 0 , w 1 , , w m 1 ] , is fixed so that the convolution operation can be formulated as:
X W d = j = 0 m 1 x i ( m 2 d ) + ( j d ) w j , i { 0 , 1 , n 1 }
where xi is the value of each sampling point of the seismic waveform and m is the max dilations per kernel. d is dilation, and j (j = 0,1,2,…,m−1) is the element number in W of each given dilation and kernel. We record this formula as C = X W d . Having C, we can compute multiple features for multiple different bias values. Based on the fixed weights of the kernels, we can calculate the multiplications by precomputing A = α X and B = β X , and then complete the convolution operation. For example, if W = [ α , β , α , , α ] , C can be completed by the summation of A = [ a 0 , a 1 , , a n 1 ] and B = [ b 0 , b 1 , , b n 1 ] . This step has the effect that multiple features are computed with the computational cost of a single convolution operation.
As MiniRocket uses kernels with six weights of α and three weights of β , we can only calculate 2/3 of the computation for all 84 kernels for a given dilation more precisely. Therefore, we precompute them for each dilation and then combine them under per kernel. For the convenience of calculation, we set γ = 3 , then β = α + γ . We can precompute C α under per dilation and calculate C γ under per kernel and then combine them to get C =   C α +   C γ . Thus, there are three channels for our input data, so the convolutions of the three channels in each individual kernel are summed to obtain the convolutions of a single division and a single kernel. Given C, bias can be calculated and features, F, based on PPV can be obtained by the following formula:
F = PPV ( C ) = 1 n [ C > b ]
After finding out the features and merging the corresponding label data, we can obtain the waveform feature dataset so as to enter the next step.
Step2: Cluster head: Learn cluster function Φ η
Cluster head is used here to build a classifier for our seismic sensing signal data. The top priority of the cluster head method is to mine the nearest neighbors of each sample by using the feature similarity of the waveform features of seismic waves mined by MiniRocket and then integrating them. Here, we use Euclidean distance to find k nearest neighbors for each sample. In the classification stage, the main task is to learn a clustering function Φ η parameterized by a neural network with a weight of η , which combines the samples and their nearest neighbors as input data. Clustering function Φ η also performs soft assignment on the output category C = { 1 , , C } through the softmax function, with Φ η ( X i ) [ 0 , 1 ] c . The probability that the sample is assigned to cluster C is recorded as Φ η c ( X i ) . The cluster head model minimizes the loss function, SCAN_LOSS, by constantly learning and updating its weights to achieve the purpose of model training. SCAN_LOSS is composed of two terms, i.e., Consistency loss and entropy loss, which is defined as follows:
S C A N _ L O S S = 1 | F | x ϵ F k ϵ N x log [ Φ η ( X ) , Φ η ( k ) ] + λ x ϵ F Φ η c log Φ η c
with Φ η c = 1 | F | x ϵ F Φ η c ( X )
Consistency loss (the first term in Equation (3)) measures consistency and makes consistency prediction for samples and their neighbors by introducing Φ η . When a sample and its nearest neighbors are all accurately predicted to the same category, the dot product is maximized. In this way, consistency loss reaches the minimum.
In order to avoid assigning all samples to a single cluster, the entropy term (the second term in Equation (3) is introduced and the weight coefficient λ is used to adjust its importance. This encourages the prediction results to be evenly distributed on all class sets C , which can realize excessive forced uniform clustering of a large number of classes and can to a certain extent make up for the shortcomings of k-means. This process is realized by dividing the data into different epochs and simulating the cosine annealing curve to adjust the learning rate so that the cluster function of cluster head can iteratively update.
So far, the collaborative learning model has been established, and then the cluster accuracy of the model needs to be evaluated. The schematic diagram is as follows.

3.3. Evaluation Indicators
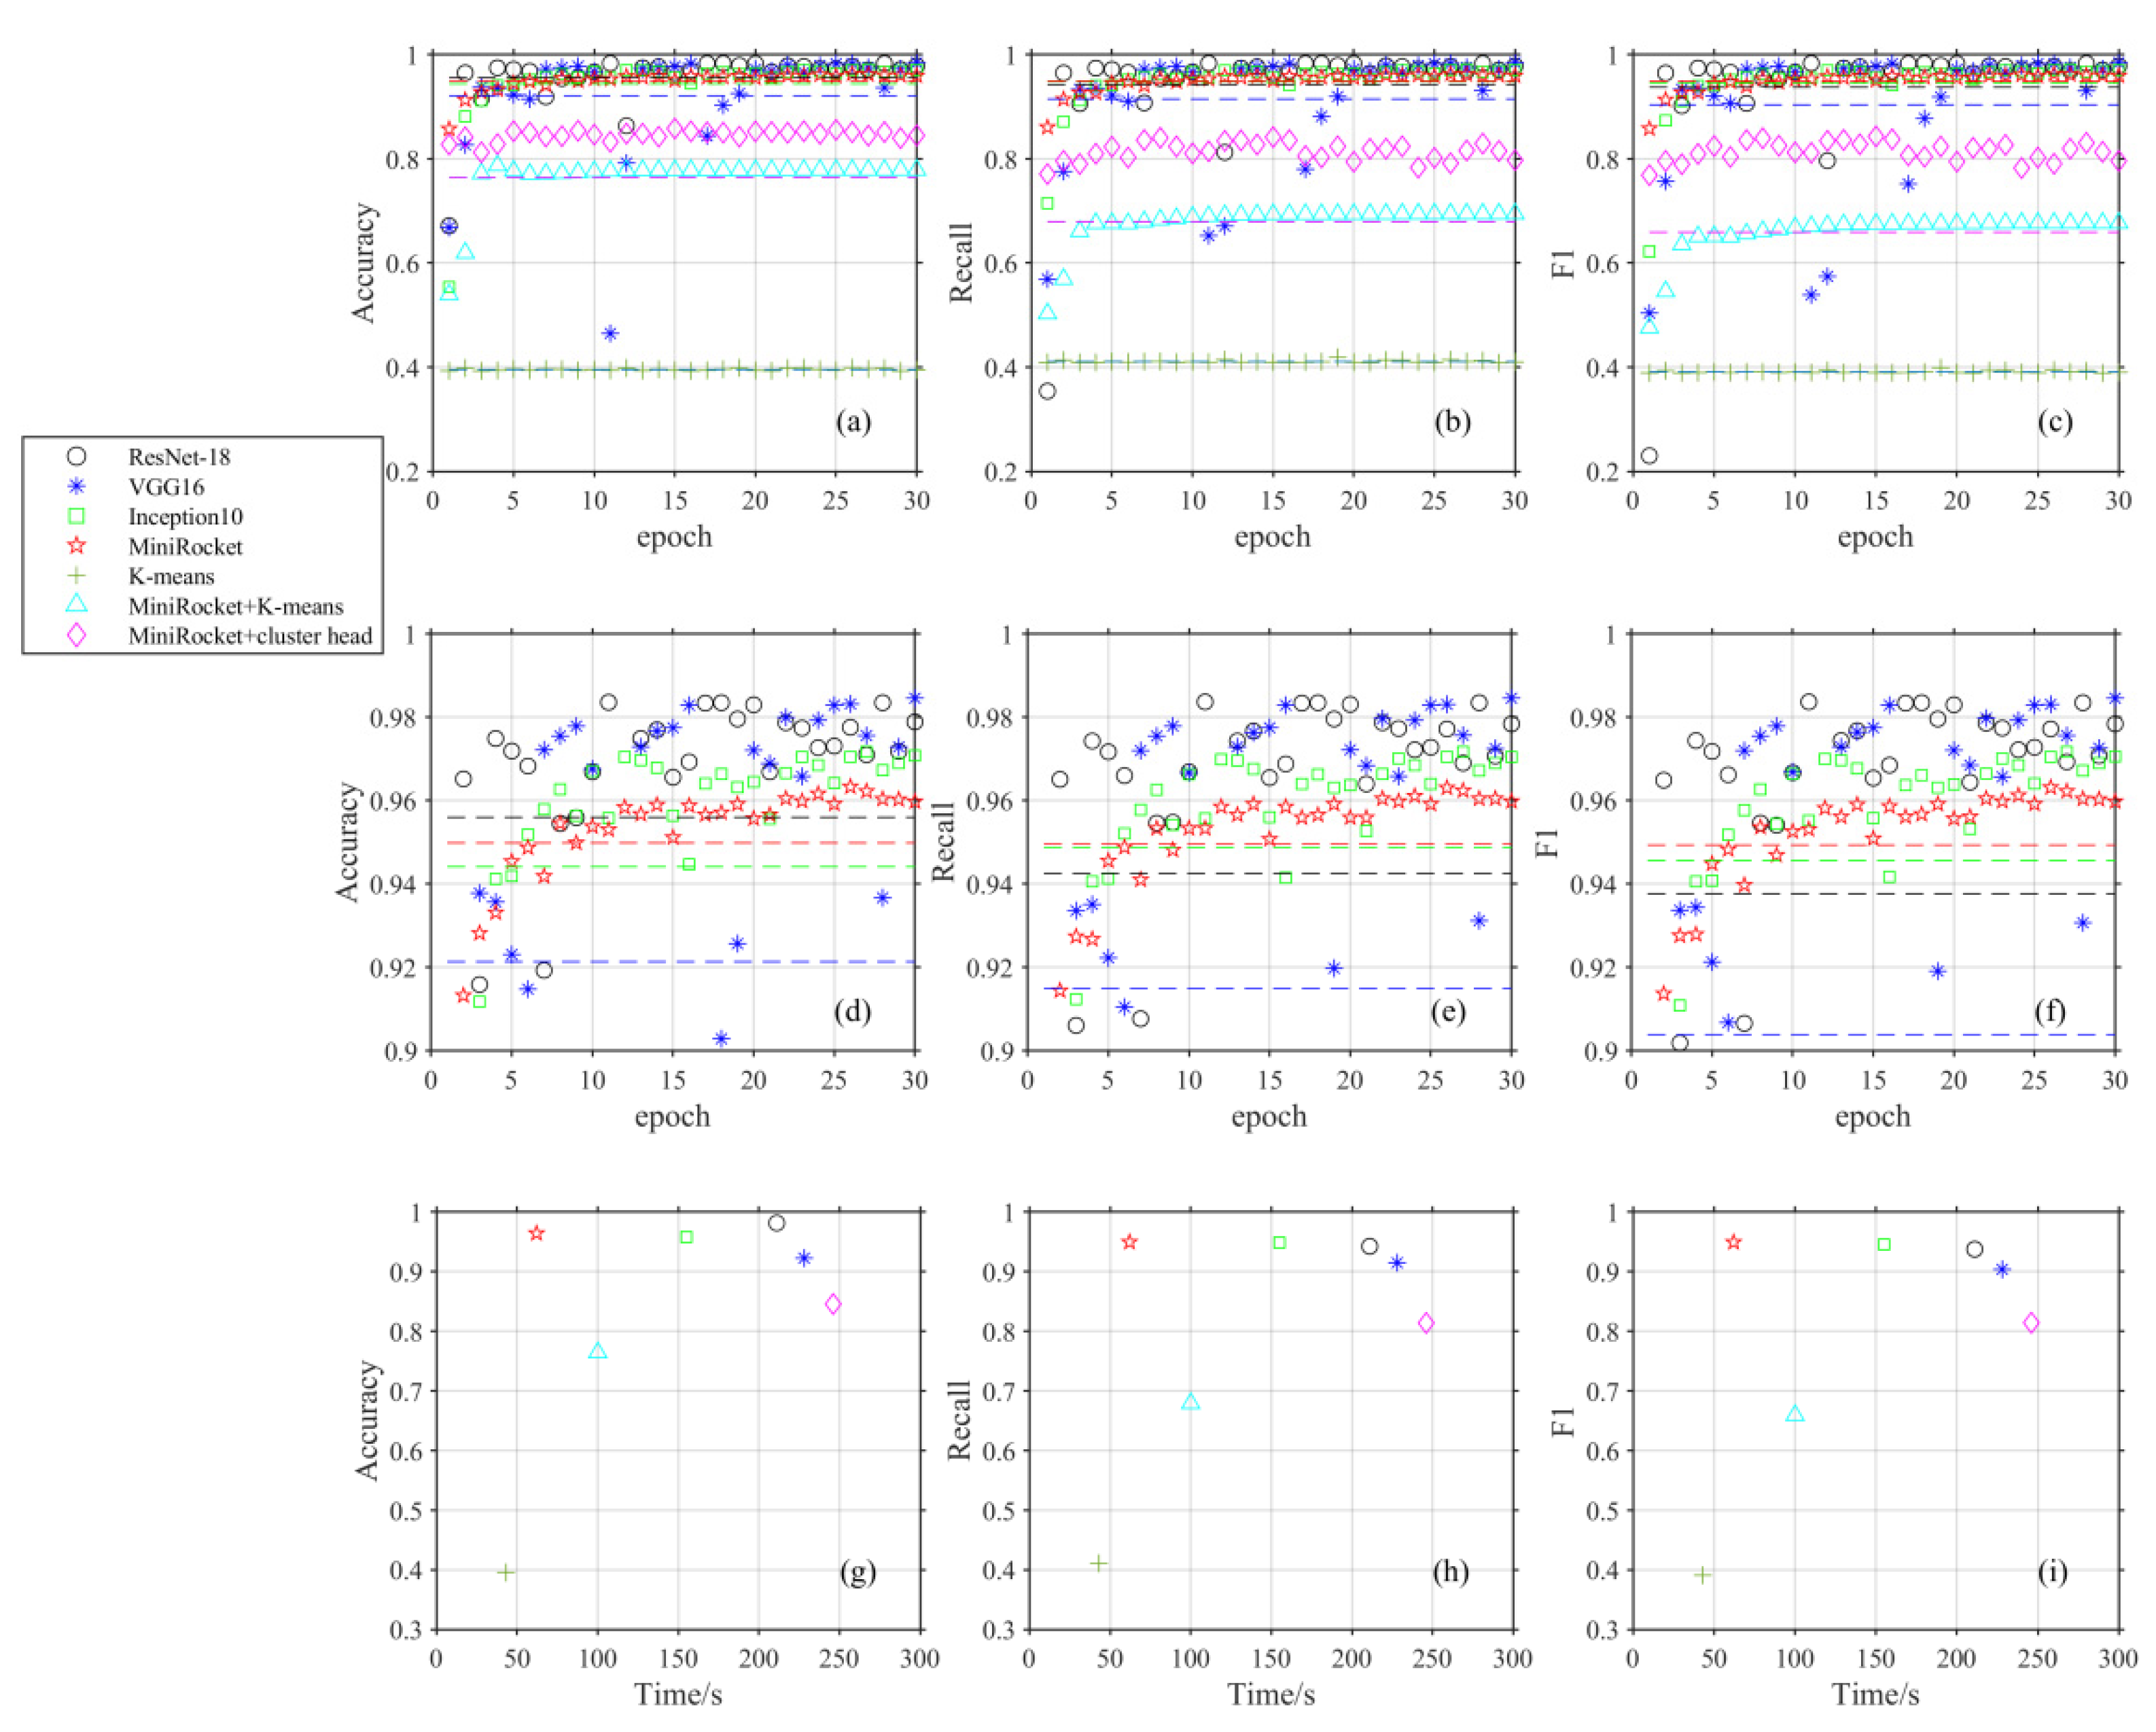
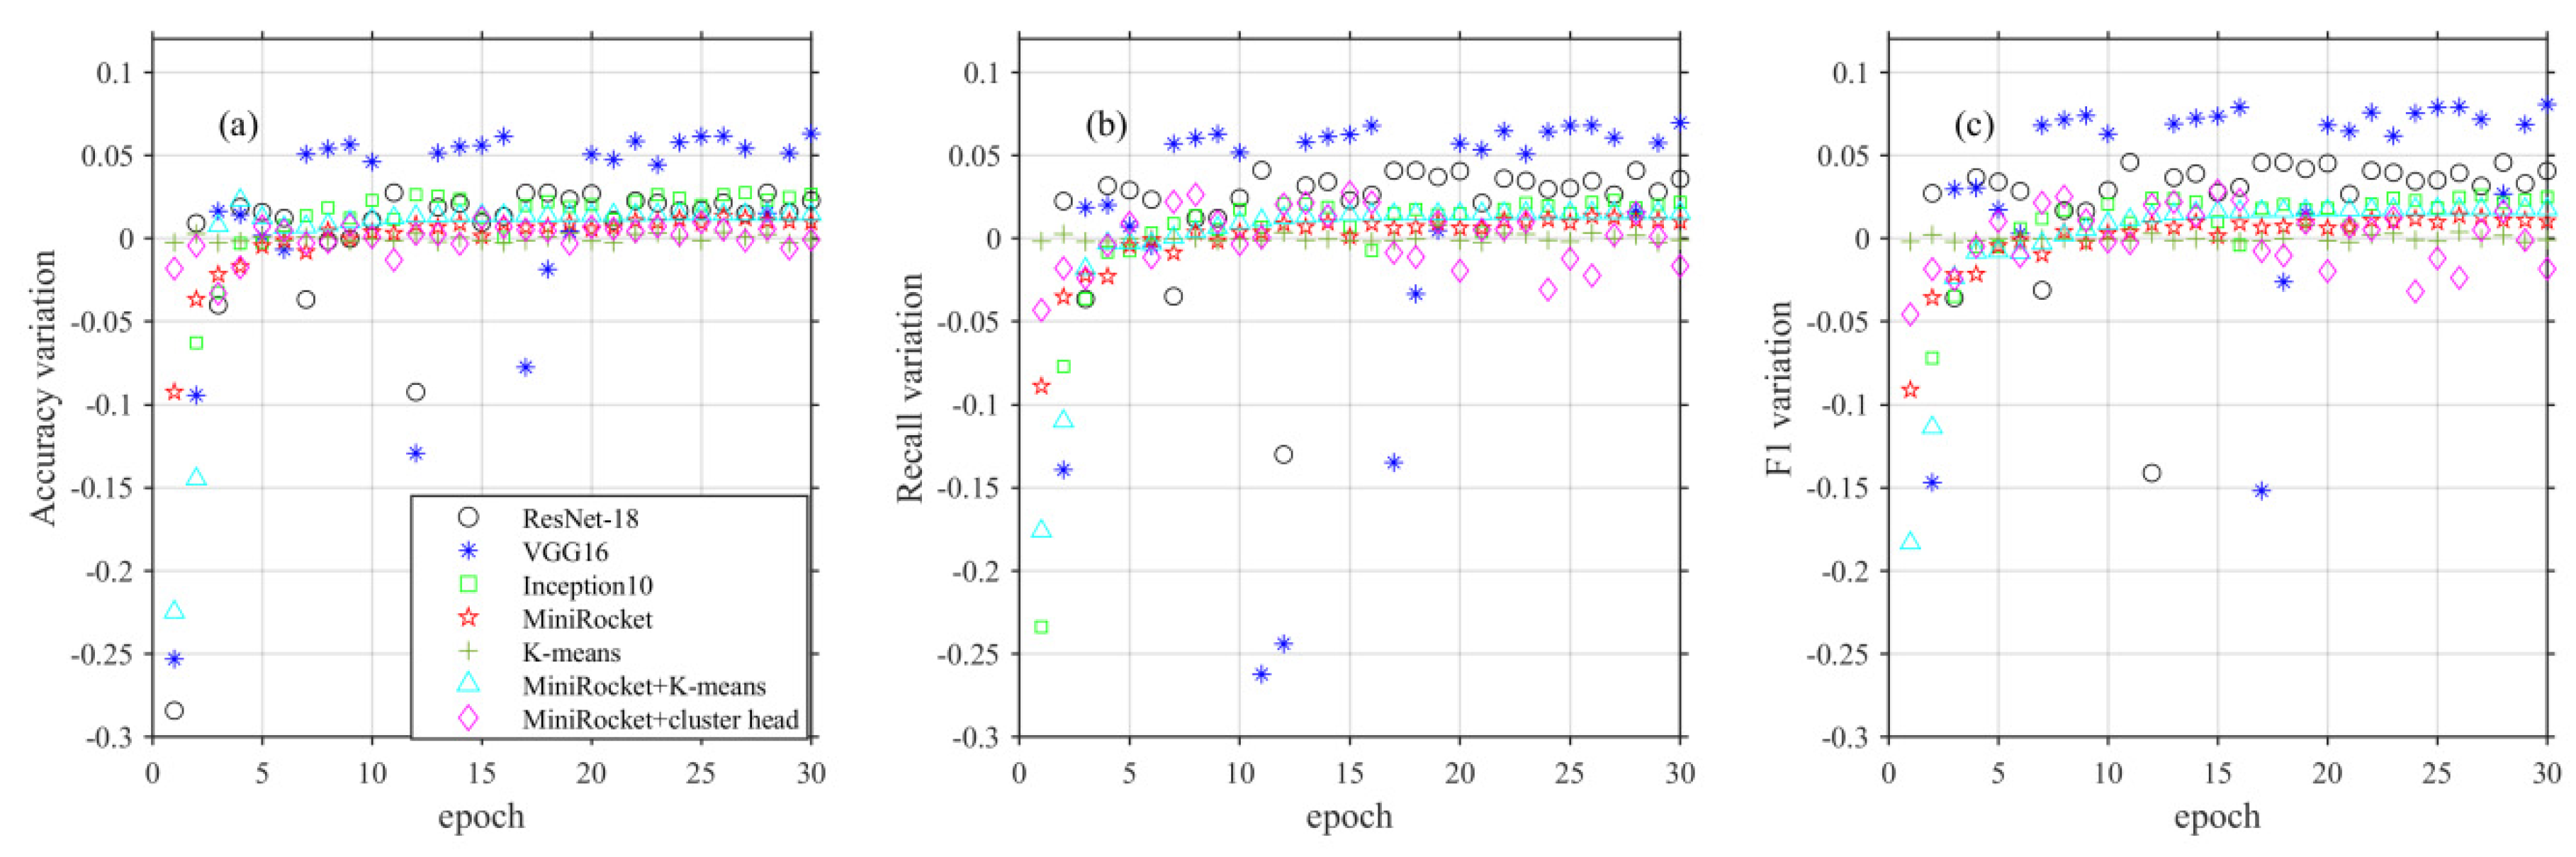
In order to evaluate the clustering accuracy of our collaborative learning models in detail, this paper adopted standard neural network evaluation indexes to display and calculated the recall rate, accuracy rate, and F1 score. TP is the positive sample result of the prediction pair, FP is the positive sample result of the prediction error, TN is the negative sample result of the prediction pair, and FN is the negative sample result of the prediction error.
The recall rate refers to the proportion of positive samples predicted to be positive among actual positive samples:
R e c a l l = T P T P + F N
In addition to the recall rate, the precision rate of the two methods was also calculated (the proportion of positive samples predicted as positive samples, that is, the proportion of positive samples predicted correctly) as well as the F1 score (a measure of classification problems, which considers both accuracy and recall rate and is the harmonic mean of the two), and the calculation formulas are as follows:
P r e c i s i o n = T P T P + F P
F 1 = 2 × T P 2 × T P + F P + F N
Based on the characteristics of small data in this paper, leave-one-out cross-validation was used to verify the accuracy and stability of the model. Since each test (sub-test) has only one event in the retention cross-validation test, the event-based recognition rate is given only after all sub-tests are completed, so only the final recognition rate can be calculated, not the average recognition rate, the highest recognition rate, and the lowest recognition rate.
In view of the inconsistency of the number of different types of events in the data used in this article, the weighted calculation indicator in sklearn.metrics was used in the final output of the above three parameters. Considering the imbalance of data in each category, the weight of each category when calculating each indicator was no longer the reciprocal of the number of categories but the proportion of each category in the real label.

4. Results

In this paper, we proposed a novel model “LCL-SSS” which uses supervised and unsupervised machine learning methods to deal with the automatic classification of noise, natural earthquake events, and blast events. To facilitate the comparison of the computational efficiency of each model, all our experiments were performed in a Titan rtx gpu environment with 30 iterations. From the training results (Table 2), the overall effect of supervised learning was much better than that of the unsupervised method(Figure 3). Different training models have certain differences in recognition effect and calculation time. With the increase in training time, the generalization ability of different models to data roughly converged. From the average value of 30 times, ResNet-18 had the highest accuracy rate, reaching 0.9560, and the MiniRocket method had the second accuracy rate of 0.9499. In addition, recall and F1 indexes were the highest in MiniRocket, which were 0.9496 and 0.9493, respectively. With excellent classification accuracy, MiniRocket took the least time to calculate among all supervised models. With 30 iterations of all supervised models, the calculation speed of the MiniRocket method was 2.5–3.7 times that of the other three methods. Without relying on the label, the accuracy of using the K-means method directly was only 0.3953. It is noteworthy that the performance of our MiniRocket with unsupervised clustering methods was comparable to the supervised methods and surpassed the vanilla K-means method by a large margin, suggesting the effectiveness of our collaborative learning. The collaborative learning methods MiniRocket + K-means and MiniRocket + cluster head proposed in this paper achieved accuracy rates of 0.7643 and 0.8458, respectively. From the calculation efficiency of the unsupervised method, the calculation time of LCL-SSS method was 246 s, and the calculation time was too long.
In order to check the stability of various methods, we calculated the classification stability of various methods. The specific method was to calculate the difference between the three indexes of each iteration and their respective median values. The standard deviation of these differences (referred to as deviation in this paper) was used to measure the stability of the method. The final results are shown in Figure 4 and Table 3. Among the supervised classification methods, MiniRocket achieved the best results in all three indicators. The accuracy variances of the ResNet-18 and the MiniRocket models were 0.0592 and 0.0207, respectively. In addition, the deviation of the MiniRocket method in recall and F1 was much smaller than ResNet-18, only about 1/6 of it. In unsupervised methods, K-means had the smallest classification deviation, but its accuracy was too low. The method proposed in this paper achieved 0.0097, 0.0181, and 0.0187, respectively, in the three indicators, ranking the second in all methods, second only to k-means. The above results show that the three methods based on MiniRocket achieved good stability.

5. Discussion

All the methods used in this paper underwent 30 epochs, and the average value of 30 iterations was taken as the basis for identifying the ability of the method. Finally, in terms of the robustness of the model, ResNet-18 and MiniRocket had the highest robustness. Except that the accuracy of the MiniRocket method was slightly lower than ResNet-18, it was better than ResNet-18 in recall, F1, and variance. Considering the classification accuracy and calculation time of the model, the MiniRocket model, as a neural network with both depth and width, had a better effect. It showed that the model can overcome the complexity of seismic waveform characteristics while calculating efficiently and has a good application prospect in the study of seismic waveform classification.
The accuracy of the unsupervised classification method K-means was lower than 0.4, so it cannot be used in practical research, although it was the most efficient in label-independent methods. The main reason for the poor performance of K-means calculation is that the key features in different event waveforms were not fully extracted. The MiniRocket method can also be used to extract the characteristics of seismic waveforms and then combined with other clustering methods, such as K-means and cluster head. In order to directly extract the decisive features in waveforms, we tried the method of collaborative learning between MiniRocket and unsupervised classification. Firstly, we tried the MiniRocket + K-means method, which directly improved the accuracy to 0.7643, but the values of recall and F1 were relatively low. Since the simple application of K-means clustering leads to the decline in clustering performance, this paper also proposed the MiniRocket + cluster head method. This combined method greatly improved the accuracy of unsupervised classification. The accuracy of the MiniRocket + cluster head method was 84.5%, which was more than two times higher than that of the pure K-means method. Therefore, through this study, a new idea is given for the classification of different earthquake types, and the proposed unsupervised classification method also has a certain application prospect in the identification of unnatural earthquakes in other regions. The classification effect of collaborative learning was further improved, and the variance was minimal, indicating that the model has a certain robustness.
Since MiniRocket has the function of feature extraction, this allowed us to visualize the distance in the feature space of different types of seismic events. For this purpose, we used the t-sne method to reduce the dimension of data to two dimensions for visualization. In Figure 5, there are three types of data ground truth labels; visualization results of the feature interval of the supervised MiniRocket method; visualization results of the feature interval of the MiniRocket + K-means method; visualization results of the feature interval of the MiniRocket + cluster head method. The characteristic distance of noise events is far from that of blast and seismic events, while the characteristic distance of blast and seismic events is very close, so it is difficult to distinguish. Although the MiniRocket + cluster head method has some disadvantages in noise identification, it has greater advantages over the MiniRocket + K-means method in distinguishing difficult blast and seismic events.
The results of this paper showed that the supervised classification method was significantly better than the unsupervised method. Theoretically, the objective function of supervised classification task optimization is E ( x , y ) ~ D [ log p θ ( y | x ) ] , and the optimization process is the process of extracting label-related information from data, while the unsupervised task is mainly used for maximum likelihood estimation E x ~ D [ log p θ ( x ) ] . The lack of category information makes it difficult to correctly estimate the distribution based on category, which may be the reason why unsupervised classification methods are rarely used in the current research on identifying earthquake types based on seismic full waveform. Compared with the unsupervised clustering method, supervised classification can find the event discrimination threshold more accurately, thus yielding better performance.

6. Conclusions

Through qualitative analysis of signal and data waveform characteristics, the event type can be directly determined. Combined with long-term experience accumulation in daily practical work, blast and natural earthquakes can be identified simply and efficiently to a certain extent. However, earthquake monitoring is long-term and real-time. It is a waste of a lot of manpower to rely on human experience to continuously judge the earthquake category. Moreover, there are certain differences in the personal experience level of earthquake analysis experts, resulting in different discrimination results caused by personnel changes in earthquake classification. If you want to find an efficient recognition criterion that can be directly applied to computer automatic recognition, it must be based on the quantitative determination of the characteristics of the event type (establishing the effective threshold of various criteria), and because the waveform record is a comprehensive reflection of a series of influences such as the source type, propagation path, and recording instruments and equipment, the determination of the final event type should be a comprehensive classification problem with multiple characteristics. All the information on the characteristics of the earthquake source is recorded in the seismic sensing signal waveform. The depth characteristics of natural earthquakes, explosions, and other waveforms were extracted by using the depth learning model, and a neural network model that can identify non-natural seismic events was established. When applied to the fields of earthquake monitoring, earthquake disaster prevention, and public services, it can further improve work efficiency, be used to respond to social concerns in time, and reduce disaster losses. In order to explore the effect of different depth learning models in the classification of earthquake, blast, and background noise, this paper used a variety of neural network structures to establish a classifier to identify the types of natural earthquake, earthquake, blast, and background noise. These classifiers were tested by using a single seismic waveform as a unit to comprehensively evaluate the actual effect of a convolutional neural network in the identification of seismic event types so as to provide a reference for the automatic identification of seismic event types. The final results are as follows:
(1)
Among the supervised learning methods used in seismic classification, this paper attempted to use MiniRocket, a one-dimensional convolution model. It is relatively simple, does not need a complex and deep network structure, and can also achieve classification results close to or even surpassing those of the other three mainstream classification methods, with the highest computational efficiency.
(2)
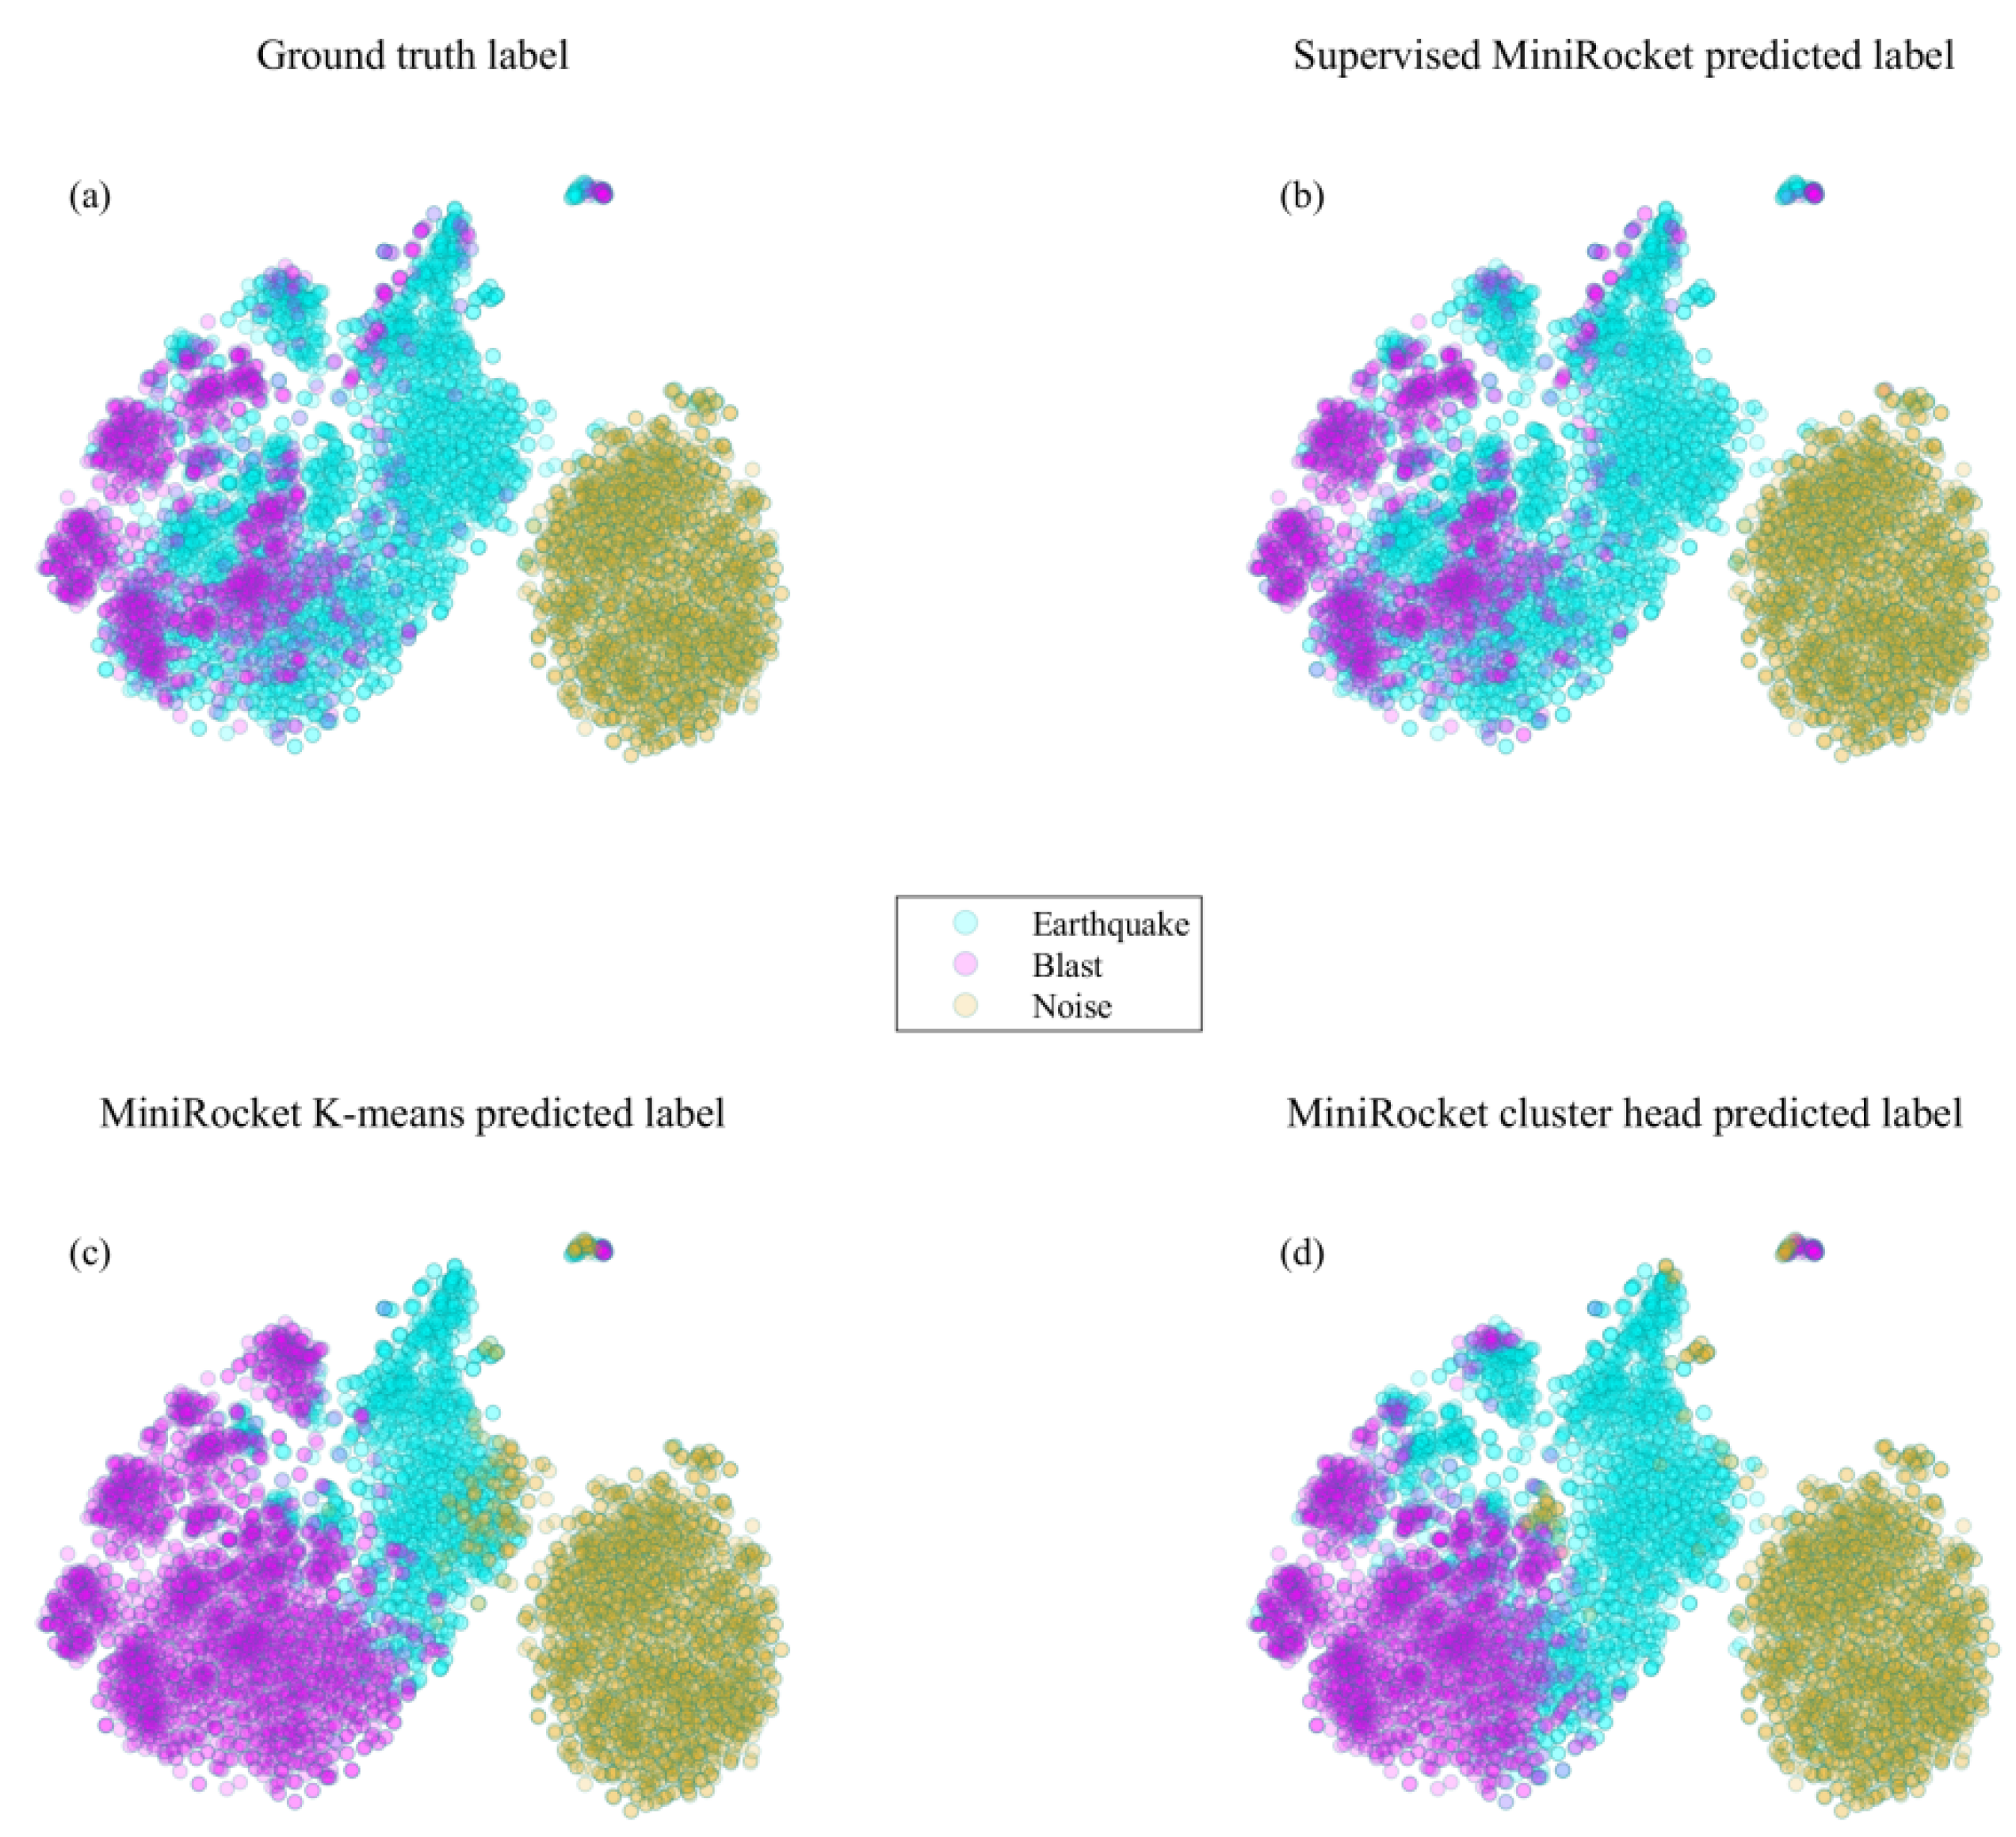
The feature extraction of seismic waves was carried out through MiniRocket, and then the t-sne visualization method was used to compare the feature distances of three types of data: earthquake, blast, and background noise. It was found that the feature distances of earthquake and blast blend with each other and are difficult to distinguish.
(3)
In supervised learning, it is inevitable to make labels manually, which is heavy work, while unsupervised learning can classify sample data without prior information, that is, label making is not required. Our LCL-SSS combined two unsupervised classification methods, K-means and cluster head, and finally achieved an accuracy of nearly 80%. The method proposed in this paper provides a feasible reference scheme for the automatic classification of earthquake types and points out a new classification for the classification of seismic events in future seismic big data. Once the unsupervised method is established, the application of all algorithms in practice is very simple. Compared with the supervised method, there is no need to make labels, so the calculation cost is very low.
Due to the small number of samples of blast seismic events and insufficient training data, there is an overfitting problem. For non-natural seismic events such as blast, it is difficult to establish a large dataset with sufficient samples. It is necessary to continuously collect samples of real non-natural seismic events from different regions and structures so as to make the convolutional neural network model have a stronger generalization ability and higher classification and recognition accuracy. Although our LCL-SSS far exceeded traditional methods such as K-means in the classification of earthquake and blasting events, its accuracy still needs to be improved. In addition, the new method is slightly decadent in terms of calculation efficiency. With the further improvement of machine learning methods, there is still great room for improvement in seismic signal feature extraction and event clustering. In future research, we will continue to improve the classification accuracy and improve the calculation speed to make the real-time seismic event classification research more rapid and accurate.

Author Contributions

Conceptualization, X.Y. (Xinxin Yin) and F.L.; methodology, X.Y. (Xinxin Yin), F.L., S.S., X.Y. (Xiulong Yang), and X.Z.; investigation, F.L., S.S., M.N. and X.Y. (Xinxin Yin); resources, F.L. and X.Y. (Xiulong Yang); software, X.Y. (Xiulong Yang) and S.S.; data curation, X.Y. (Xinxin Yin), F.L., R.C. and X.Y. (Xiulong Yang); supervision, F.L. and X.Y. (Xinxin Yin); project administration, F.L. and X.Y. (Xinxin Yin); funding acquisition, X.Y. (Xinxin Yin) and F.L. All authors have read and agreed to the published version of the manuscript.

Funding

This work was jointly supported by the science and technology development fund of Gansu Seismological Bureau (2021Y17, 2021Y04) and the science and technology plan of Gansu Province (21JR7RA795, 21YF5FA031) and also supported by the Fundamental Research Funds for the Central Universities.

Institutional Review Board Statement

Not applicable.

Informed Consent Statement

Not applicable.

Data Availability Statement

Source code could be accessed from https://github.com/sndnyang/LCL-SSS.

Acknowledgments

We give thanks to the deep learning technology team of the Cross-Innovation Laboratory of East China Normal University for their fully support. At the same time, we also thank the reviewers for their valuable time.

Conflicts of Interest

The funders had no role in the design of the study; in the collection, analyses, or interpretation of data; in the writing of the manuscript, or in the decision to publish the results.

References

  1. Saad, O.M.; Shalaby, A.; Sayed, M.S. Automatic discrimination of earthquakes and quarry blasts using wavelet filter bank and support vector machine. J. Seismol. 2019, 23, 357–371. [Google Scholar] [CrossRef]
  2. Kortström, J.; Uski, M.; Tiira, T. Automatic classification of seismic events within a regional seismograph network. Comput. Geosci. 2016, 87, 22–30. [Google Scholar] [CrossRef] [Green Version]
  3. Wei, Y.G.; Yang, Q.L.; Wang, T.T.; Jiang, C.S.; Bian, Y.J. Earthquake and explosion identification based on Deep Learning residual network model. Acta Seismol. Sin. 2019, 41, 646–657. (In Chinese) [Google Scholar] [CrossRef]
  4. Zhou, S.H.; Jiang, H.K.; Qu, J.H.; Li, J.; Guo, Z.B.; Zheng, X. A Review on Research Progress in Recognition of blast and Collasp. Earthq. Res. China 2021, 37, 508–522. (In Chinese) [Google Scholar]
  5. Douglas, A.; Hudson, J.A.; Marshall, P.D.; Young, J.B. Earthquakes that look like explosions. Geophys. J. Int. 1974, 36, 227–233. [Google Scholar] [CrossRef] [Green Version]
  6. Blandford, R.R. Seismic event discrimination. Bull. Seismol. Soc. Am. 1982, 72, S69–S87. [Google Scholar]
  7. Stevens, J.L.; Day, S.M. The physical basis of mb: Ms and variable frequency magnitude methods for earthquake/explosion discrimination. J. Geophys. Res. Solid Earth 1985, 90, 3009–3020. [Google Scholar] [CrossRef]
  8. Badawy, A.; Gamal, M.; Farid, W.; Soliman, M.S. Decontamination of earthquake cataog from quarry blast events in northern Egypt. J. Seismol. 2019, 23, 1357–1372. [Google Scholar] [CrossRef]
  9. Xie, T.; Zheng, X.D.; Zhang, G.Y. Seismic facies analysis based on linear prediction cepstrum coefficients. Chin. J. Geophys. 2016, 59, 4266–4277. (In Chinese) [Google Scholar]
  10. Rodgers, A.J.; Lay, T.; Walter, W.R.; Mayeda, K.M. A comparison of regional-phase amplitude ratio measurement techniques. Bull. Seismol. Soc. Am. 1997, 87, 1613–1621. [Google Scholar]
  11. Pyle, M.L.; William, R.W. Investigating the effectiveness of P/S amplitude ratios for local distance event discrimination. Bull. Seismol. Soc. Am. 2019, 109, 1071–1081. [Google Scholar] [CrossRef]
  12. Pyle, M.L.; William, R.W. Exploring the Effects of Emplacement Conditions on Explosion P/S Ratios across Local to Regional Distances. Seismol. Soc. Am. 2022, 93, 866–879. [Google Scholar] [CrossRef]
  13. Wang, R.J.; Brandon, S.; Monique, H.; Keith, K. Advancing Local Distance Discrimination of Explosions and Earthquakes With Joint P/S and ML-MC Classification. Geophys. Res. Lett. 2021, 48, e2021GL095721. [Google Scholar] [CrossRef]
  14. Yılmaz, Ş.; Bayrak, Y.; Çınar, H. Discrimination of earthquakes and quarry blasts in the eastern Black Sea region of Turkey. J. Seismol. 2013, 17, 721–734. [Google Scholar] [CrossRef]
  15. Allmann, B.P.; Shearer, P.M.; Hauksson, E. Spectral discrimination between quarry blasts and earthquakes in southern California. Bull. Seismol. Soc. Am. 2018, 98, 2073–2079. [Google Scholar] [CrossRef] [Green Version]
  16. Miao, F.; Carpenter, N.S.; Wang, Z.; Holcomb, A.S.; Woolery, E.W. High-accuracy discrimination of blasts and earthquakes using neural networks with multiwindow spectral data. Seismol. Res. Lett. 2020, 91, 1646–1659. [Google Scholar] [CrossRef]
  17. Chen, R.H.; Huang, H.M.; Chai, H.M. Study on the discrimination of seismic waveform signals between earthquake and explosion events by convolutional neural network. Prog. Geophys. 2018, 33, 1331–1338. (In Chinese) [Google Scholar] [CrossRef]
  18. Mousavi, S.M.; Horton, S.P.; Langston, C.A.; Samei, B. Seismic features and automatic discrimination of deep and shallow induced-microearthquakes using neural network and logistic regression. Geophys. J. Int. 2016, 207, 29–46. [Google Scholar] [CrossRef] [Green Version]
  19. Mousavi, S.M.; Zhu, W.Q.; William, E.; Beroza, G.C. Unsupervised clustering of seismic signals using deep convolutional autoencoders. IEEE Geosci. Remote Sens. Lett. 2019, 16, 1693–1697. [Google Scholar] [CrossRef]
  20. Zhu, W.Q.; Beroza, G.C. PhaseNet: A deep-neural-network-based seismic arrival-time picking method. Geophys. J. Int. 2019, 216, 261–273. [Google Scholar] [CrossRef] [Green Version]
  21. Kong, Q.; Trugman, D.T.; Ross, Z.E.; Bianco, M.J.; Meade, B.J.; Gerstoft, P. Machine Learning in Seismology: Turning Data into Insights. Seismol. Res. Lett. 2019, 90, 3–14. [Google Scholar] [CrossRef] [Green Version]
  22. Liu, F.; Wang, H.Y.; Zhang, J.H.; Fu, Z.W.; Zhou, A.M.; Qi, J.Y.; Li, Z.B. EvoGAN: An evolutionary computation assisted GAN. Neurocomputing. 2022, 469, 81–90. [Google Scholar] [CrossRef]
  23. Liu, F.; Yang, C.Y.; Zhou, A.M. Graph Hilbert Neural Network. Chin. J Electron. 2022, 32, 1–11. [Google Scholar] [CrossRef]
  24. Dempster, A.; Schmidt, D.F.; Webb, G.I. Minirocket: A very fast (almost) deterministic transform for time series classification. In Proceedings of the 27th ACM SIGKDD Conference on Knowledge Discovery & Data Mining, Singapore, 14–18 August 2021; pp. 248–257. [Google Scholar] [CrossRef]
  25. Perol, T.; Gharbi, M.; Denolle, M. Convolutional neural network for earthquake detection and location. Sci. Adv. 2018, 4, e1700578. [Google Scholar] [CrossRef] [PubMed] [Green Version]
  26. Van Gansbeke, W.; Vandenhende, S.; Georgoulis, S.; Proesmans, M.; Van Gool, L. Scan: Learning to classify images without labels. In Proceedings of the European Conference on Computer Vision, Glasgow, UK, 23–28 August 2020; Springer: Cham, Switzerland, 28 August 2020; pp. 268–285. [Google Scholar] [CrossRef]
  27. Zhao, M.; Chen, S.; Dave, Y. Waveform classification and seismic recognition by convolution neural network. Chin. J. Geophys. 2019, 62, 374–382. (In Chinese) [Google Scholar] [CrossRef]
  28. Linville, L.; Pankow, K.; Draelos, T. Deep learning models augment analyst decisions for event discrimination. Geophys. Res. Lett. 2019, 46, 3643–3651. [Google Scholar] [CrossRef]
  29. Kong, Q.; Wang, R.; Walter, W.R.; Pyle, M.; Koper, K.; Schmandt, B. Combining Deep Learning with Physics Based Features in Explosion-Earthquake Discrimination. arXiv 2022, arXiv:2203.06347. [Google Scholar] [CrossRef]
  30. Tian, X.; Wang, M.J.; Zhang, X.; Wang, X.T.; Sheng, S.Z.; Lv, J. Discrimination of earthquake and quarry blast based on multi-input convolutional neural network. Chin. J. Geophys. 2022, 65, 1802–1812. (In Chinese) [Google Scholar] [CrossRef]
  31. Duda, R.O.; Hart, P.E.; Stork, D.G. Pattern Classification, 2nd ed.; Wiley: New York, NY, USA, 2001; ISBN 0-471-05669-3. [Google Scholar]
  32. Krizhevsky, A.; Ilya, S.; Geoffrey, E.H. Imagenet classification with deep convolutional neural networks. Adv. Neural Inf. Processing Syst. 2012, 25. [Google Scholar] [CrossRef]
  33. Szegedy, C.; Liu, W.; Jia, Y.; Sermanet, P.; Reed, S.; Anguelov, D.; Erhan, D.; Vanhoucke, V.; Rabinovich, A. Going deeper with convolutions. In Proceedings of the IEEE Conference on Computer Vision and Pattern Recognition, Boston, MA, USA, 7–12 June 2015; pp. 1–9. [Google Scholar] [CrossRef]
  34. Simonyan, K.; Andrew, Z. Very deep convolutional networks for large-scale image recognition. arXiv 2014, arXiv:1409.1556. [Google Scholar]
  35. He, K.M.; Zhang, X.G.; Ren, S.Q.; Sun, J. Deep residual learning for image recognition. In Proceedings of the IEEE Conference on Computer Vision and Pattern Recognition, Las Vegas, NV, USA, 27–30 June 2016; pp. 770–778. [Google Scholar] [CrossRef]
  36. Dempster, A.; Petitjean, F.; Webb, G.I. ROCKET: Exceptionally fast and accurate time series classification using random convolutional kernels. Data Min. Knowl. Discov. 2020, 34, 1454–1495. [Google Scholar] [CrossRef]
  37. Schlegel, K.; Neubert, P.; Protzel, P. HDC-MiniROCKET: Explicit Time Encoding in Time Series Classification with Hyperdimensional Computing. arXiv 2022, arXiv:2202.08055. [Google Scholar]
  38. Likas, A.; Vlassis, N.; Verbeek, J.J. The global k-means clustering algorithm. Pattern Recognit. 2003, 36, 451–461. [Google Scholar] [CrossRef] [Green Version]
  39. Li, X. Velocity Structure of Crust and Uppermost Mantle in Cross-Straits of Southeast China and Adjacent Region; Nanjing University: Nanjing, China, 2018. (In Chinese) [Google Scholar]
Figure 1. Overview of the study data. (ac) Station distribution and the waves number in the 5 stations. (df) Noise, blast, and earthquake signal sample.
Applsci 12 08389 g001
Figure 2. Schematic diagram of our LCL-SSS model.
Applsci 12 08389 g002
Figure 3. Epoch calculation accuracy, recall, and F1 values with calculation time of 30 times with all classification methods. (ac) Comparative accuracy, recall, and F1 values for different models in each epoch; the dotted line indicates the average value. (df) The enlarged images of (ac), respectively, show only the exponential distribution in the range of 0.9–1 in order to clearly see the indexes of various methods. (gi) Comparison of the calculation efficiency and the mean accuracy, recall, and F1 values of different models.
Applsci 12 08389 g003
Figure 4. Deviation of each index of each iteration from the median value.(ac) represent the accuracy, recall, and F1 values for different models in each epoch.
Applsci 12 08389 g004
Figure 5. Visualization of feature extraction of three classification models based on MiniRocket.
Applsci 12 08389 g005
Table 1. Number of waveforms recorded at each station.
Station NameNumber of EarthquakesNumber of BlastsTotal
XYSC329616744970
DSXP32972073504
FDQY6327491381
FZCM7958101605
YXBM177418043578
Sum of waves9794524415,038
Table 2. Experimental results of different methods.
ModelCategoryAccuracyRecallF1Label DependencyCalculation Time (s)
Inception10Supervised0.94410.94870.9457Yes155
VGG16Supervised0.92140.91490.9039Yes228
ResNet-18Supervised0.95600.94250.9377Yes211
MiniRocketSupervised0.94990.94960.9493Yes62
K-meansUnsupervised0.39530.41080.3908No43
MiniRocket + K-meansCollaborative learning0.76430.67910.6591No100
LCL-SSS (ours)Collaborative learning0.84580.81400.8143No246
Table 3. Standard deviation of accuracy, recall, and F1 values.
ModelCategoryStandard Deviation of Accuracy Standard Deviation of RecallStandard Deviation of F1
Inception10Supervised0.07620.04870.0644
VGG16Supervised0.11140.11070.1370
ResNet-18Supervised0.05920.11620.1386
MiniRocketSupervised0.02070.02030.0207
K-meansUnsupervised0.00210.00230.0023
MiniRocket + K-meansCollaborative learning0.05140.04070.0427
LCL-SSS (ours)Collaborative learning0.00970.01810.0187
Publisher’s Note: MDPI stays neutral with regard to jurisdictional claims in published maps and institutional affiliations.

