
Biophysical Controls That Make Erosion-Transported Soil Carbon a Source of Greenhouse Gases

CFAES Rattan Lal Center for Carbon Sequestration and Management, The Ohio State University, Columbus, OH 43210, USA
Appl. Sci. 2022, 12(16), 8372; https://doi.org/10.3390/app12168372
Submission received: 13 July 2022
/
Revised: 15 August 2022
/
Accepted: 15 August 2022
/
Published: 22 August 2022
(This article belongs to the Special Issue Soil Erosion: Dust Control and Sand Stabilization, Volume II)
Abstract
:Soil erosion is a selective process which removes the light fraction comprised of soil organic carbon (SOC) and colloidal particles of clay and fine silt. Thus, a large amount of carbon (C) is transported by erosional processes, and its fate (i.e., emission, redistribution, burial, and translocation into aquatic ecosystems) has a strong impact on the global carbon cycle. The processes affecting the dynamics of soil C emission as greenhouse gases (i.e., CO2, CH4, N2O), or its deposition and burial, vary among different stages of soil erosion: detachment, transport, redistribution, deposition or burial, and aquatic ecosystems. Specific biogeochemical and biogeophysical transformative processes which make erosion-transported carbon a source of C emission are determined by the type of erosion (rill vs. inter-rill in hydric and saltation erosion vs. air-borne dust in aeolian erosion), soil temperature and moisture regimes, initial SOC content, texture, raindrop-stable aggregates and water repellency, crusting, slope gradient, physiography and the slope-based flow patterns, landscape position, and the attendant aerobic vs. anaerobic conditions within the landscape where the sediment-laden C is being carried by alluvial and aeolian processes. As much as 20–40% of eroded SOC may be oxidized after erosion, and erosion-induced redistribution may be a large source of C. In addition, human activities (e.g., land use and management) have altered—and are altering—the redistribution pattern of sediments and C being transported. In addition to O2 availability, other factors affecting emissions from aquatic ecosystems include sub-surface currents and high winds, which may also affect CH4 efflux. The transport by aeolian processes is affected by wind speed, soil texture and structure, vegetation cover, etc. Lighter fractions (SOC, clay, and fine silt) are also selectively removed in the wind-blown dust. The SOC-ER of dust originating from sand-rich soil may range from 2 to 41. A majority of the C (and nutrients) lost by aeolian erosion may be removed by saltation. Even over a short period of three seasons, wind erosion can remove up to 25% of total organic C (TOC) and total N (TN) from the top 5 cm of soil. A large proportion of C being transported by hydric and aeolian erosional processes is emitted into the atmosphere as CO2 and CH4, along with N2O. While some of the C buried at the depositional site or transported deep into the aquatic ecosystems may be encapsulated within reformed soil aggregates or protected against microbial processes, even the buried SOC may be vulnerable to future loss by land use, management, alkalinity or pH, the time lag between burial and subsequent loss, mineralogical properties, and global warming.
1. Introduction
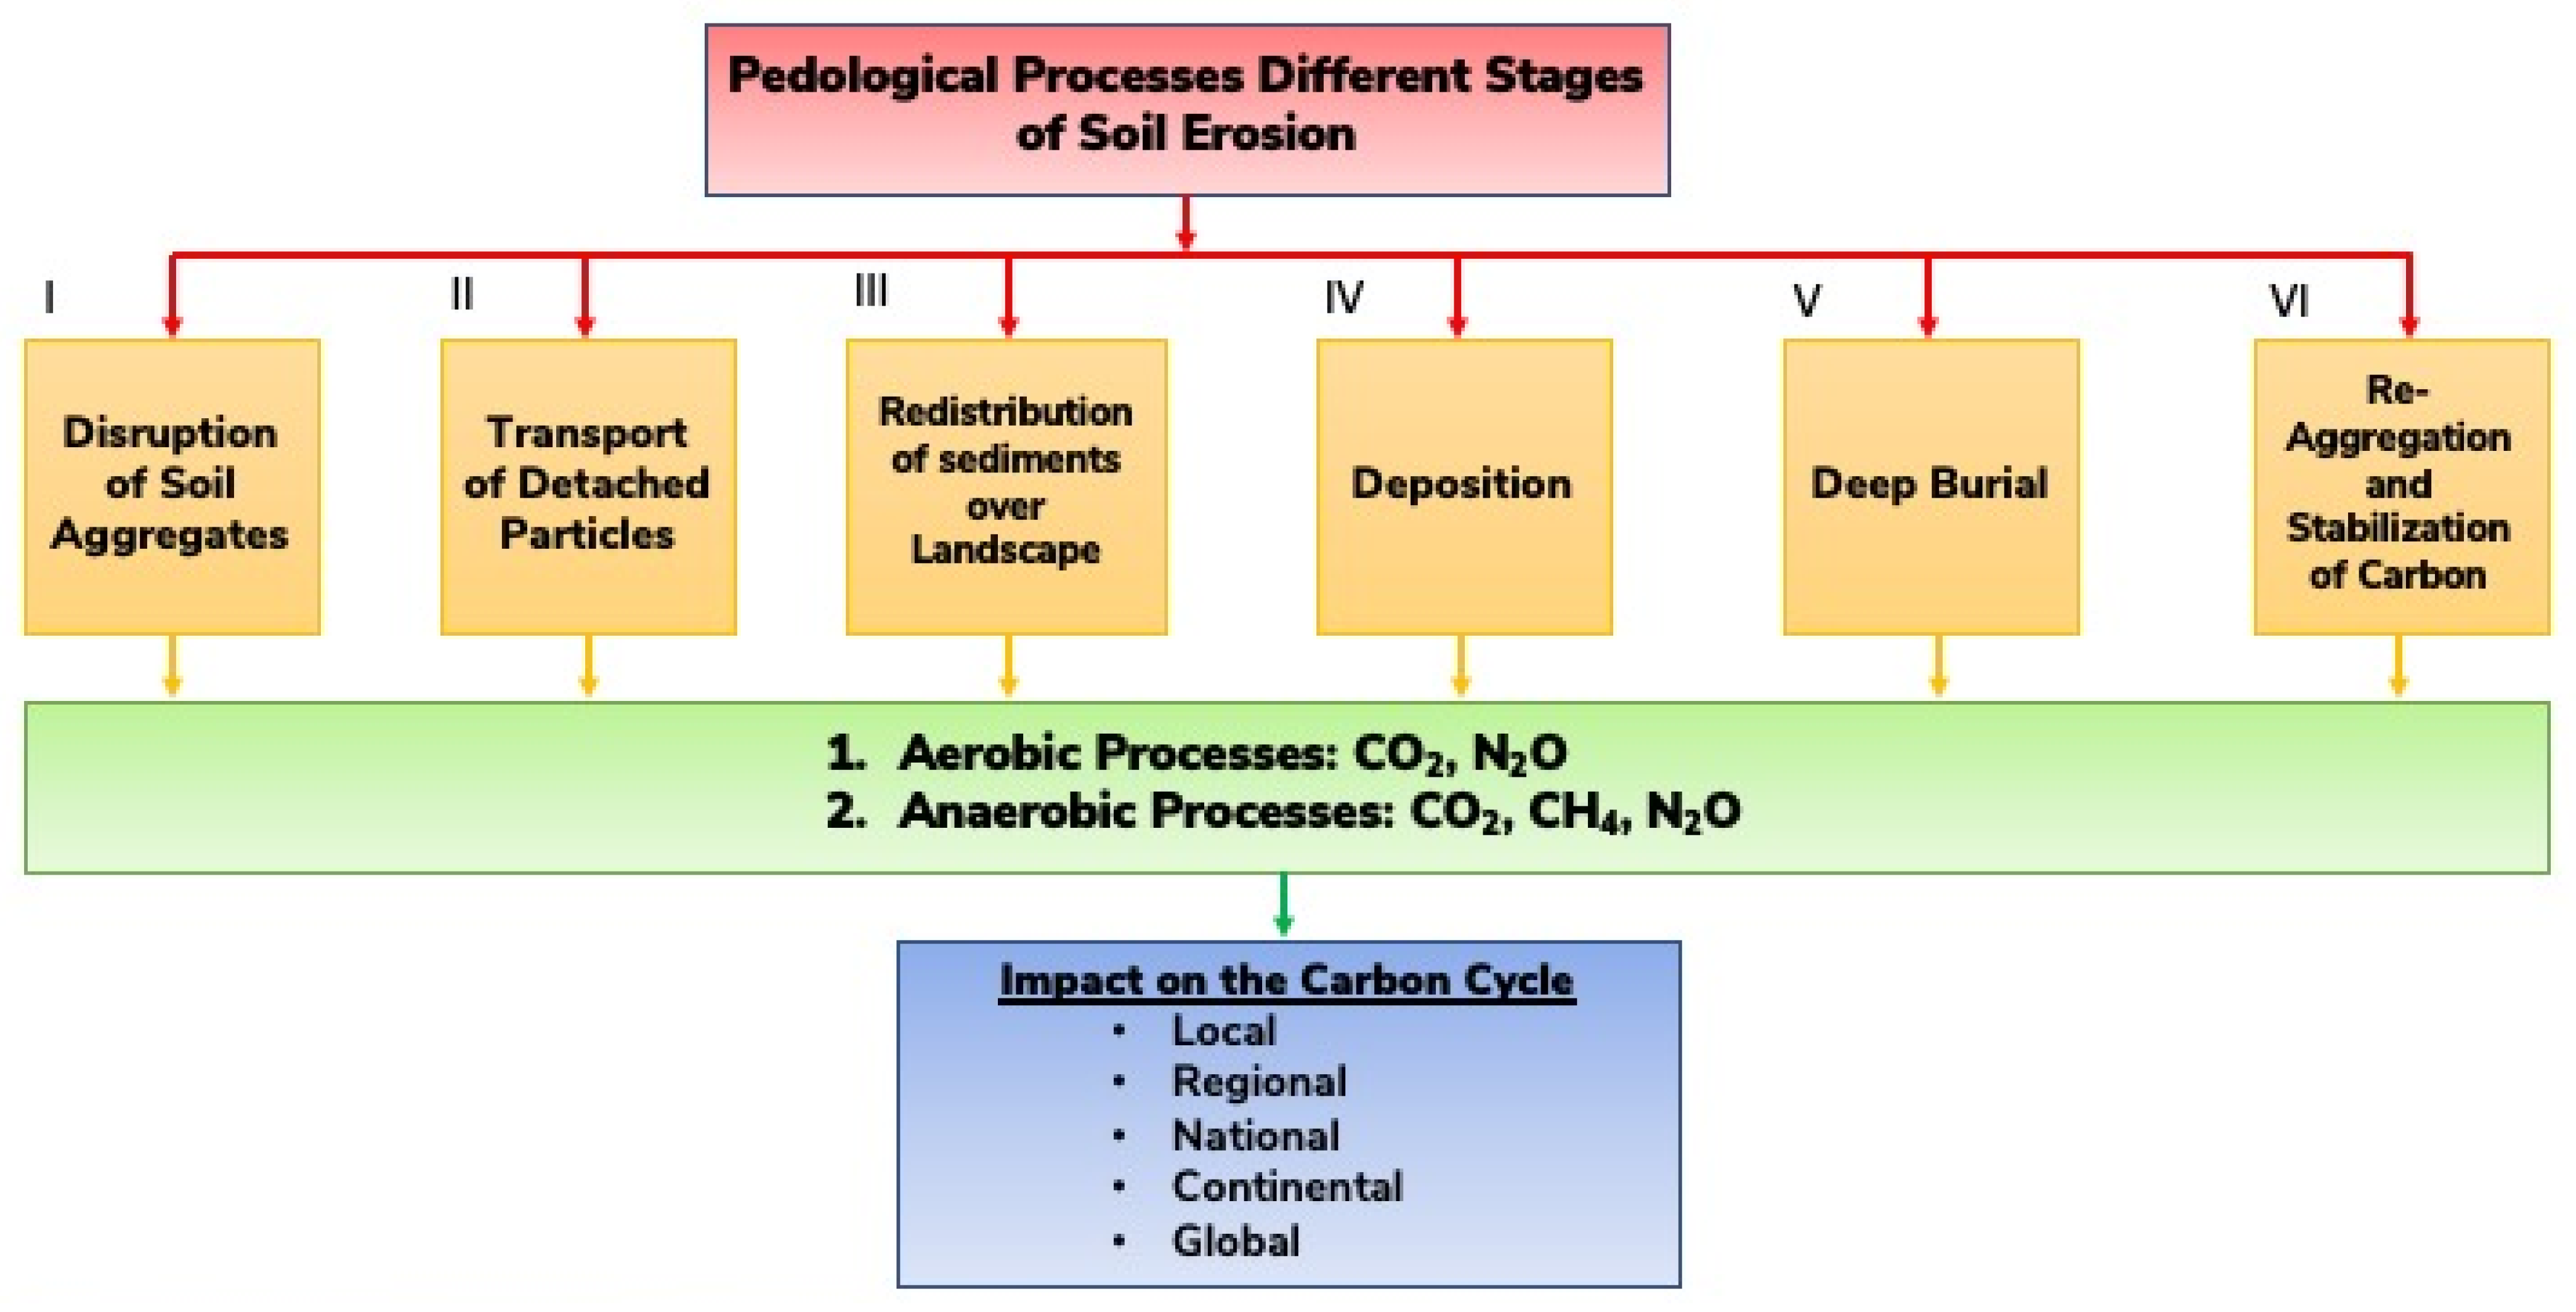
Accelerated soil erosion, in which the magnitude of soil loss exceeds the rate of new soil formation, is a major anthropogenic-induced process. Borrelli et al. [1] estimated the global potential rate of soil erosion by water at 43 ± 9.2 Pg/y and suggested that site-specific conservation agricultural practices should be adopted to reduce the risks of accelerated soil erosion. With projections for a more vigorous hydrological cycle due to climate change, the water erosion hazard may increase +30 to +66% by 2070 [1], which will increasingly jeopardize agronomic productivity and drastically affect the global C budget [2]. In comparison with fossil fuel emissions of ~36.7 Pg CO2 eq. per year [3], global net annual soil emissions are large [4] and are not being considered in the estimation of the global C budget. At the catchment scale, Bouchoms et al. [5] estimated that the landcover change over the last 1000 years decreased the soil organic carbon (SOC) stock of the top 1 m of soil by 31.1 Mg C/ha (32% loss) compared to the initial SOC stock. However, the global C budget [3] does not specifically consider pedological processes (e.g., accelerated soil erosion) as sources and sinks of greenhouse gases (GHGs). In this regard, the fate of soil C being transported laterally over the landscape has a strong impact which is not presently accounted for, even in the analysis by Oertel et al. [4]. Pedological processes involved as sources and sinks of GHGs differ among stages of the soil erosion process. These stages (Figure 1) include: (I) disruption of soil aggregates, detachment of soil particles, and exposure of C and soil previously encapsulated and protected against microbial processes, (II) transport of detached particles by alluvial and aeolian processes, (III) redistribution of sediments and the associated C in the landscape, (IV) deposition of sediments and C on foot slopes and other locations within the landscape, (V) possible re-aggregation of clay and C to form organo-mineral complexes which undergo burial in the subsoil, and (VI) translocation into aquatic ecosystems. Dominant pedomorphic processes depend on soil temperature and moisture regimes during specific stages, as well as the physiographic characteristics. The latter are comprised of slope shape (convex, concave, complex), aspect (north or south facing), gradient (steepness or incline), and the landscape position (summit, side slopes, toe, or foot slope).
The idea that soil erosion leads to sequestration of atmospheric C is contradictory to the definition of soil C sequestration. Olson et al. [6] defined soil C sequestration as, “the process of transferring CO2 from the atmosphere into the soil of a land unit through unit plant residues and other organic solids which are derived or retained in the unit as part of the soil organic matter (SOM or humus). Retention of sequestered C in the soil (terrestrial pool) can range from short-term (not immediately released back to atmosphere) to long-term (millennia) storage. The sequestered SOC process should increase the net SOC storage during and at the end of a study to above the previous pre-treatment baseline.” Thus, the deposition and burial of the lateral transport of SOC by erosion involves redistribution, and not a new sequestration, of atmospheric CO2. Labeling the redistribution of the erosion-induced lateral transport of SOC confounds the issue.
The literature on soil erosion and the impact of land use and management on soil erosion hazard is voluminous. Therefore, this article has a limited scope of addressing specific examples of the impact of erosional processes on the fate of SOC being transported at different stages of soil erosion. The specific objective of this article is to collate and synthesize pertinent research information regarding the impact of hydric and aeolian processes at different stages on the fate of SOC being transported over the landscape and the attendant emission of GHGs into the atmosphere. The goal is to identify specific biophysical mechanisms that impact GHG emissions at different stages of the erosional process, making soil erosion an emission source, and thus create positive feedback to climate change.
The specific hypotheses tested in this review are: (a) the erosional processes at stages 1 to 3 are sources of GHG emissions, (b) the pedological processes at stages 4 to 6 six may stabilize C by deep burial and the reformation of aggregates, (c) the net effect of erosional processes at all six stages is a source of GHGs, and (d) the identification of site-specific conservation-effective measures and their implementation is a prudent strategy to reduce risks of erosion-induced emission of GHGs and minimize the positive feedback to climate change.
In view of the specific objectives and hypotheses outlined above, references cited in the article which addressed the fate of C being transported at different stages of accelerated erosion were specifically chosen. About 60 references were purposely chosen because of their focus on pedological processes at different stages and the impact on SOC dynamics and the emission of GHGs. Some articles were also chosen because these provided information on the enrichment ratio of SOC and indicated selectivity of the erosional process and preferential removal of the light colloidal fractions.
2. Criterion for Erosion-Induced Lateral Transport as a Source of Gaseous Emissions
The strategy is to identify specific biophysical processes at different stages of the erosion process which make the liberated material vulnerable to microbial processes, thus rendering the SOC released as a source of GHGs. It is important, however, that SOC mineralization during transport, which has significant implications regarding the impact of erosion on creating climate change feedback [7], is not overlooked. Similarly, reduction in mineralization at the deposition stage, deep burial, and re-aggregation must be appropriately accounted for. Indeed, the C sink/source at different stages depends on the mineralization rate of SOC along the transport pathways (stages I to III),at depositional sties (stages IV and V), and within the aquatic ecosystems (stage VI). It is, therefore, important to identify the control factors that affect the mineralization or stabilization of the SOC being transported.
The control factors at the eroding sites are those which affect agronomic productivity, the attendant dynamic replacement, and the net effect on the soil C budget. The dynamic replacement can also accentuate the priming effect and accelerate the mineralization of the exposed SOC. Vulnerability to decomposition at the eroding site is also affected by any changes in the microbial community. The mineralization of SOC during the transport is an important factor that can never be overlooked, and it is determined by the soil temperature and moisture regimes. Similarly, deep burial and reaggregation are important determinants of the fate of SOC at the depositional sites [7]. Enrichment of the sediments is an important indicator and a determinant of the fate of SOC being transported by erosional processes.
3. Enrichment of Sediments by Soil Organic Carbon
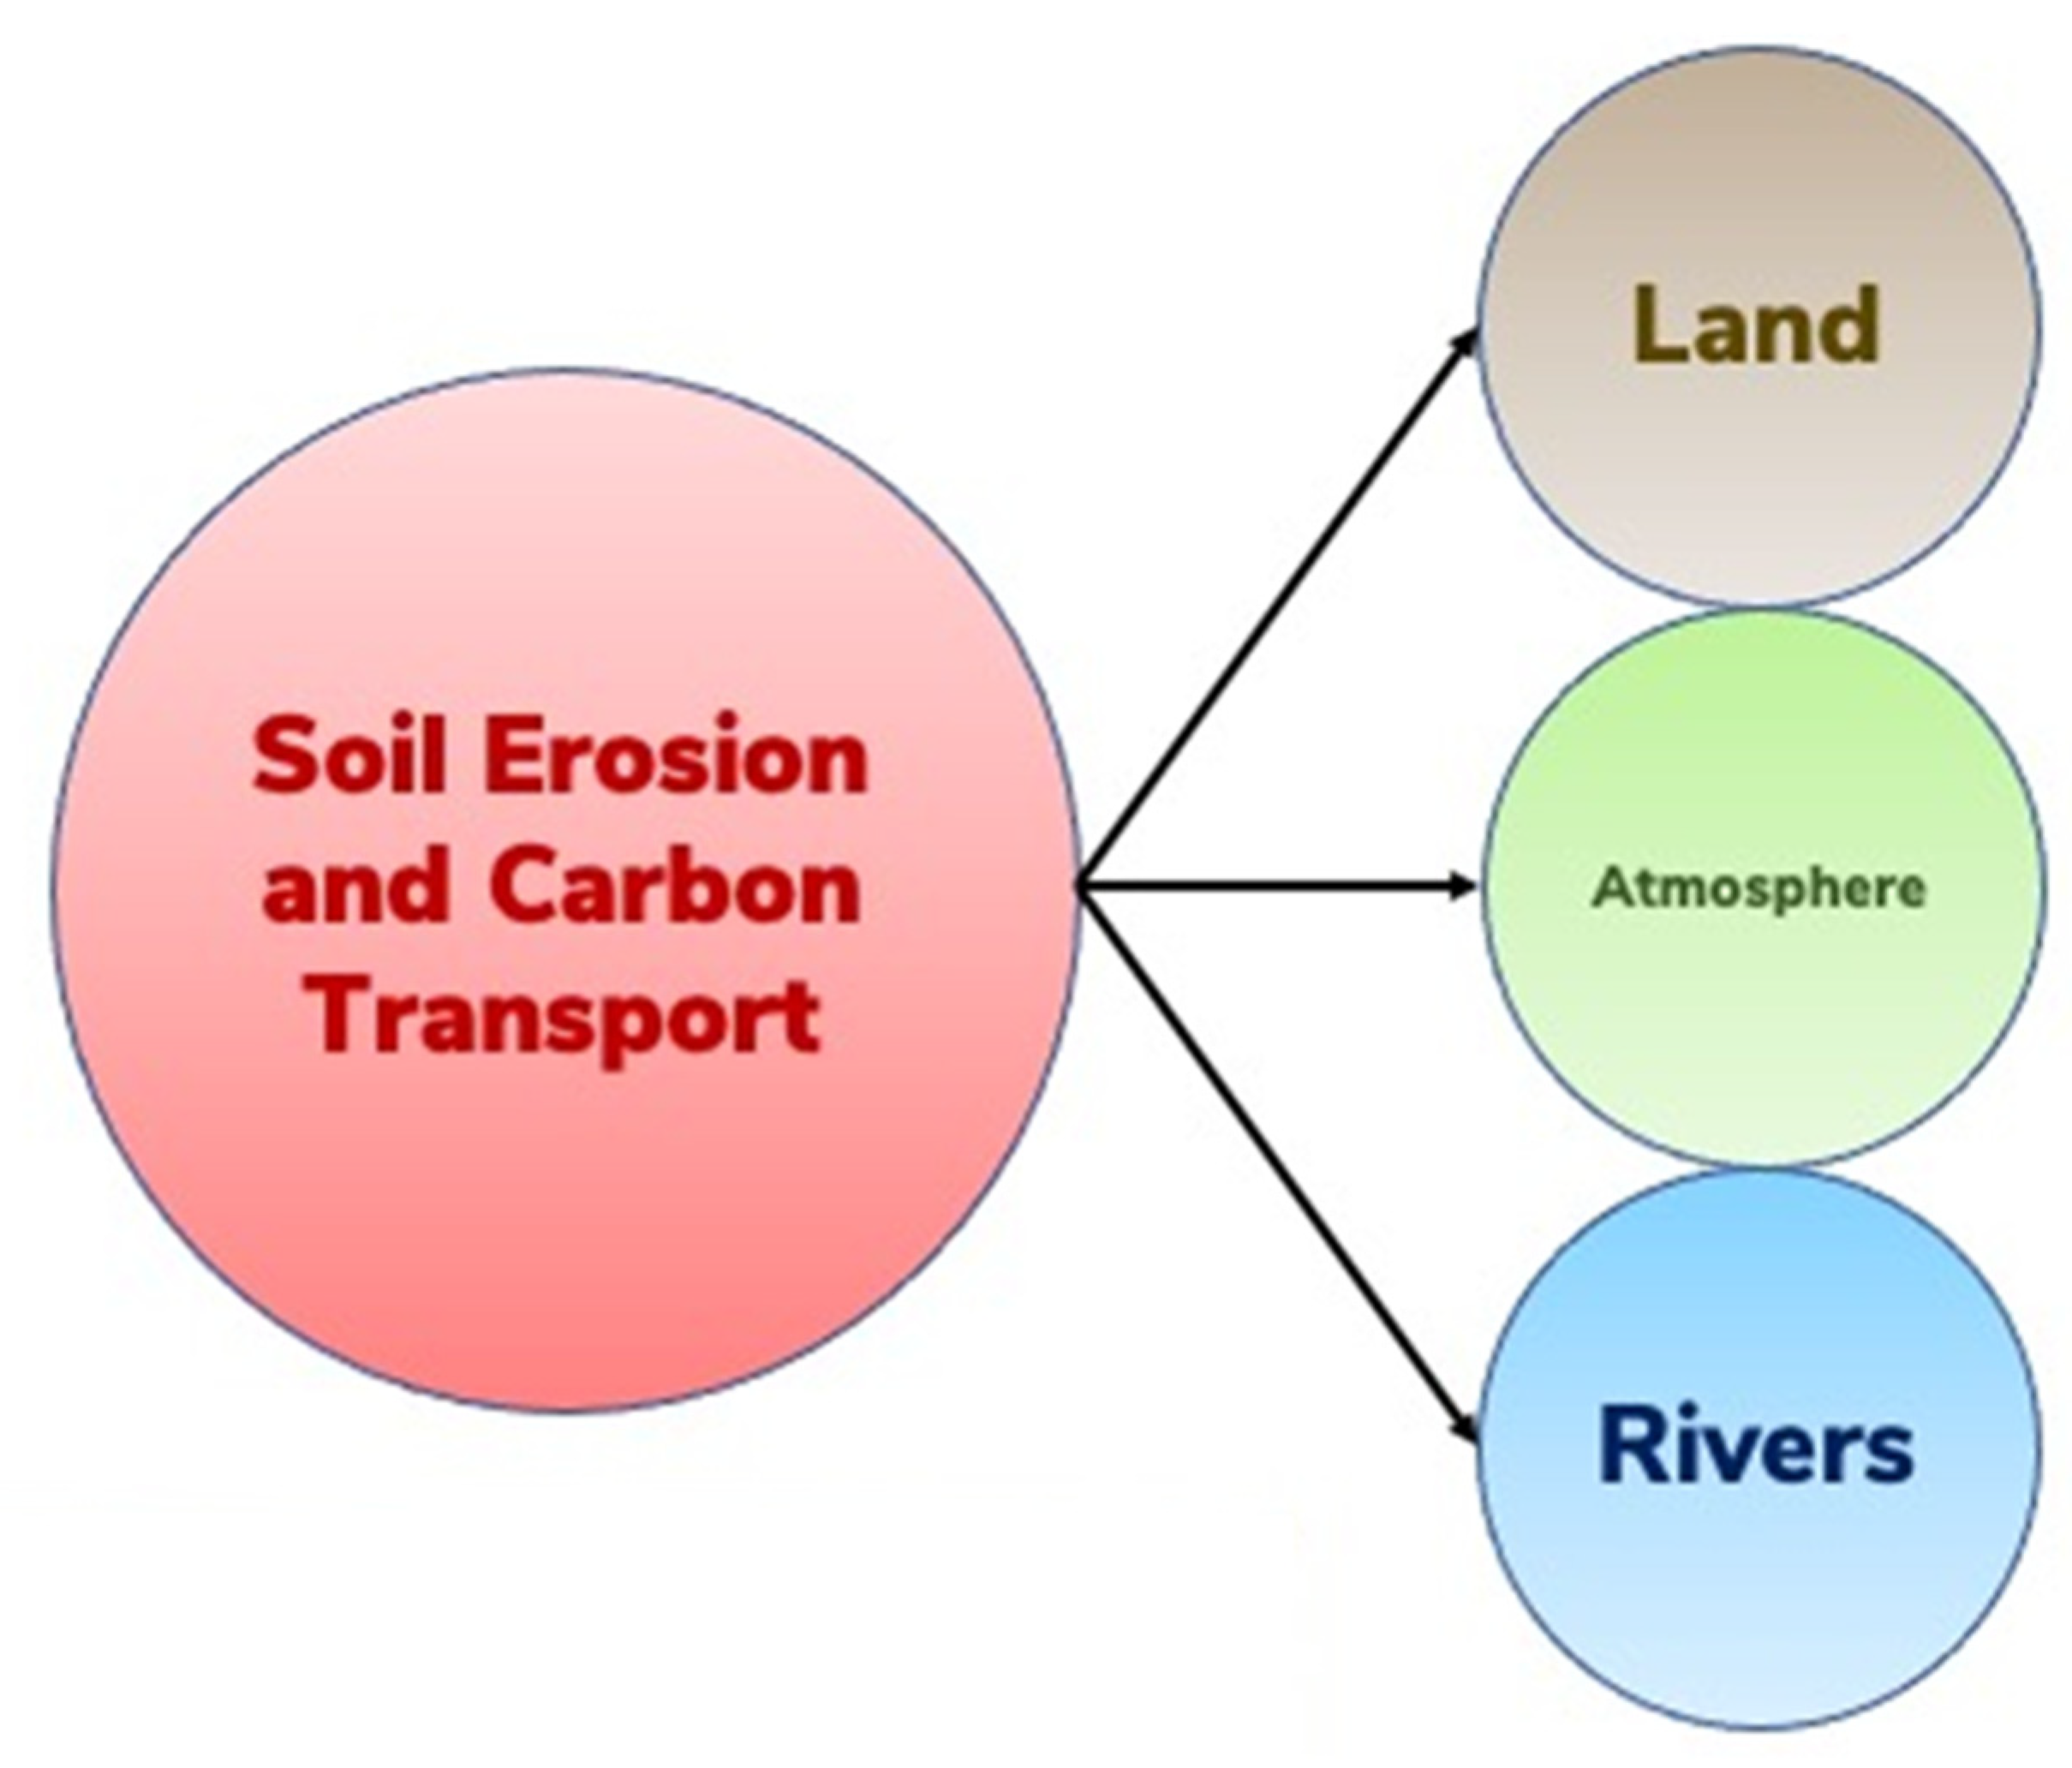
Accelerated soil erosion, due to water and wind, is a predominant process with a strong impact on the global C cycle and budget. Indeed, accelerated soil erosion, both by water and wind, affect properties of the land, atmosphere, and rivers (Figure 2), and erosional risks must be minimized through the adoption of judicious land use and of site-specific best management practices (BMPs). Climate change and the ever-increasing demands of the growing and progressively affluent human population will aggravate the soil erosion hazard. Globally, between 0.57 and 1.33 Pg C may already be transported by inter-rill soil erosion [8] because of its selectivity. Indeed, soil erosion leads to a preferential removal of the SOC fraction because it has a low bulk density (0.6–0.8 Mg/m3), and it is concentrated in the vicinity of the soil surface [9,10].
It is widely recognized that sediments have a high SOC enrichment ratio (SOC-ER) and soil organic nitrogen enrichment ratio (SON-ER), and thus are enriched in SOC/SON contents and other light fractions, which are selectively transported by hydric and aeolian processes. Based on a study of a grazed watershed of South Africa, Juarez et al. [11] observed that eroded sediments were enriched in SOC by a factor of 1.85 and in lignin by a factor of 3.7. The high lignin concentration indicated that it was less decomposed in eroded sediments than in the original soils. Further, a negative relationship was observed between the C:N ratio of eroded sediments and soil CO2 production, indicating that the microbial biomass could be N-limited. Juarez et al. [11] concluded that the SOC in eroded sediment consists primarily of undecomposed plant material, and it is mineralized to a greater extent, regardless of the landscape position. This is an important observation indicating the mineralization of eroded SOC and the emission of GHGs.
For dryland calcareous soils, Cunliffe et al. [12] observed that eroded sediment was significantly enriched in SOC. For a study located in the Tertiary Hills, about 40 km north of Munich, Germany, Wilken et al. [13] observed that sediments are highly enriched in SOC compared to the parent soil. In northeast China, Wei et al. [14] also observed that SOC was enriched in sediments, indicating a high selectivity of the erosion processes. Holz and Augustin [15] also observed that eroded sediments were enriched in C and N by 51.3% and 50.6%, respectively, and that both elements are stored in soil fractions that are selectively eroded. Both SOC-ER and SON-ER are affected by slope gradient and soil texture. However, the C:N ratio increased by 9.9%, indicating the preferential movement of C-rich particulate organic matter (POM) compared to N-rich mineral-associated organic matter (MAOM).
4. Enrichment Ratio for Rill versus Inter-Rill Erosional Processes
Despite the overall selectivity of hydric erosion, rill and inter-rill processes may have contrasting impacts on the SOC-ER of sediment. In general, inter-rill erosion (or soil splash) may indicate preferential removal over the rill process. Based on a laboratory rainfall and flume experiment, Schiettecattle et al. [16] observed that SOC-ER was not affected by rill erosion but varied between 0.9 and 2.6 for inter-rill (splash) erosion, and it was inversely related to the unit sediment discharge. In addition, physicochemical differences between the liberated and mobilized material and the residual raindrop-stable soil aggregates can be an important determinant of the composition of sediments. Moreover, based on a rainfall simulation study, Hou et al. [17] observed that liberated particles in all tilled (plowed) soil contained higher a concentration of oxidized lignin phenols, a lower proportion of cinnamyl to vanillyl lignin, and a trend toward a higher proportion of microbially processed N, which indicates a more decomposed microbial processed SOC. These characteristics indicate the preferential removal of some constituents by inter-rill erosion.
The water repellency of aggregates, caused by SOC content, may also affect aggregate stability [18] and thus, the properties of the liberated and mobilized materials during different erosional stages. For an oxisol from Hawaii, Sutherland et al. [19] observed the preferential detachment and transport of splashed aggregates within the size range of 250 to 2000 µm. They also observed that the kinetic energy required to detach 1 g SOC varied from a median of 1870 J for the 2000–4000 µm fraction to 120 J for the 425–850 µm fraction. Crust formation by the raindrop impact is another factor that affects SOC-ER [8], and the loss of biocrust can increase the loss of SOC by erosion [20]. The SOC loss by inter-rill erosion is also affected by the initial SOC content, rainfall pattern, and the primary particle size distribution [21].
5. Soil Carbon Dynamics at Different Stages of Soil Erosion and the Attendant Emission of Greenhouse Gases
The multi-stage process of soil erosion has a variable effect on the properties and the fate of the liberated and mobilized constituents.
5.1. Stage I: Detachment and Disruption of Soil Aggregates
Raindrop-induced disruption of soil aggregates, the first stage of the erosional process (Figure 1), is the dominant cause of splash, or inter-rill soil erosion. The SOC entrapped within the aggregates is exposed to microbial processes by the disruption of aggregates and the liberation of some materials. Change in pore-size distribution and soil–water matric potential may also affect microbial activity and thus, the vulnerability of the liberated material to decomposition and emission of GHGs. Mordhorst et al. [22] indicated that the mechanical disturbance of the soil structure can alter pore systems and thus, the CO2 effluxes. Physical influences may be overlapped by biological effects due to the higher energy supply to the microbes. Thus, the susceptibility of physical protection mechanism to SOC by the disruption of aggregates (structure) may also aggravate CO2 effluxes [22]. Wilken et al. [23] used the event-based multi-class sediment transport model regarding a 100-year time series of rainfall observation on a 3-ha agricultural catchment in Belgium. Based on the modeling analysis, Wilken et al. [23] concluded that: (a) inter-rill erosion is a selective process which erodes primary particles, (b) rill erosion is non-selective and erodes secondary particles (aggregates), (c) particulate organic carbon (POC) is mostly encapsulated within aggregates, and (d) the export of SOC-ER is the highest in events comprised primarily of inter-rill erosion. Holz and Augustin [15] observed that the breakdown of aggregates by rainfall energy may release POM, which is then preferentially eroded. Thus, SOC and plant nutrients are selectively moved during erosion.
5.2. Stage II: Redistribution over the Landscape
The second stage, involving redistribution of sediments over the landscape, depends on physiography and the slope-based flow patterns. In the Loess hilly-gully catchment of China, Liu et al. [24] observed that although check dams served as C and N storage and sequestration structures in the Loess hilly-gully region, erosion-induced C and N redistribution may be a major source of atmospheric CO2 and N2O. Based on an 11.3 m check dam sediment profile in the Loess Plateau region of China, Wang et al. [25] observed that check dams intercepted 98.5 Gg of eroded soil and 172.6 Mg of SOC. Between 1960 and 1990, a total of 89.7 Mg of SOC were lost during the soil erosion process at a rate of 0.17 Mg/ha. y, and accounted for approximately 30% of the total eroded SOC exported from the eroding areas. Wang et al. [25] concluded that the soil erosion process is an important net source of GHGs. In a Mediterranean catchment, Nadeu et al. [26] observed that over a 28-year period, 26% of the eroded C remained within the catchment’s hill slopes and was not homogenously distributed over the landscape. A modeling study conducted in the Nelson Farm watershed in Mississippi by Liu et al. [27] documented that those soils were consistently indicated as C sources to the atmosphere at all landscape positions. Nadeu et al. [26] observed that between 1870 and 1950, the lowest source strength was located at the eroding sites (13 to 24 gC/m2. y), the intermediate was at ridge-top (34 gC/m2. y), and the highest was at the depositional sites (42 to 49 gC/m2. y). Between 1950 and 1997, the soils at all landscape positions became C sinks because of the changes in management practices (e.g., genetic improvement, fertilization). The sink strengths were the highest at eroding sites (42 to 44 gC/m2. y), intermediate at the ridge top (35 gC/m2. y), and the lowest at the depositional site (26 to 29 gC/m2. y).
5.3. Stages III to V: Deposition, Deep Burial, and Re-Aggregation of Dispersed Soil
The discussions on the fate of C in stages III to V are combined because these involve inter-dependent processes of deposition, deep burial, and reaggregation of dispersed soil through the formation of organo-mineral complexes. The SOC-laden sediments are deposited on depressional sites, concave slopes, and foot slopes. The fate of SOC deposited on these sites depends on a range of factors such as soil temperature and moisture regimes, burial in the subsoil, and the degree of re-aggregation and the attendant formation of organo-mineral complexes or soil aggregates. The burial of transported C at the depositional sites is of critical importance. In the Yellow River Basin of China between 1950 and 2010, 134 ± 24.7 Pg of soil and 1.07 ± 0.15 Pg of SOC have been eroded. Approximately 63% of eroded soils were deposited in the river system and 37% were discharged into the ocean [28]. For SOC, approximately 0.53 ± 0.21 Pg (49.5%) was buried in the river systems, 0.25 ± 0.14 Pg (23.5%) was delivered into the ocean, and the remaining 0.289 ± 0.294 Pg (27%) was decomposed during the erosion/transport processes. Thus, Ran et al. [28] concluded that 20–40% of eroded SOC is oxidized after erosion, that the erosion-induced redistribution of soil is a significant source of SOC, and that human activities have and are altering its redistribution pattern.
Understanding the fate of the buried SOC is critical to compiling a credible and accurate global C budget. Wang et al. [29] used a numerical model to simulate long-term C dynamics in colluvial soils and observed that the C-burial efficiency (the ratio of current C content of the buried sediments to the original C content at the time of sedimentation) of deposited sediments may decrease over time, reaching a level of equilibrium. Half of the buried C at depositional sites may be lost over ~300 y, and the rate of depletion of SOC at the depositional site may be accelerated by agricultural management [29]. He et al. [30] studied the fate of SOC across two topo-sequences (convex and concave) over a long gentle slope in the northeast China. He et al. [30] observed that the net loss of surface soil along the eroding convex segment resulted in a greater depletion of SOC than that along the depositional concave segment. Soil re-aggregation at the deposition site can transform highly mobile-C rich fine primary particles into rather immobile soil aggregates [23]. Wang et al. [29] observed that buried SOC in colluvial profiles was more stable with a turnover time at the centennial scale. However, Ma et al. [31] observed that SOC at the depositional sites may be vulnerable to severe losses due to change in environmental factors. For example, a study in the karst graben basin of China by Lan et al. [32] showed that there was a higher concentration of SOC at the depositional sites relative to the upland soils. However, there was also a higher decomposition rate of SOC at the depositional sites than at the eroding sites, particularly under the farmland conditions. Similarly, Mao et al. [33] also observed that deposition increased C emission under both drying and wetting conditions for Ultisol and Entisol. In a Mollisol, however, C emissions increased under drying, but decreased under wetting conditions. Therefore, the effects of deposition on C emissions are regulated by soil texture and moisture regimes, and the development of macropores due to shrinkage in depositional soils increased both soil water evaporation and the attendant C emissions [33].
5.4. Stage VI: Fate of Soil Carbon in Aquatic Ecosystems
There are several factors that affect CO2 emission from reservoirs or aquatic ecosystems. Important among these are temperature, oxygen level, properties of SOM and sediments, primary production, etc. For a study in a sub-tropical hypoxic reservoir in southeastern China, Yan et al. [34] observed that an increased supply of organic matter from storm runoff and to a lesser extent, primary production in summer, enhanced subsequent oxygen consumption. Yan et al. [34] also observed that the surface reservoir was usually a source of CO2, except in summer, due to high primary productivity. The anaerobic respiration of OM can lead to CH4 emission. Townsend-Small et al. [35] estimated that Lake Erie emits 1.3 ± 0.6 × 10⁵ kg CH4 -C/d in late summer, with 30% of CH4 derived from natural gas infrastructure. In addition to O2 availability, other factors included sub-surface currents and high winds, which may also affect CH4 efflux. The potential increase in precipitation, algal biomass, and the attendant incidence of hypoxia may aggravate the efflux of CH4, leading to positive climate change feedback [35].
River ecosystems have also been reported to generate N2O efflux. A study in the Yellow River of China by Ma et al. [31] indicated N2O concentrations in the lower reaches of 8.78 to 24.26 nmol/L. Total N2O flux from the Yellow River to the Bohai Sea was about 2.27 × 10⁵ mol/y. Ma et al. [31] observed an 8-fold increase in N2O flux at the beginning of the water sediment regulation, and the increase may be due to stimulation of nitrification in the water column.
Crawford et al. [36] measured CO2 and CH4 concentrations and emissions in a headwater stream network of interior Alaska and identified consistent areas of elevated CO2 and CH4. Likewise in Alaska, Ko et al. [37] also observed that watershed slope and precipitation interact to control gaseous C fluxes from the stream, reporting the highest efflux from low-gradient watersheds following rainstorms.
Riparian ecosystems and flood plains also impact the global C cycle. A study in a Thur River flood plain (northeastern Switzerland) by Shrestha et al. [38] showed that soil–water content and C availability were the key determinants controlling N pools and processes. These two factors strongly depended on the sedimentation and inundation dynamics. Shrestha and colleagues also observed locally high N2O efflux. A study in the Prairie Pothole Region of Manitoba, Canada, by Gao et al. [39] showed that spring thaw increased the concentrations and contents of N2O at 15 to 35 cm in the lower and riparian area before reaching the soil surface. Furthermore, the riparian area consistently exhibited the highest CH4 emissions. Gao et al. [39] observed that these spikes in CH4 occurred after the spring thaw N2O emissions, with the accumulation of CH4 and a decline in O2 concentration. Whereas lakes are considered as sinks for sediment-laden C, Yang et al. [40] reported that lakes can be super-saturated with CO2 and CH4, thus emitting these GHGs. The ratio of C emission into the atmosphere to C burial into the sediment was 0.08 for Lake Donghou, China. Yang et al. [40] estimated that gaseous C emission accounted for 15% of the total C output.
6. General Discussion on the Fate of Soil Organic Carbon Transported by Hydric Erosion
The review presented indicates that the impact of erosion on SOC dynamics differs among sites of erosion and deposition, as well as during transport, along with the confounding effects of soil and crop management practices (Table 1). The important determinants of the fate of SOC being transported by erosional processes on a landscape are: (a) the detachment of sediments and SOC, (b) the net primary production at the eroding site, and (c) the changes in mineralization upon transport and deposition because of aggregate breakdown and deep burial, respectively. Thus, Kirkels et al. [41] proposed an eco-geomorphic approach. The latter includes a physical and biological approach to understand the fate of SOC transported by erosion.

Table 1.
Research studies which indicate the efflux of CO2 and other greenhouse gases at different stages of hydric erosion.
Table 1.
Research studies which indicate the efflux of CO2 and other greenhouse gases at different stages of hydric erosion.
| Stage | Pedological Process | References |
|---|---|---|
| I. Detachment | Increased access of SOC to microbial processes. | |
| II. Redistribution | GHG emission is affected by physiography and slope-based flow patterns. | |
| III–V. Deposition | Efflux of gases is controlled by soil temperature and moisture regimes, burial of SOC in subsoil, and re-aggregation. | |
| VI. Aquatic Ecosystems | O2 levels, CO2 and CH4 concentration, temperatures, properties of sediments and SOM, watershed slope, supersaturation of lakes. |
The sink/source phenomena depend on which mechanisms are dominant during different stages (Figure 1). Thus, understanding SOC dynamics during specific stages of soil erosion is essential to accurately assess the net effect of erosion on the soil C budget. There is a strong knowledge gap regarding the fate of SOC between the disruption of soil aggregates from the eroding site (stage I) through the transport and redistribution stage (stage II) and depositional/burial site (stage III). The transport of SOC subjects it to changing moisture and temperature regimes (environmental conditions) which alter the protective mechanisms (physical, chemical, biological, ecological). Thus, a thorough understanding of the fate of SOC during the transport and redistribution stages is critical to assessing the source/sink phenomena [42].
Re-aggregation at the depositional sites may also enhance the stabilization of SOC. In the Belgian Loess Belt, for example, Wang et al. [43] observed that the deposition of eroded soil material significantly increased SOC content, as well as the microbial biomass C, throughout the 2 m depth of the soil profile. Wang et al. [43] also reported reduced C mineralization that contributed to C accumulation, as was observed in depositional sites. They attributed the reduced C mineralization to the composition of the microbial community after burial of the SOC-rich material. Reduced mineralization may partly be due to encapsulation of SOC within stable aggregates, thereby reducing physical access to microbial processes [44,45].
Vandenbygaart et al. [46] reported significant effects of erosion on both the lateral and vertical distribution of soil in agricultural landscapes in different agroecosystems across Canada over a 50-year period. The deepest aggraded profile was observed in potato fields, which contained more than 70 cm of deposited soil, accounting for 152 Mg/ha. y. The rate of deposition in some fields was as much as 4090 Mg/ha. y. Vandenbygaart et al. [46] also reported the largest stock of SOC at a 463 Mg/ha. y. to 60 cm depth, and the attendant SOC deposition rate was 2 to 4 Mg C/ha. y. across all sites. Furthermore, a large increase was observed in SOC concentration near the bottom of the A horizon, and there was also some evidence of the dynamic replacement of SOC in eroded soils. Analytical data show that the mineralization of buried SOC has been constrained since burial.
The buried SOC in alluvial depositional zones, accounting for 75% of the total SOC pool, may serve as a centennial to a millennial time scale C sink [47]. Soil alkalinity may be another factor affecting the resilience of buried SOC against microbial activities [47]. However, the quality rather than quantity of SOC is an important determinant of soil biological properties and the fate of C after its burial in depositional sites [48]. Furthermore, the time lag between burial and the subsequent loss of SOC can be an important factor affecting the mean residence time (MRT) of the deposited SOC.
Van Oost et al. [49] reported that the C buried in eroded terrestrial deposits during the agricultural expansion of the last 150 y. cannot be assumed to be inert to further destabilization, and thus, it may become a significant C source. Indeed, the buried SOC may be vulnerable to future loss by land use, management, alkalinity or pH, the time lag between burial and subsequent loss, mineralogical properties, and global warming. Mineralogical attributes of sediments are also important because of their effects on continuous soil weathering, along with mineral alterations and the breakdown of aggregates, which temporarily limit the protection of SOC by minerals and within aggregates. Continuous soil weathering can weaken the protection mechanisms and render the deposited SOC a source of emission [45]. Thus, the best option is to minimize the risks of the accelerated soil erosion of agroecosystems through the adoption of conservation-effective practices.
7. Fate of Soil Carbon Transported by Aeolian Processes
Aeolian processes are dominant in arid regions, but both hydric and aeolian processes are causes of accelerated erosion in semi-arid regions. Globally, wind erosion may affect 0.6 B ha of land [50]. Wind erosion also involves different stages: detachment, saltation, wind-blown dust, and deposition. Similar to hydric erosion, wind erosion is also a selective process which leads to a significant lateral transport of C and fine clay fraction. Wind-blown dust leads to a long-range transport on an inter-continental scale. Examples include North African dust plumes over the Atlantic Ocean, summer dust plumes from the Arabian Peninsula over the Arabian Sea and the Indian Ocean, and spring dust plumes from East Asia over the Pacific Ocean [51]. These dust plumes strongly affect the radiation budget, the hydrologic cycle, and the global C budget. Depending on the magnitude of C being transported, distributed, and deposited/buried, a significant amount may be emitted as CO2 (and other GHGs) into the atmosphere.
SOC stocks are strongly reduced in soils prone to wind erosion. In Western Australia, Chappell and Baldock [52] estimated that the mean net SOC erosion was up to 0.2 Mg C/ha. y for the period of 1990 to 2013. Moreover, in southwestern Australia, wind erosion resulted in the loss of up to 3% of the total stock of C to 1-m depth or 3.6 Mg C/ha for the eroded soils. In the Texas High Plains, McDonald et al. [53] observed that a greater amount of CO2-C was being assimilated by the wheat cover crop from the atmosphere than was lost from the soil, which reduced the net C losses from the soil. However, the erosion-related loss of SOC from wind erosion could be more severe during the fallow phase of the rotation cycle. Thus, farmers must be especially judicious in protecting the soil against SOC loss by wind erosion during the fallow phase in the Pacific Northwest region of the U.S. [54]. Similar to the high risks of wind erosion from croplands on plowed fields during the fallow phase, overgrazing can also reduce SOC content in the long term.
The loss of nutrients (N, P, K, and C) by wind erosion is mostly attributed to losses by suspension, because suspension preferentially removes the finest—and thus the lightest—fractions. However, the greatest mass of the sediment is removed by saltation. Thus, the majority of the nutrients and C may also be moved by saltation. Visser and Sterk [55] observed that nutrient losses from one field during one event in the Sahel realm of Africa can be as much as 73% of the N and 100% of the P requirements of crop production. A study conducted in a desert grassland of Southern New Mexico, USA, by Li et al. [56] showed the dramatic increase in wind erosion between 75% grass cover reduction and 100% grass cover reduction, suggesting that sparsely distributed mesquites are rather ineffective at reducing wind erosion and nutrient loss compared to grasses.
8. Selectivity of the Aeolian Process
Similar to hydric erosion, gaseous emissions are also affected at different stages of wind erosion (Table 2). Lighter fractions (SOC, clay, and fine silt) are also selectivity removed in wind-blown dust. Towards an attempt to understand the magnitude and mechanism of SOC-ER in dust, using Big Spring Number Eight (BSNE) wind-vane samplers across five land types in rangelands of Western Queensland, Australia, Webb et al. [57] observed that sandy soils and finer particulate quartz-rich soils are more efficient at SOC emission and have larger SOC-ER in dust than that in clay-rich aggregated soils.
Table 2.
Gaseous emissions at different stages of aeolian erosion processes.
| Stage | Processes | References |
|---|---|---|
| I. Detachment | Sandy and particulate quartz-rich soil, local topography, wind velocity. | |
| II. Saltation | Mobile sand dunes, vegetation cover, soil temperature. |
|
| III–V. Deposition, Deep Burial, and Re-Aggregation | Buried SOC; climate change, anthropogenic perturbations, fallow phase of the rotation cycle. |
The SOC-ER of dust originating from sand-rich soil ranged from 2–41. Webb et al. [57] observed that two dust samples from regional transport events contained 15–20% SOC.
In addition to texture, wind speed also affects SOC-ER. Using a wind tunnel on a manured sandy soil, Munch et al. [58] observed that wind erosion caused a preferred release of manure particles at wind speeds close to the threshold of 7 m/s, with the greatest sorting effects in size, shape, and density the of particles. Munch and colleagues concluded that wind erosion immediately leads to the loss of added organic material. At higher wind speeds, Munch et al. observed that the sediment composition corresponds to the entire soil or soil-manure mixture. Depending on the wind speed and the magnitude of erosion, the loss of manure ranged from 1.7–14% of the fertilization rate.
Wind velocity interacts closely with the local topography, as a factor affecting sediment transport by wind erosion. Based on studies involving simulation or dust transport from a mine tailing using a computational fluid dynamics model, Stovern et al. [59] observed that local topography and wind velocity profiles are the major factors that influence deposition.
In a study involving sandy dunes in Southeastern Niger, Touré et al. [60] observed that saltation flux on the bare mobile dune was 2–40 times higher than that observed from cultivated fields and rangelands. Touré and colleagues measured the annual fluxes on the dune to be from 2000 to 6000 kg/m2, due to the variability of the wind from year to year.
Soil temperature is also among the major factors controlling desert soil CO2 flux [61]. In the Horqin Sandy Land, northeastern China, Luo et al. [63] observed that soil temperature at a depth of 20 cm was significantly correlated with soil respiration. The autotrophic respiration (Ra) was more sensitive to soil temperature than the heterotrophic respiration (Rh), and the temperature-sensitivity coefficients (Q10) were 3.39, 2.52, and 2.79 for Ra, Rh, and Rt, respectively.
Vegetation cover plays an important role in wind erosion and loss of SOC by dust-blown sediments. In a desert grassland of southern New Mexico, USA, Li et al. [56] observed that wind erosion rates and loss by dust emissions (nutrients including C) are strongly affected by plant cover. The observed dramatic increase in wind erosion between 75% grass cover reduction and 100% grass cover reduction may be due to the ineffectiveness of sparsely distributed mesquites in reducing wind erosion and nutrient loss. Over three windy seasons (March 2004 to July 2006), wind erosion removed up to 25% of total organic C (TOC) and total N (TN) from the top 5 cm of soil, and about 60% of TOC and TN during the first windy season (March–July 2004). They estimated that the lifetime of surface soil TOC and TN was about 10 y on these plots because of the 100% grass cover reduction. This drastic impact indicates the disastrous effects of accelerated wind erosion on soil resources which can occur even over short times periods [56]. Belnap et al. [64] estimated that aeolian deposition can provide up to 75% of essential plant nutrients (N, P, K, Mg, Na, Mn, Cu, Fe) through the mineralization of the deposited SOC. Therefore, understanding fate of deposited/buried SOC is critical.
9. Fate of Buried Soil Organic Carbon
Understanding the fate of C buried at depositional sites during stages III to V of the erosional process is important for determining the fate of C transported by erosional processes driven by water and wind. Knowing whether the buried soil C is a source or sink and determining the dominant processes which govern its turnover time is critical to understanding the fate of C transported by erosional processes. Despite being a globally important process, its fate under site-specific conditions is not widely understood. Chaopricha et al. [62] observed that the buried SOC concentration on a global scale can rival those of surface soils. Indeed, buried soils can contain significant regional SOC reservoirs which are not accounted for in current inventories and biogeophysical or biogeochemical models. Chaopricha et al. [62] hypothesized that buried SOC stocks may cycle biologically on annual to decade timescales because of the alteration of processes that contribute to their protection. Buried SOC can be vulnerable to emissions because of climate change and anthropogenic perturbations. The fate of buried SOC must be duly considered in terms of its role in creating positive feedback to climate change.
10. Conclusions
Accelerated erosion is among the most dominant soil degradation processes globally. It is a selective process involving preferential removal of SOC along with fine particles. Thus, erosion leads to the lateral transport of SOC over the landscape, which may be vulnerable to decomposition and the attendant gaseous emissions (CO2, CH4, N2O), with positive feedback to climate change. The synthesis of the literature supports the following conclusions.
The synthesis of the literature presented herein proves the specific hypotheses that the SOC transported during stages I to III is a major source of GHGs, and the magnitude of the emission depends on site-specific temperature and moisture regimes and other physiographic and pedological conditions. The deep burial and reformation of aggregates (stages IV and V)can reduce the rate of mineralization. However, the prevalence of anaerobic conditions at depositional sites may aggravate methanogenesis, leading to the emission of CH4 and the nitrification and denitrification processes leading to the emission of N2O. The net effect of the erosional process, from stage I through the transport in aquatic ecosystems (stage VI), may lead to the emission of GHGs. Despite the local and global significance, the magnitude of soil C being transported by the erosional processes is not currently being accounted for in local, regional, national, and global C budgets, but it must be duly accounted for. Furthermore, the re-distribution of C over the landscape and its deep burial does not indicate a sequestration of new C within the landscape. Any redistribution of SOC or SIC over the landscape is not to be confused with sequestration.
Key conclusions from the review are as follows:
- a.
- Sediment transported by the hydric and aeolian process are enriched with SOC and have a high SOC-ER and SON-ER;
- b.
- Whereas erosion-induced transport of SOC is prone to mineralization and exposure to microbial processes, emissions are relatively high at stages I to III of the hydric processes;
- c.
- Gaseous emissions are also observed at the depositional sites and in the aquatic ecosystems (e.g., river, riparian zone, lakes, and oceans, stage VI);
- d.
- Loess deposits are also prone to mineralization and GHG emissions;
- e.
- Re-carbonatization and deep burial of SOC may limit mineralization of SOC;
- f.
- Lateral transport of SOC by erosional processes to deposition and burial in depressional sites (stages III to V)and aquatic ecosystems(stage VI) is redistribution rather than a new sequestration of atmospheric CO2;
- g.
- Buried SOC may be vulnerable to decomposition because of the climate change and other anthropogenic activities, leading to the emission of CO2, CH4, and N2O;
- h.
- Thus, a prudent strategy is to minimize the risks of soil erosion through the adoption of judicious land use and site-specific BMPs.
Funding
This research received no external funding and was funded by the CFAES Rattan Lal Center for Carbon Management and Sequestration.
Institutional Review Board Statement
Not applicable.
Informed Consent Statement
Not applicable.
Data Availability Statement
Data and Research cited in the text and tables in support of the contents have been appropriately sourced in the bibliography.
Conflicts of Interest
References
- Borrelli, P.; Robinson, D.A.; Panagos, P.; Lugato, E.; Yang, J.E.; Alewell, C.; Wuepper, D.; Montanarella, L.; Ballabio, C. Land use and climate change impacts on global soil erosion by water (2015–2070). Proc. Natl. Acad. Sci. USA 2020, 117, 21994–22001. [Google Scholar] [CrossRef] [PubMed]
- Lal, R. Soil Erosion and the Global C Budget. Environ. Int. 2003, 29, 437–450. [Google Scholar] [CrossRef]
- Friedlingstein, P.; Jones, M.W.; O’Sullivan, M.; Andrew, R.M.; Bakker, D.C.E.; Hauck, J.; Le Quéré, C.; Peters, G.P.; Peters, W.; Pongratz, J.; et al. Global Carbon Budget 2021. Earth Syst. Sci. Data 2022, 14, 1917–2005. [Google Scholar] [CrossRef]
- Oertel, C.; Matschullat, J.; Zurba, K.; Zimmermann, F.; Erasmi, S. Greenhouse gas emissions from soils—A review. Geochemistry 2016, 76, 327–352. [Google Scholar] [CrossRef] [Green Version]
- Bouchoms, S.; Wang, Z.; Vanacker, V.; Doetterl, S.; Van Oost, K. Modelling long-term soil organic carbon dynamics under the impact of land cover change and soil redistribution. CATENA 2017, 151, 63–73. [Google Scholar] [CrossRef]
- Olson, K.R.; Al-Kaisi, M.; Lal, R.; Lowery, B. Experimental considerations, treatment and methods in determining soil organic carbon sequestration rates. Soil Sci. Soc. Am. J. 2014, 78, 348–360. [Google Scholar] [CrossRef] [Green Version]
- Xiao, H.; Li, Z.; Chang, X.; Huang, B.; Nie, X.; Liu, C.; Liu, L.; Wang, D.; Jiang, J. The mineralization and sequestration of organic carbon in relation to agricultural soil erosion. Geoderma 2018, 329, 73–81. [Google Scholar] [CrossRef]
- Kuhn, N.J.; Armstrong, E.K.; Ling, A.C.; Connolly, K.L.; Heckrath, G. Interrill erosion of carbon and phosphorus from conventionally and organically farmed Devon silt soils. CATENA 2010, 91, 94–103. [Google Scholar] [CrossRef]
- Lal, R.; Monger, C.; Nave, L.; Smith, P. The role of soil in regulation of climate. Philos. Trans. R. Soc. B-Biol. Sci. 2021, 376, 20210084. [Google Scholar] [CrossRef]
- Lal, R. Biophysical Controls That Make Erosion-Transported Soil Carbon a Source of Greenhouse Gases. Appl. Sci. 2022; 12, in press. [Google Scholar]
- Juarez, S.; Rumpel, C.; Mchunu, C.; Chaplot, V. Carbon mineralization and lignin content of eroded sediments from a grazed watershed of South-Africa. Geoderma 2011, 167–168, 247–253. [Google Scholar] [CrossRef]
- Cunliffe, A.M.; Puttock, A.K.; Turnbull, L.; Wainwright, J.; Brazier, R.E. Dryland, calcareous soils store (and lose) significant quantities of near-surface organic carbon. J. Geophys. Res. Earth Surf. 2016, 121, 684–702. [Google Scholar] [CrossRef] [Green Version]
- Wilken, F.; Sommer, M.; Van Oost, K.; Bens, O.; Fiener, P. Process-oriented modelling to identify main drivers of erosion-induced carbon fluxes. Soil 2017, 3, 83–94. [Google Scholar] [CrossRef] [Green Version]
- Wei, S.; Zhang, X.; McLaughlin, N.B.; Chen, X.; Jia, S.; Liang, A. Impact of soil water erosion processes on catchment export of soil aggregates and associated SOC. Geoderma 2017, 294, 63–69. [Google Scholar] [CrossRef]
- Holz, M.; Augustin, J. Erosion effects on soil carbon and nitrogen dynamics on cultivated slopes: A meta-analysis. Geoderma 2021, 397, 115045. [Google Scholar] [CrossRef]
- Schiettecatte, W.; Gabriels, D.; Cornelis, W.M.; Hofman, G. Enrichment of Organic Carbon in Sediment Transport by Interrill and Rill Erosion Processes. Soil Sci. Soc. Am. J. 2008, 72, 50–55. [Google Scholar] [CrossRef] [Green Version]
- Hou, T.; Berry, T.; Singh, S.; Hughes, M.N.; Tong, Y.; Papanicolaou, A.T.; Wacha, K.M.; Wilson, C.G.; Chaubey, I.; Filley, T.R. Control of tillage disturbance on the chemistry and proportion of raindrop-liberated particles from soil aggregates. Geoderma 2018, 330, 19–29. [Google Scholar] [CrossRef]
- Korenkova, L.N.; Matúš, P. Role of water repellency in aggregate stability of cultivated soils under simulated raindrop impact. Eurasian Soil Sci. 2015, 48, 754–758. [Google Scholar] [CrossRef]
- Watung, R.; Sutherland, R.; El-Swaify, S. Influence of rainfall energy flux density and antecedent soil moisture content on splash transport and aggregate enrichment ratios for a Hawaiian Oxisol. Soil Technol. 1996, 9, 251–272. [Google Scholar] [CrossRef]
- Chamizo, S.; Rodríguez-Caballero, E.; Román, J.R.; Cantón, Y. Effects of biocrust on soil erosion and organic carbon losses under natural rainfall. CATENA 2017, 148, 117–125. [Google Scholar] [CrossRef]
- Parwada, C.; Van Tol, J. Influence of litter source on soil splash rates and organic carbon loss in different soil horizons. Water SA 2019, 45, 12–19. [Google Scholar] [CrossRef] [Green Version]
- Mordhorst, A.; Peth, S.; Horn, R. Influence of mechanical loading on static and dynamic CO2 efflux on differently textured and managed Luvisols. Geoderma 2014, 219–220, 1–13. [Google Scholar] [CrossRef]
- Wilken, F.; Fiener, P.; Van Oost, K. Modelling a century of soil redistribution processes and carbon delivery from small watersheds using a multi-class sediment transport model. Earth Surf. Dyn. 2017, 5, 113–124. [Google Scholar] [CrossRef] [Green Version]
- Liu, C.; Li, Z.; Chang, X.; He, J.; Nie, X.; Liu, L.; Xiao, H.; Wang, D.; Peng, H.; Zeng, G. Soil carbon and nitrogen sources and redistribution as affected by erosion and deposition processes: A case study in a loess hilly-gully catchment, China. Agric. Ecosyst. Environ. 2018, 253, 11–22. [Google Scholar] [CrossRef]
- Wang, S.; Feng, Q.; Zhao, W.; Fu, B.; Ding, J. Ecosystem service trade-offs and their influencing factors: A case study in the Loess Plateau of China. Sci. Total. Environ. 2017, 607–608, 1250–1263. [Google Scholar]
- Nadeu, E.; Van Oost, K.; Boix-Fayos, C.; De Vente, J. Importance of land use patterns for erosion-induced carbon fluxes in a Mediterranean catchment. Agric. Ecosyst. Environ. 2014, 189, 181–189. [Google Scholar] [CrossRef]
- Liu, S.; Bliss, N.; Sundquist, E.; Huntington, T. Modeling carbon dynamics in vegetation and soil under the impact of soil erosion and deposition. Glob. Biogeochem. Cycles 2003, 17. [Google Scholar] [CrossRef] [Green Version]
- Ran, L.; Lu, X.X.; Xin, Z. Erosion-induced massive organic carbon burial and carbon emission in the Yellow River basin, China. Biogeosciences 2014, 11, 945–959. [Google Scholar] [CrossRef] [Green Version]
- Wang, Z.; Van Oost, K.; Govers, G. Predicting the long-term fate of buried organic carbon in colluvial soils. Glob. Biogeochem. Cycles 2014, 29, 65–79. [Google Scholar] [CrossRef]
- He, Y.; Hu, Y.; Gao, X.; Wang, R.; Guo, S.; Li, X. Minor topography governing erosional distribution of SOC and temperature sensitivity of CO2 emissions: Comparisons between concave and convex toposequence. J. Soils Sediments 2020, 20, 1906–1919. [Google Scholar] [CrossRef]
- Ma, X.; Zhang, G.-L.; Liu, S.-M.; Wang, L.; Li, P.-P.; Gu, P.-P.; Sun, M.-S. Distributions and fluxes of nitrous oxide in lower reaches of Yellow River and its estuary: Impact of water-sediment regulation. Estuarine Coast. Shelf Sci. 2016, 168, 22–28. [Google Scholar] [CrossRef]
- Lan, G.; Liu, C.; Wang, H.; Tang, W.; Wu, X.; Yang, H.; Tu, L.; Hu, B.X.; Cao, J.; Li, Q. The effect of land use change and soil redistribution on soil organic carbon dynamics in karst graben basin of China. J. Soils Sediments 2021, 21, 2511–2524. [Google Scholar] [CrossRef]
- Mao, N.; Li, W.; Wei, X.; Shao, M. Soil moisture- and texture-dependent effects of soil deposition on evaporation and carbon emission. Soil Tillage Res. 2020, 204, 104703. [Google Scholar] [CrossRef]
- Yan, J.; Chen, N.; Wang, F.; Liu, Q.; Wu, Z.; Middelburg, J.J.; Xie, Y.; Guo, W.; Zhang, X. Interaction Between Oxygen Consumption and Carbon Dioxide Emission in a Subtropical Hypoxic Reservoir, Southeastern China. J. Geophys. Res. Biogeosci. 2021, 126. [Google Scholar] [CrossRef]
- Townsend-Small, A.; Disbennett, D.; Fernandez, J.M.; Ransohoff, R.W.; Mackay, R.; Bourbonniere, R.A. Quantifying emissions of methane derived from anaerobic organic matter respiration and natural gas extraction in Lake Erie. Limnol. Oceanogr. 2016, 61, S356–S366. [Google Scholar] [CrossRef] [Green Version]
- Crawford, J.T.; Striegl, R.G.; Wickland, K.P.; Dornblaser, M.M.; Stanley, E.H. Emissions of carbon dioxide and methane from a headwater stream network of interior Alaska. J. Geophys. Res. Biogeosci. 2013, 118, 482–494. [Google Scholar] [CrossRef]
- Ko, J.; Lee, J.; Kang, H. Effects of micro-topography on N2O emission from sediments in temperate streams. Ecol. Eng. 2020, 155, 105906. [Google Scholar] [CrossRef]
- Shrestha, J.; Niklaus, P.; Frossard, E.; Samaritani, E.; Huber, B.; Barnard, R.L.; Schleppi, P.; Tockner, K.; Luster, J. Soil Nitrogen Dynamics in a River Floodplain Mosaic. J. Environ. Qual. 2012, 41, 2033–2045. [Google Scholar] [CrossRef]
- Gao, X.; Tenuta, M.; Nelson, A.; Sparling, B.; Tomasiewicz, D.; Mohr, R.M.; Bizimungu, B. Effect of nitrogen fertilizer rate on nitrous oxide emission from irrigated potato on a clay loam soil in Manitoba, Canada. Can. J. Soil Sci. 2013, 93, 1–11. [Google Scholar] [CrossRef] [Green Version]
- Yang, H.; Xing, Y.; Xie, P.; Ni, L.; Rong, K. Carbon source/sink function of a subtropical, eutrophic lake determined from an overall mass balance and a gas exchange and carbon burial balance. Environ. Pollut. 2008, 151, 559–568. [Google Scholar] [CrossRef]
- Kirkels, F.; Cammeraat, L.; Kuhn, N. The fate of soil organic carbon upon erosion, transport and deposition in agricultural landscapes—A review of different concepts. Geomorphology 2014, 226, 94–105. [Google Scholar] [CrossRef]
- de Nijs, E.; Cammeraat, E.L. The stability and fate of Soil Organic Carbon during the transport phase of soil erosion. Earth-Sci. Rev. 2020, 201. [Google Scholar] [CrossRef]
- Wang, X.; Cammeraat, L.H.; Wang, Z.; Zhou, J.; Govers, G.; Kalbitz, K. Stability of organic matter in soils of the Belgian Loess Belt upon erosion and deposition. Eur. J. Soil Sci. 2013, 64, 219–228. [Google Scholar] [CrossRef]
- Dungait, J.A.; Ghee, C.; Rowan, J.S.; McKenzie, B.M.; Hawes, C.; Dixon, E.R.; Paterson, E.; Hopkins, D.W. Microbial responses to the erosional redistribution of soil organic carbon in arable fields. Soil Biol. Biochem. 2013, 60, 195–201. [Google Scholar] [CrossRef]
- Doetterl, S.; Cornelis, J.-T.; Six, J.; Bodé, S.; Opfergelt, S.; Boeckx, P.; Van Oost, K. Soil redistribution and weathering controlling the fate of geochemical and physical carbon stabilization mechanisms in soils of an eroding landscape. Biogeosciences 2015, 12, 1357–1371. [Google Scholar] [CrossRef] [Green Version]
- VandenBygaart, A.J.; Kroetsch, D.; Gregorich, E.G.; Lobb, D. Soil C erosion and burial in cropland. Glob. Chang. Biol. 2011, 18, 1441–1452. [Google Scholar] [CrossRef]
- Ferguson, B.; Lukens, W.E.; El Masri, B.; Stinchcomb, G.E. Alluvial landform and the occurrence of paleosols in a humid-subtropical climate have an effect on long-term soil organic carbon storage. Geoderma 2020, 371, 114388. [Google Scholar] [CrossRef]
- Liu, X.; Sheng, H.; Jiang, S.; Yuan, Z.; Zhang, C.; Elser, J.J. Intensification of phosphorus cycling in China since the 1600s. Proc. Natl. Acad. Sci. USA 2016, 113, 2609–2614. [Google Scholar] [CrossRef] [Green Version]
- Van Oost, K.; Verstraeten, G.; Doetterl, S.; Notebaert, B.; Wiaux, F.; Broothaerts, N.; Six, J. Legacy of human-induced C erosion and burial on soil–atmosphere C exchange. Proc. Natl. Acad. Sci. USA 2012, 109, 19492–19497. [Google Scholar] [CrossRef] [Green Version]
- Oldeman, L. The Global Extent of Soil Degradation; WOS:A1994BA80F00007; Greenland, D., Szabolcs, I., Eds.; ISRIC: Wageningen, The Netherlands, 1994; pp. 99–144. [Google Scholar]
- Choobari, O.A.; Zawar-Reza, P.; Sturman, A. The global distribution of mineral dust and its impacts on the climate system: A review. Atmos. Res. 2014, 138, 152–165. [Google Scholar] [CrossRef]
- Chappell, A.; Baldock, J.A. Wind erosion reduces soil organic carbon sequestration falsely indicating ineffective management practices. Aeolian Res. 2016, 22, 107–116. [Google Scholar] [CrossRef]
- McDonald, M.D.; Lewis, K.L.; Ritchie, G.L.; DeLaune, P.B.; Casey, K.D.; Slaughter, L.C. Carbon dioxide mitigation potential of conservation agriculture in a semi-arid agricultural region. AIMS Agric. Food 2019, 4, 206–222. [Google Scholar] [CrossRef]
- Sharratt, B.; Schillinger, W.F. Windblown Dust Potential from Oilseed Cropping Systems in the Pacific Northwest United States. Agron. J. 2014, 106, 1147–1152. [Google Scholar] [CrossRef] [Green Version]
- Visser, S.M.; Sterk, G. Nutrient dynamics—Wind and water erosion at the village scale in the Sahel. Land Degrad. Dev. 2007, 18, 578–588. [Google Scholar] [CrossRef]
- Li, J.; Okin, G.; Alvarez, L.; Epstein, H. Quantitative effects of vegetation cover on wind erosion and soil nutrient loss in a desert grassland of southern New Mexico, USA. Biogeochemistry 2007, 85, 317–332. [Google Scholar] [CrossRef]
- Webb, N.P.; Strong, C.L.; Chappell, A.; Marx, S.K.; McTainsh, G.H. Soil organic carbon enrichment of dust emissions: Magnitude, mechanisms and its implications for the carbon cycle. Earth Surf. Process. Landforms 2013, 38, 1662–1671. [Google Scholar] [CrossRef]
- Münch, S.; Papke, N.; Leue, M.; Faust, M.; Schepanski, K.; Siller, P.; Roesler, U.; Nübel, U.; Kabelitz, T.; Amon, T.; et al. Differences in the sediment composition of wind eroded sandy soils before and after fertilization with poultry manure. Soil Tillage Res. 2021, 215, 105205. [Google Scholar] [CrossRef]
- Stovern, M.; Felix, O.; Csavina, J.; Rine, K.P.; Russell, M.R.; Jones, R.M.; King, M.; Betterton, E.A.; Sáez, A.E. Simulation of windblown dust transport from a mine tailings impoundment using a computational fluid dynamics model. Aeolian Res. 2014, 14, 75–83. [Google Scholar] [CrossRef] [PubMed] [Green Version]
- Touré, A.A.; Tidjani, A.; Rajot, J.; Marticorena, B.; Bergametti, G.; Bouet, C.; Ambouta, K.; Garba, Z. Dynamics of wind erosion and impact of vegetation cover and land use in the Sahel: A case study on sandy dunes in southeastern Niger. CATENA 2019, 177, 272–285. [Google Scholar] [CrossRef]
- Wang, B.; Liu, J.; Zhang, X.; Wang, C. Changes in soil carbon sequestration and emission in different succession stages of biological soil crusts in a sand-binding area. Carbon Balance Manag. 2021, 16, 27. [Google Scholar] [CrossRef]
- Chaopricha, N.T.; Marin-Spiotta, E. Soil burial contributes to deep soil organic carbon storage. Soil Biol. Biochem. 2014, 69, 251–264. [Google Scholar] [CrossRef]
- Luo, Y.; Zhao, X.; Ding, J.; Li, Y.; Liu, X.; Wang, T.; Luo, Y. Soil respiration dynamics in a semi-fixed sand dune under the pioneer shrub Artemisia halodendron Turcz. ex Bess. in the Horqin sandy land, northeastern China. Arid Land Res. Manag. 2019, 34, 36–51. [Google Scholar] [CrossRef]
- Belnap, J.; Phillips, S.; Duniway, M.; Reynolds, R. Soil Fertility in Deserts: A Review on the Influence of Biological Soil Crusts and the Effect of Soil Surface Disturbance on Nutrient Inputs and Losses; USGS, WOS: 000184355600025; Alsharhan, A., Wood, W., Goudie, A., Fowler, A., Abdellatif, E., Eds.; Taylor & Francis: Abingdo, UK, 2003; pp. 245–252. [Google Scholar]
Figure 1.
Fate of carbon transported by erosional processes at different stages.

Figure 2.
The soil erosion process impacting the exchange of Carbon (C) between the land, atmosphere, and rivers after the global C budget, which must be duly accounted for.
Figure 2.
The soil erosion process impacting the exchange of Carbon (C) between the land, atmosphere, and rivers after the global C budget, which must be duly accounted for.

Publisher’s Note: MDPI stays neutral with regard to jurisdictional claims in published maps and institutional affiliations. |
© 2022 by the author. Licensee MDPI, Basel, Switzerland. This article is an open access article distributed under the terms and conditions of the Creative Commons Attribution (CC BY) license (https://creativecommons.org/licenses/by/4.0/).
Share and Cite
MDPI and ACS Style
Lal, R. Biophysical Controls That Make Erosion-Transported Soil Carbon a Source of Greenhouse Gases. Appl. Sci. 2022, 12, 8372. https://doi.org/10.3390/app12168372
AMA Style
Lal R. Biophysical Controls That Make Erosion-Transported Soil Carbon a Source of Greenhouse Gases. Applied Sciences. 2022; 12(16):8372. https://doi.org/10.3390/app12168372
Chicago/Turabian StyleLal, Rattan. 2022. "Biophysical Controls That Make Erosion-Transported Soil Carbon a Source of Greenhouse Gases" Applied Sciences 12, no. 16: 8372. https://doi.org/10.3390/app12168372
Note that from the first issue of 2016, this journal uses article numbers instead of page numbers. See further details here.