1. Introduction
According to the theory of new economic geography [
1], regional advantage is the initial condition of industrial agglomeration. Economic activity is initially concentrated in a geographical area that generates a large number of agglomeration externalities by reducing costs and boosting firm productivity. The positive feedback effect and economies of scale of industrial agglomeration attract more enterprises to gather in the same region to take advantage of the positive externalities brought by proximity, leading to the self-reinforcement of industrial agglomeration [
2,
3]. When a particular industry gathers in a particular region, the core competitiveness of the industry is enhanced, and the regional advantage is further enhanced.
Transportation infrastructure is the key factor that determines regional advantages [
4,
5]. Transportation infrastructure reduces transaction costs and expands cargo transport capacity. The improvement in transportation infrastructure may change the location advantage [
6,
7]. Transport infrastructure affects separate industries completely differently [
8,
9]. After the improvement of transportation infrastructure such as the highway network and high-speed rail network, some industries expanded as transportation costs fell, while other industries contracted as economic activities shifted. More convincing empirical evidence is needed to characterize the relationship between transportation infrastructure and industrial agglomeration.
This paper took the Yangtze River Delta urban agglomeration as the research area and examined the impact of transportation infrastructure on industrial agglomeration from the perspective of urban agglomeration transportation integration. The influence mechanism of urban agglomeration transportation integration on industrial agglomeration was also studied. The rest of this paper is organized as follows. In
Section 2, we re-view relevant literature and propose relevant research hypotheses.
Section 3 introduces the relevant background, including the rapid development of transportation infrastructure and the trend of industrial agglomeration in the Yangtze River Delta urban agglomeration.
Section 4 describes how we prepared the data and our methodology for empirical research.
Section 5 investigates the impact of urban agglomeration transportation integration on industrial agglomeration in the Yangtze River Delta, examines the impact mechanism of urban agglomeration transportation integration on industrial agglomeration, and reports our analysis results.
Section 6 discusses the model estimation results based on
Section 5.
Section 7 summarizes the main findings of the study and provides a conclusion. In the final section, we also discuss the contributions, impacts, limitations, and opportunities for future work in the study topic.
2. Literature Review and Research Hypothesis
Industrial agglomeration is defined as a state of industrial concentration in a specific space or region, which itself contains the concept of space. The research on industrial agglomeration and its influencing factors mainly focuses on three perspectives.
First, agglomeration economics theory divides economies of scale in production into internal and external economies [
10]. Internal economies of scale come from inside enterprises, while external economies of scale come from the spatial aggregation of similar enterprises. Spatial agglomeration can reduce the risk of labor shortage at enterprises, and the spillover effect in industrial agglomeration can enable enterprises to obtain extra income that is higher than that obtainable in non-agglomeration. The more enterprises in the same industry that gather in a certain place, the more favorable it is for the enterprise to obtain the required factors of production (e.g., labor force, capital, energy, and transportation), and the more efficient the enterprise’s production.
Second, new economic geography theory treats the differences in economic geography between two regions as a kind of influencing factor on industrial agglomeration [
11,
12], one of which spawns the initial industrial agglomeration before affecting it through the increasing return effects of the new economic geography factors. According to new economic geography, the endogenous forces of economic systems eventually lead to the evolution and differentiation of regions, resulting in a core–periphery structure. In this structure, factors such as geography and resources give rise to subtle differences between the previously comparable economies of both regions. In a cyclic accumulation of causality, the core region exports goods to the periphery while satisfying local demand, creating far greater market demand than the periphery [
13,
14]. This significantly facilitates the region’s population absorption, capital accumulation, knowledge creation, enterprise reception, and even industrial relocation, boosting the core region’s agglomeration superiority.
Third, endogenous growth theory takes knowledge spillover as the main explanation for agglomeration [
15]. Knowledge spillover is a communication process that occurs through interaction, communication, and exchange between individuals, enterprises, and even different subjects at the regional level, including the free flow and interaction of knowledge and talent in different regions [
16,
17] and the exchange and cooperation between enterprises and R&D institutions in different regions [
18]. In recent years, the high-speed rail has shortened the commuting time between cities within urban agglomerations, reduced the cost of face-to-face communication between professional and technical personnel from different cities, and expanded the spread of knowledge and technology. Frequent intercity high-speed rail trips have also increased the innovative interaction between cities and jointly promoted knowledge spillover. Relevant empirical study results also prove that knowledge spillover and the transportation network have complementary effects. Intercity high-speed rail allows for more highly skilled workers to benefit from face-to-face interaction, improves the output efficiency of knowledge, and promotes industrial agglomeration [
19].
New economic geography takes the transportation cost as the most important factor influencing industrial aggregation. The improved transportation integration in urban agglomerations accelerates industrial agglomeration. Owing to the multitude of transportation modes making up the network layout of urban agglomerations’ comprehensive three-dimensional transportation network system, transportation and time costs can be greatly reduced [
20,
21], thereby deepening inter-regional openness and dissolving market segmentation. This in turn promotes the rapid flow of production factors such as capital, technology, labor, and information, while also expanding and deepening the scope and frequency of intercity connections, improving the efficiency of resource allocation, creating economies of scale in the inflow destinations, and prompting the continuous agglomeration of economic factors and industries [
22,
23].
The opening and improvement of high-speed transportation networks in urban agglomerations improve the integration of transportation in urban agglomerations and accelerate the pace of urban industrial agglomeration overall. However, there are differences in the opening time of high-speed rails in different cities, individual differences between cities and enterprises [
24], and heterogeneity in the effect of promoting industrial agglomeration. As the construction cycle of a high-speed railway and related supporting facilities is long, and the diffusion, learning, digestion, and absorption effects of innovation factors generated by trans-regional flow also take time, industrial agglomeration has heterogeneity in different periods leading to the year of high-speed railway opening [
25]. In the urban agglomerations of the Yangtze River Delta, which is close to 20% of the national economic aggregate, there may be heterogeneity in the industrial agglomeration effect of different central cities after the opening of high-speed rail owing to the geographical location of the central cities and the industrial structure and economic vitality of the urban agglomerations. Therefore, this paper proposes the following research hypotheses.
Hypothesis 1 (H1). The integrated development of urban agglomeration promotes industrial agglomeration. Urban heterogeneity exists in the impact of transportation integration on industrial agglomeration.
The enhancement of transportation integration in an urban agglomeration improves the intercity accessibility within the agglomeration [
26,
27,
28] and links economic activity across regions as a whole [
29]. As the boundaries of cities and urban agglomerations continue to spill over, it becomes easier for industrial firms to relocate. To reduce labor costs, industrial firms in cities with higher labor costs may move to cities with lower labor costs. Moreover, the networking of transportation infrastructure in urban agglomerations, especially the opening and operation of intercity high-speed railways, pushes up wages in the region. Under the pressure of operating and production costs, industrial firms may make relocation decisions, thereby reducing regional industrial agglomeration.
Hypothesis 2 (H2). With the improvement of the transportation integration level in the urban agglomeration, the rise in local labor costs restrains the level of local industrial agglomeration, while the rise in labor cost in other areas has a positive effect on the level of local industrial agglomeration.
3. Background
The urban agglomeration of the Yangtze River Delta, which includes Shanghai, Jiangsu, Zhejiang, and Anhui provinces, is one of the regions with the most dynamic economy, the highest degree of openness, the strongest innovation ability, and the largest absorption of foreign populations in China. It plays an important strategic role in the overall construction and all-round opening up pattern for China. In 2020, the land area of the Yangtze River Delta urban agglomeration was 358,000 square kilometers, accounting for 3.73% of the national land area. The permanent population was 235 million, accounting for 16.64% of the national population. In 2020, the GDP of the Yangtze River Delta urban agglomeration was CNY 23.81 trillion, accounting for 23.60% of the national GDP.
3.1. Transportation Development of Urban Agglomeration in the Yangtze River Delta
In 2011, the 1318 km Beijing–Shanghai high-speed railway opened, which is the first high-speed railway line in the Yangtze River Delta urban agglomeration. The Yangtze River Delta urban agglomeration thus entered the era of high-speed rail. In 2020, the length of high-speed railway in operation in the Yangtze River Delta urban agglomeration was about 6100 km, and the density of high-speed railway was 170.39 km/10,000 square km, 4.3 times that of the national high-speed railway density. The Yangtze River Delta urban agglomeration has the densest high-speed railway network in China. The Yangtze River Delta urban agglomeration initially formed a multi-center 0.5–3 h high-speed rail metropolitan circle, with Shanghai, Nanjing, and Hangzhou as the centers.
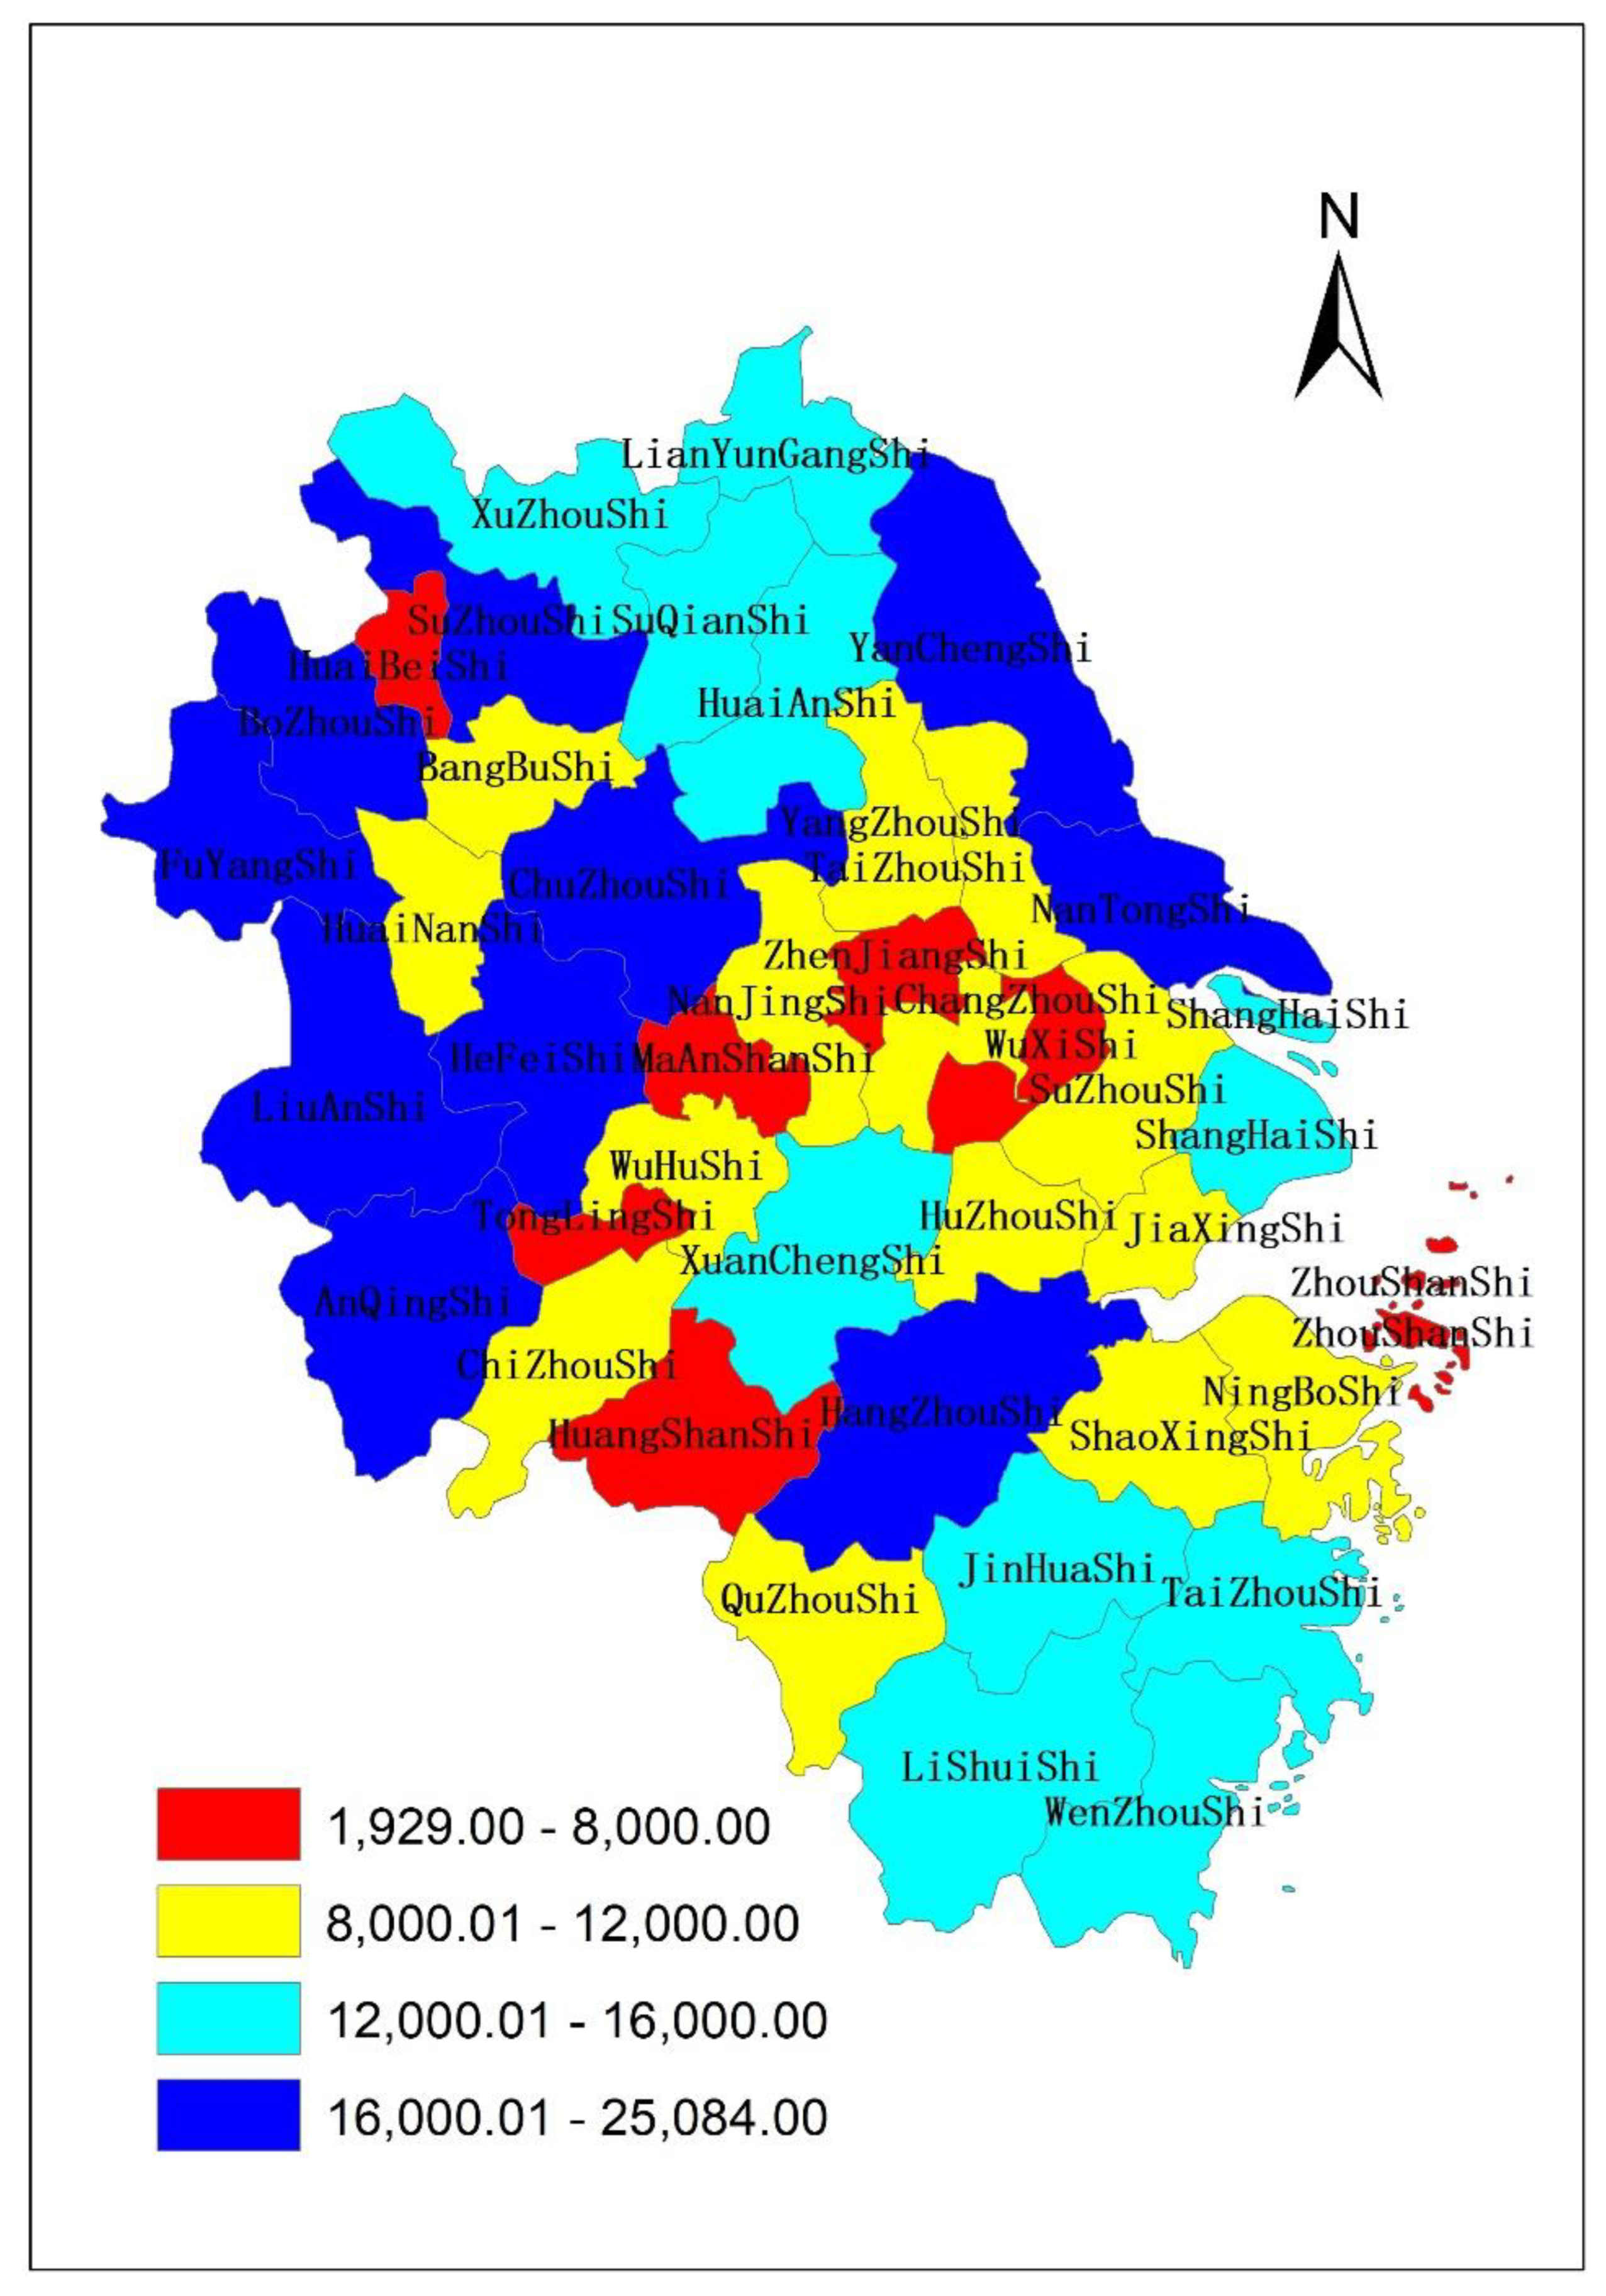
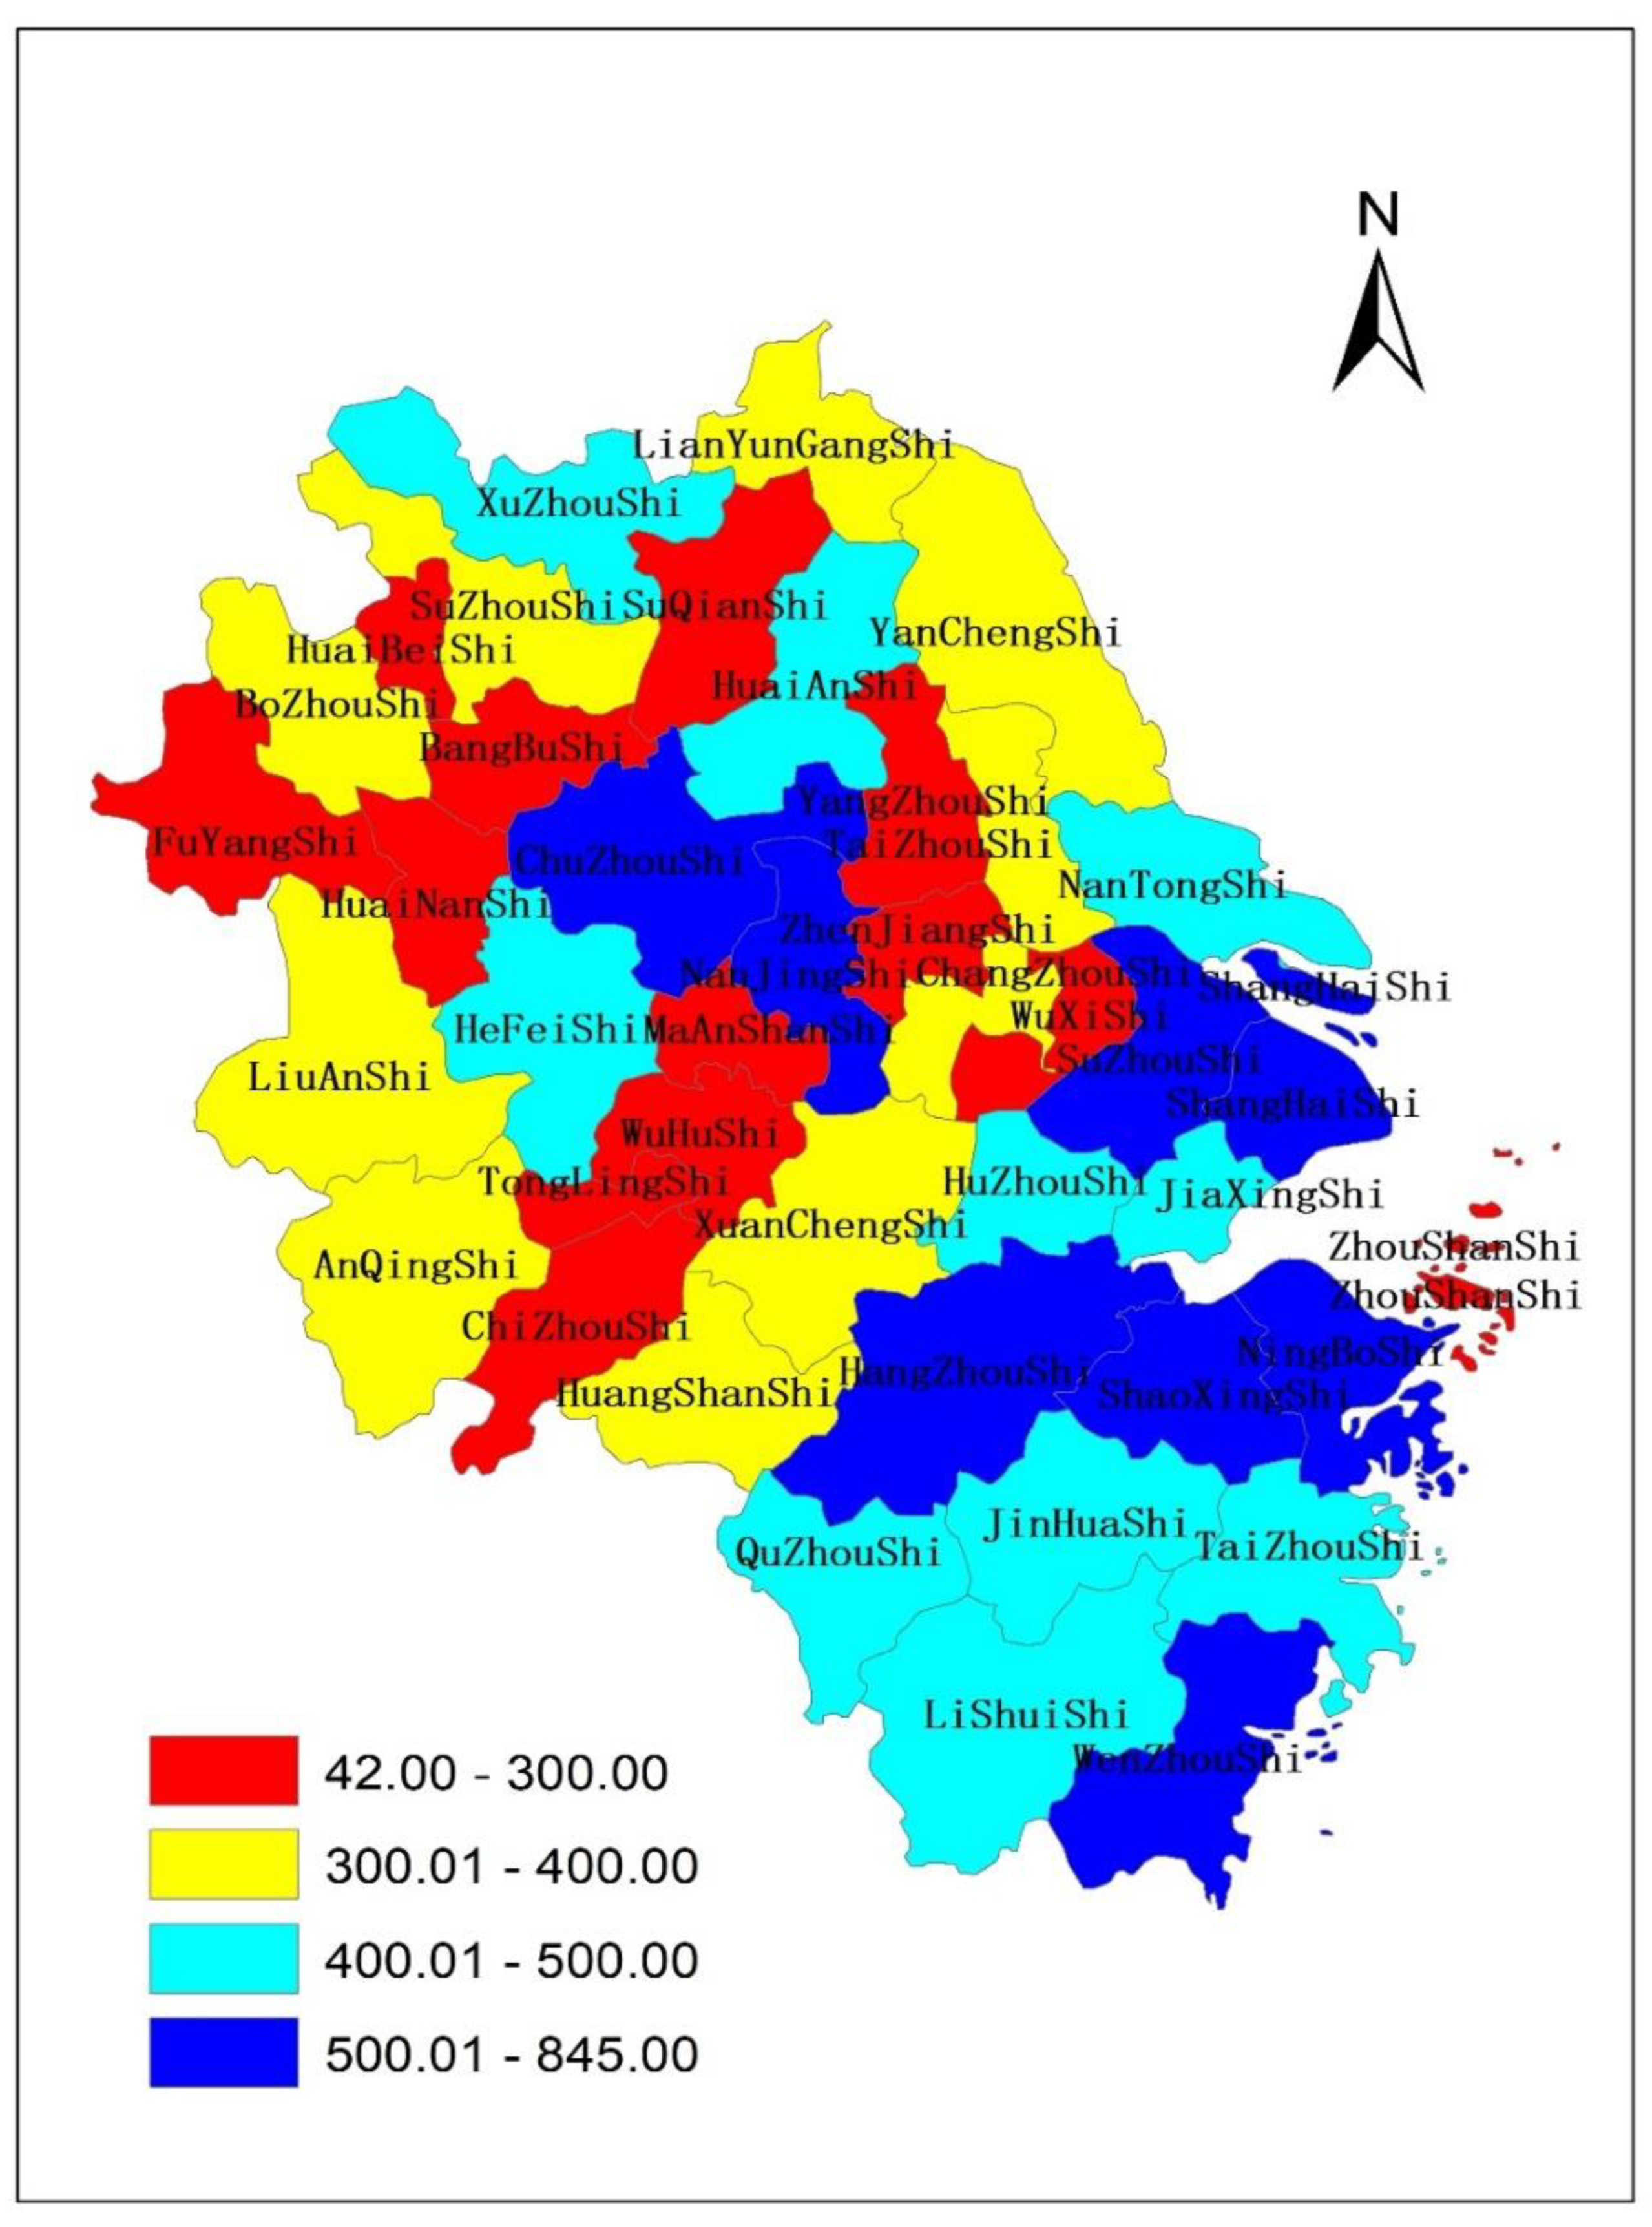
In 2020, the highway mileage of the Yangtze River Delta urban agglomeration was 530,581 km, of which the mileage of expressways, primary roads, and secondary roads spanned 15,770 km, 29,822 km, and 51,912 km, respectively, accounting for 2.97%, 5.62%, and 21.96%, respectively, of the highway mileage of the Yangtze River Delta urban agglomeration. In other words, the highway mileage above grade II in the Yangtze River Delta urban agglomeration accounted for 30.55% of the highway mileage in the Yangtze River Delta urban agglomeration, or 2.26 times the national proportion. The spatial distributions of highway and expressway mileage in the Yangtze River Delta urban agglomeration in 2020 are shown in
Figure 1 and
Figure 2.
In 2020, the road network density, expressway network density, and first-level high-way network density of the Yangtze River Delta urban agglomeration were 1.48 km/square km, 440.50 km/10,000 square km, and 833.02 km/10,000 square km, respectively, which are 2.73, 2.63, and 6.50 times the national road network density, expressway network density, and first-level highway network density, respectively.
The Yangtze River Delta urban agglomeration has essentially formed a network of five vertical and five horizontal expressways, including the Shanghai–Nanjing express-way, Shanghai–Hangzhou expressway, and Hangzhou–Ningbo expressway. From 2011–2020, the 1-h accessibility of the central cities of the Yangtze River Delta—Shanghai, Nanjing, Hangzhou, and Hefei—all expanded.
From 2011–2020, road transportation was the most important mode of transportation in the Yangtze River Delta urban agglomeration. In 2020, the highway passenger volume in the Yangtze River Delta urban agglomeration accounted for 70.62% of the total passenger volume. In 2020, the highway freight volume of Yangtze River Delta urban agglomeration accounted for 59.97% of the total freight volume.
3.2. Industrial Development of the Urban Agglomeration in the Yangtze River Delta
In 2020, the industrial GDP of the Yangtze River Delta urban agglomeration was CNY 8171.80 billion, accounting for 26.1% of the national total. The figure is 1.59 times of that in 2011. Moreover, the industrial GDP of Shanghai was CNY 965.65 billion, accounting for 11.82% of the industrial GDP of the Yangtze River Delta urban agglomeration, which is 1.34 times of that in 2011. The industrial GDP of Jiangsu province was CNY 3.77 billion, accounting for 46.19% of the industrial GDP of the Yangtze River Delta urban agglomeration, which is 1.69 times of that in 2011. The industrial GDP of Zhejiang province was CNY 2265.44 billion, accounting for 27.72% of the industrial GDP of the Yangtze River Delta urban agglomeration, which is 1.54 times of that in 2011. The industrial GDP of Anhui province was CNY 1166.22 billion, accounting for 14.27% of the industrial GDP of the Yangtze River Delta urban agglomeration, which1.65 times of that in 2011.
The industrial distribution of the urban agglomeration in the Yangtze River Delta showed a trend of diffusion from the core cities of the urban agglomeration in the Yangtze River Delta to the peripheral areas of the Yangtze River Delta, that is, from the cities along the Shanghai–Nanjing high-speed railway and Shanghai–Hangzhou high-speed railway to the northern Jiangsu, Ningbo, and Hefei metropolitan areas. The Yangtze River Delta’s integration of traffic in a three-dimensional network was optimized, the accessibility of the related city in the Anhui province has improved significantly, and its links with the Yangtze River Delta core city have become increasingly close. Moreover, the region has advantages in its location, resources, and industry. Therefore, many industry transfers in Jiangsu and Zhejiang have been undertaken to speed up high-quality industrial development and strengthen the level of industrial agglomeration of the Anhui province.
4. Methods
4.1. Transportation Integration Evaluation Index System of Yangtze River Delta Urban Agglomeration
We combined existing research results with the characteristics of different transportation modes in the Yangtze River Delta urban agglomeration (e.g., highways and railways), the transport capacity of the network characteristics and role, and the influence of factors like data availability and computability. Then, we chose corresponding indicators. See the following
Table 1.
Specific indicators are described as follows:
In-degree centrality and out-degree centrality are measured by degree centrality. The formula is
, where
is the degree of city
, and generally refers to the number of city
with direct rail connections in this study. Degree centrality refers to the number of points directly connected to a point and measures the central position of a node in the network. The higher the degree centrality is, the more nodes are directly connected to the point and the point is in the center. When the connection has direction, degree centrality can be divided into in-degree centrality and out-degree centrality [
30].
The formula of eigenvector centrality is
, where
is the degree of city
[
30].
The formula of betweenness centrality is
, where
is the number of shortest paths between cities,
is the number of shortest paths through city
between city
and city
, and
is the mediations of city
relative to city
and city
[
30].
The formula of closeness centrality is
, where
is the shortest path length between city
and city
[
30].
Highway passenger capacity and highway freight volume can be obtained according to the Statistical Yearbook of Chinese Cities (2012–2021) and the Statistical Yearbook of Provinces and Cities.
The formula of effective average travel time [
31] is
, where
is the shortest travel time between two cities based on the land transport network, and
is the economic quality of city
, which is measured by the square root of the product of the city’s GDP and population.
The formula of economic potential is , where is the shortest travel time between two cities based on the land transport network, and is the economic quality of city , which is measured by the square root of the product of the city’s GDP and population.
According to the actual situation of this study and the entropy weight method, the calculation steps of the transportation integration index of the Yangtze River Delta urban agglomeration are as follows:
First, all indicators need to be de-dimensionalized;
Use the entropy weight method to assign weights to the traffic network structure index and the traffic network function index, and calculate the traffic network structure index and the traffic network function index;
Use the weighted equalization method to calculate the traffic integration index. The weight of both the traffic network structure index and the traffic network function index is 0.5.
4.2. The Spatial Durbin Model for Hypothesis 1
The Spatial Durbin Model is set as follows:
where
is the spatial weight matrix,
is the spatial autocorrelation term of the dependent variable,
is the spatial autocorrelation term of the independent variable,
is the spatial lag coefficient of the dependent variable, and
is the spatial spillover effect of the independent variable, which refers to the influence of independent variables on dependent variables in neighboring areas.
The selected variables in this study are as follows:
Explained variable. The main indicators to measure the level of industrial agglomeration include location entropy, Herfindahl index, and Gini coefficient, etc. Consider the availability and computability of statistics data, industrial location entropy (IE) is adopted in this study to reflect the degree of urban industrial agglomeration. The IE calculation formula is , where is the industrial GDP of city in year , is the GDP of city in year , is the national industrial GDP in year , and is the national GDP in year .
Core explanatory variable. Urban agglomeration transportation integration level (TI) is the core explanatory variable, and its related definition and calculation formula are detailed in
Section 4.1.
Control variables. Control variables include government investment intensity (Fin), level of opening-up (FDI), level of urbanization (Ur), and level of foreign trade (Ex). In this study, these control variables are respectively measured by the ratio of the general public financial expenditure to GDP of each city, the ratio of foreign direct investment to GDP of each city, the urbanization rate of each city, and the ratio of total export to GDP of each city [
23].
Spatial weight matrix. In this study, the geographical adjacency spatial weight matrix is constructed as follows:
[
32].
Then we can obtain the Spatial Durbin Model [
33] for Hypothesis 1
where
is measured by the above control variables.
4.3. The Spatial Durbin Model for Hypothesis 2
This study adopts a simplified spatial model and introduces variables that measure labor cost to examine the impact of labor cost changes caused by the urban agglomeration’s transportation integration on industrial agglomeration. The model is as follows:
As there are no direct data to reflect labor cost, this study drew on the research of related scholars cited in the China Urban Statistical Yearbook and used the average wage (Wa) of urban employees in prefecture-level cities as a measure of labor cost. In this study, the time spatial weight matrix was constructed as follows: , where is the shortest travel time between two cities based on the land transport network. The model helps examine whether transportation integration in urban agglomerations affects industrial agglomeration through the “cost effect,” where reflects the impact of rising local labor cost on local industrial agglomeration and reflects the impact of rising labor cost in other regions on local industrial agglomeration. If is less than zero, the increase in local labor cost inhibits the local industrial agglomeration; if is greater than zero, the increase in labor cost in other regions promotes the local industrial agglomeration.
4.4. Data Set
In terms of time scale, since the high-speed rail in the Yangtze River Delta urban ag-glomeration was rolled out year by year at the municipal level since 2011, and considering the impact of COVID-19, the time range of this study was selected as 2011–2019 and 2011–2020. The relevant data from the high-speed railway used were partly from the National Railway Passenger Train Schedule from 2011 to 2016, and the railway time data from 2017 to 2020 were from the official website of the National Railway Corporation (
www.12306.cn, accessed from 1 January 2017 to 31 December 2020). The road time used came from the baidu-related database. The economic data used were the economic data of 41 cities at prefecture level or above from 2011 to 2020, all from the database of the National Bureau of Statistics, China Urban Statistical Yearbook (2012–2021), and the relevant provincial statistical yearbook from 2011 to 2020. In order to eliminate the heteroscedasticity of the original data and reduce the unsteadiness of the data, all data were logarithmically processed.
5. Results
5.1. Result of the Transportation Integration Index
According to the relevant statistical data, the structure index, function index, and transportation integration index of the transportation network in the Yangtze River Delta were obtained through calculation, which can directly reflect the development level of the transportation integration of the Yangtze River Delta.
According to the
Table 2, the transportation network structure index of the Yangtze River Delta urban agglomeration in 2020 was 0.5723, an increase of 8.16% compared with 2011. On the whole, the transportation network structure index of Yangtze River Delta urban agglomeration showed an upward trend from 2011 to 2020. In 2019 and 2020, the transportation network function index of Yangtze River Delta urban agglomeration was 0.3958 and 0.3742, respectively, which decreased by 5.45% in 2020 compared with 2019. On the whole, the transportation network function index of the Yangtze River Delta urban agglomeration showed a certain upward trend from 2011 to 2020.
In 2019 and 2020, the transportation integration index of the Yangtze River Delta urban agglomeration was 0.5871 and 0.5772, respectively, increasing by 4.17% and 2.14% compared with 2011, respectively. Due to the impact of COVID-19, passenger and cargo transportation in the Yangtze River Delta urban agglomeration in 2020 was impacted to a certain extent, but overall, the transportation integration index of the Yangtze River Delta urban agglomeration from 2011 to 2020 showed a certain upward trend.
According to the
Table 3, Shanghai, Nanjing, Hangzhou, Xuzhou, Jiaxing, and Hefei were the top six cities in terms of transportation network structure index of Yangtze River Delta urban agglomeration in 2020. In 2020, Quzhou, Maanshan, Suqian, Yancheng, and Zhoushan ranked the lowest five cities in the transportation network structure index of Yangtze River Delta urban agglomeration.
In 2020, Shanghai, Suzhou, Hangzhou, Hefei, Ningbo, and Nanjing ranked the top six cities in the transportation network function index of Yangtze River Delta urban agglomeration, respectively. In 2020, Tongling, Huangshan, Lishui, Huaibei, and Zhoushan ranked the bottom five cities in the transportation network function index of Yangtze River Delta urban agglomeration, respectively.
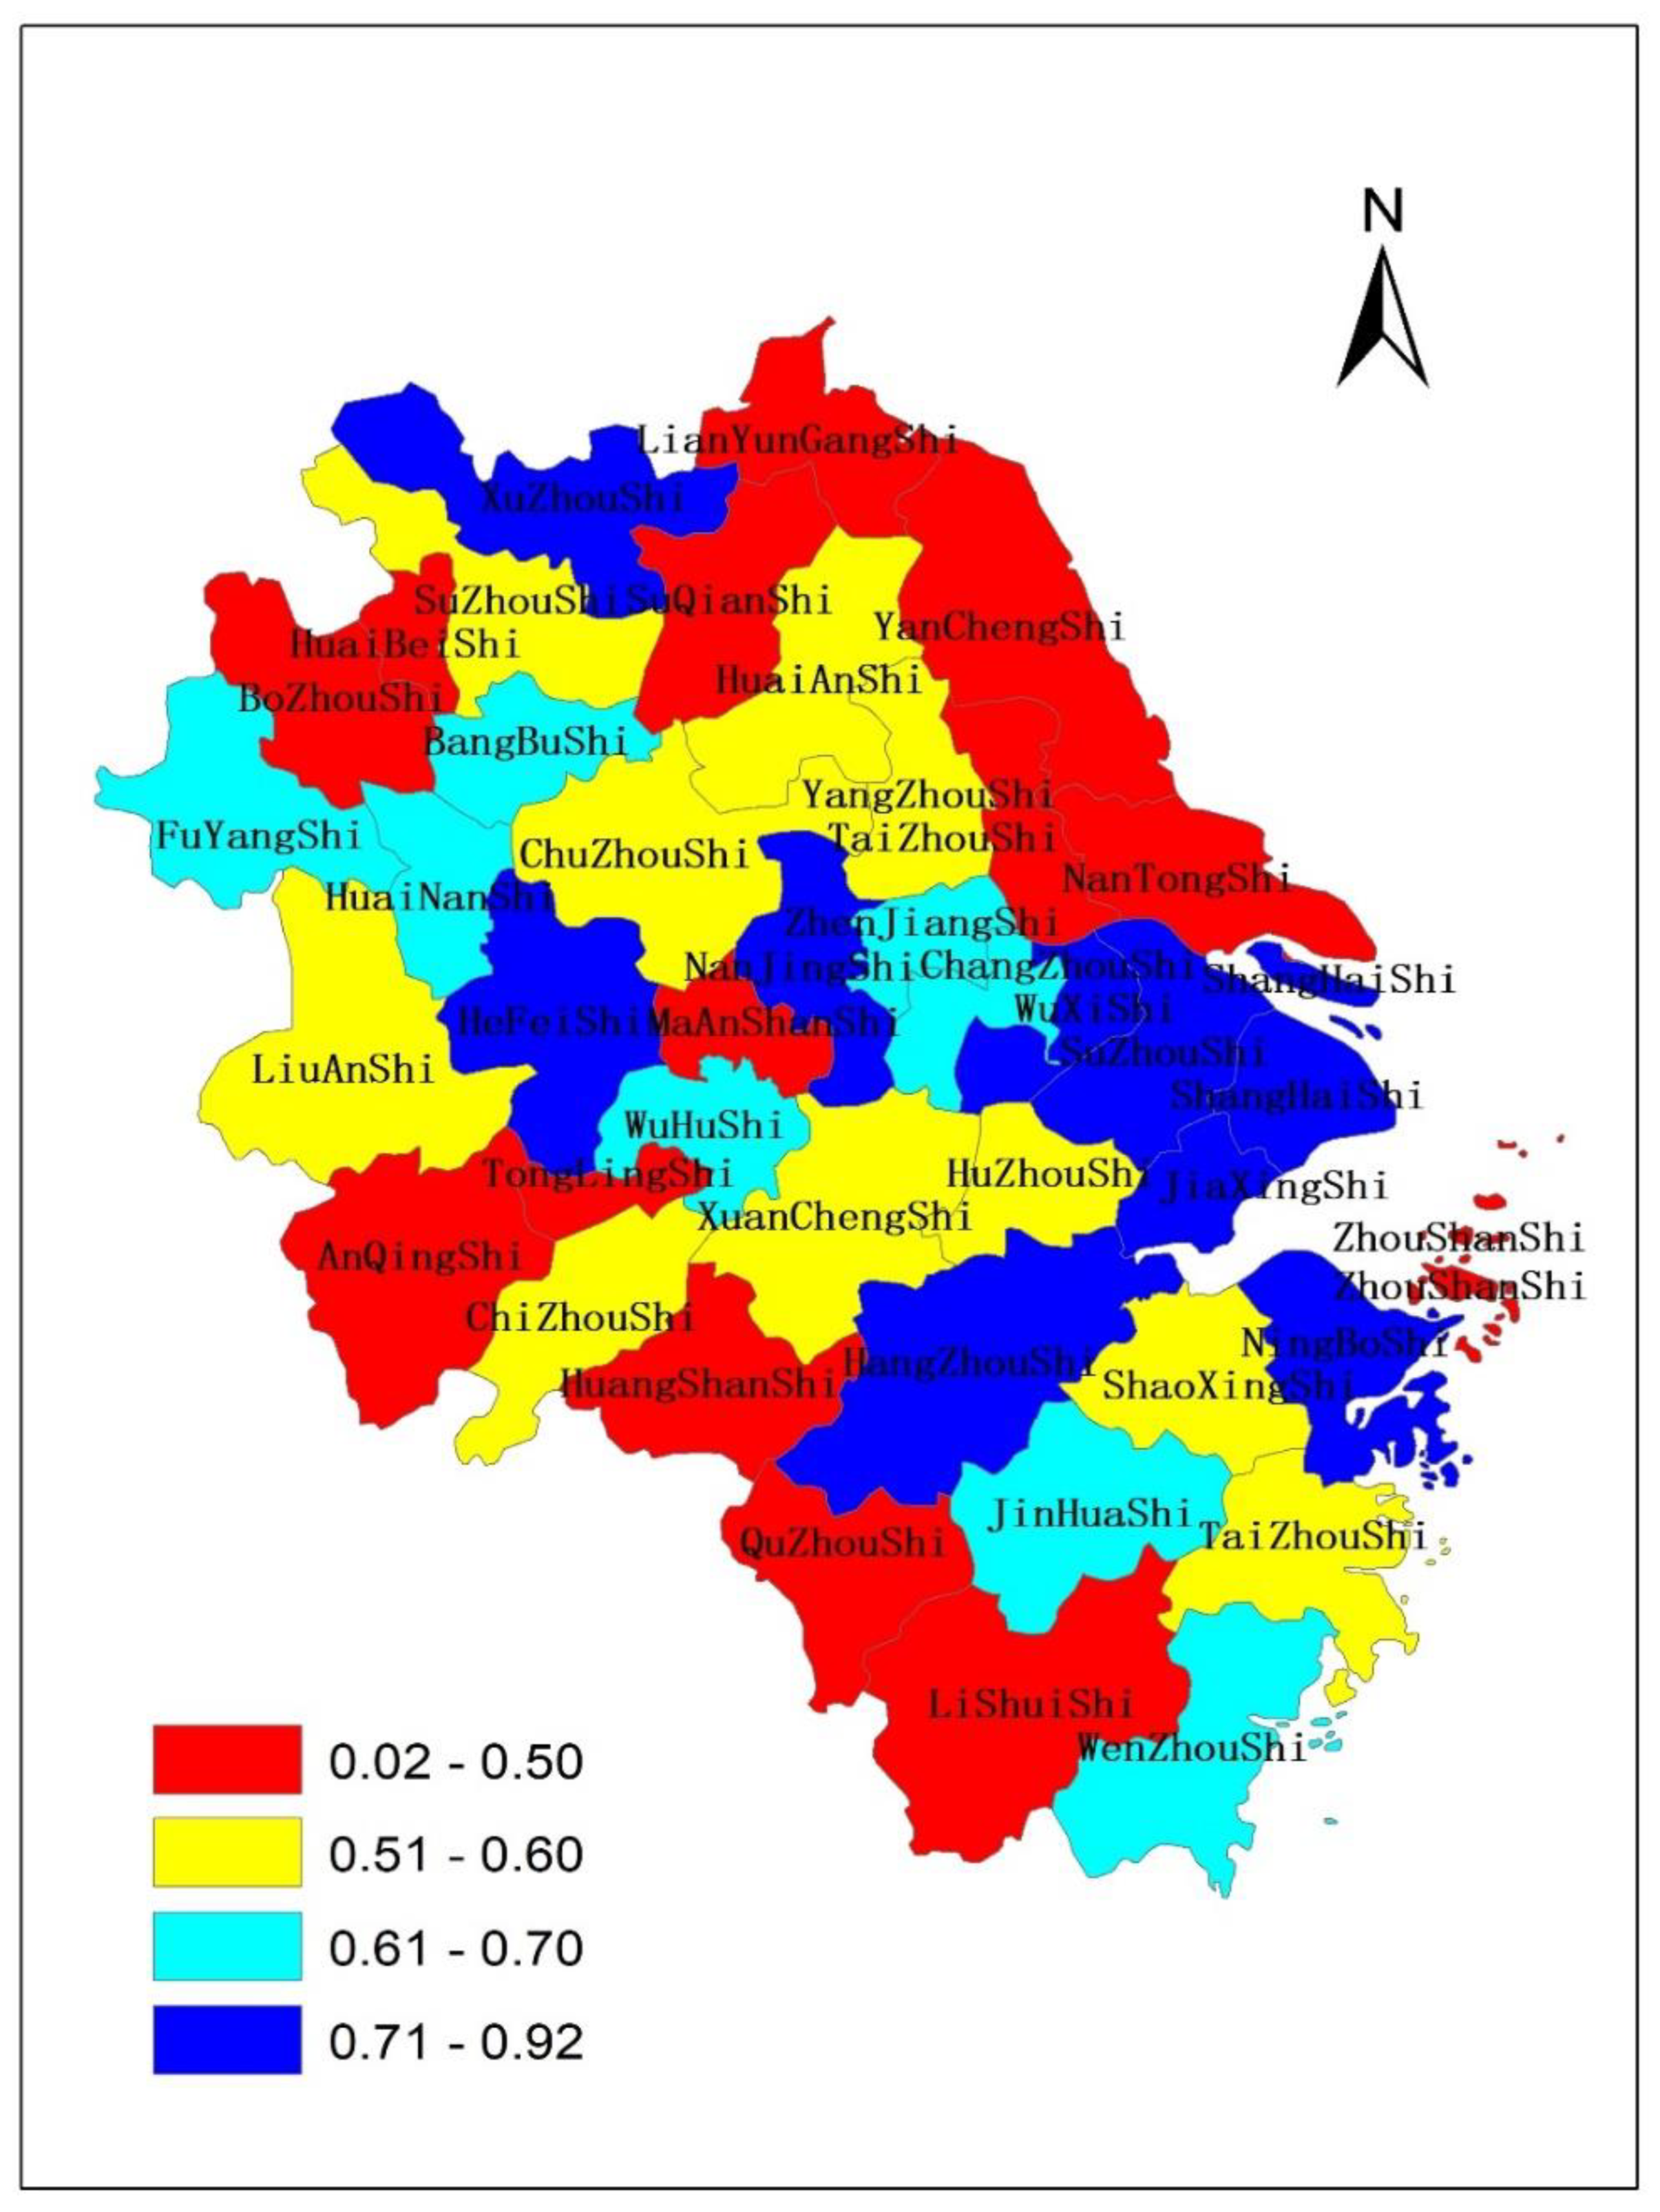
The spatial distributions of transportation integration index value of Yangtze River Delta urban agglomeration in 2020 are shown in
Figure 3. The transportation integration index value of Yangtze River Delta urban agglomeration in 2020 ranked the top five cities, namely Shanghai, Hangzhou, Hefei, Suzhou, and Nanjing. The cities with the transportation integration index values in the Yangtze River Delta in 2020 were Huangshan, Huaibei, Yancheng, Suqian, and Zhoushan.
5.2. Result of The Spatial Durbin Model for Hypothesis 1
This section details the spatial autocorrelation analysis and LM test that was carried out on relevant data by Excel and R software to determine the spatial Model (2). Then, R software was used for the spatial metering operation and case analysis.
5.2.1. Spatial Autocorrelation Test
This study first used the Moran index to test the spatial correlation of industrial location entropy in the Yangtze River Delta urban agglomeration as a whole and the corresponding Moran index could be obtained, as shown in the table. As can be seen from the
Table 4, the Moran index of industrial location entropy of urban agglomerations in the Yangtze River Delta from 2011 to 2020 was significant at the level of 10%, revealing that the industrial location entropy of urban agglomerations in the Yangtze River Delta from 2011 to 2020 had obvious spatial autocorrelation. Overall, the degree of spatial agglomeration of industrial location entropy in the Yangtze River Delta Urban agglomeration improved. The industrial location entropy of the urban agglomeration of the Yangtze River Delta was not in a completely random state, but it was affected by the economic behaviors of other regions with similar spatial characteristics, revealing a certain phenomenon of agglomeration in geographical space. Therefore, in order to study and analyze the impact of transportation integration on industrial agglomeration in the Yangtze River Delta, the spatial factors should not be ignored.
5.2.2. LM Test
In this study, LM statistics and Robust LM statistics were tested on the corresponding spatial econometric models using R software.
According to the
Table 5, both LM-ERR and LM-LAG tests passed the significance test at the 10% level, indicating that the lag term and residual sequence of dependent variables have spatial autocorrelation. The results showed that the Robust LM-ERR passed the significance test at 10% level, while the Robust LM-LAG failed the significance test at 10% level. Based on the 2011–2019 data of urban agglomerations in Yangtze River Delta, both LM-LAG and Robust LM-LAG passed the significance test at 10% level, while both LM-ERR and Robust LM-ERR failed the significance test at 10% level.
In view of the above test results, this study adopted the Spatial Durbin Model (2) to study the impact of transportation integration on industrial agglomeration in urban agglomerations.
5.2.3. The Empirical Analysis
This section examines the impact of transportation integration in urban agglomerations on industrial agglomeration. Based on statistical data at the municipal level, 41 cities in urban agglomerations in the Yangtze River Delta were selected as research samples, and the Spatial Durbin Model (2) was used to conduct regression analysis from 2011 to 2019 and 2011 to 2020, respectively, considering the impact of COVID-19. The model estimation results are shown in the table below.
As
Table 6 suggests,
had ideal statistics, indicating that SDM can accurately reflect the spatial correlation between the transportation integration of urban agglomerations and industrial agglomeration. According to SDM’s spatial regression coefficient,
, apart from Model 2 for the 2011–2020 period, all other model estimations passed the significance test, implying the crucial role of industrial agglomeration in other cities on the local industrial agglomeration.
When the spatial effect was considered, the improved industrial agglomeration in neighboring areas had a negative spillover effect on the local industrial agglomeration, suggesting strong spillovers from relatively developed regions, either geospatially or industrially. It can also be observed by comparing the model estimations over the two time periods that the statistics for 2011–2020 are higher than those for 2011–2019, indicating the reduced inhibition by industrial agglomeration in other regions on the local industrial agglomeration due to COVID-19.
The Ti estimations were significantly positive for all the models, hinting at the crucial constructive contribution toward the level of local industrial agglomeration by the local transportation integration. The comparison showed that Ti estimations for 2011–2020 were smaller than those for 2011–2019, indicating the diminishing positive impact of local transportation integration on local industrial agglomeration due to COVID-19.
The estimations for W*Ti varied across models. In 2011–2020, the W*Ti estimations for both Models 1 and 2 were significantly positive but failed the significance test. In 2011–2019, the W*Ti estimations also failed the significance test. This indicates that at present, transportation integration in other regions positively affects industrial agglomeration in the Yangtze River Delta, albeit insignificantly. The comparison between the W*Ti estimations showed that the high level of transportation integration in other regions mitigated the effect of COVID-19 to a certain extent and gave a greater boost to the local industrial agglomeration.
The estimated coefficients of Fin were all significantly negative, and those of W*Fin were all significantly positive. This indicates that local industrial agglomeration is significantly influenced by domestic and non-domestic financial inputs as much as non-domestic financial inputs significantly contribute to local industrial agglomeration. The estimated coefficients of FDI were all significantly positive, while those of W*FDI were all significantly negative. This indicates that local FDI promotes local industrial agglomeration, while the effect of FDI from other regions is significantly inhibitory. The estimated coefficients of Ur were all significantly positive, while those of W*Ur were all negative and failed the significance test. This implies that the higher the level of local urbanization, the more favorable it is to local industrial agglomeration. The level of urbanization in other regions was insignificantly inhibitory to local industrial agglomeration. The estimated coefficients of Ex and W*Ex were negative and mostly insignificant, implying the insignificant effects of foreign trade in the Yangtze River Delta on local industrial agglomeration.
5.3. Result of the Spatial Durbin Model for Hypothesis 2
5.3.1. Spatial Autocorrelation Test
According to
Table 7, the Moran index of industrial location entropy of urban agglomerations in the Yangtze River Delta from 2011 to 2020 was significant at the level of 10%, revealing that the industrial location entropy of urban agglomerations in the Yangtze River Delta from 2011 to 2020 had obvious spatial autocorrelation. Overall, the degree of spatial agglomeration of industrial location entropy in the urban agglomeration of the Yangtze River Delta improved. The industrial location entropy of the urban agglomeration of the Yangtze River Delta was not in a completely random state but presented a certain phenomenon of agglomeration in space. Therefore, the SDM model can be built for relevant research.
5.3.2. LM Test
According to
Table 8, both LM-ERR and LM-LAG tests passed the significance test at the 10% level, indicating that the lag term and residual sequence of dependent variables are spatially autocorrelated. The results show that the Robust LM-ERR passed the significance test at 10% level, while the Robust LM-LAG failed the significance test at the 10% level.
Considering the above test results, we adopted Spatial Durbin Model (3) to study the impact of transportation integration on industrial agglomeration in urban agglomerations.
5.3.3. The Empirical Analysis
In this study, 41 cities in the Yangtze River Delta urban agglomeration were taken as research samples, and the Spatial Durbin Model (3) was used for regression analysis from 2011 to 2019 and 2011 to 2020. The model estimation results are shown in the table below.
This study focused on the estimated coefficients of Wa and W*Wa. According to
Table 9, first, the estimated coefficients of Wa were significantly negative, indicating that the rise of local labor costs has a restraining effect on local industrial agglomeration. Second, the estimated coefficients of W*Wa were all significantly positive, indicating that the rise of labor costs in other regions promotes local industrial agglomeration.
6. Discussion
According to
Table 2, the first experimental study showed that the transportation network of urban agglomerations in the Yangtze River Delta has been increasingly optimized. The frequency of high-speed railways and the traffic flow of expressways between cities in the urban agglomerations in the Yangtze River Delta has increased, and the contact frequency between Shanghai, Suzhou, Jiaxing, Nanjing, Danyang, Suzhou, Changzhou, Kunshan, and other cities has increased significantly, accelerating the flow of factors. The total travel time of high-speed railway and expressway network in the Yangtze River Delta urban agglomeration has been shortened. In 2020, the transportation of passengers and goods in the Yangtze River Delta urban agglomeration was affected to some extent by the COVID-19 epidemic. At the same time, the Yangtze River Delta urban agglomeration transportation integration index showed a rising trend from 2011 to 2020. This indicates that, with the support of state policies, the level of integration of Yangtze River Delta urban agglomeration transportation has been raised, the high-speed traffic network has had a time compression effect on the Yangtze River Delta urban agglomeration, and a “kernel city linkage has formed, creating a periphery for the overall development pattern of day-to-day communication”.
The results of
Table 3 show that the transportation network of urban agglomerations in Yangtze River Delta mainly took “Shanghai–Nanjing–Hangzhou” as the core, and Suzhou and Hefei as the secondary cores in the periphery, presenting a spatial pattern of multi-center structure. The core city of the transportation network in the Yangtze River Delta had a high index value of the transportation network structure, which reflects its function as a transportation hub. The level of transportation integration in the marginal areas of Shanghai, Hangzhou, Nanjing, and Hefei was low. To accelerate the flow of various factors and optimize the development of regional industries, these regions need to speed up the construction of relevant transportation infrastructure and improve regional accessibility so as to promote the integrated development of transportation with higher quality in the Yangtze River Delta urban agglomeration.
In the second experiment, the development of transportation integration in urban agglomeration affected the industrial agglomeration level of urban agglomeration through the change in labor cost. However, the transportation integration in the urban agglomeration was also optimized owing to the improvement in the high-speed rail network in the Yangtze River Delta. These subsequently dissolved the existing traditional geographical barriers in a gradual manner, somewhat weakening the influence of location on industrial development, Shanghai, Jiangsu, and Zhejiang saw a decrease in industrial output in 2020 owing to COVID-19, which undermined the level of industrial agglomeration.
The Ti estimations indicate that, even with the socioeconomic impacts of COVID-19 on the Yangtze River Delta urban agglomeration being considered, the development of transportation infrastructure in every region can reduce the circulation cost of industrial raw materials, promote the adoption of new industrial technologies, increase industrial productivity, and thus facilitate local industrial agglomeration. Despite the improved transportation integration in Yangtze River Delta’s urban agglomerations, COVID-19 has impeded transportation and freight logistics, hitting local industrial development hard and dampening the promotional roles of local urban agglomerations’ comprehensive three-dimensional transportation network on industrial development.
In the third experiment, according to the above analysis, the transportation integration of urban agglomeration mainly affected regional industrial agglomeration through the “cost effect.” Of course, this effect may have also been realized through other mechanisms, such as human resource flows and changes in industrial land prices, which are worth studying separately in future work.
The resource reallocation caused by the transportation integration of urban agglomeration in the Yangtze River Delta exerted influence on labor-intensive industries. With the decentralization and relocation of industrial firms in Shanghai, southern Jiangsu, northern Zhejiang, northern Jiangsu, and Anhui need to seize the opportunity of the Yangtze River Delta urban agglomeration as a national strategy, and industrial enterprises should be attracted to set up factories and invest, realize the concentration of labor-intensive industries, and continuously foster and develop more technology-intensive industries. Regions with a favorable industrial base in the Yangtze River Delta should focus on their advantageous industries, promote cross-regional and cross-ownership industrial firm restructuring, and optimize their industrial structure by allocating production factors to higher-value-added industries. Rising labor costs create both pressure and motivation, prompting greater emphasis on industrial technology upgrades by enterprises. Moreover, to improve the quality of human capital, industrial firms should enhance their technological innovation capability.
7. Conclusions
This study selected the Yangtze River Delta urban agglomeration as the research area and combined it with the current situation of the transportation development of the Yangtze River Delta urban agglomeration to construct the urban agglomeration transportation integration index system and evaluate the development status of the Yangtze River Delta urban agglomeration transportation integration. From the perspective of transportation integration, the study examined the influence mechanism of transportation infrastructure on industrial agglomeration.
The transportation integration index of Yangtze River Delta urban agglomeration in 2019 and 2020 was 0.3937 and 0.3906, respectively, 4.62% and 3.8% higher than that in 2011. Owing to the impact of COVID-19, both passenger and cargo transportation in the Yangtze River Delta urban agglomeration in 2020 were affected to a certain extent. However, overall, the transportation integration index of the Yangtze River Delta urban agglomeration from 2011 to 2020 showed a clear upward trend.
The transportation integration index value of Yangtze River Delta urban agglomeration in 2020 ranked the top five cities as Shanghai, Hangzhou, Hefei, Suzhou, and Nanjing. This indicates that the transportation network of urban agglomerations in Yangtze River Delta mainly takes “Shanghai–Nanjing–Hangzhou” as the core, and Suzhou and Hefei as the secondary core in the periphery, presenting a spatial pattern of a multi-center structure. The cities with Ti values in the Yangtze River Delta in 2020 were Huangshan, Huaibei, Yancheng, Suqian, and Zhoushan. These cities are located at the edge of Shanghai, Hangzhou, Nanjing, Hefei, and other metropolitan areas, and their transportation integration level is low. These areas urgently need to speed up the construction of relevant transportation infrastructure so as to promote the integrated development of transportation of higher quality in the Yangtze River Delta urban agglomeration.
At present, the levels of local transportation integration in the Yangtze River Delta’s urban agglomerations significantly contribute to the local industrial agglomeration. Owing to COVID-19, the positive impact of local transportation integration on local industrial agglomeration has diminished. When the spatial effect is considered, the improved industrial agglomeration in neighboring areas has a negative spillover effect on the local industrial agglomeration. At present, transportation integration in other regions positively affects industrial agglomeration in the Yangtze River Delta, but the effect is not significant. Transportation integration in urban agglomerations mainly affects regional industrial agglomeration through the “cost effect”.
The marginal contribution of this paper is as follows: First, taking urban agglomeration’s transportation infrastructure as a starting point, the evaluation index of urban agglomeration’s transportation integration is constructed, which is included in the analysis of the impact of urban agglomeration’s industrial agglomeration as an important exogenous variable, and the explanatory framework of its related theories is improved. Second, the heterogeneity of cities is fully considered, and the heterogeneity of the impact of transport integration on industrial agglomeration is empirically studied, which expands the research field of transport economics and enriches the connotation of external economic benefits of transport infrastructure to a certain extent. Finally, the variable measuring labor cost is introduced to study the impact of labor cost changes caused by transportation integration in urban agglomeration on industrial agglomeration, and we empirically reveal the impact mechanism of transportation integration in urban agglomeration on industrial agglomeration. The research significance of this paper is to try to supplement the theory of regional industrial agglomeration and transport economy and to provide a reference for the practice and development of industry and the transport industry in urban agglomeration.


