
Numerical Analysis of a Dual-Wavelength-Clad-Pumped 3.5 μm Erbium-Doped Fluoride Fiber Laser

Abstract
:1. Introduction
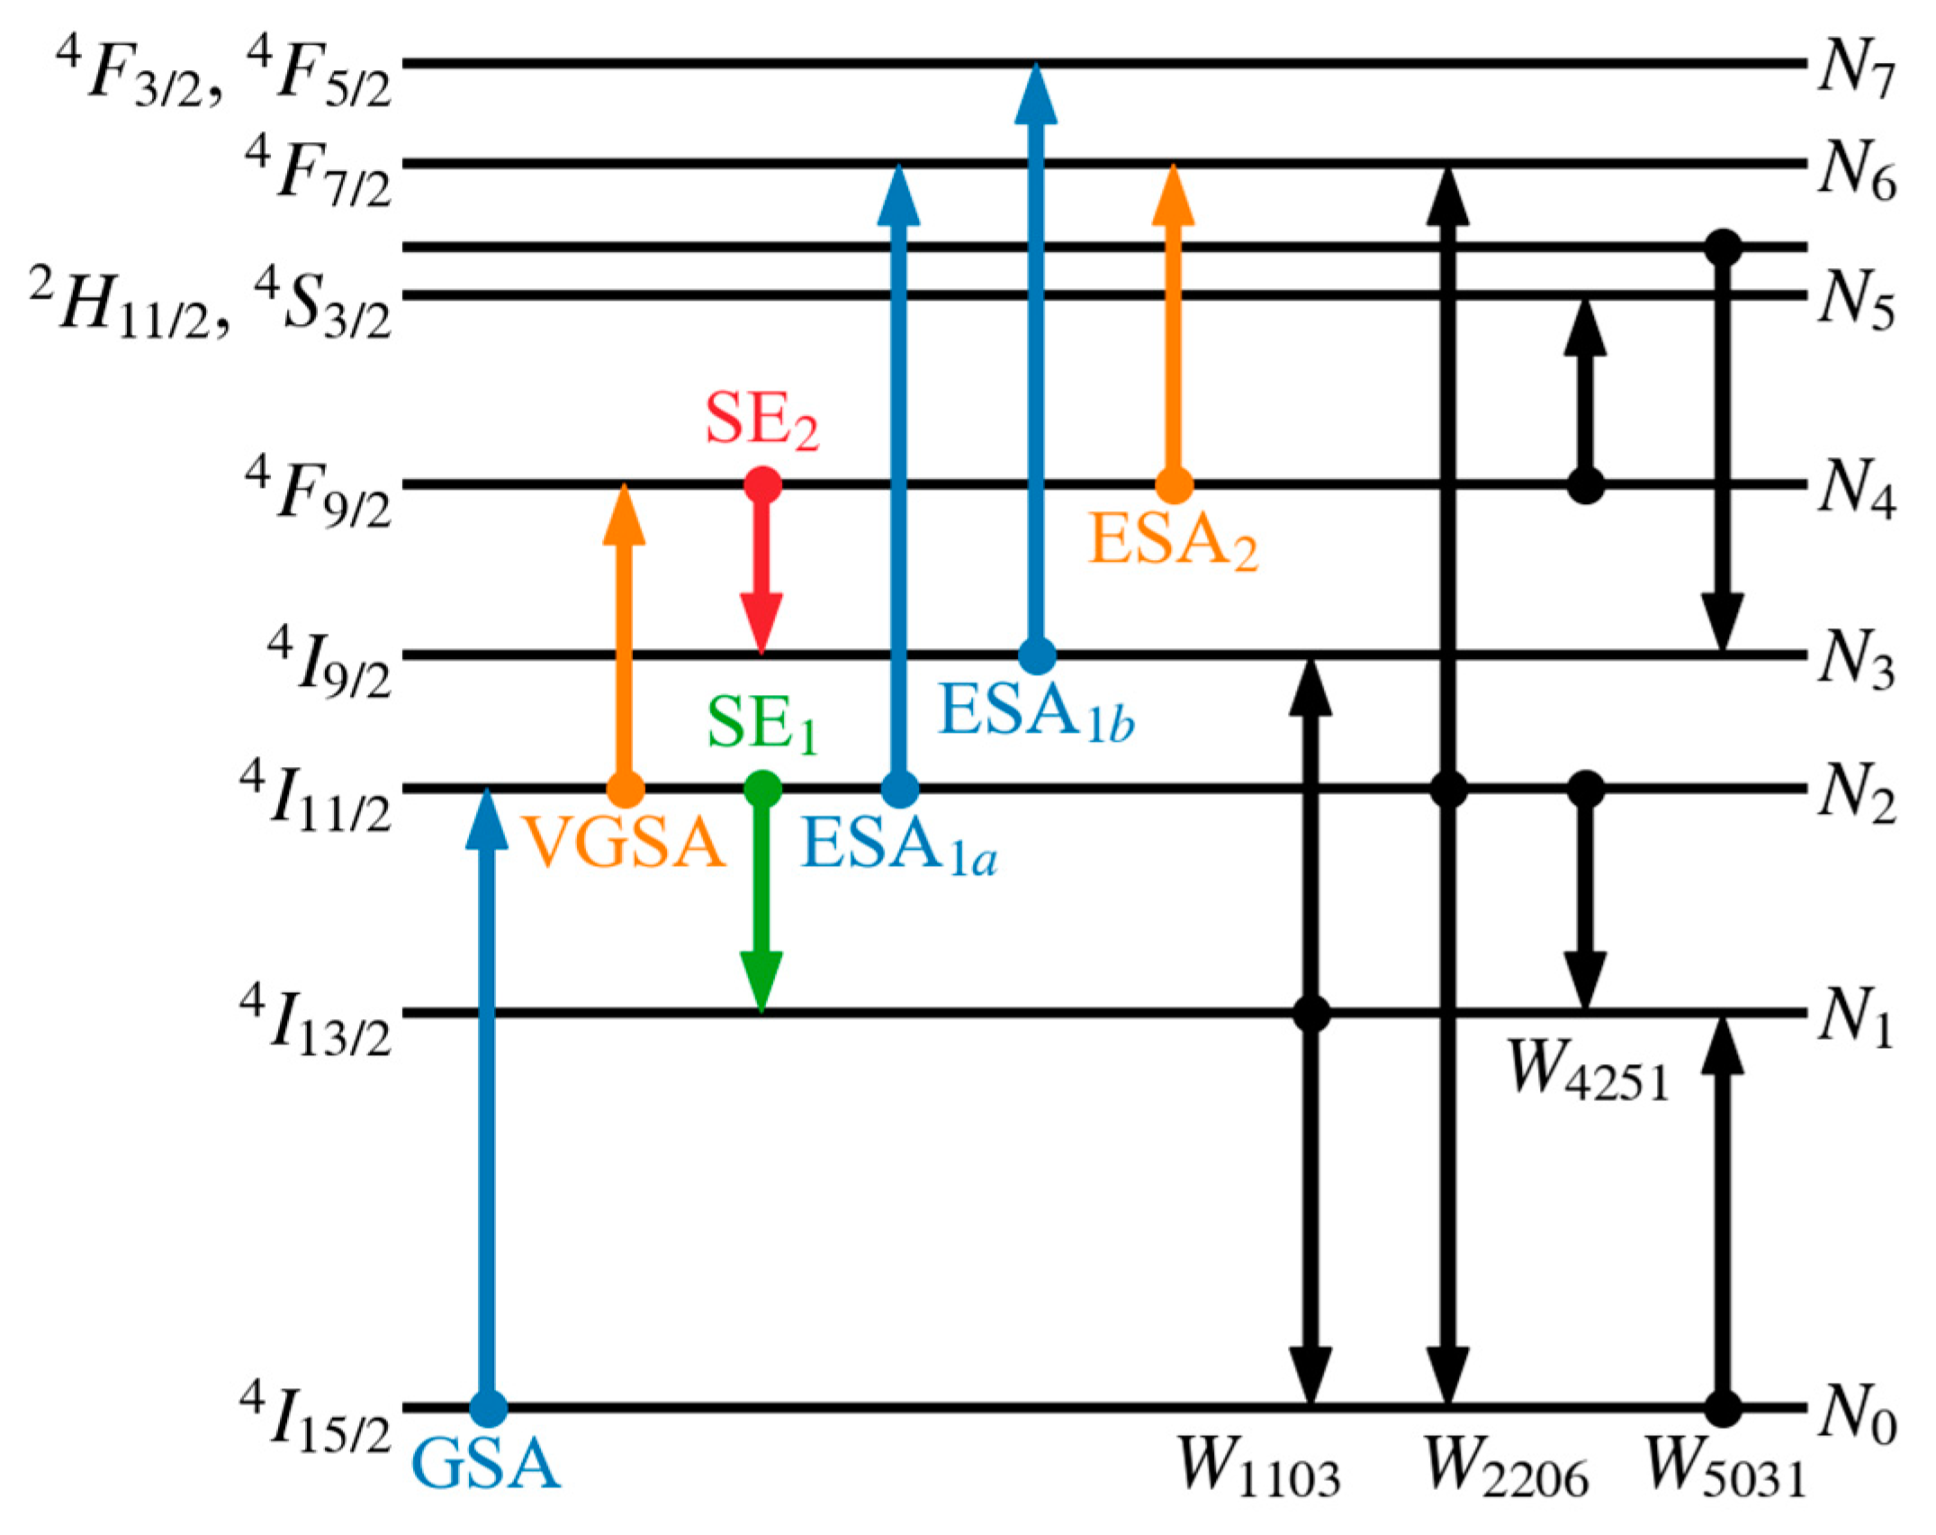
2. Numerical Model
3. Results and Discussion
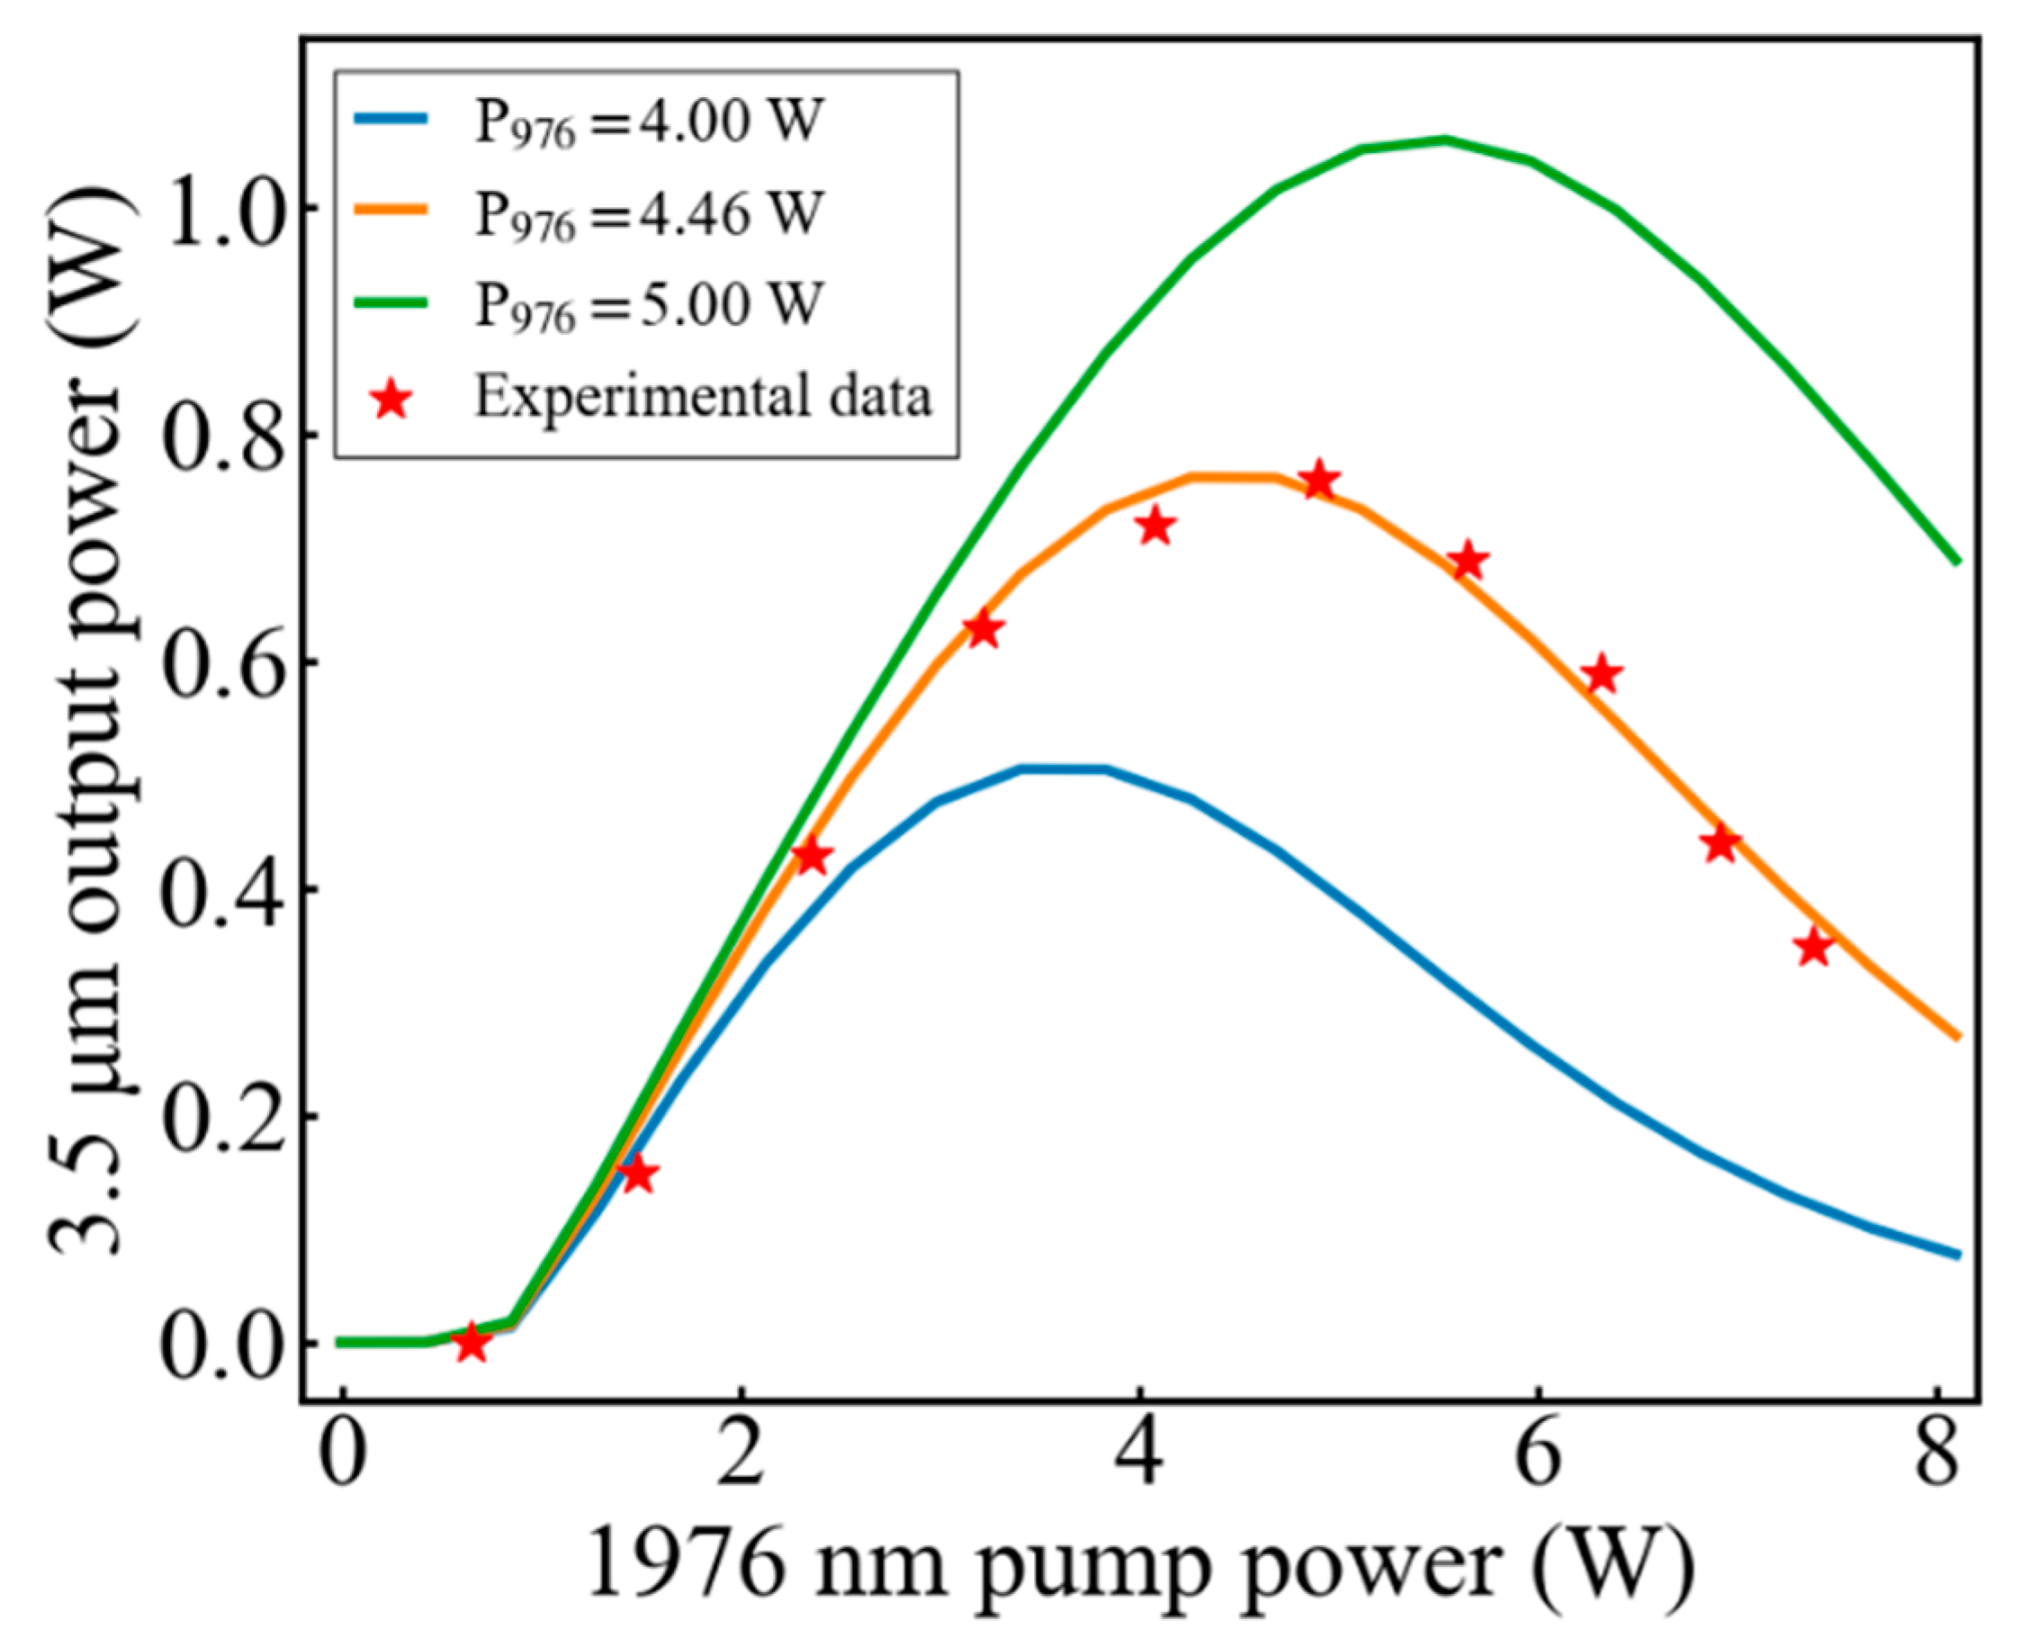
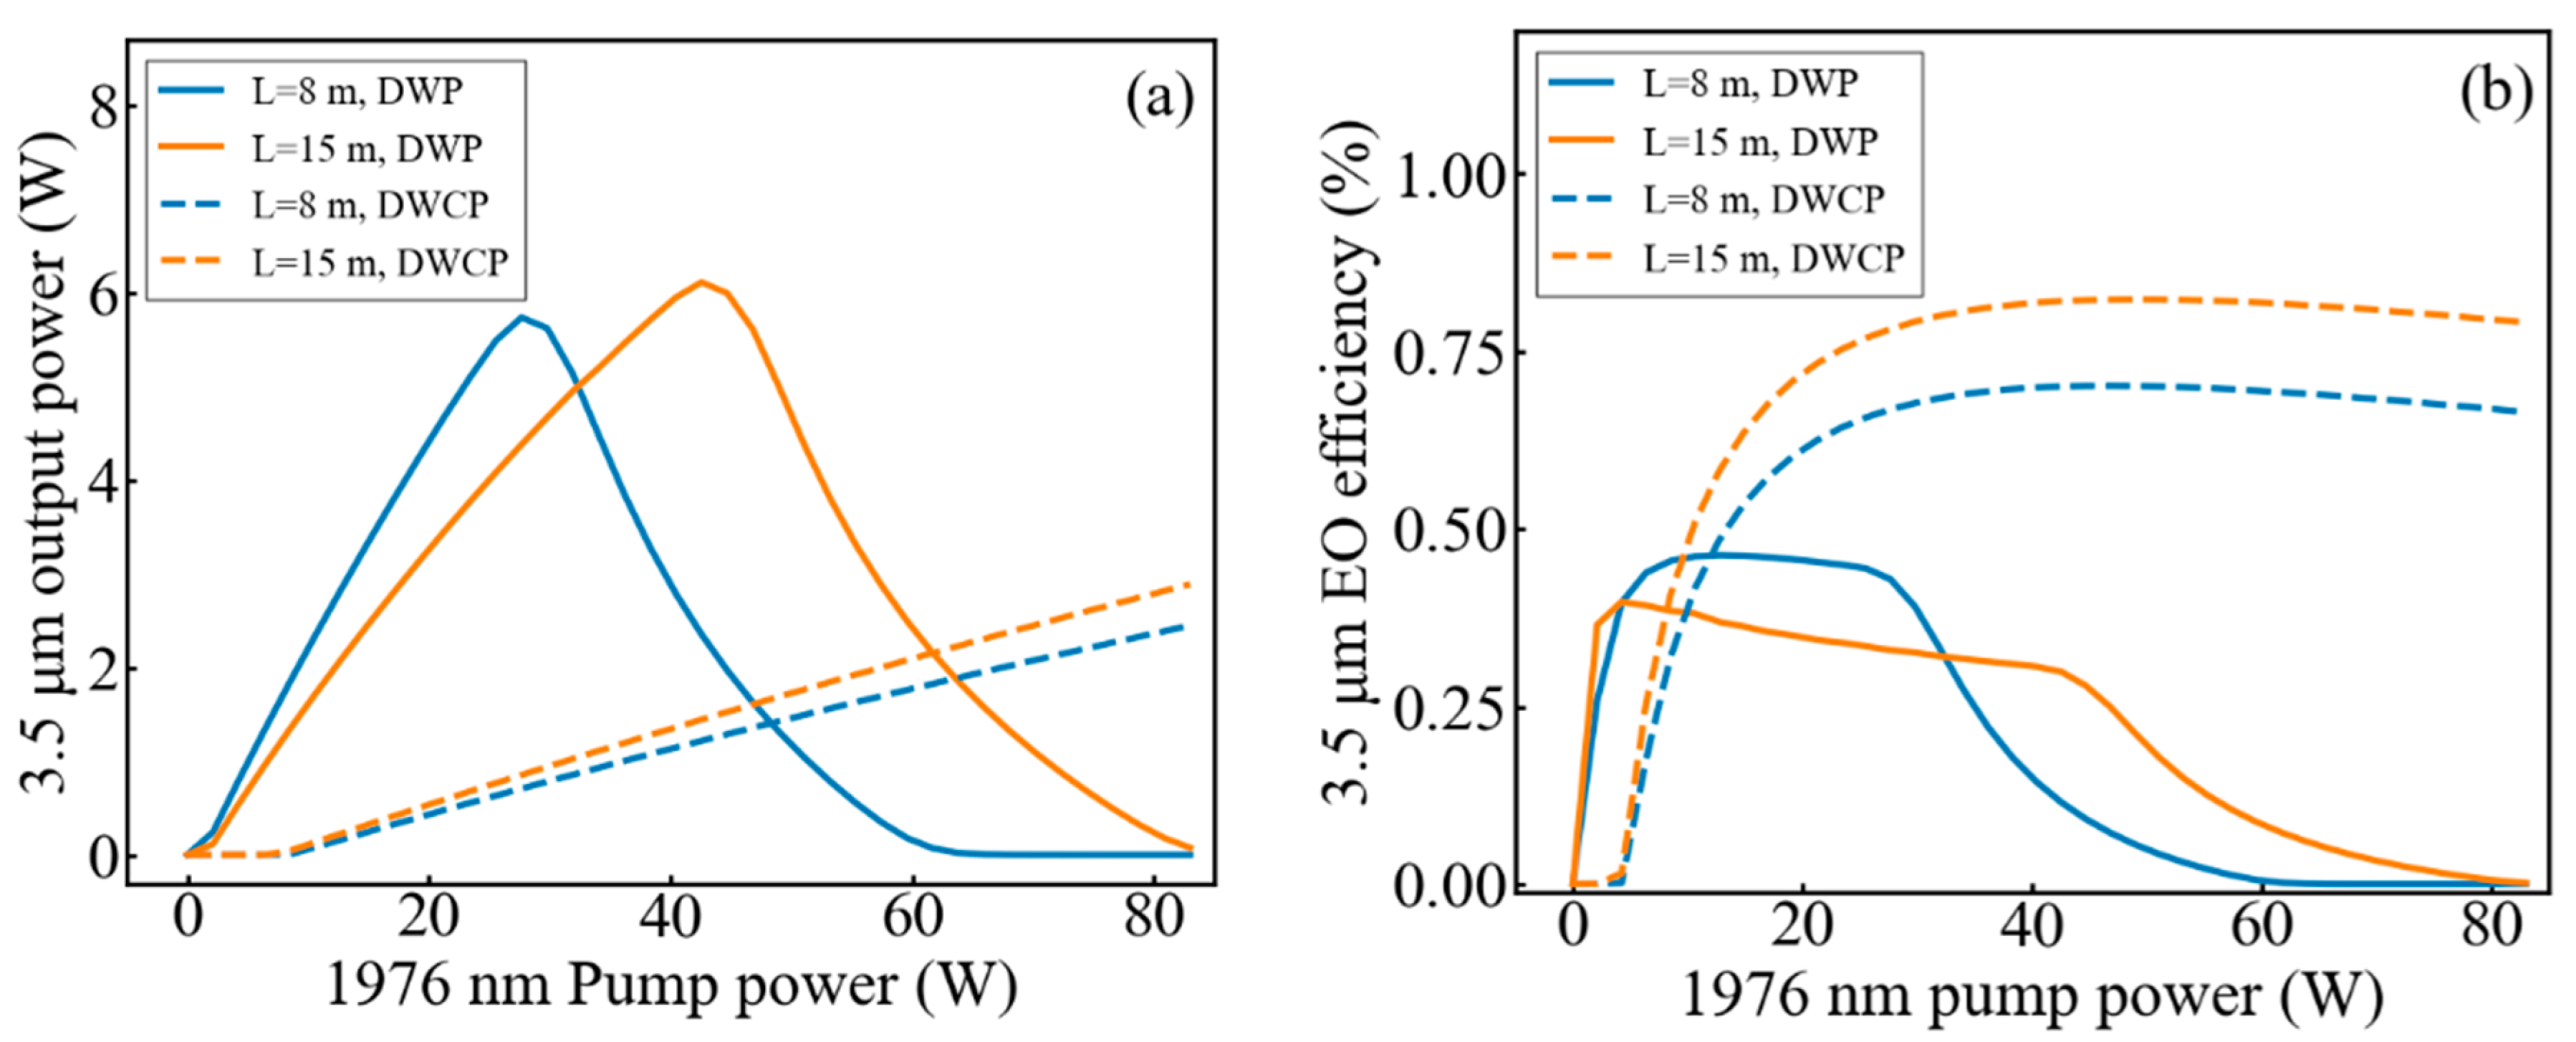
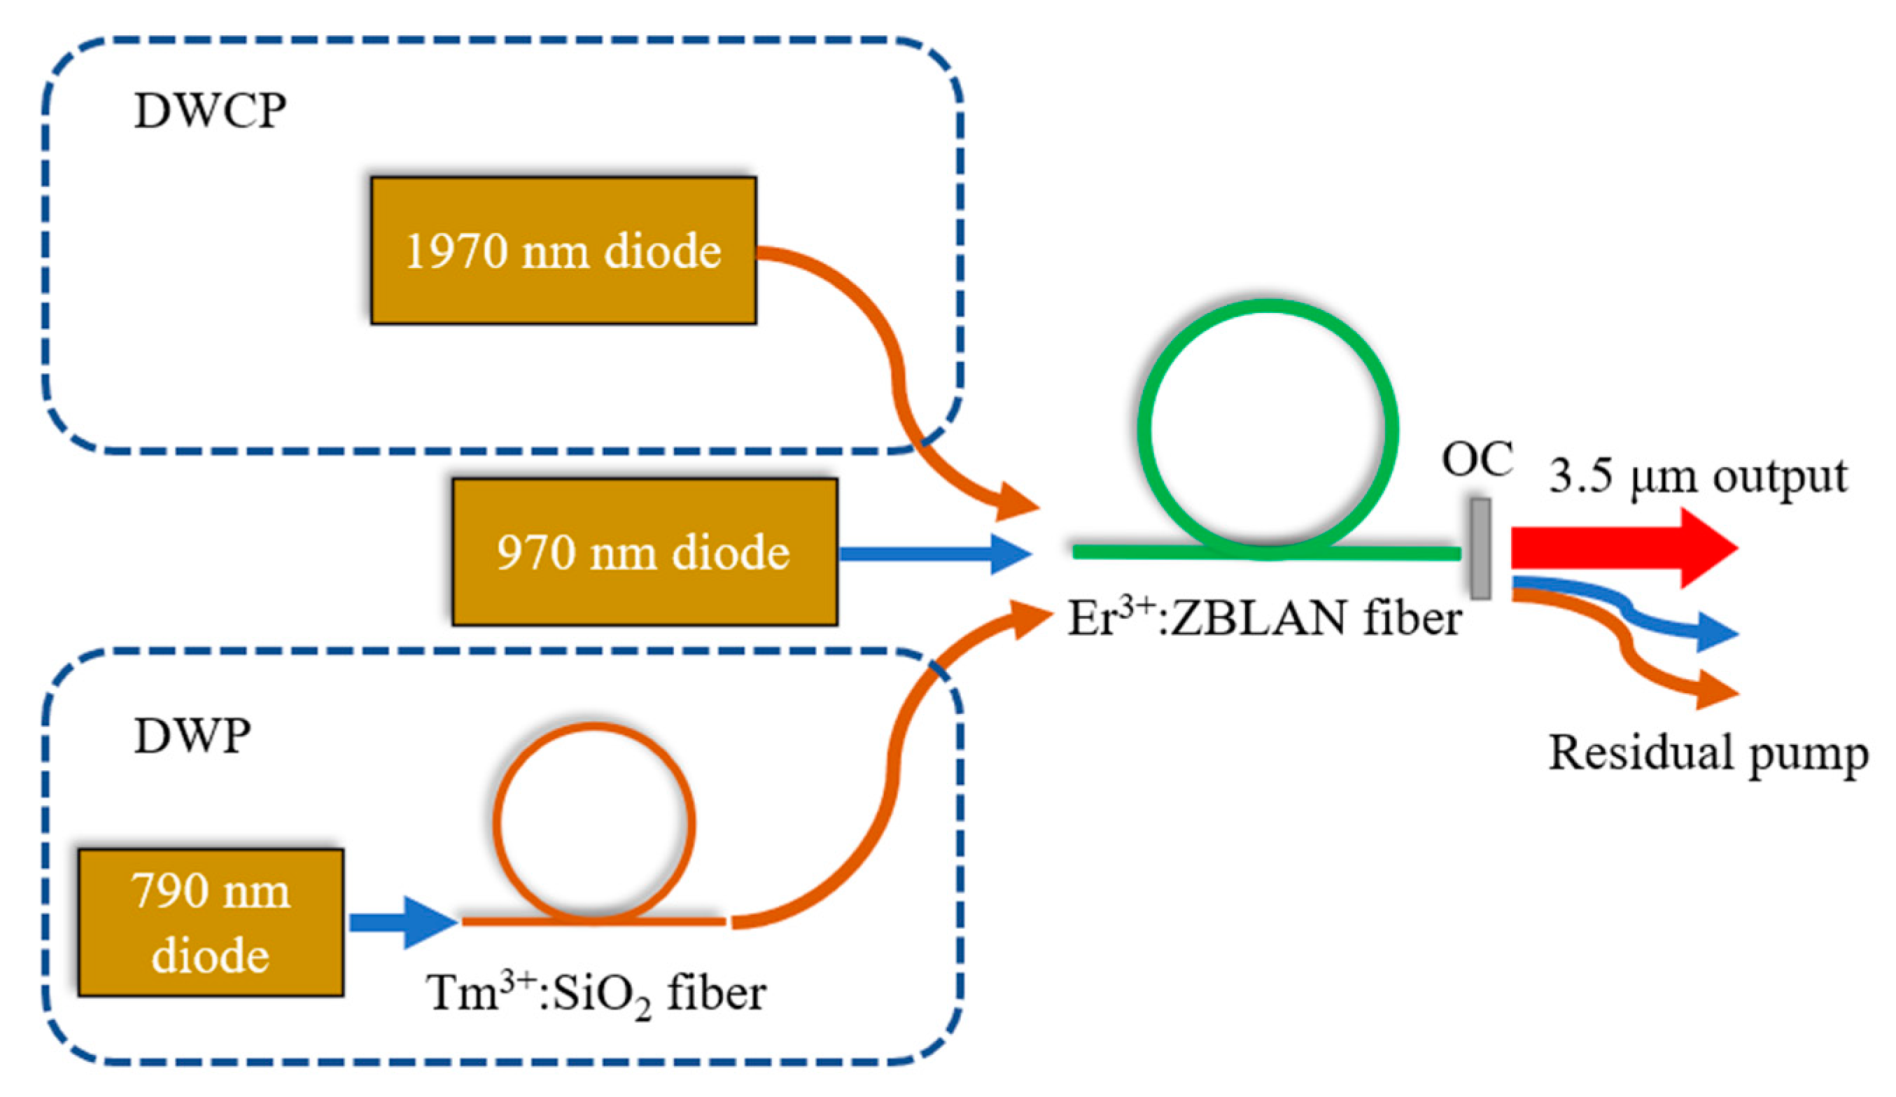
3.1. DWCP and Pump Absorbed Rate
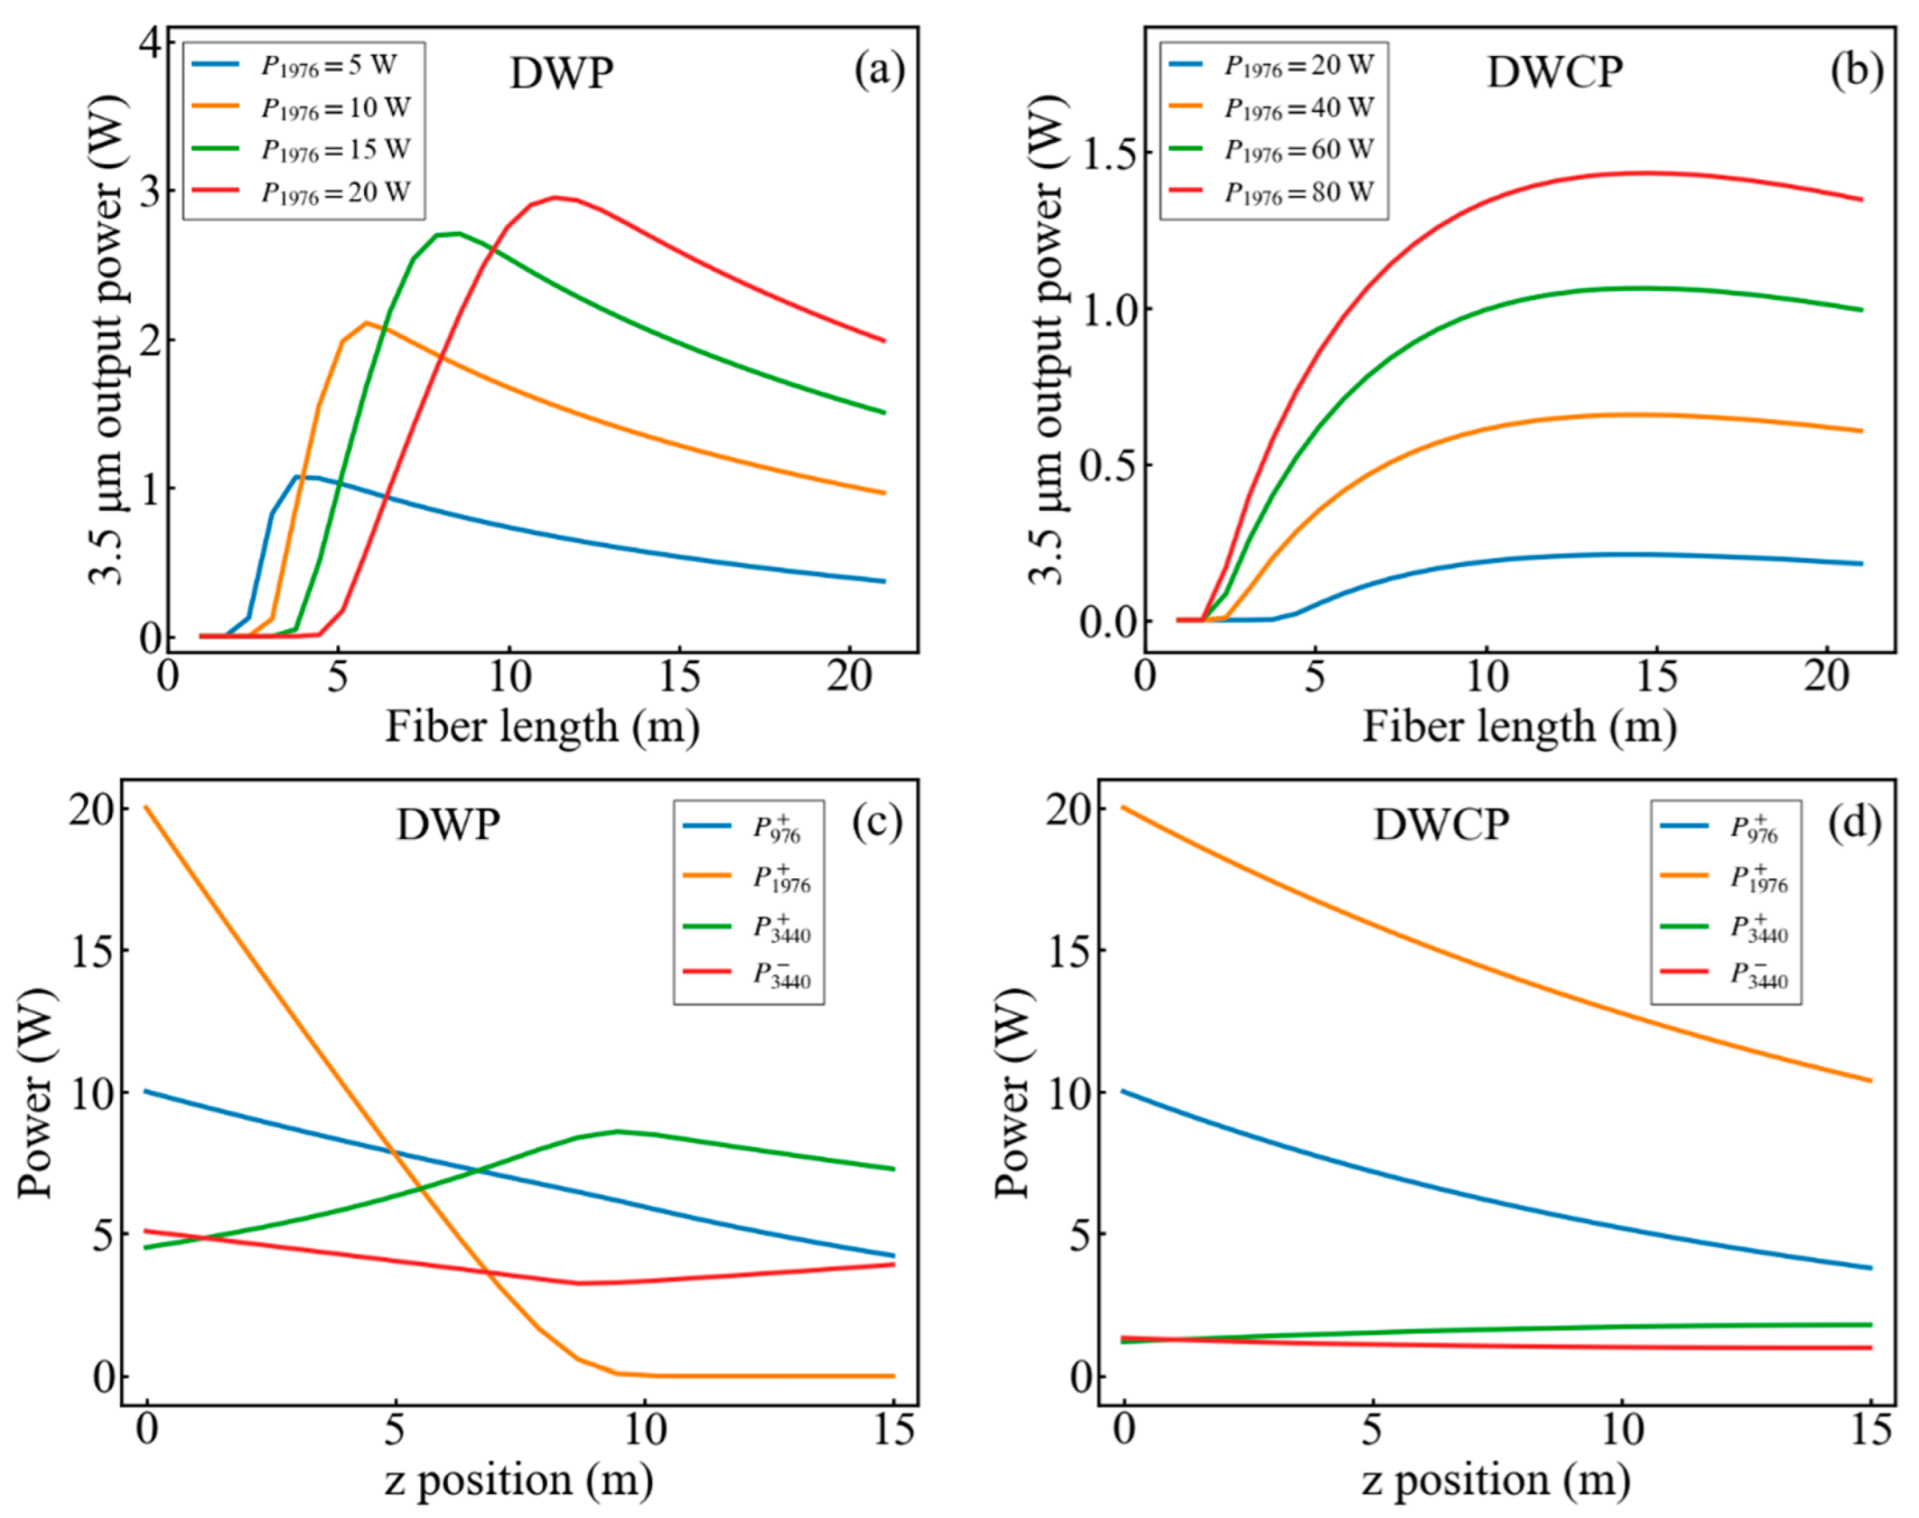
3.2. Fiber Length
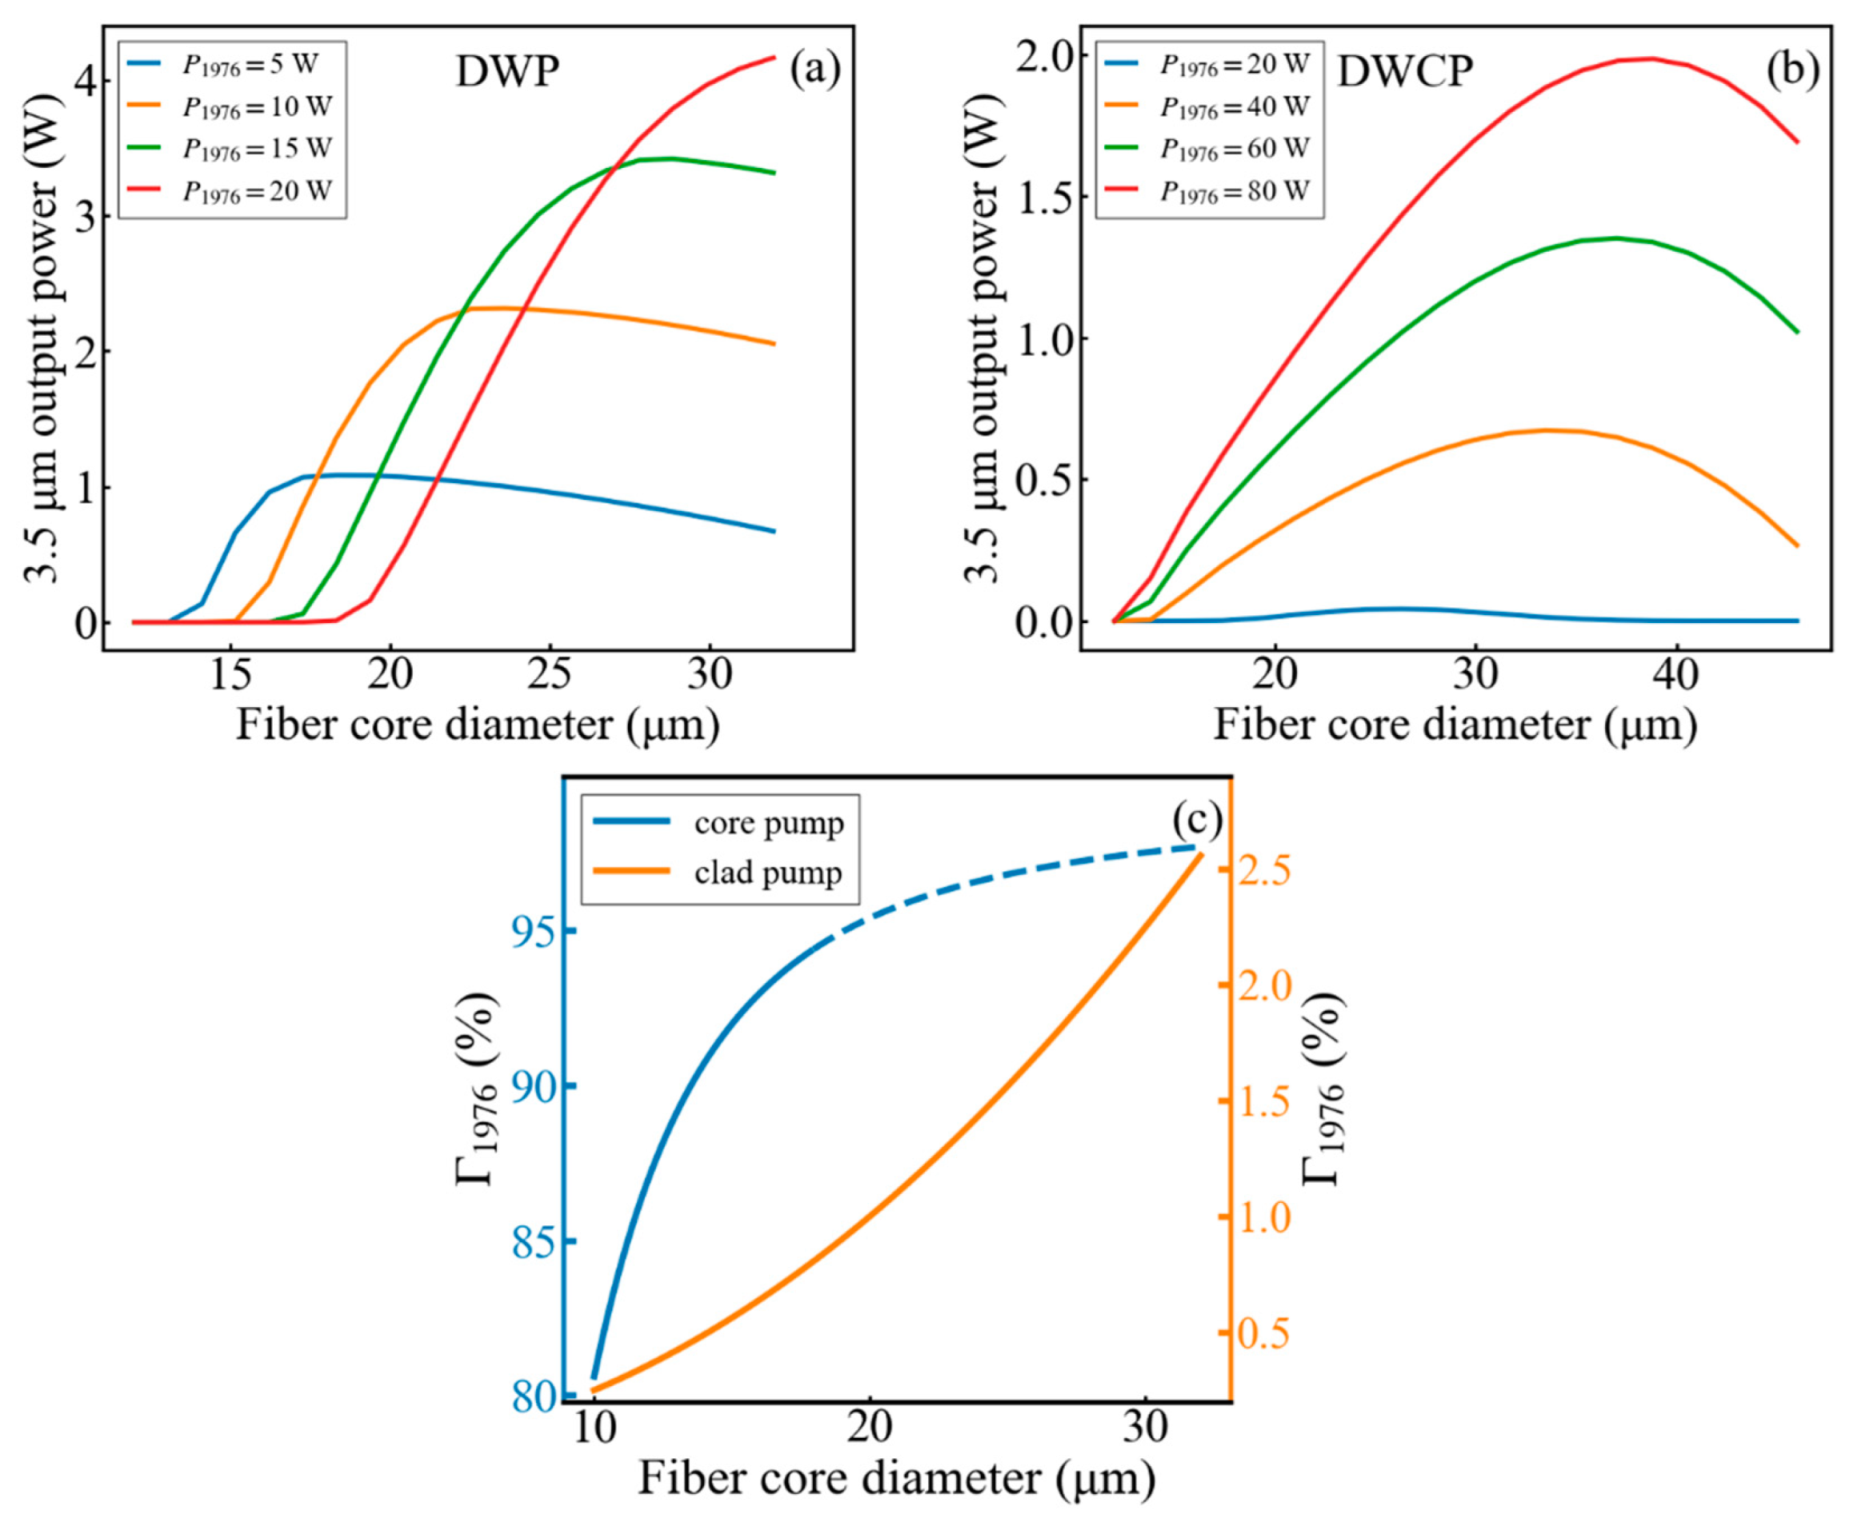
3.3. Core Diameter
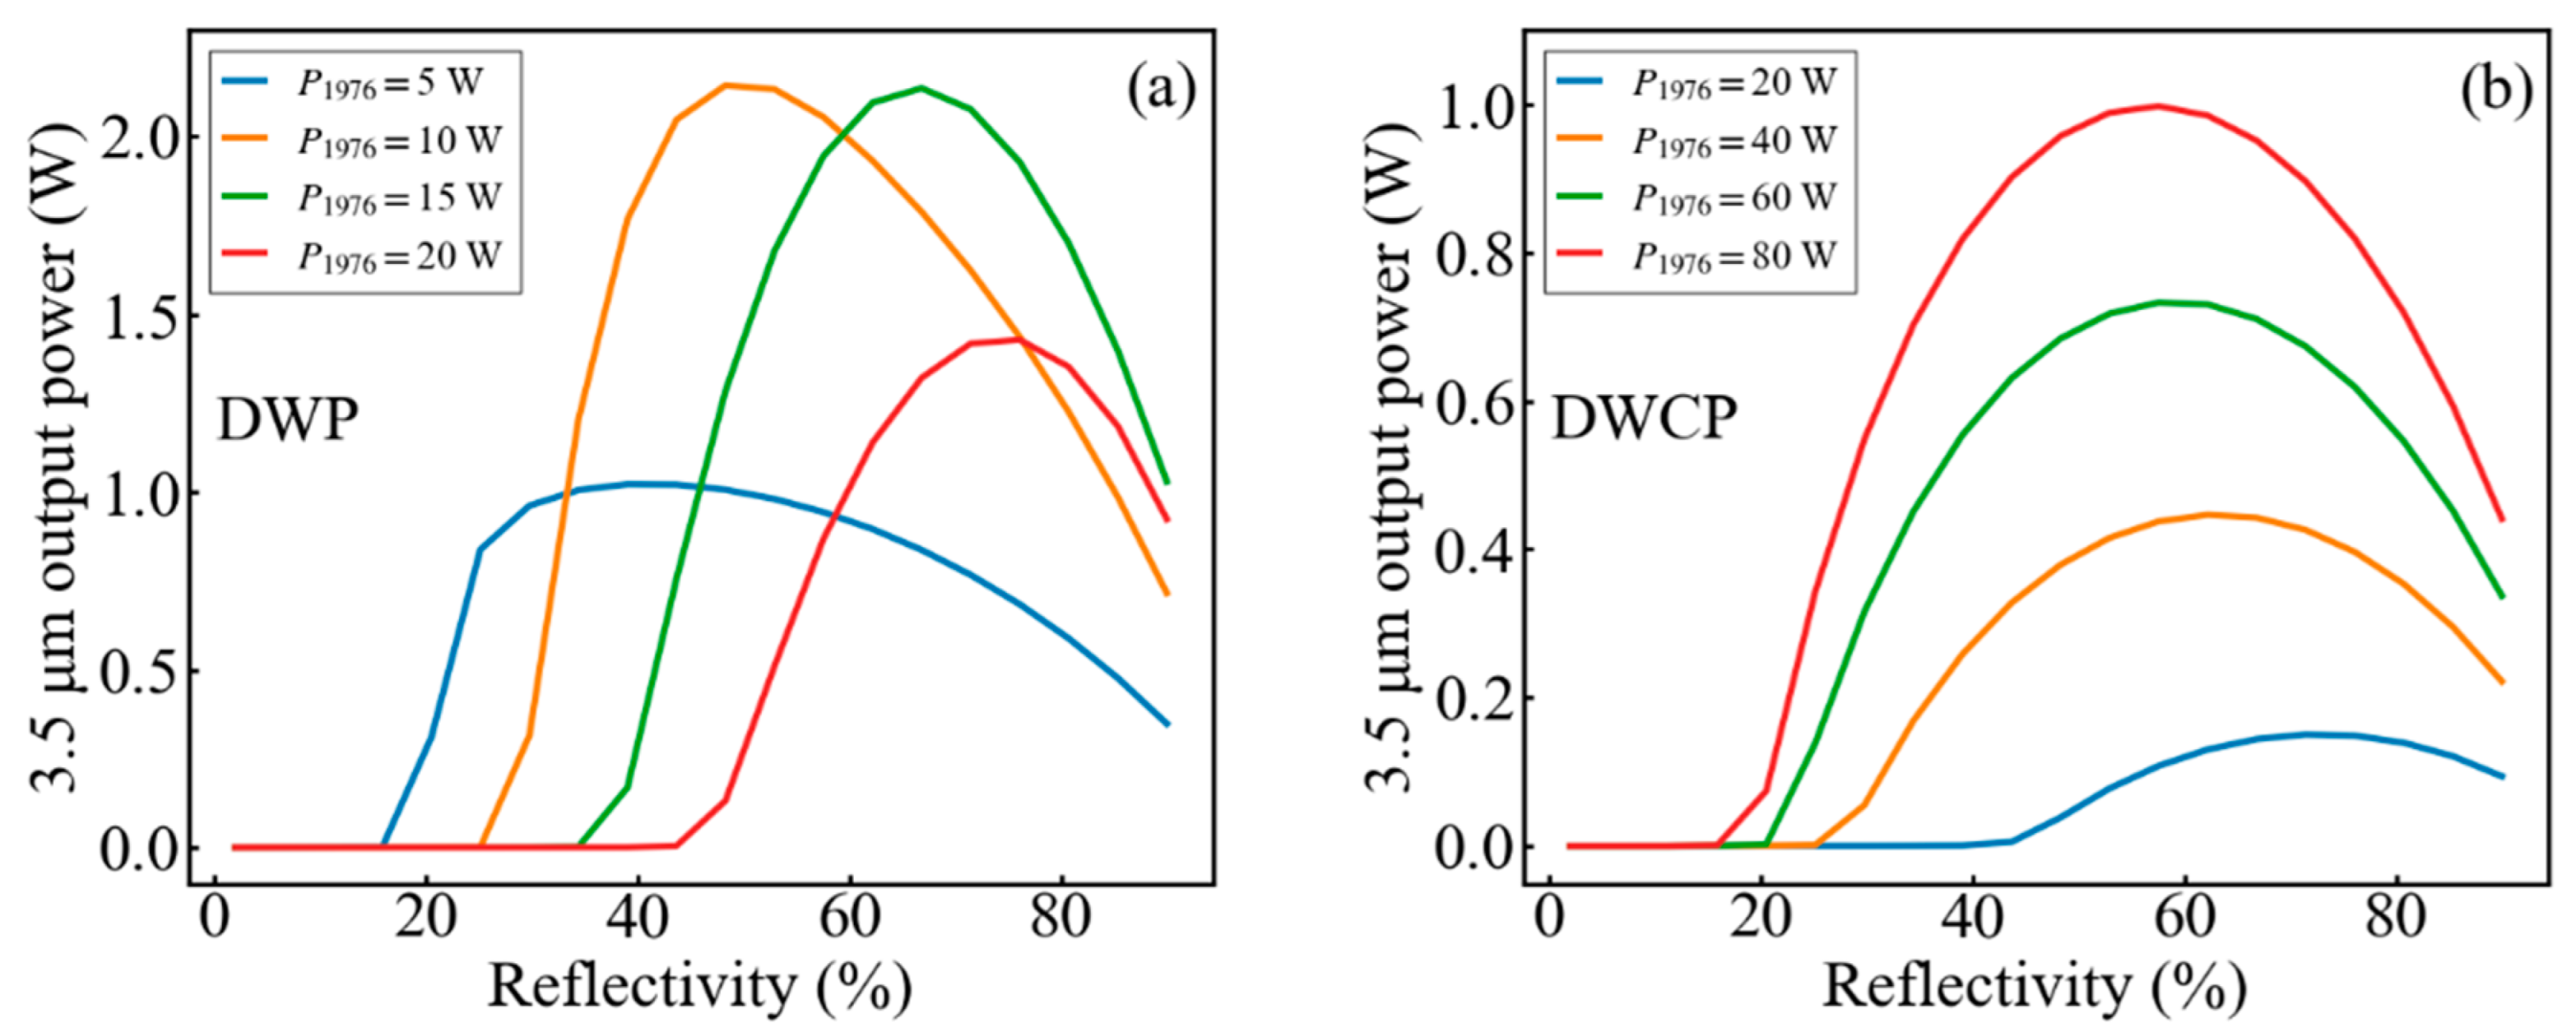
3.4. Reflectivity of Resonant Cavity
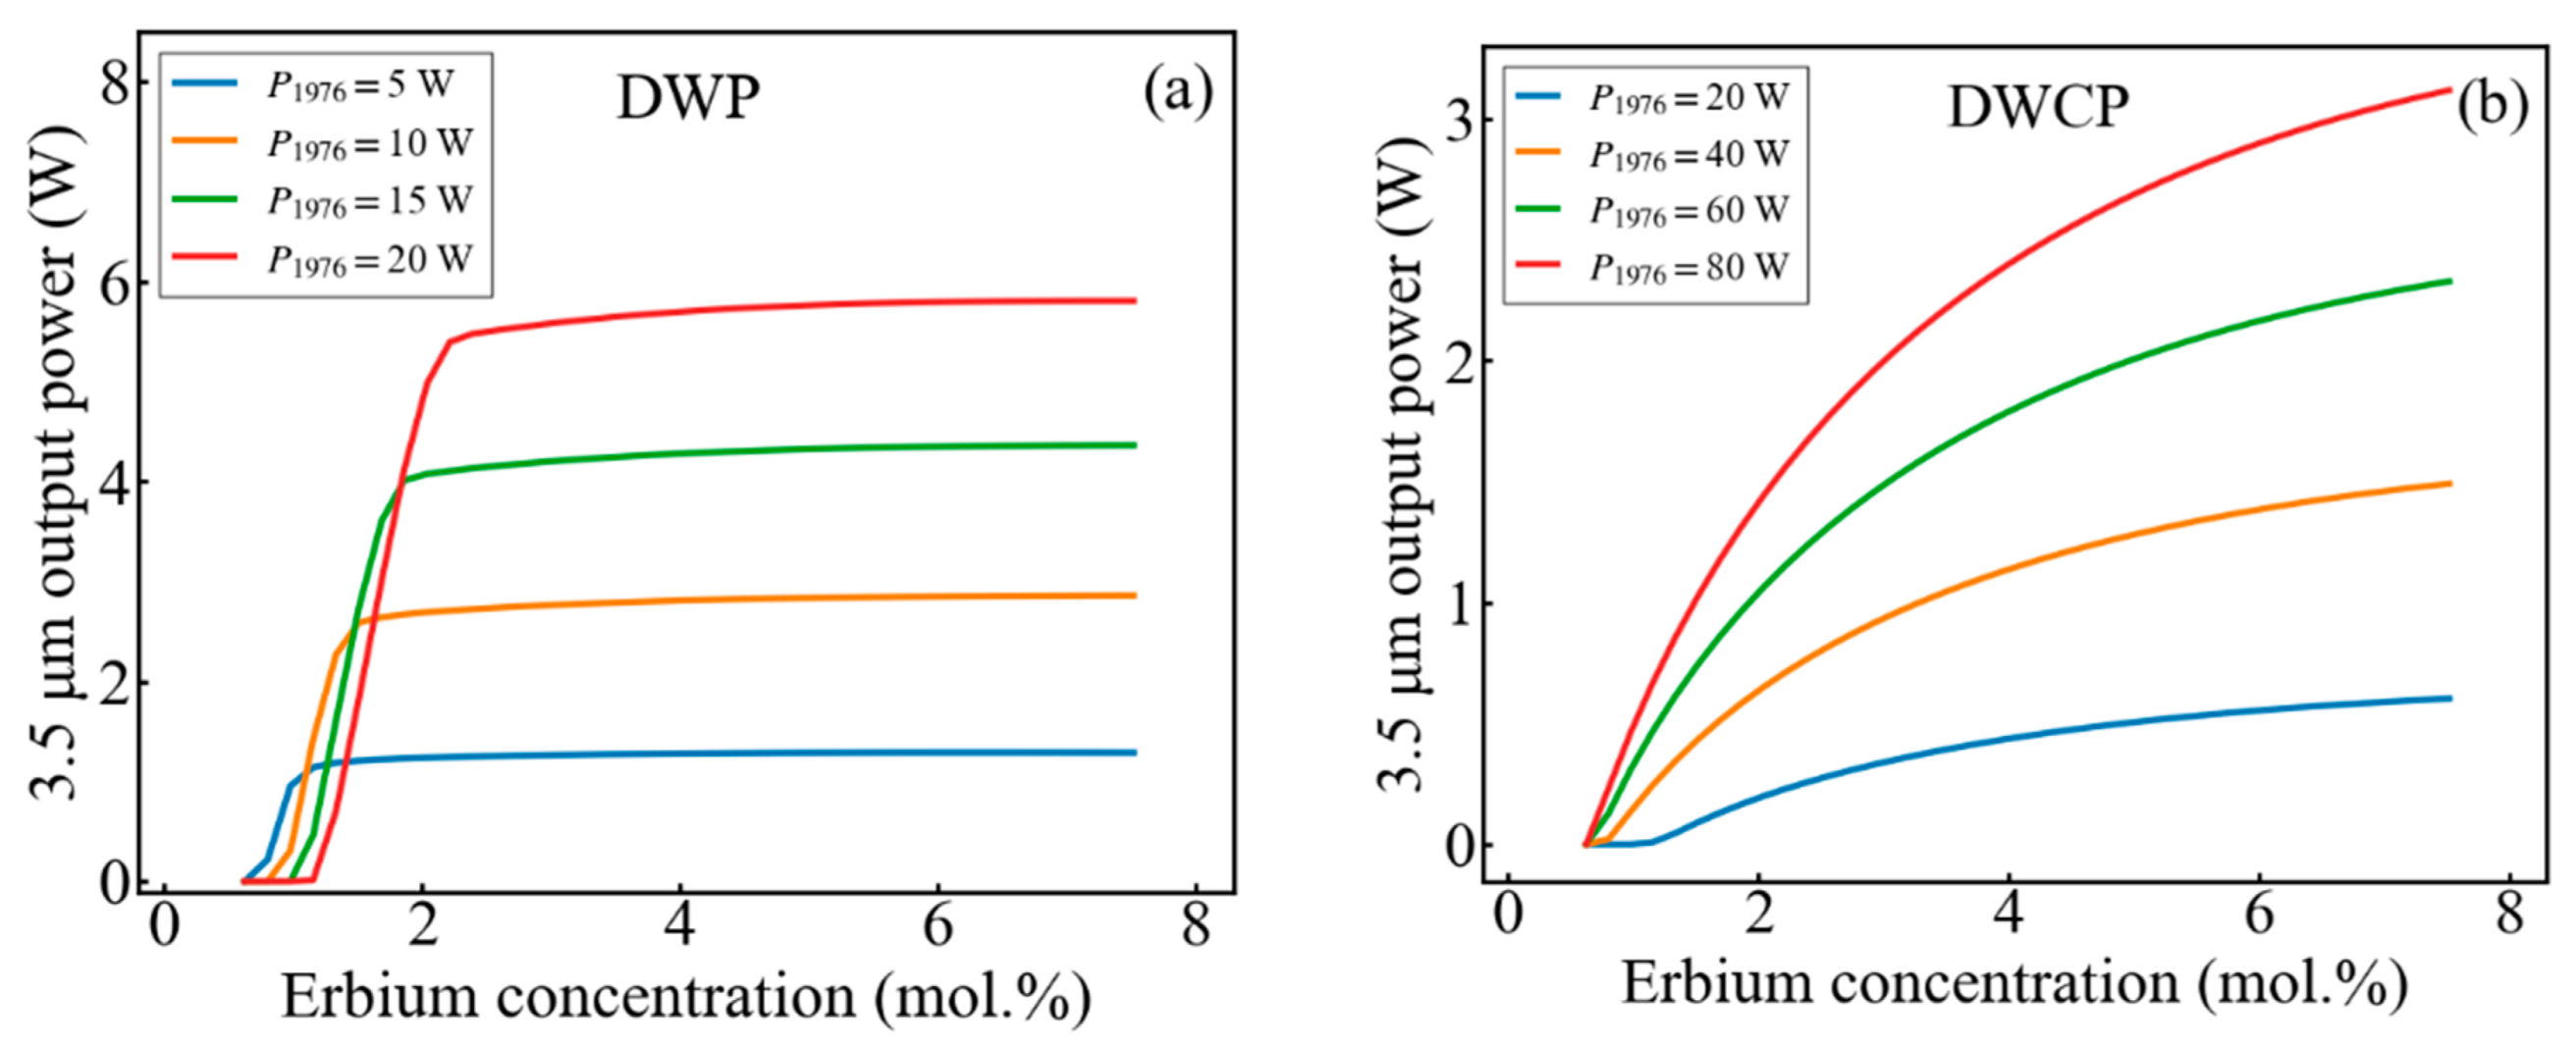
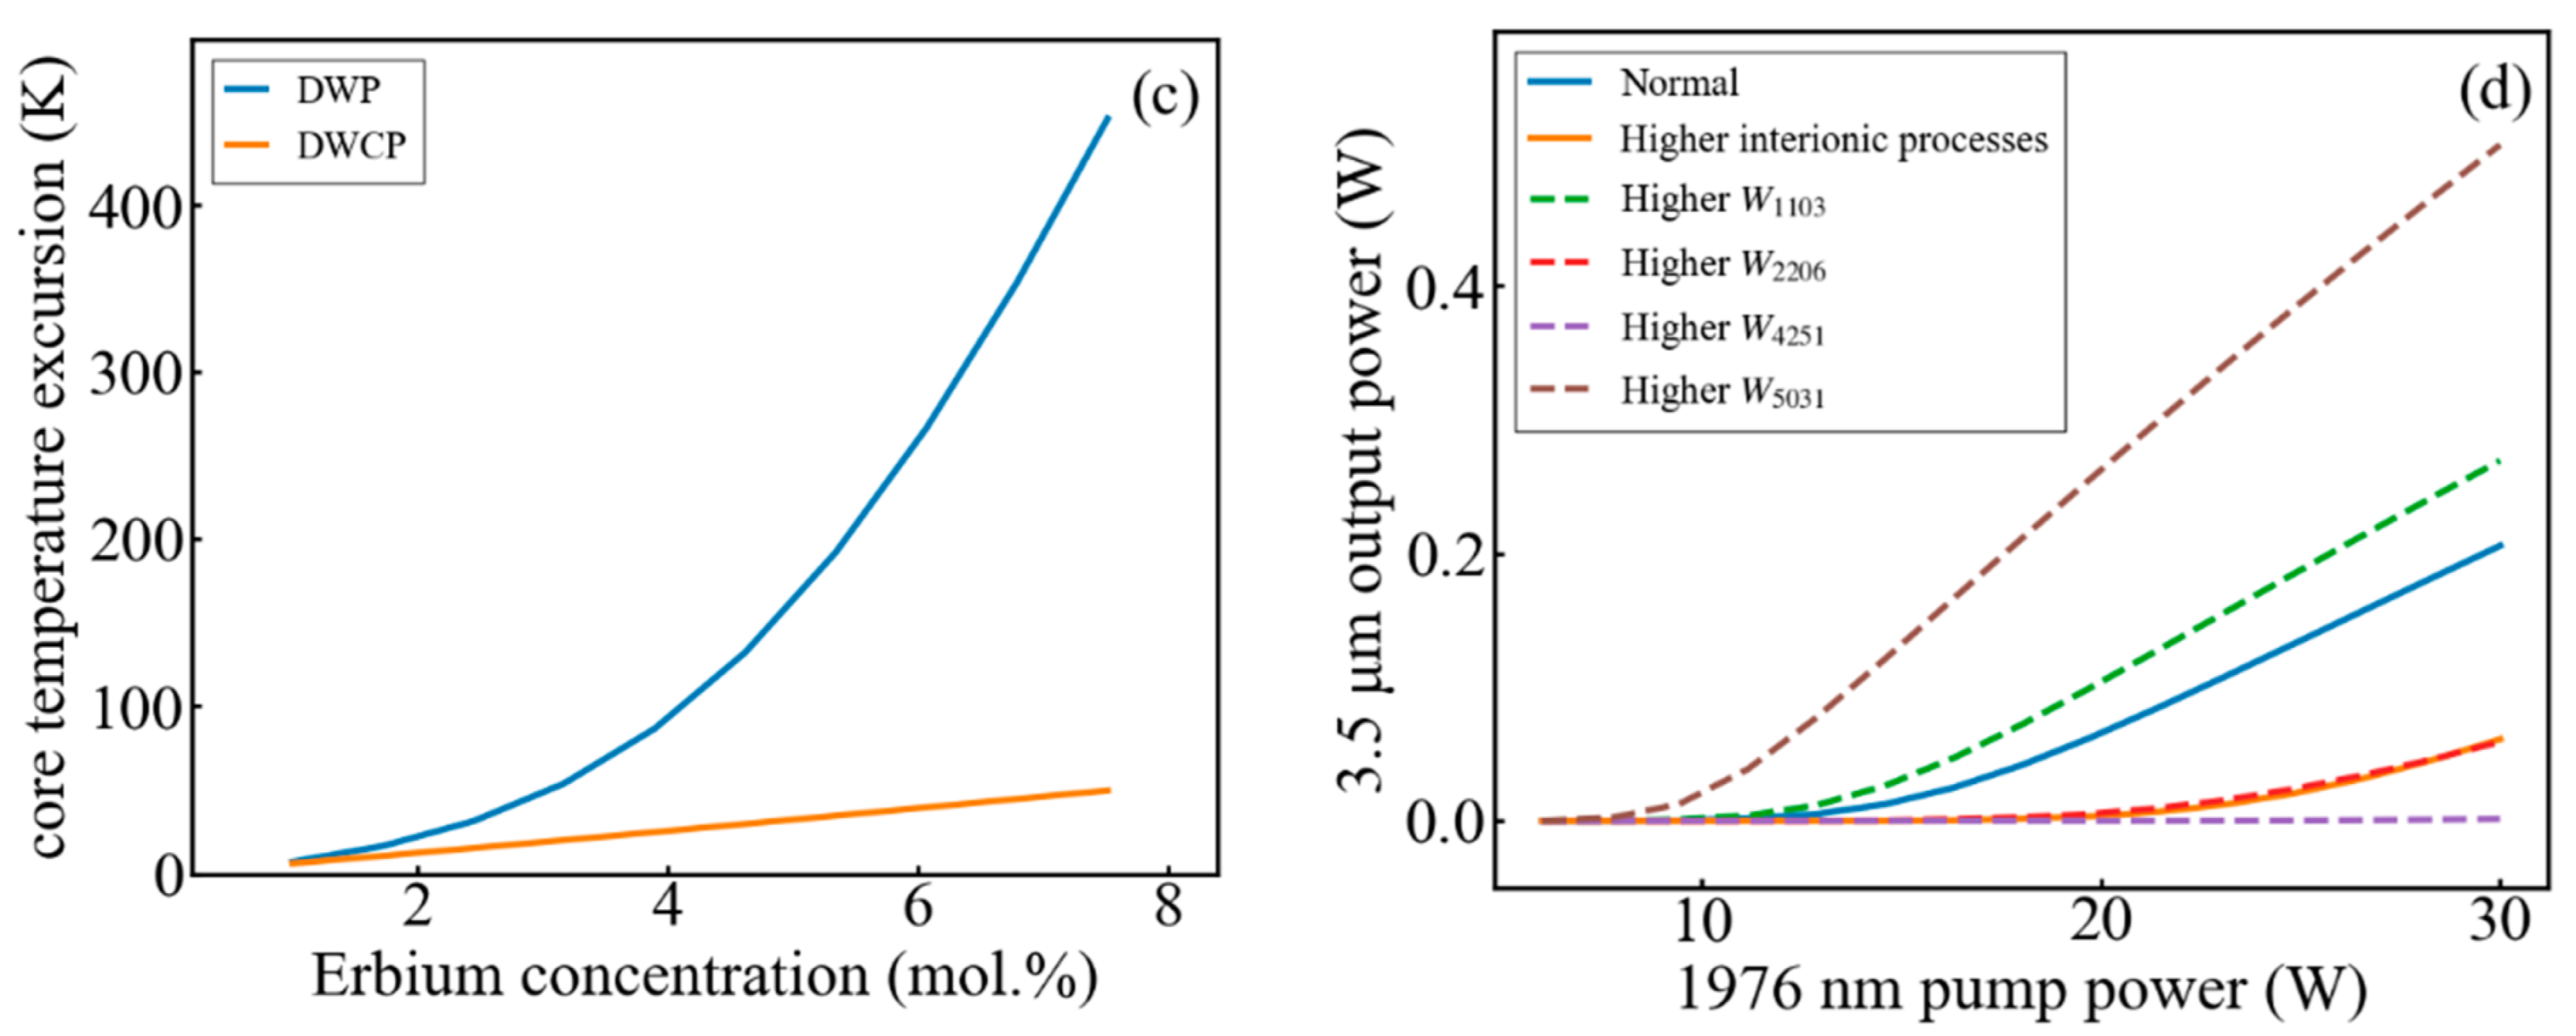
3.5. Dopant Concentration
4. Conclusions
Author Contributions
Funding
Institutional Review Board Statement
Data Availability Statement
Acknowledgments
Conflicts of Interest
Appendix A

Appendix B
References
- Jackson, S.D.; Jain, R.K. Fiber-based sources of coherent MIR radiation: Key advances and future prospects (invited). Opt. Express 2020, 28, 30964–31019. [Google Scholar] [CrossRef] [PubMed]
- Bekman, H.H.P.T.; Heuvel, J.C.V.D.; van Putten, F.J.M.; Schleijpen, R. Development of a mid-infrared laser for study of infrared countermeasures techniques. In Proceedings of the European Symposium on Optics and Photonics for Defence and Security, London, UK, 25–28 October 2004; pp. 27–38. [Google Scholar]
- Walsh, B.M.; Lee, H.R.; Barnes, N.P. Mid infrared lasers for remote sensing applications. J. Lumin 2016, 169, 400–405. [Google Scholar] [CrossRef]
- Kottmann, J.; Grob, U.; Rey, J.M.; Sigrist, M.W. Mid-Infrared Fiber-Coupled Photoacoustic Sensor for Biomedical Applications. Sensors 2013, 13, 535–549. [Google Scholar] [CrossRef] [PubMed]
- Henderson-Sapir, O.; Munch, J.; Ottaway, D.J. Mid-infrared fiber lasers at and beyond 35 μm using dual-wavelength pumping. Opt. Lett. 2014, 39, 493–496. [Google Scholar] [CrossRef]
- Fortin, V.; Maes, F.; Bernier, M.; Bah, S.T.; D’Auteuil, M.; Vallée, R. Watt-level erbium-doped all-fiber laser at 344 μm. Opt. Lett. 2016, 41, 559–562. [Google Scholar] [CrossRef] [PubMed]
- Maes, F.; Fortin, V.; Bernier, M.; Vallée, R. 56 W monolithic fiber laser at 355 μm. Opt. Lett. 2017, 42, 2054–2057. [Google Scholar] [CrossRef] [PubMed]
- Lemieux-Tanguay, M.; Fortin, V.; Boilard, T.; Paradis, P.; Maes, F.; Talbot, L.; Vallée, R.; Bernier, M. 15 W monolithic fiber laser at 3.55 µm. Opt. Lett. 2022, 47, 289–292. [Google Scholar] [CrossRef] [PubMed]
- Reboul, J.R.; Cerutti, L.; Rodriguez, J.B.; Tournié, E.; Grech, P. Continuous-wave operation above room temperature of GaSb-based laser diodes grown on Si. Appl. Phys. Lett. 2011, 99, 121113. [Google Scholar] [CrossRef] [Green Version]
- Liao, Y.; Zhang, Y.; Yang, C.; Huang, S.; Chai, X.; Wang, G.; Xu, Y.; Ni, H.; Niu, Z. High-power, high-efficient GaSb-based quantum well laser diodes emitting at 2 μm. J. Infrared Millim. Waves 2016, 35, 672–675. [Google Scholar] [CrossRef]
- Yang, C.-A.; Xie, S.-W.; Zhang, Y.; Shang, J.-M.; Huang, S.-S.; Yuan, Y.; Shao, F.-H.; Zhang, Y.; Xu, Y.-Q.; Niu, Z.-C. High-power, high-spectral-purity GaSb-based laterally coupled distributed feedback lasers with metal gratings emitting at 2 μm. Appl. Phys. Lett. 2019, 114, 021102. [Google Scholar] [CrossRef]
- Xie, S.-W.; Zhang, Y.; Yang, C.-A.; Huang, S.-S.; Yuan, Y.; Zhang, Y.; Shang, J.-M.; Shao, F.-H.; Xu, Y.-Q.; Ni, H.-Q.; et al. High performance GaSb based digital-grown InGaSb/AlGaAsSb mid-infrared lasers and bars. Chin. Phys. B 2019, 28, 014208. [Google Scholar] [CrossRef]
- Henderson-Sapir, O.; Jackson, S.; Ottaway, D.J. Versatile and widely tunable mid-infrared erbium doped ZBLAN fiber laser. Opt. Lett. 2016, 41, 1676–1679. [Google Scholar] [CrossRef] [PubMed] [Green Version]
- Henderson-Sapir, O.; Munch, J.; Ottaway, D.J. New energy-transfer upconversion process in Er^3+: ZBLAN mid-infrared fiber lasers. Opt. Express 2016, 24, 6869–6883. [Google Scholar] [CrossRef] [PubMed] [Green Version]
- Maes, F.; Fortin, V.; Bernier, M.; Vallee, R. Quenching of 3.4 μm Dual-Wavelength Pumped Erbium Doped Fiber Lasers. IEEE J. Quantum Electron. 2017, 53, 1–8. [Google Scholar] [CrossRef]
- Marcuse, D. Gaussian approximation of the fundamental modes of graded-index fibers. J. Opt. Soc. Am. 1978, 68, 103–109. [Google Scholar] [CrossRef]
- Malouf, A.; Henderson-Sapir, O.; Gorjan, M.; Ottaway, D.J. Numerical Modeling of 3.5 μm Dual-Wavelength Pumped Erbium-Doped Mid-Infrared Fiber Lasers. IEEE J. Quantum Electron. 2016, 52, 1–12. [Google Scholar] [CrossRef] [Green Version]
- Li, J.; Luo, H.; Liu, Y.; Zhang, L.; Jackson, S.D. Modeling and Optimization of Cascaded Erbium and Holmium Doped Fluoride Fiber Lasers. IEEE J. Sel. Top. Quantum Electron. 2013, 20, 15–28. [Google Scholar] [CrossRef]
- Gorjan, M.; Marincek, M.; Copic, M. Pump absorption and temperature distribution in erbium-doped double-clad fluoride-glass fibers. Opt. Express 2009, 17, 19814–19822. [Google Scholar] [CrossRef] [PubMed]


Publisher’s Note: MDPI stays neutral with regard to jurisdictional claims in published maps and institutional affiliations. |
© 2022 by the authors. Licensee MDPI, Basel, Switzerland. This article is an open access article distributed under the terms and conditions of the Creative Commons Attribution (CC BY) license (https://creativecommons.org/licenses/by/4.0/).
Share and Cite
Cai, K.; Zhang, X.; Wang, L.; Wang, Y.; Lu, H.; Tong, C.; Wang, L. Numerical Analysis of a Dual-Wavelength-Clad-Pumped 3.5 μm Erbium-Doped Fluoride Fiber Laser. Appl. Sci. 2022, 12, 7666. https://doi.org/10.3390/app12157666
Cai K, Zhang X, Wang L, Wang Y, Lu H, Tong C, Wang L. Numerical Analysis of a Dual-Wavelength-Clad-Pumped 3.5 μm Erbium-Doped Fluoride Fiber Laser. Applied Sciences. 2022; 12(15):7666. https://doi.org/10.3390/app12157666
Chicago/Turabian StyleCai, Kaidi, Xin Zhang, Lijie Wang, Yanjing Wang, Huanyu Lu, Cunzhu Tong, and Lijun Wang. 2022. "Numerical Analysis of a Dual-Wavelength-Clad-Pumped 3.5 μm Erbium-Doped Fluoride Fiber Laser" Applied Sciences 12, no. 15: 7666. https://doi.org/10.3390/app12157666