Article

State Evaluation and Fault Prediction of Protection System Equipment Based on Digital Twin Technology

1
Key Laboratory of Power System Intelligent Dispatch and Control of Ministry of Education, Shandong University, Jinan 250061, China
2
State Grid Jiangsu Electric Power Ultra-High Voltage Co., Ltd., Nanjing 211102, China
*
Author to whom correspondence should be addressed.
Appl. Sci. 2022, 12(15), 7539; https://doi.org/10.3390/app12157539
Submission received: 3 July 2022 / Revised: 22 July 2022 / Accepted: 25 July 2022 / Published: 27 July 2022
(This article belongs to the Section Electrical, Electronics and Communications Engineering)

Abstract

:
Digital twin technology aims to build a map of physical entities in virtual space, and simulate the real-time state and dynamic characteristics of physical devices through bi-directional interactive data flow. In order to guarantee the safe and stable operation of protection system equipment in intelligent substations and improve the efficiency of protection system operation and condition maintenance, this paper proposes a protection system state evaluation and fault prediction method based on digital twin technology. The architecture, application and operation control mode of digital twin technology in a real-time state analysis of a protection system are studied. The state evaluation model based on matter-element extension and the fault prediction model based on clustering algorithm are constructed. By analyzing the historical data of an intelligent station protection system in actual operation, a database that can be updated and corrected in real time is constructed. The effectiveness and accuracy of the state evaluation and fault prediction method are verified with actual cases, which can provide technical support for the operation and maintenance of the protection system.

1. Introduction

With the rapid development of China’s smart grid, intelligent substations use important secondary equipment such as merging units, intelligent terminals, and intelligent protection devices, etc. Intelligent substations can realize the digitalization of station-wide information, the networking of communication platform and the standardization of information sharing. The safe and stable operation of the current power grid is highly dependent on secondary systems such as protection, safety control, deregulation/load shedding, automation, and communication. Among them, protection systems, i.e., protection devices, merging units, intelligent terminals, and process layer networks, are the key to the safe operation of smart grids [1]. If a fault occurs in a certain section, it will lead to incorrect actions of protection, circuit breakers, etc., which in turn may lead to the expansion of the fault range and cause more damage. Therefore, it is important to grasp the real-time operation of the protection system and the operation trend in the future period, to enable the accurate assessment of equipment state and fault prediction, to ensure the timely detection of safety hazards, and to conduct effective targeted and preventive condition maintenance to ensure the safe and stable operation of the grid [2].
Most of the current research on protection system state monitoring and evaluation starts from the level of intelligent substations [3,4,5], and the state evaluation of secondary equipment is realized based on the monitoring information of intelligent stations [6,7]. In the research on state evaluation related to protection systems, part of it focuses on the evaluation method research, such as the comprehensive fuzzy evaluation method combining the expert method and GI method [8], KPI-based relay protection operation evaluation index system [9], etc. Part of the research looks at relay protection reliability evaluation indexes as the primary object of its research, such as the misoperation rate, the rejection rate, the disturbance degree, completeness and other serviceability indexes [10]. Increasing attention is paid to economic indexes such as the protection reliability economic coefficient and the average annual economic loss in relay protection evaluation [11]. However, in practical application, there are still some difficulties and problems:
  • The application of real-time operation information of protection systems, such as the operation event record (SOE), self-test information and numerous alarm information still remains in the diagnosis and location of equipment post-fault, and cannot evaluate the real-time state of characterized equipment, fault prediction and thus conduct preventive maintenance.
  • There are many types of secondary equipment faults, and there is no clear fault criterion, and there is no obvious correlation between fault characteristics; often a fault characteristic corresponds to multiple fault-types. Therefore, it is necessary to rely on a sufficiently rich historical database to summarize a reliable fault prediction inference knowledge base and complete inference rules.
  • In today’s relay protection state evaluation, more static characteristic quantities such as serviceability indexes and economic indexes are used for evaluation, while less dynamic indexes such as operation information and alarm information are used, resulting in the evaluation results focusing on the management and regular maintenance of equipment, while it is difficult to grasp the equipment operation state in real time.
In order to mitigate the problems and limitations described above, a system architecture based on digital twin technology could be introduced as a solution. Digital Twin (DT) is a simulation process that integrates multiple disciplines, physical quantities and dimensions, and is compatible with the current popular technologies such as intelligent sensors, big data, artificial intelligence, and so on. DT technology relies on digital carriers to grasp the operation of physical entities in real time by constructing a map of physical entities in virtual spaces [12]. In response to the problem of insufficient application of dynamic indicators in the status evaluation algorithm, the fast-sensing capability and data panoramic display function of Digital Twin can effectively capture various types of self-test and alarm information in equipment operation. To mitigate the problem of the hysteretic application of real-time operation information of the protection system, digital twin technology can digitize the obtained operation information into characteristic quantities and build digital models to grasp and predict the status of equipment in real time. After the state analysis and maintenance decision of the equipment, the real-time bi-direction data flow of Digital Twin can transmit the equipment status rating or maintenance results to help the digital model to make improvements. The data resource center of Digital Twin improves itself through the feedback of results, so it can continuously update the fault inference knowledge base and improve the inference rules during operation. The Digital Shadow can automatically obtain information about the physical object to simulate the real-time state of the entity, which is a one-way process. Digital Twin can realize two-way data interactions between the entity and the digital model in the virtual space, and the virtual model can pass commands and information back to the entity to achieve mutual control. The literature [13] develops a digital twin reference architecture consisting of Digital Twin Layers, App Layers, Cyber Layers, Digital Layers, Communication Layers, and Physical Layers in the context of Industry 4.0 and applies it to industrial cases. The literature [14] investigated the architecture, applications, and challenges in the implementation of digital twin technology with IoT capabilities. The literature [15] presents the challenges, applications and enabling technologies for AI, IoT and digital twin technology.
The application of digital twin technology in power grids mostly remains theoretical at this stage. The literature [16,17] explored the application of digital twin technology in the online analysis of power grids in terms of the structural system and operation mode. The literature [18,19] analyzed from a feasibility point of view whether communication and computer technologies, such as communication, memory, and response speed were sufficiently complete to serve as technical support when digital twin technology was applied to power grids. Especially at the device management level, digital twin technology can realize a complete set of data collection, model establishment, and a model application system [20]. The literature [21] introduced a labor economics-based framework to achieve the satisfaction of the various interacting system entities, which provided a reference for framework studies. The literature [22] used digital twin technology as the basis for information interaction between distribution automation terminal devices and distribution master stations, predicting faults, and assisting distribution network operation and maintenance.
In response to the problems mentioned above regarding the lack of application of digital twin technology in smart grids and the practical application of protection system state evaluation, this paper explores the application of digital twin technology in intelligent substation protection systems, and innovatively develops a five-layer architecture for digital twin protection systems. This provides a new path for the application of digital twin technology in intelligent substations. A workflow framework for protection system state evaluation and fault prediction is proposed, and a twin model of the protection system is constructed in the form of characteristic quantity sequence with the help of the bi-directional interactive data flow of the digital twin. Based on the historical data collected from 220 kV substations in a region, a historical database is established, and the characteristic quantities, classical domains and fault sets for state evaluation and fault prediction are compiled and summarized. A state evaluation model based on the improved AHP method and the matter-element extension method, and a fault prediction model based on K-means clustering are constructed. Through the analysis of actual operation cases in a certain region at a certain time, it is proved that the model can realize the real-time monitoring of the protection system state and fault prediction when the state deteriorates with an accuracy rate of more than 90%. In actual operations, it can rely on digital twin technology to update the historical database with real-time feedback and gradually improve the correct rate of fault prediction.

2. Protection System Architecture Based on Digital Twin Technology

Currently, the prevailing digital twin technology architecture generally includes a physical layer, a data layer, a model layer, a functional layer, and an application layer [23,24]. The physical layer corresponds to the device entity. The data layer corresponds to the process of data sensing, acquisition, transmission, and processing. The model layer corresponds to algorithmic and data-driven models, and the functional layer is responsible for implementing specific functions such as description, diagnosis, early warning, and decision making. The application layer corresponds to the intelligent platform [18]. Based on the prevailing technical architecture today, this paper proposes a digital twin architecture and a working principle for protection systems consisting of five components: a physical device layer, a data transmission layer, a data-processing layer, a twin model layer, and an application management layer as shown in Figure 1.
The main functions of each layer in the architecture of a digital twin protection system are shown in the Table 1.
  • Physical device layer. The physical device layer includes all physical devices of the protection system. It includes intelligent microcomputer protection devices, merging units, intelligent terminals, and process layer network channels, etc.
  • Data transmission layer. The data transmission layer relies on the secondary monitoring system (SMS), which is responsible for the sensing and transmission of data. The secondary monitoring system is a global analysis system for secondary equipment developed by the State Grid Corporation in recent years to improve the management efficiency of the secondary system. It can realize the integrated modeling of secondary equipment and the comprehensive collection of operation information, and complete real-time monitoring, comprehensive alarm, online analysis, remote control and evaluation management of the secondary system, whose main station architecture is shown in Figure 2. Information on the operation status, strategy, and fixed value of all kinds of secondary equipment in the station is connected to the communication gateway through the station control layer network and sent to the main station. The construction of the secondary monitoring system provides an important technical support for the construction of the digital twin model of the protection system.
  • Data-processing layer. Considering the actual operation of the secondary monitoring system, the data to be stored and managed in the database is massive after key information, such as protection action events, device status and monitoring data, pressure plate status, recording files, and fixed values are reported in real time. It is difficult to meet the functions of real-time rapid state evaluation and fault prediction by relying on traditional data management, so data mining, effective data selection and optimal data set selection are needed.
  • Twin model layer. The twin model layer is the core of the digital twin architecture. Based on the panoramic and multidimensional data obtained from the secondary monitoring system, the digital twin model of the protection system can be constructed. The first includes common fault sets, classic domains and main characteristic quantities obtained by analyzing the historical database, and the three constitute the data resource center and are iteratively updated in real time. The second includes specific functional models, including a state evaluation model and a fault prediction model. The algorithmic process is integrated within the model to enable state evaluation and fault prediction of protection systems. The content of this paper will also focus on the twin model layer.
  • Application management layer. The application management layer is responsible for providing feedback on the state evaluation and fault prediction results of the digital twin layer, assisting operation and maintenance personnel to grasp the equipment situation and conduct preventive and targeted state maintenance to ensure the safe and stable operation of the protection system.
The workflow of the digital twin model layer runs as follows. The intelligent sensing system and intelligent collection device in the secondary monitoring system can realize the comprehensive collection and live monitoring of equipment information, and transfer the operation data of the physical equipment layer of the protection system, including SOE operation records, self-test information, alarm information, etc., to the data-processing layer through the data transmission layer. The data-processing layer integrates the acquired data, organizes, mines, selects and analyzes them, and passes them to the twin model layer. The algorithm model within the model layer is used to conduct an evaluation of equipment status and fault prediction, and the results are passed to the application management. The staff will perform fault detection and maintenance of the equipment according to the prediction results, and then feedback the actual situation to the digital twin model.
Through digital twin technology, the function of automatic optimization and real-time update is integrated into the operation management of protection system equipment, which can realize the functions of autonomous diagnosis and prediction, status evaluation, and planning decisions relating to the equipment. It enables the timely and reasonable allocation of resources to achieve preventive and targeted condition maintenance, thus realizing the effect of optimizing the overall operation of the protection system.

3. State Evaluation and Fault Prediction of Protection System Based on Digital Twin Technology

3.1. Workflow of Twin Model Layer

The twin model layer is the core of the digital twin architecture, integrating datasets, state evaluation, and fault prediction algorithms. Its workflow is shown in Figure 3. The operational data of the protection system over a sufficiently long period of time are collected and collated, its evaluation index (main characteristic quantity), comment set (classical domain), and fault set are selected. A judgment matrix is constructed based on the historical operation. The initial weights are determined by the improved analytic hierarchy process (AHP). The clustering centers of its N common faults are calculated with sufficient fault samples. The current operation information of the protection system to be evaluated is digitized, and the closeness to the classical domain is determined, and the weight of the characteristic quantities is modified based on the variable weight model according to its real-time state. If the status of the equipment is judged to be “severe”, a fault prediction is given, and the result is obtained by comparing it with the reference series of the clustering center. Subsequently, the operation and maintenance personnel conduct preventive maintenance on the equipment, and update the fault set and clustering center according to the fault condition. Section 3.1 and Section 3.2 describe the methods and principles of state evaluation and fault prediction of the protection system, respectively.
Relying on the realistic conditions that have been realized and can be achieved, the framework is arranged at a low cost and has a high feasibility for implementation in a realistic environment. As described in Section 2, relying on the secondary monitoring system already developed by the State Grid, it is possible to obtain real-time information on the operation of the protection system equipment. The processing platform of the information and the digital twin model are arranged in the station-side operation and the maintenance management system of the smart station to ensure the reduction of operation, the maintenance and overhaul costs, and to improve the feedback efficiency after maintenance.

3.2. State Evaluation of Protection System Based on Matter-Element Extension

In actual operation, the protection system may cause equipment defects due to operational faults, environmental factors, and switching operations, etc., which affect the working performance of the equipment.
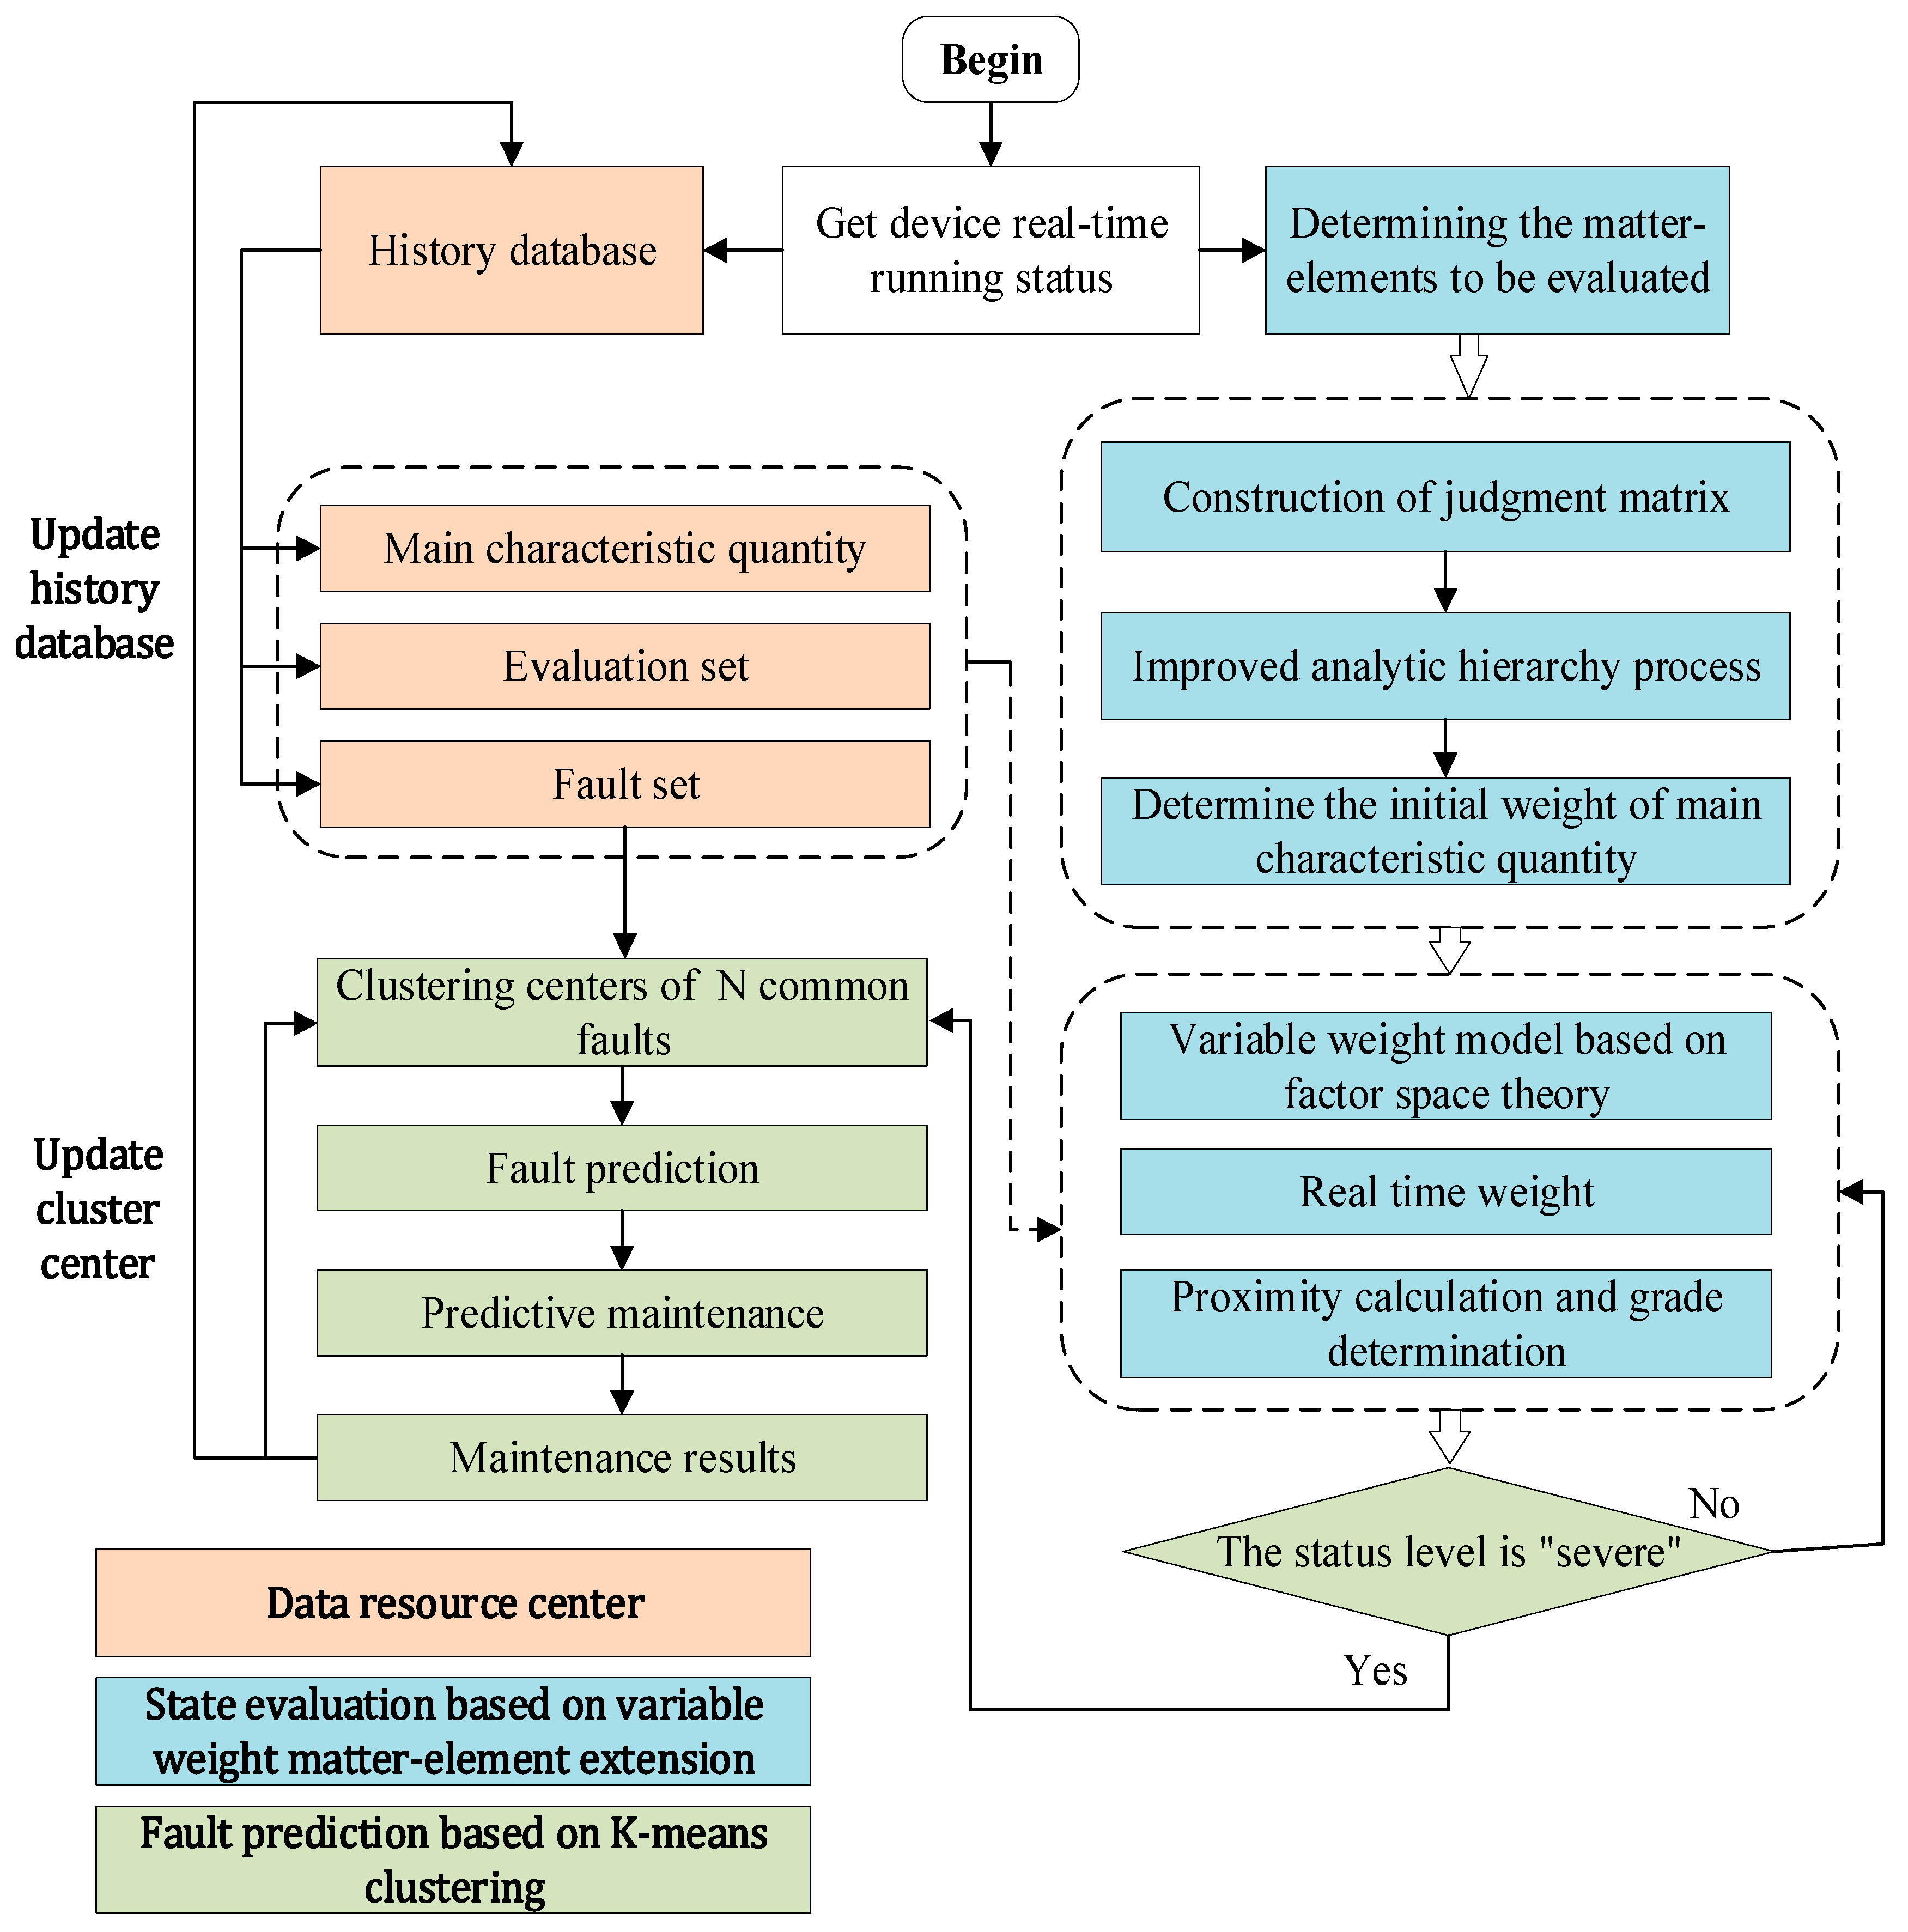
Matter-element extension method is an evaluation method used to describe things, which combines qualitative and quantitative information. Its principle is to select the characteristics of things, and quantitatively evaluate the current state of things according to the actual data of characteristic quantity indicators. The evaluation process is shown in Figure 4. To achieve real-time evaluation of the protection system state, Section 3.2.1 collates and selects nine characteristic quantities for protection system status evaluation, and uses their frequency of occurrence to judge the operating state of the system. A classical domain for state evaluation is proposed in Section 3.2.2, which can classify the state of the system into “normal”, “attention”, and “severe”. Since the occurrence of each characteristic quantity has a different impact on the equipment, the nine characteristic quantities are assigned weights in Section 3.2.3 and can be adjusted in real time according to their degradation degree. In Section 3.2.4, the determination of the state level is achieved by calculating the relative closeness.
A matter-element is the basic unit for describing a thing. A thing N, a characteristic C, and a quantity V about the characteristic C form an ordered triplet, denoted as R = ( N ,     C ,     V ) . The expression of the protection system as an n-dimensional matter-element R n , which requires a comprehensive evaluation of several indicators, is
R n = ( N , C n , V n ) = [ N C 1 V 1 C 2 V 2 C n V n ]
where N is the protection system, C is the characteristic quantity of the protection system, and V is the range of values of the characteristic quantity.

3.2.1. State Evaluation Characteristic Quantities

In the smart substation information processing platform, the information can be divided into incident-level information, general-level information, and forecasting-level information [25]. Among them, incident-level information such as protection activation, circuit breaker operation, etc. will directly enable fault diagnosis algorithms or start smart grid self-healing procedures once they appear, and are generally used as post-fault diagnosis and tracking algorithms. The general and forecasting level information appears more frequently and with lower priority, and is generally used only in the substation as a basis for post-fault maintenance, but the frequent occurrence of such information often indicates the tendency of deterioration of a part of the equipment. In this paper, the frequency of general and forecasting level information is used as an indicator for the state evaluation of the equipment.
In this paper, the historical operation data of a 220 kV substation protection system in the recent five years (2016–2021) are collected, including SV/GOOSE state information, bus/line sampling value information, communication channel information, online operation information, etc., as well as the protection system SOE frequent action signal records, and equipment defect processing records. Combined with the equipment instructions provided by equipment manufacturers, the abnormal operating conditions of the protection system are studied. During the operation of the protection system device, a total of five types of warning signals were recorded, with a total of 77 signals. Some warning signals will cause protection function exit or device locking, such as software setting errors, board configuration error alarms, etc. Some warning signals have a clear direction to the fault, and the fault causes can be obtained by simple reasoning in the existing knowledge base, such as equipment or plug-in power failure alarms. In order to improve the efficiency of the algorithm, the above types of characteristic quantities were not involved in the subsequent study, and only nine alarm signals that occurred relatively frequently, could characterize the equipment defective faults, and whose fault-type was difficult to determine by simple inference, were selected as characteristic quantities, as shown in Table 2.

3.2.2. State Evaluation Joint Domain and Classical Domain

The joint domain is the total range of values of each characteristic quantity of the system to be evaluated, and the expression of the joint domain elements is
R p = ( N , C i , V p i ) = [ N C 1 a p 1 , b p 1 C 2 a p 2 , b p 2 C i a p i , b p i C n a p n , b p n ] ,   ( i = 1 , 2 , , n )
where N is the protection system, V p i is the range of values of the i-th characteristic quantity C i , and a p i and b p i represent the upper and lower limits specified by the characteristic quantity C i .
This paper collects and analyzes the field export data of a 220 KV smart station in China Southern Power Grid in 2019, including SV/GOOSE state information, sampling value information, communication channel information, etc., and sorts the upper and lower limits of the frequency of each characteristic in 24 h as shown in (3).
R p = [ N c 1 [ 0 , 3 ] c 2 [ 0 , 3 ] c 3 [ 0 , 20 ] c 4 [ 0 , 3 ] c 5 [ 0 , 10 ] c 6 [ 0 , 3 ] c 7 [ 0 , 3 ] c 8 [ 0 , 3 ] c 9 [ 0 , 6 ] ]
The classical domain is the numerical range of the characteristics of the system to be evaluated in this state level. The expression of classical domain matter-element is
R j = ( N j , C i , V j i ) = [ N j C 1 a j 1 , b j 1 C 2 a j 2 , b j 2 C i a j i , b j i C n a j n , b j n ] , ( i = 1 , 2 , , n )
Among them, R j is the j-th state level divided, N j is the protection system under the j-th state level, V j i is the j-th state level, the value range specified in the i-th characteristic quantity Ci, a j i , b j i is the upper and lower limits of the value range.
By reviewing the relay protection status evaluation guidelines issued by the State Grid Corporation and related literature, the protection system equipment status levels are generally classified as normal, attention, abnormal, and serious abnormal. However, in the actual operation of the protection system equipment, the time required for the equipment to deteriorate to failure due to abnormal operating conditions is generally short, so this paper combines “abnormal” and “serious abnormal” into a “severe” state. The classical domain is set as R = { R 1 , R 2 , R 3 }, where R 1 3 correspond to “normal”, “attention” and “severe” levels, respectively. “Normal” means the equipment is in good operation. “Attention” indicates that the equipment is operating normally but some indicators have deteriorated and may fail if no intervention is made. “Severe” means that the equipment may fail soon or is already in a state of failure, and the equipment will be subject to fault prediction and diagnosis, and targeted, preventive maintenance.
Based on the relay protection state evaluation guidelines, and combined with expert experience, manufacturer’s instructions and actual research, the classical domain of the matter-element was set. The network channel operation is used as an example to illustrate the classical domain determination method for the characteristic quantity c 1 . The scoring criteria for channel operation in the state evaluation guidelines are shown in Figure 5. According to the guidelines, when the channel abnormal frequency is less than one, the score is more than six points, which is a normal state. When the alarm frequency is one, the score is four to six points, and it is in the state of attention. When the alarm frequency is greater than one, the score is less than four, and the equipment is in a severe state. The GOOSE alarm frequency is expressed as follows: the classical domain of the normal state of the characteristic quantity c 1 is [0, 0.5], the attention state is [0.5, 1.5], and the severe state is [1.5, 3].
Similarly, the classical domains of other state quantities are determined as follows based on the state quantity scoring rules of the state evaluation guidelines and expert opinions.   R 1 3 denotes the classical domains in the normal, attention, and severe states, respectively.
R 1 = [ N 1 c 1 [ 0 , 0.5 ] c 2 [ 0 , 0.5 ] c 3 [ 0 , 3.5 ] c 4 [ 0 , 0.5 ] c 5 [ 0 , 1.5 ] c 6 [ 0 , 0.5 ] c 7 [ 0 , 0.5 ] c 8 [ 0 , 0.5 ] c 9 [ 0 , 1.5 ] ] , R 2 = [ N 2 c 1 [ 0.5 , 1.5 ] c 2 [ 0.5 , 1.5 ] c 3 [ 3.5 , 10.5 ] c 4 [ 0.5 , 1.5 ] c 5 [ 1.5 , 3.5 ] c 6 [ 0.5 , 1.5 ] c 7 [ 0.5 , 1.5 ] c 8 [ 0.5 , 1.5 ] c 9 [ 1.5 , 3.5 ] ] , R 3 = [ N 3 c 1 [ 1.5 , 3 ] c 2 [ 1.5 , 3 ] c 3 [ 10.5 , 20 ] c 4 [ 1.5 , 3 ] c 5 [ 3.5 , 10 ] c 6 [ 1.5 , 3 ] c 7 [ 1.5 , 3 ] c 8 [ 1.5 , 3 ] c 9 [ 3.5 , 6 ] ]

3.2.3. Characteristic Quantities Weight of State Evaluation

The occurrence of different characteristic quantities indicates that the equipment may have different fault types, and the probability of each fault type is different, and the influence on the equipment is also different. In this paper, the improved analytic hierarchy process (AHP) is used to give the initial weight to the characteristic quantity [26].
The posterior probability in Bayesian theory can characterize the influence of the characteristic quantity on the equipment state. In Bayesian theory, the prior probability is the probability of a fault type; the conditional probability is the probability of obtaining the corresponding fault symptom information, namely the probability of characteristic quantity, under the condition that a certain fault occurs in the equipment. According to the existing characteristic quantities, the probability of the corresponding fault type is the posterior probability. Bayesian formula is
p ( f a c b ) = p ( c b f a ) p ( f a ) k = 1 m p ( c b f k ) p ( f k )
where m is the number of faults in the fault set F, and the fault set is detailed in Section 3.3.1. p ( f ) is the prior probability of occurrence of fault type f a , p ( c b f a ) is the probability of occurrence of feature c b , i.e., conditional probability, when fault type f a occurs. p ( f a c b ) is the probability of fault type f a when characteristic c b appears, namely the posterior probability.
When c b appears, the comprehensive posterior probability (CPP) of equipment failure is p ( f c b ) = k = 1 m   p ( f a c b ) . The higher the probability is, the higher the possibility of equipment failure occurring when the characteristic c b occurs, and it can be considered that the influence of the characteristic c b on the equipment state is greater. By referring to the relevant literature, the prior probability and conditional probability of the characteristic quantity of common faults of the protection system can be obtained [27,28]. Considering the prior probability of all faults and the conditional probability of the occurrence of characteristic quantities when faults occur, the comprehensive posterior probabilities of nine characteristic quantities c 1 9 of the protection system faults are calculated, as shown in Table 3.
According to the comprehensive posterior probability of characteristic quantities c 1 9 of equipment failure, combined with the experience of equipment manufacturers and high voltage station operation and maintenance experts, the fuzzy complementary judgment matrix M can be obtained by comparing the influence of each feature on the equipment state.
M = [ 0.5 0.6 0.7 0.9 0.7 0.7 0.9 0.7 0.9 0.4 0.5 0.6 0.8 0.6 0.7 0.2 0.7 0.9 0.3 0.4 0.5 0.7 0.5 0.6 0.7 0.6 0.8 0.1 0.2 0.3 0.5 0.3 0.4 0.6 0.3 0.4 0.3 0.4 0.5 0.7 0.5 0.7 0.8 0.5 0.8 0.3 0.3 0.4 0.6 0.3 0.5 0.7 0.4 0.7 0.1 0.8 0.3 0.4 0.2 0.3 0.5 0.3 0.6 0.3 0.3 0.4 0.7 0.5 0.6 0.7 0.5 0.8 0.1 0.1 0.2 0.6 0.2 0.3 0.4 0.2 0.5 ]
The element m i j in column j of row i of the matrix means the influence of the first characteristic quantities c i on the device state compared with the j-th characteristic quantities c j . The meanings of the 0 to 1 scales in the matrix are shown in Table 4.
The formula for calculating the weight of characteristic quantity by the improved AHP method is:
w i = 1 n 1 2 a + 1 n a k = 1 n m i k ,   ( i = 1 , 2 , n )
where a is an adjustment parameter and n is the number of characteristic quantity. In order to avoid the large gap between the weight of each characteristic quantity, generally take a   = (n − 1)/2.
The initial weight w i of each characteristic quantity is obtained as shown in Table 5.
The AHP method is a multi-objective decision-making method combining qualitative analysis and quantitative analysis, which inevitably has subjective factors of expert experience. The improved AHP method proposed in this paper introduces complete and detailed mathematical statistics, and uses the posterior probability in Bayesian theory to characterize the comprehensive influence degree to balance the influence of subjective factors, which has more application value and rationality.
In the actual operation process, when certain piece of equipment of the protection system issues a certain type of forewarning alarm signal, it often indicates a trend of deterioration of the relevant equipment condition. If the alarm signal continues to appear afterwards, it is necessary to increase the weight of these characteristics indicators at this time, so that the status rating of the protection system continues to decline and the operation and maintenance personnel can carry out preventive maintenance as early as possible. In this paper, a variable weight synthesis model based on Factor Space Theory [29] is used to modify the characteristic quantity weight on the basis of the initial weight, combined with the information of the equipment operation data monitored in real time.
Assuming that the factor state vector is X = ( x 1 , x 2 , , x n ) , the factor constant weight vector is W = ( w 1 , w 2 , , w n ) , and the state variable weight vector is S ( X ) = ( S 1 ( X ) , S 2 ( X ) , , S n ( X ) ) , then the normalized Hadamard product of W and S(X) can obtain the variable weight vector W(X):
w i ( X ) = w i S i ( X ) k = 1 n w k S k ( X ) , ( i = 1 , 2 , , n )
In the formula S i ( X ) = e α ( x i x ¯ ) , α is a variable weight factor, and the degree of heavy change of control rights.
In this paper, the state vector is V = ( v 1 , v 2 , , v 9 ) , v i is the value of the i-th characteristic quantity c i at the current time. Factor constant weight vector is the initial weight of nine characteristic quantities. Formula (9) can be changed into
w i ( X ) = w i exp [ α ( d i a p d i b p ) ] k = 1 n w k exp [ α ( d k a p d k b p ) ] , ( i = 1 , 2 , , 9 )
In the above formula, the general variable weight factor α = −1. w i is the initial weight of the i-th characteristic quantity. d i a p and d i b p are the distance between the characteristic quantity c i and the left and right boundary of the node domain, d i a p = | v i a p i | , d i b p = | v i b pi | .

3.2.4. Closeness Calculation and State Determination

This paper uses the concept of closeness degree to calculate the closeness degree of each characteristic index to the state level [30]. The calculation formula of closeness is shown in Equation (11).
K = 1 1 n ( n + 1 ) i = 1 n D w i , ( i = 1 , 2 , , n )
In this paper, the formula of close degree between protection system and “normal”, “attention”, and “severe” three classical domains R1−3 is
K j ( N ) = 1 1 n ( n + 1 ) i = 1 n D j ( v i ) w i ( X ) , ( j = 1 , 2 , 3 )
K j ( N ) is the closeness between the current protection system and the j-th classical domain R j . n is the number of characteristic quantities. The distance between the protection system to be evaluated and the classical domain D j ( v i ) = | v i a i j + b i j 2 | 1 2 ( b i j a i j ) , a i j and b i j are the left and right boundaries of the classical domain R j , respectively.
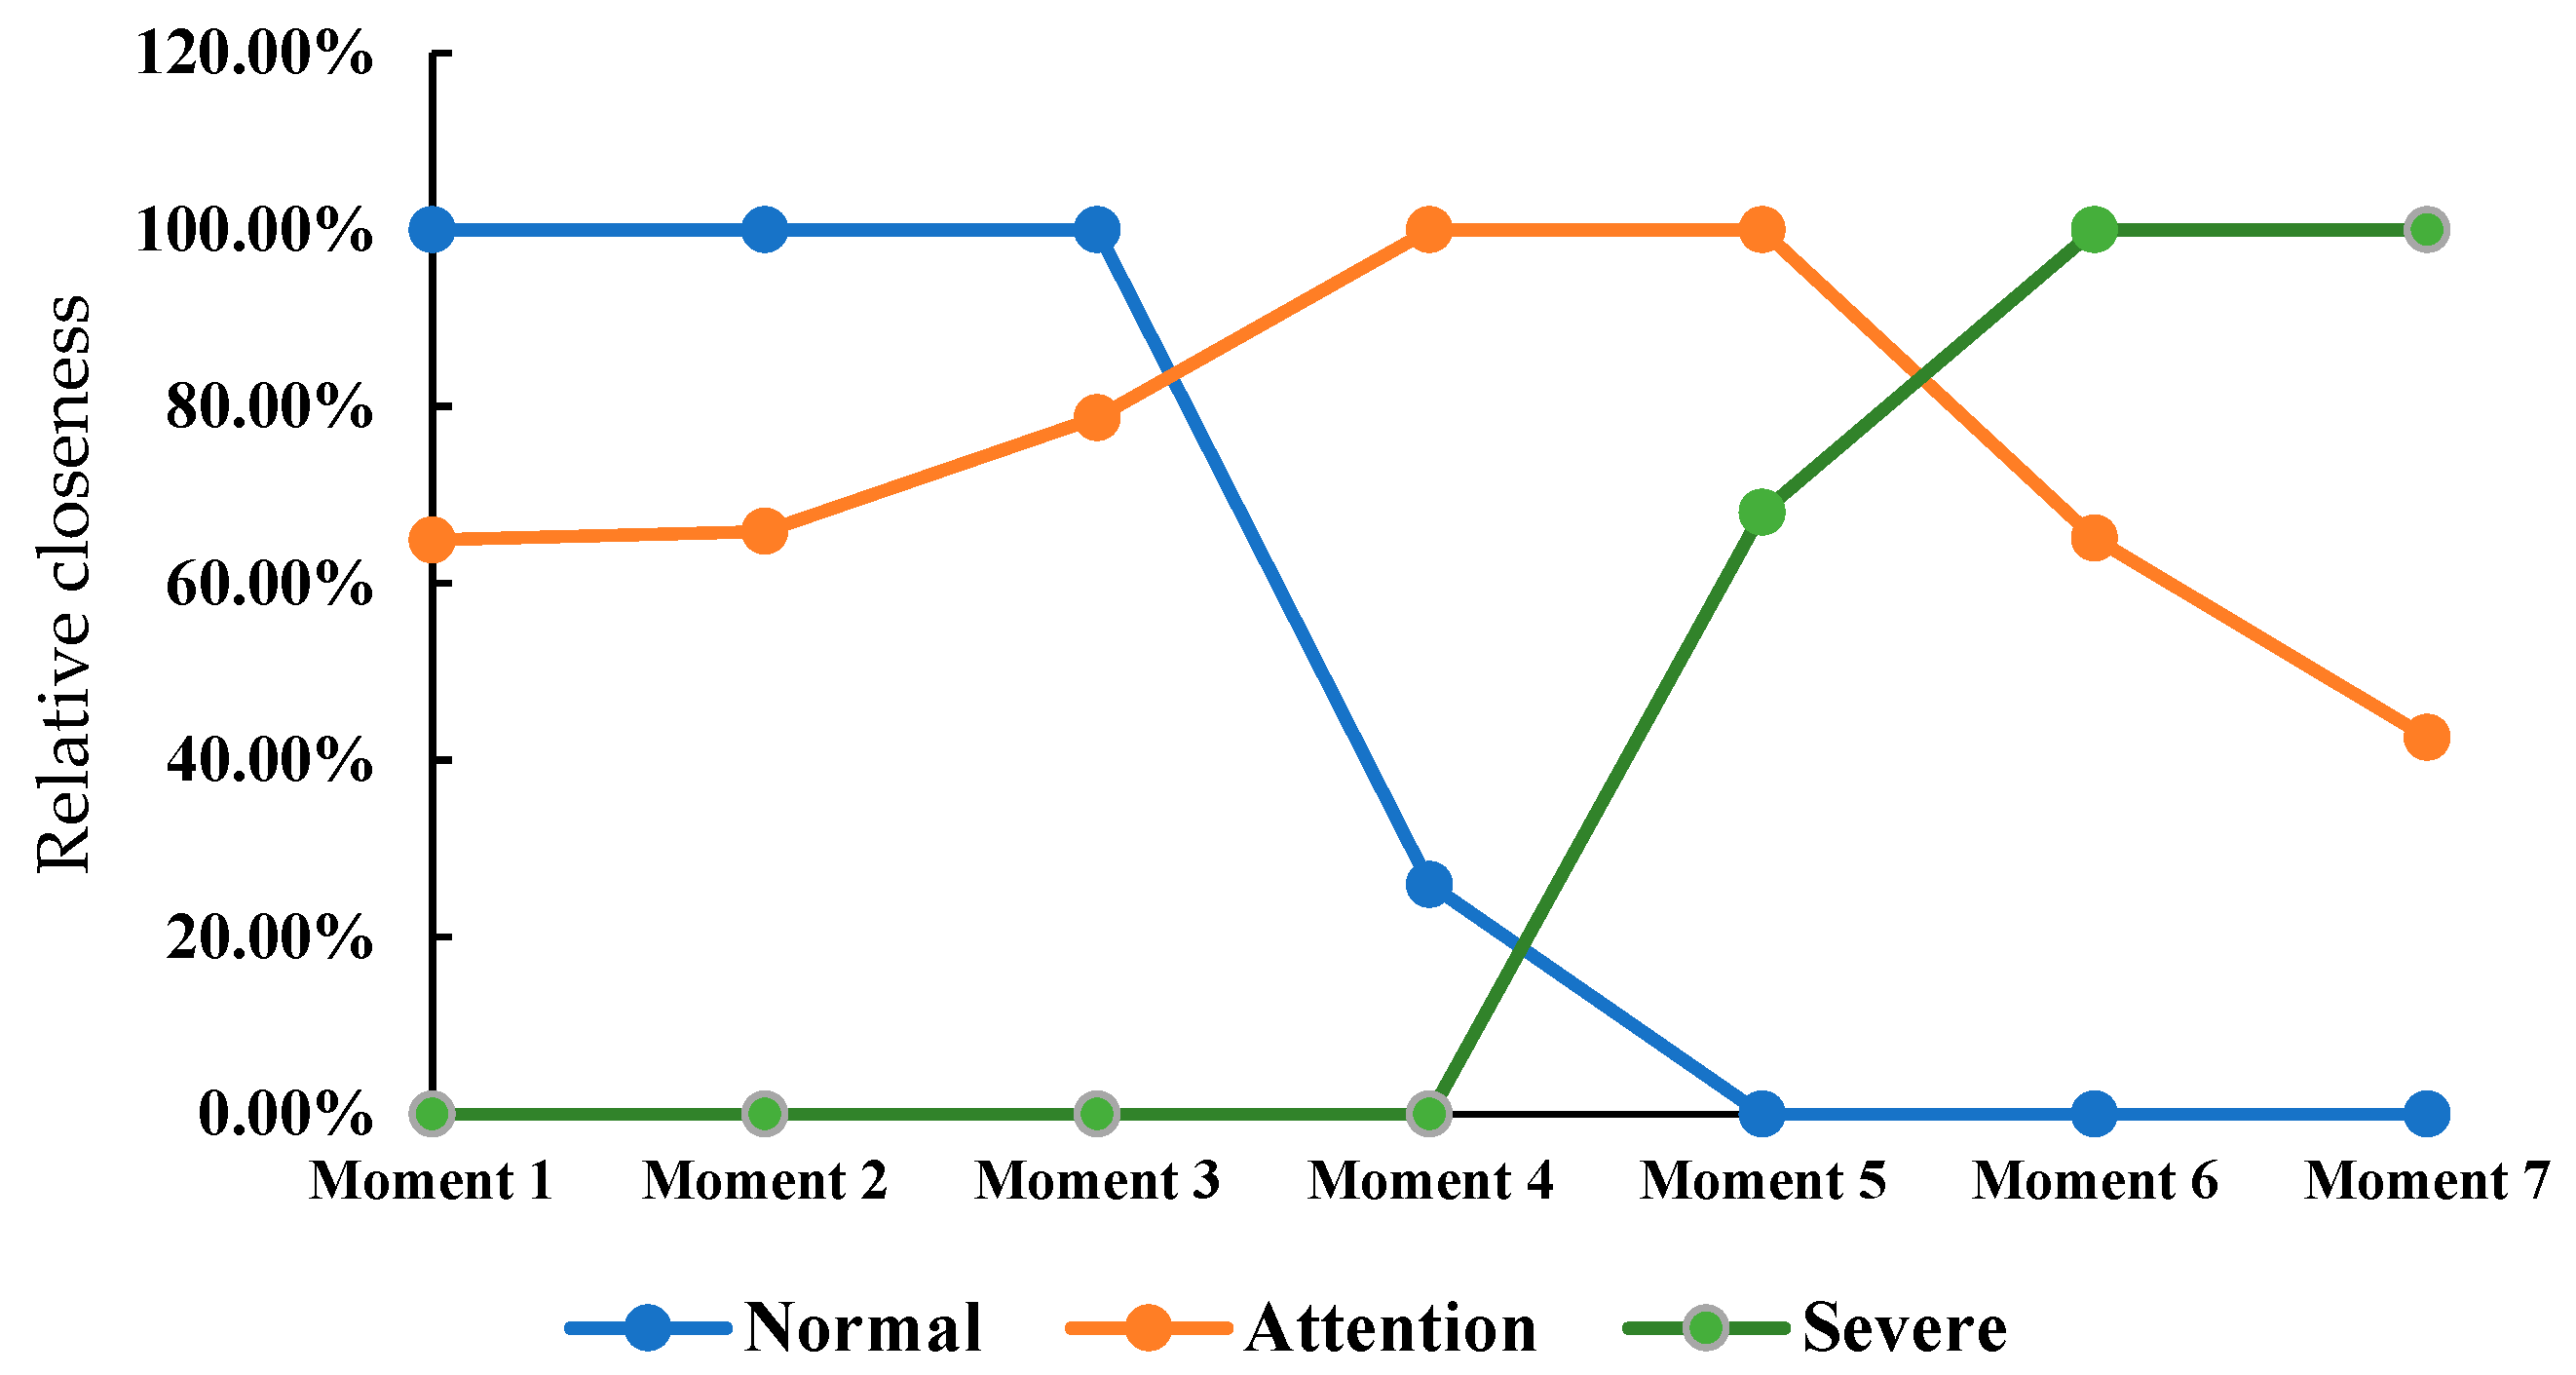
In order to better display the closeness degree and change trend with each classical domain, and to judge the state level, according to the calculated closeness degree, the relative closeness degree of the matter-element to be evaluated can be calculated by the following formula.
K j ¯ ( N ) = K j ( N ) m i n K j ( N ) m a x K j ( N ) m i n K j ( N ) , ( j = 1 , 2 , 3 )
In the formula, m a x K j ( N ) is the maximum value of the closeness of the matter-element to each state level, and m i n K j ( N ) is the minimum value of the closeness of the matter-element to each state level.
The state level with relative closeness degree one is the state evaluation level.

3.3. Fault Prediction of Protection System Based on Clustering Algorithm

The protection system fault prediction process is initiated when the equipment status is assessed as severe and has a tendency to develop into a fault in order to predict the type of fault that may occur in the equipment. In this section, nine common types of faults in protection systems are summarized and organized, based on which the idea of improved K-means clustering algorithm [31] is used to study the fault prediction of protection systems. Clustering is the process of classifying and organizing similar data, and the K-means algorithm is a partition clustering method with the average value as the clustering center, which is simple and efficient. The time complexity and spatial complexity of the K-means clustering algorithm is O (n × k × t) and O (n × t), where n represents the number of objects in the dataset, t represents the number of iterations of the algorithm, and k represents the number of clusters. They can all be considered to be constants, so the time and space complexity can be simplified to be O(n), i.e., linear.
The clustering algorithm is used to cluster the characteristic sequences of common faults, and the fault prediction is realized by calculating the correlation degree between the current characteristic sequences of the protection system and the clustering center. The flow of fault prediction based on the clustering algorithm is shown in Figure 6. According to this process, the common faults of the protection system are discussed in Section 3.3.1, and the samples for clustering are discussed in Section 3.3.2, and their clustering centers are calculated. Finally, it explains how to use Euclidean distance to calculate the correlation between the current state of the equipment and various fault types, so as to judge the possible fault types of the equipment.

3.3.1. Common Fault Sets in Protection Systems

By analyzing the historical operation data of a 220 KV intelligent substation, including historical SOE operation event records, alarm signal records, equipment self-test information, etc., and combining with the equipment manuals provided by the equipment manufacturers, the common fault sets of the protection system can be sorted. In order to improve the efficiency of the algorithm, the subsequent study does not involve the types of faults that can be obtained by simple inference based on the correlation between the characteristic quantities and the faults, such as the equipment power failure alarm. In this paper, the following nine faults that occur more frequently and have no simple correspondence with the characteristic quantities [32,33,34] are selected as the fault sets for studying the fault prediction of protection systems.
  • Merging Unit (MU) failure
    Failure of the main DSP or sampling DSP module of the merging unit leads to abnormal signals of sampling and synchronization from the merging unit and abnormal DSP sampling of the protection device, resulting in abnormal sampling of the merging unit and out-of-step and invalid SV sampling of the protection device.
    Failure of the input/output module of the merging unit leads to abnormal reception of the process layer signal and abnormal reception of the SV link signal by the protection unit, resulting in invalid sampling of the protection SV, error in the SV link, interruption of the MU/protection SV, interruption of the GOOSE of the merging unit, total alarm of the SV/GOOSE, etc., which will seriously lead to equipment lockout.
  • Protection device failure. Its potential failure causes are mainly:
    Failure of the protection device CPU, including the failure of the random memory RAM integrated in the CPU, the failure of the accessory module responsible for digital-to-analog signal conversion, the failure of the internal digital signal processor, etc., will lead to alarms of the DSP of the protection device directly connected to it, errors in configuration parameters, abnormal CPU, SV sampling being out of step, errors in self-storage self-test, etc., which will seriously lead to equipment lockout.
    Failure of the line protection pilot channel, generally due to the pilot channel loss, fiber damage, etc., will lead to channel differential exit, pilot channel abnormalities, protection open-in and open-out communication interruption, and other alarms.
    Failure of protection device input/output plug-in, including loose plug-in inserts, damaged interfaces or internal failures, resulting in alarms, such as SV/GOOSE total alarms, protection SV/GOOSE interruptions, etc., leading to equipment lockout in severe cases.
    Failure of protection device GOOSE plug-in, including interface damage, poor contact, etc., resulting in the inability to receive GOOSE link signal, generating protection, merging unit, intelligent terminal GOOSE general alarm.
  • Intelligent Terminal Failure. Its potential failure causes are mainly:
    Failure of the I/O board of the smart terminal leading to communication blockage and thus many alarms of the information channel, such as GOOSE communication interruption and GOOSE general alarm.
  • Process level network failure.
    GOOSE network fiber abnormalities, including line fouling, fiber damage, fiber head fouling, fiber flange quality is not qualified, fiber fusion splicing process is not good, etc. caused by channel interruption or optical power drop, optical intensity abnormal, bundle tube interruption, etc., resulting in optical port transceiver power being over the limit, GOOSE total alarm, intelligent terminal reported MU data abnormal, etc.
    SV network fiber anomaly, same as ⑧, resulting in optical port transceiver power being over the limit, SV sampling error, SV link error, protection DSP sampling error, SV sampling invalid, SV link error, etc.
With the development of smart grids and the continuous upgrading of electrical equipment, the fault set in this research method is not limited to the above nine selected faults, which can be increased or decreased according to the actual situation. This method can also be applied to other electrical equipment, such as measurement and control devices, communication devices, and distribution automation devices. It is only necessary to combine the specific equipment types and organize the characteristic quantities and fault sets during their operation according to the method described in this paper.

3.3.2. Clustering Center and Fault Prediction

For the nine faults mentioned above, 30 groups of each fault characteristic sequence are selected in the historical database to form a sample set of 270 groups, which are normalized as shown in Table 6.
Set the number of clusters to K = 9, and randomly select a set of sequences as the initial cluster center in the sample set. Iterate each group of sample data, calculate the Euclidean distance between each group of sample data and nine clustering centers, and mark the group of samples to the nearest category cluster. After all the marks are completed, the centroid of each cluster is recalculated as the updated clustering center, and the second iteration is carried out. Repeat the above steps until the data within the cluster is not changed for two consecutive iterations. Finally, the cluster centers of nine fault types are calculated, as shown in the Table 7.
In order to select the appropriate number of samples, this paper selects 5, 10, 15, 20, 25, and 30 samples of each of the nine fault types, and calculates the cluster centers, respectively. Taking fault ① as an example, the calculation results are shown in Table 8.
It can be seen that the iterative error has been controlled to within 10% when the sample number is raised from 180 to 225; when the sample number is raised from 225 to 270, the error is controlled to within 5%, and the significantly appearing characteristic quantities, such as c 2 and c 6 9 errors can be controlled to within 1%. Before the failure of the protection system occurs, the uncertainty of the appearance of the characteristic quantities is also greater due to the uncertainty of the operation status of complex equipment, weather changes and environmental factors, so there is still some room for improvement in the control of errors. After this method is put into practical application, benefiting from the self-improvement ability of the closed-loop feedback of digital twin technology, the clustering centers of nine fault types can be further improved according to the actual results of defect handling.
When the status of a device is assessed as “severe” at a certain moment, the Euclidean distance E i ( N ) is calculated between the characteristic sequence of the protection system and each cluster center at that moment. The smaller the distance, the higher the correlation between the device and the cluster center at that moment. The final prediction fault type is the fault type corresponding to the cluster center with the highest correlation. For visual representation, the relative correlation degree can be calculated using the following equation.
E i ¯ ( N ) = E i ( N ) m i n E i ( N ) m a x E i ( N ) m i n E i ( N ) ,   ( i = 1 , 2 , , n )
where n is the number of cluster centers, m a x E i ( N ) and m i n E i ( N ) are the maximum and minimum Euclidean distances between the protection system and each cluster center.
The final prediction fault type is the fault type corresponding to the clustering center with relative correlation degree of one.

4. Case Analysis

In this paper, the protection system of a 220 KV substation in recent years was taken as the research object, including a series of complete protection devices of high voltage transmission lines, conventional sampling and merging units, intelligent terminals and process layer network. A total of 600 fault cases of the substation protection system in 2017–2019 were collected. The monitoring information of 24 h before each fault was intercepted as a single analysis case. As shown in Figure 7, in Section 4.1, the state evaluation and fault prediction model in a single case was analyzed and verified. In Section 4.2, the accuracy and self-improvement ability of the fault prediction algorithm in multiple cases were verified and analyzed.

4.1. Protection System State Evaluation and Fault Prediction in a Single Case

The characteristic monitoring information of conventional sampling and merging unit DSP module 24 h before fault in the high voltage line protection system of 220 KV intelligent station described above was taken as a case to analyze and verify the equipment state evaluation and fault prediction model based on digital twin technology.
(1) The 24 h before the fault was divided into six time periods, and set as moments 1–7. According to the real-time monitoring information of the secondary monitoring system, the characteristic sequence data of moments 1–7 was obtained by digital processing, as shown in Table 9.
Moment 3 was selected as the verification example of equipment status evaluation. The normalized result was u = {0,0,0,0.333,0,0,0,0,0.333}.
The state of the equipment at this time was regarded as the matter element to be evaluated. By using formulas (11) and (12), the closeness degree between the sequence of the time and the three classical domains of “normal”, “attention” and “severe” was calculated, and the closeness degree between the characteristic sequence and each state level was obtained as shown in Table 10.
The closeness indicates the closeness degree of the current equipment to be evaluated to each state level. The higher the value was, the closer it was to the state level, so it was judged to be “normal”. It can be seen that the equipment was close to the “attention” state, indicating that some components of the equipment have a certain deterioration trend, but the equipment was running in normal state, and the eigenvalues were in the normal range, which was also consistent with the actual situation of the equipment. It can be seen that the algorithm can accurately evaluate the current state of the device at the exact time.
(2) According to the characteristic sequence of moments 1–7 in Table 9, the characteristic weight of each time was calculated, and the closeness of the equipment to the three state levels of “normal”, “attention” and “severe” at each time was calculated, so as to judge the state level of the equipment at each time. The weight change of each characteristic quantities is shown in Figure 8. The change trend of equipment status level is shown in Figure 9.
The vertical coordinates in Figure 8 indicate the weight values of each characteristic quantity at each moment. It can be seen from the figure that the weights of each characteristic quantity could be adjusted in real time when the frequency of the characteristic quantity changed at different moments. When the frequency of a certain characteristic quantity increased in a period of time, the degree of its influence on the equipment status would increase, and the weights of these characteristics should be increased at this time, so that the equipment status rating decreased. Take “ c 4 protection DSP sampling errors” as an example, as shown in Table 9; the frequency of this characteristic increased at moments 3, 4, and 6, respectively, so its weight was increased at these moments, while the weight of other characteristics that did not appear was reduced.
As can be seen from Figure 9, at moments 1–3, the relative closeness of the device to the normal state was one, so it was judged to be “normal”. The proximity of the equipment to the attention state increased at moment 3, which indicated that the equipment had a certain trend of deterioration. The status level of moment 4 changed from “normal” to “attention”, and the status level of moment 6 changed from “attention” to “severe”. This was because during this period of time, the previous hidden problems had not been eliminated, and became more and more serious, and were very likely to evolve into a fault. After comparing with the field equipment status maintenance records, the status change trend was consistent with the actual operation of the equipment, which verified the accuracy of the status assessment model.
(3) When the equipment state was “severe”, i.e., moment 6, a fault prediction process was initiated for the equipment. According to the clustering centers of the nine typical faults described in Table 7, the relative correlation degree was calculated by calculating the Euclidean distance between the characteristic sequence of moment 6 and each clustering center using Equation (13), as shown in Figure 10.
It can be seen that the relative correlation degree between the device and the fault type ① at this moment was one. Therefore, the fault prediction result was a failure of the main DSP or sampling DSP module of the merging unit. After comparing with the actual fault at the equipment defect processing records, the fault type was correctly determined. It was verified that the algorithm could accurately predict the type of fault that would occur when the device was in poor condition.
(4) The fault records were recorded in the history database, and the history database and clustering center were updated, and the fault set was updated periodically according to the actual situation.

4.2. Accuracy Validation of Fault Prediction Models with Large Sample Cases

This section verifies the reliability of the above state evaluation and fault prediction methods in large sample cases, and verifies the self-learning ability and self-improvement ability of digital twin technology.
  • First, 600 records of fault handling of protection system equipment in a region of the Southern Power Grid from 2017–2019 were selected, and divided randomly and equally into four groups.
  • In each group, the real-time monitoring information of 24 h before each fault occurrence moment was intercepted. The 24 h was divided into six time periods, and moments 1 to 7 were set. The time N was selected when its status changed from “attention” to “severe”, the characteristic sequence of the equipment at time N was extracted, the fault prediction algorithm according to the steps described in Section 3.1 was calculated, and the prediction results were compared with the actual defect processing records.
  • After each group of control verification, the actual results of this group of verification were added to the database, and the clustering center was updated to make updates and corrections to the database. The self-learning ability and growth of this research method was verified by observing the change of algorithm accuracy of four groups of data.
Table 11 shows the results of the fault prediction for the first group of 150 fault records, at the moment when the status of the equipment changed from “Attention” to “Severe”. A total of 136 correct predictions were made for the 150 fault records. The correct rate was 90.67%.
The database was supplemented and improved by adding the 150 defect processing records of the first group to the database. Similarly, the data of the second, third and fourth groups were verified in turn, and the actual fault results were added to the database after each group was verified. The variation of the correct rate of the fault prediction algorithm is shown in the following Figure 11.
As can be seen from Figure 11, the accuracy of the fault prediction method proposed in this paper could reach more than 90%, and the accuracy of the algorithm improved from 90.67% in the first set of data to 92.67% in the fourth set of data after the continuous improvement of the historical database. It was proved that this research method was able to optimize and improve the algorithm according to the actual fault results in actual operation, and had self-learning ability and growth.

5. Conclusions

This paper proposed a digital twin-based protection system state evaluation and fault prediction method, which created a new way of thinking for the application of digital twin technology in intelligent substations. This paper reviewed the digital twin architecture of protection system, which consisted of five parts: a physical device layer, a data transmission layer, a data-processing layer, a twin model layer and an application management layer. Digital twin workflow for protection systems capable of real-time updates and closed-loop data was proposed. Based on the matter-element method and clustering algorithm, a real-time state evaluation and fault prediction model of the protection system was constructed within the digital twin layer. It was verified through practical cases that the method could monitor and evaluate the operation status of protection equipment in real time, and the results obtained from the evaluation matched the actual condition of the equipment. When 600 sets of actual fault records of protection equipment were compared with the fault results obtained by this method, the correct rate of prediction could reach more than 90%. It was also proved that the method could optimize the algorithm and database according to each prediction result, and continuously improved the correctness of the prediction algorithm.
In this paper, nine main characteristic quantities and nine common faults for state evaluation and fault prediction were selected by analyzing the actual operation data of a smart station in recent years. This research method is not limited to the several characteristic quantities and fault sets in the paper, but can be modified according to the actual operation features, the development of smart grid technologies, and the renewal of electrical equipment. Subsequent research can also be modularized and regionalized for the protection system, and different matter-elements can be established for different devices of the protection system for state evaluation and fault prediction, thus the algorithm model can be refined and optimized. This method can also be applied to other electrical equipment, such as measurement and control devices, communication devices, and distribution automation devices, etc.
In the current practical application of relay protection status evaluation, static indicators are generally used, and the evaluation results focus on the management and regular maintenance of the equipment, while it is difficult to grasp the operating status and trend of the equipment in real time, not to mention the possible failure of the equipment to make predictions. In comparison, the digital twin-based protection system state evaluation and fault prediction method proposed in this paper takes the dynamic characteristics of the protection system’s operating state information and alarm signals as evaluation indicators, to characterize the operating state of the physical equipment in real time with the changes in the sequence of characteristic quantities. When the status rating is poor, it can make timely and effective fault advance warnings and determine the most likely type of fault, so as to guide operation and maintenance personnel to carry out targeted and preventive maintenance. This method can assist operation and maintenance personnel in decision-making, greatly reducing the workload of operation and maintenance personnel in fault finding, troubleshooting and positioning, and improving the efficiency of protection system status maintenance. It is important to improve the intelligence level of smart substations and ensure the safe operation of protection system equipment and even smart grids.
The development of a software system based on the architecture of this paper is in progress. The demand research analysis and overall system design have been completed. In the context of today’s power grid construction, the lagging construction of secondary system monitoring, analysis and control means has become a shortcoming that restricts the development of power grid regulation and business control. As of 2019, the State Grid Corporation has a total of more than 1.1 million sets of microcomputer relay protection devices, and the protection devices for 220 KV and above systems have reached 200,000. While the power grid is developing rapidly, the number of its faults is also increasing year by year, with 2360 faults of 220 KV and above voltage level occurring in 2018. Therefore, this system has good application prospects. In the construction of the system, the overall principle of “research and development, pilot, and commissioning” is steadily promoted. The basic processing flow, underlying architecture, algorithm design and module division of the system have been gradually developed and perfected. The developers are carrying out specific programming work on data structure, algorithm analysis, and module implementation according to the design scheme, so as to achieve the requirements of the function, performance, and interface of the target system. The phases of product testing and commissioning will also be in subsequent development plans.

Author Contributions

Conceptualization, Y.D. and Q.C.; data curation, Y.D. and W.D.; formal analysis, Y.D., Q.C. and G.C.; funding acquisition, Q.C.; methodology, Y.D., Q.C. and N.S.; project administration, Q.C.; software, Y.D.; validation, Y.D. and Q.C.; visualization, Y.D. and G.L.; writing original draft, Y.D.; writing review and editing, Y.D., Q.C. and G.L. All authors have read and agreed to the published version of the manuscript.

Funding

This work was supported by the National Natural Science Foundation of China (No. 5187070349).

Data Availability Statement

The data presented in this study are available in the article.

Conflicts of Interest

The authors declare no conflict of interest. The funders had no role in the design of the study; in the collection, analyses, or interpretation of data; in the writing of the manuscript, or in the decision to publish the results.

References

  1. Dileep, G. A survey on smart grid technologies and applications. Renew. Energy 2020, 146, 2589–2625. [Google Scholar] [CrossRef]
  2. Li, Z.; Sun, Z.; Gu, Q.; Lv, H. Smart operation and maintenance system based on situational awareness and assistant decision-making of relay protection devices. Power Syst. Prot. Control. 2020, 48, 142–150. [Google Scholar] [CrossRef]
  3. Wu, D.; Tang, X.; Li, P.; Yang, Z.; Wen, B.; Li, H. State monitoring technology of substation relay protection device based on deep neural network. Power Syst. Prot. Control. 2020, 48, 81–85. [Google Scholar] [CrossRef]
  4. Cai, J.; Zheng, Y.; Zhou, Z.; Liu, M.; Meng, L.; Chen, C. A survey of research on secondary device condition monitoring in smart substation. Power Syst. Prot. Control. 2016, 44, 148–154. [Google Scholar]
  5. Liu, K.; Huang, M.; Li, Y.; Liu, W.; Chen, Q.; Wang, Z.; Wang, Y. Research on online operation method for protective relay of smart substation. Power Syst. Prot. Control. 2020, 48, 58–65. [Google Scholar] [CrossRef]
  6. Etemadi, A.H.; Fotuhi-Firuzabad, M. New considerations in modern protection system quantitative reliability assessment. IEEE Trans. Power Deliv. 2010, 25, 2213–2222. [Google Scholar] [CrossRef]
  7. Dai, Z.; Liu, Y.; Qiu, X.; Han, J. Condition evaluation approach of protective devices based on fuzzy comprehensive evaluation with variable weight. Electr. Meas. Instrum. 2021, 58, 150–157. [Google Scholar] [CrossRef]
  8. Yang, G.; Li, H.; Guo, P.; Wang, W.; Zhang, L.; Liu, D. An operation status perception method for relay protection device based on fuzzy comprehensive evaluation. Electr. Power Inf. Commun. Technol. 2020, 18, 74–83. [Google Scholar] [CrossRef]
  9. Zheng, M.; Yu, J.; Chen, H.; Zhang, S.; Chen, H.; Gao, H.; Zhang, J. Construction of index system for relay protection operation evaluation based on KPI. J. Shandong Univ. 2017, 47, 13–19. [Google Scholar]
  10. Liu, Y.; Wang, M. Reliability Analysis on redundant configuration of protective relayings for HVDC power transmission system. Power Syst. Technol. 2008, 32, 51–54+65. [Google Scholar]
  11. Ding, M.; Wang, G.; He, W. The optimum routine maintenance interval of protection based on reliability economic analysis. Proc. Chin. Soc. Electr. Eng. 2007, 27, 44–48. [Google Scholar]
  12. Xiang, C.; Zeng, S.; Yan, P.; Zhao, J.; Jia, B. Typical application and prospect of digital twin technology in power grid operation. High Volt. Eng. 2021, 47, 1564–1575. [Google Scholar] [CrossRef]
  13. Aheleroff, S.; Xu, X.; Zhong, R.Y.; Lu, Y.Q. Digital Twin as a Service (DTaaS) in Industry 4.0: An architecture reference model. Adv. Eng. Inform. 2021, 47, 101225. [Google Scholar] [CrossRef]
  14. Kaur, M.J.; Mishra, V.P.; Maheshwari, P. The Convergence of Digital Twin, IoT, and Machine Learning: Transforming Data into Action. In Digital Twin Technologies and Smart Cities; Springer: Cham, Switzerland, 2020; pp. 3–17. [Google Scholar]
  15. Fuller, A.; Fan, Z.; Day, C.; Barlow, C. Digital twin: Enabling technologies, challenges and open research. IEEE Access 2020, 8, 108952–108971. [Google Scholar] [CrossRef]
  16. Bai, H.; Zhou, C.; Yuan, Z.; Lei, Y. Prospect and thinking of digital power grid based on digital twin. South. Power Syst. Technol. 2020, 14, 18–24+40. [Google Scholar] [CrossRef]
  17. Zhou, M.; Yan, J.F. A new solution architecture for online power system analysis. CSEE J. Power Energy Syst. 2018, 4, 250–256. [Google Scholar] [CrossRef]
  18. Youssef, T.A.; Esfahani, M.M.; Mohammed, O. Data-centric communication framework for multicast IEC 61850 routable GOOSE messages over the WAN in modern power systems. Appl. Sci. 2020, 10, 848. [Google Scholar] [CrossRef] [Green Version]
  19. Zhou, M.; Feng, D.; Yan, J.; Zhou, X. A software platform for second-order responsiveness power grid online analysis. Power Syst. Technol. 2020, 44, 3474–3480. [Google Scholar] [CrossRef]
  20. Qi, B.; Zhang, P.; Zhang, S.; Zhao, L.; Wang, H.; Huang, M.; Tang, Z.; Ji, M.; Li, C. Application status and development prospects of digital twin technology in condition assessment of power transmission and transformation equipment. High Volt. Eng. 2021, 47, 1522–1538. [Google Scholar] [CrossRef]
  21. Patrizi, N.; LaTouf, S.K.; Tsiropoulou, E.E.; Papavassiliou, S. Prosumer-centric self-sustained smart grid systems. IEEE J. 2022, 1–12. [Google Scholar] [CrossRef]
  22. Liu, H.; Shao, J.; Wang, X.; Han, X.; Liu, X.; Liu, S. State evaluation and fault prediction of distribution automation terminal equipment based on digital twin. Power Syst. Technol. 2022, 46, 1605–1613. [Google Scholar] [CrossRef]
  23. Zhao, B.; Cheng, D.; He, D. White Paper on Digital Twinning Applications; China Institute of Electronic Technology Standardization, Rootcloud Technology Co., Ltd.: Beijing, China, 2020. [Google Scholar]
  24. Zhang, H.; Yao, L.; Yuan, X. Digital Twin White Paper; China Electronic Information Industry Development Research Institute: Beijing, China, 2019. [Google Scholar]
  25. Wang, L.; Chen, Q.; Gao, H.; Ma, Z.; Zhang, Y.; He, D. Framework of fault trace for smart substation based on big data mining technology. Autom. Electr. Power Syst. 2018, 42, 84–91. [Google Scholar]
  26. Huang, D.; Zheng, H. Scale-extending method for constructing judgment matrix in the analytic hierarchy process. Syst. Eng. 2003, 21, 105–109. [Google Scholar]
  27. Zhao, J.; Fu, Z. Microcomputer Protection of Power System; China Machine Press: Beijing, China, 2006. [Google Scholar]
  28. Sun, M. Fault Tracking of Circuit Breaker and Relay Protection System Based on Intelligent Algorithm. Master’s Thesis, Shandong University, Shandong, China, 2020. [Google Scholar]
  29. Li, H. Factor spaces and mathematical frame of knowledge representation(Ⅷ)—Variable weights analysis. Fuzzy Syst. Math. 1995, 9, 1–9. [Google Scholar]
  30. Wang, X.; Yang, X. Connection-number-similarity-measure-based method for multiple attribute decision making with interval numbers. Math. Pract. Theory 2008, 38, 16–22. [Google Scholar]
  31. Jia, R.; Li, Y. K-means algorithm of clustering number and center self-determination. Comput. Eng. Appl. 2018, 54, 152–158. [Google Scholar]
  32. Ren, B.; Zheng, Y.; Wang, Y.; Sheng, S.; Li, J.; Zhang, H.; Zheng, C. Fault location of secondary equipment in smart substation based on deep learning. Power Syst. Technol. 2021, 45, 713–721. [Google Scholar] [CrossRef]
  33. Yuan, H.; Qu, G.; Zhuang, W.; He, M.; Chen, A.; Zhang, H. Discussion on condition monitoring contents of secondary equipment in power grid. Autom. Electr. Power Syst. 2014, 38, 100–106. [Google Scholar]
  34. Li, Y.; Che, Y.; Shan, Q.; Sun, J.; Hu, G.; Li, P.; Li, J.; Liu, Z. Research on secondary system on-line monitoring and evaluation in smart substation. Power Syst. Prot. Control. 2016, 44, 66–70. [Google Scholar]
Figure 1. Digital Twin Architecture and Working Principle of Protection System.
Applsci 12 07539 g001
Figure 2. Master station architecture of secondary monitoring system.
Applsci 12 07539 g002
Figure 3. Workflow of Digital Twin Model Layer.
Applsci 12 07539 g003
Figure 4. State Evaluation Process of Matter Element Extension Method.
Applsci 12 07539 g004
Figure 5. Channel operation scoring criteria.
Applsci 12 07539 g005
Figure 6. Fault prediction process based on a clustering algorithm.
Applsci 12 07539 g006
Figure 7. Schematic diagram of case analysis.
Applsci 12 07539 g007
Figure 8. Change of characteristic weight at each moment.
Applsci 12 07539 g008
Figure 9. Variation of the closeness of the protection system to each state level at each moment.
Applsci 12 07539 g009
Figure 10. Relative correlation degree with each fault type.
Applsci 12 07539 g010
Figure 11. Accuracy Change of Fault Prediction Algorithm.
Applsci 12 07539 g011
Table 1. The main functions of each layer.
LayersMain Function
Physical device layerConstitute all physical devices of the protection system
Data transmission layerCarrying and transmission of bidirectional information data flow
Data-processing layerProcessing of acquired secondary equipment operation data
Twin model layerImplementation of a specific algorithm for state evaluation and fault prediction of the protection system
Application management layerDecision-making and processing of algorithmic results, and assisting the operation and maintenance personnel to master the equipment situation
Table 2. Main characteristic quantities of protection system.
NumberCharacteristic Quantities
c1GOOSE general alarm
c2SV link general alarm
c3SV/GOOSE plug-in optical port receive/transmit power out of limits
c4Protection DSP sampling errors
c5Pilot protection channel anomaly alarm
c6SV sampling invalid
c7SV sampling out of step
c8MU data abnormalities
c9Merge unit sampling exception
Table 3. Comprehensive posterior probability of characteristic quantities c 1 9 .
c1c2c3c4c5c6c7c8c9
CPP0.59750.52850.47600.30750.50650.42450.09720.46550.2675
Table 4. Scale meaning and explanation in matrix M.
ScaleImplicationExplanation
0.5Equally important c i   and   c j are equally important for equipment status
0.6Slightly important c i   is   slightly   more   important   than   c j
0.7Generally important c i   is   a   little   more   important   than   c j
0.8Clearly important c i   is   obviously   more   important   than   c j
0.9Much more important c i   is   much   more   important   than   c j
<0.5 Comparing   c i   with   c j   to   judge   m i j ,   then   comparing   c j   with   c i   to   judge   m j i   = ( 1 m i j )
Table 5. Initial weight of characteristic quantity obtained by improved AHP method.
c1c2c3c4c5c6c7c8c9
Weight   w i 0.14030.13190.11940.09170.12080.10690.09720.11530.0847
Table 6. Fault characteristic sequence sample.
Fault TypesNumberc1c2c3c4c5c6c7c8c9
1010000.670.6710.67
310.67100.330100.670
610100.6700100
91000.850.30.90000.17
121110.0500.11000.17
1510.670.670.10.330.11100
181100.0500000.670
211100.950.330.30010.17
241010.85001000.5
Table 7. Cluster centers of nine fault types.
Typesc1c2c3c4c5c6c7c8c9
0.05490.77930.00510.08880.01350.89070.83270.74180.8369
0.80470.85900.01470.69080.00650.87970.02230.91980.0171
0.02120.90290.01430.83230.00290.01050.87840.01080.0107
0.02090.02330.77990.04300.83350.02140.01240.02210.0521
0.89580.91200.02100.03380.01970.88660.24120.05630.0390
0.86920.87890.02120.04330.02750.84520.65690.04450.0445
0.92020.03350.01470.02180.02400.02130.02230.96780.0220
0.90280.06860.88530.05760.03210.01010.02050.99910.0266
0.04340.92120.90580.03330.01000.91320.04480.03230.4422
Table 8. The clustering center of fault type ① under different sample numbers.
Sample Numberc1c2c3c4c5c6c7c8c9
450.06830.799200.133300.86500.86750.79920.6663
900.03310.83390.00510.09940.01020.86670.83280.73190.8033
1350.06190.75070.00330.08820.00660.86720.84490.75560.7899
1800.05770.76710.00590.08260.01560.88540.85040.76720.8285
2250.05440.77320.00590.08380.01420.89600.83970.74760.8362
2700.05490.77930.00510.08880.01350.89070.83270.74180.8369
Table 9. Characteristic quantity sequence at moments 1–7.
Momentc1c2c3c4c5c6c7c8c9
1000000000
2000000001
3000100001
4100201002
5100202112
6110303313
7330303316
Table 10. Closeness of protection system at moment 3 to each state level.
NormalAttentionSevere
Closeness0.99960.99880.9953
Relative Closeness10.78740
Table 11. Number of correct fault predictions for the first set of data.
Fault TypesTotal
Actual number of faults151510103010153015150
Number of correct predictions1313109289142713136
Publisher’s Note: MDPI stays neutral with regard to jurisdictional claims in published maps and institutional affiliations.

