Article

Classification of Alzheimer’s Disease Using Dual-Phase 18F-Florbetaben Image with Rank-Based Feature Selection and Machine Learning

1
Department of Translational Biomedical Sciences, College of Medicine, Dong-A University, Busan 49201, Korea
2
Institute of Convergence Bio-Health, Dong-A University, Busan 49201, Korea
3
Department of Management Information Systems, Dong-A University, Busan 49315, Korea
4
Department of Nuclear Medicine, Dong-A University Medical Center, College of Medicine, Dong-A University, Busan 49201, Korea
*
Author to whom correspondence should be addressed.
These authors contributed equally to this manuscript.
Appl. Sci. 2022, 12(15), 7355; https://doi.org/10.3390/app12157355
Submission received: 11 June 2022 / Revised: 14 July 2022 / Accepted: 19 July 2022 / Published: 22 July 2022
(This article belongs to the Special Issue Deep Learning and Machine Learning in Biomedical Data)

Abstract

:
18F-florbetaben (FBB) positron emission tomography is a representative imaging test that observes amyloid deposition in the brain. Compared to delay-phase FBB (dFBB), early-phase FBB shows patterns related to glucose metabolism in 18F-fluorodeoxyglucose perfusion images. The purpose of this study is to prove that classification accuracy is higher when using dual-phase FBB (dual FBB) versus dFBB quantitative analysis by using machine learning and to find an optimal machine learning model suitable for dual FBB quantitative analysis data. The key features of our method are (1) a feature ranking method for each phase of FBB with a cross-validated F1 score and (2) a quantitative diagnostic model based on machine learning methods. We compared four classification models: support vector machine, naïve Bayes, logistic regression, and random forest (RF). In composite standardized uptake value ratio, RF achieved the best performance (F1: 78.06%) with dual FBB, which was 4.83% higher than the result with dFBB. In conclusion, regardless of the two quantitative analysis methods, using the dual FBB has a higher classification accuracy than using the dFBB. The RF model is the machine learning model that best classifies a dual FBB. The regions that have the greatest influence on the classification of dual FBB are the frontal and temporal lobes.

1. Introduction

Dementia is one of the leading causes of death worldwide due to population growth and aging [1]. Alzheimer’s disease (AD) accounts for the majority of dementia cases and is a progressive neurodegenerative disease that causes memory loss, cognitive impairment, behavioral changes, and death [2]. One of the characteristics of Alzheimer’s dementia is the formation of amyloid plaques due to the deposition of abnormal neuropathological proteins in the early stages [3]. Accordingly, amyloid biomarkers detect the deposition of amyloid plaques in the brain and are used as a major diagnostic tool for the clinical diagnosis and prediction of Alzheimer’s dementia. However, the exact pathogenesis of Alzheimer’s dementia is very complex, and it can develop even without protein deposition. To compensate for this, an 18F-fluorodeoxyglucose (FDG) test, which checks blood flow to the brain, is performed to confirm Alzheimer’s dementia. Unfortunately, performing multiple such tests involves an economic and physical cost to the patient, and undergoing multiple tests causes anxiety in patients and treatment delays [4]. Therefore, in the clinical environment, much effort has been expended to find a way to accurately diagnose Alzheimer’s dementia at an early stage without multiple tests.
One of the efforts is to utilize the amyloid positron emission tomography (amyloid PET) biomarker as a dual-phase biomarker using it as the early-phase amyloid PET image. Many previous studies have shown that the early-phase amyloid PET image is similar to the FDG biomarker image and can therefore replace it [5,6,7]. However, it cannot do so clearly, and considering the noise, it is difficult to analyze for readers with little experience. Inexperienced readers are more vulnerable to subjectivity because they have difficulty making visual assessments that depend heavily on their previous experience, resulting in high inter-rater variability [8].
Recently, artificial intelligence algorithms have made significant contributions to medical diagnosis. In the past decade, the use of machine learning (ML) algorithms for the classification of Alzheimer’s has been very beneficial because it has solved the problem of inter-rater variability and has reduced the physical labor for researchers and clinicians. Previous studies have used various methods, such as support vector machines, naïve Bayes, artificial neural networks, and deep learning [9,10]. Additionally, some researchers have used ensemble strategies to improve the effectiveness of AD diagnosis/prognosis [11,12,13]. These studies frequently proposed predictive models utilizing unimodal or multimodal data, such as magnetic resonance imaging, computed tomography, or positron emission tomography. This approach using multiple types of information could help solve the problem of understanding the heterogeneous physiological characteristics of AD.
Referring to previous studies showing that early amyloid PET can be used instead of FDG, we performed a comparative analysis to confirm that using dual-phase 18F-florbetaben (dual FBB) has better classification performance than using delay-phase FBB (dFBB) with ML. This study makes the following contributions. First, this study confirms that the classification performance with dual FBB is better than that with dFBB using ML algorithms. Second, using feature selection with ML, this study confirmed the effect of each brain region corresponding to the composite standardized uptake value ratio (SUVR) of FBB on diagnosis classification.

2. Materials and Methods
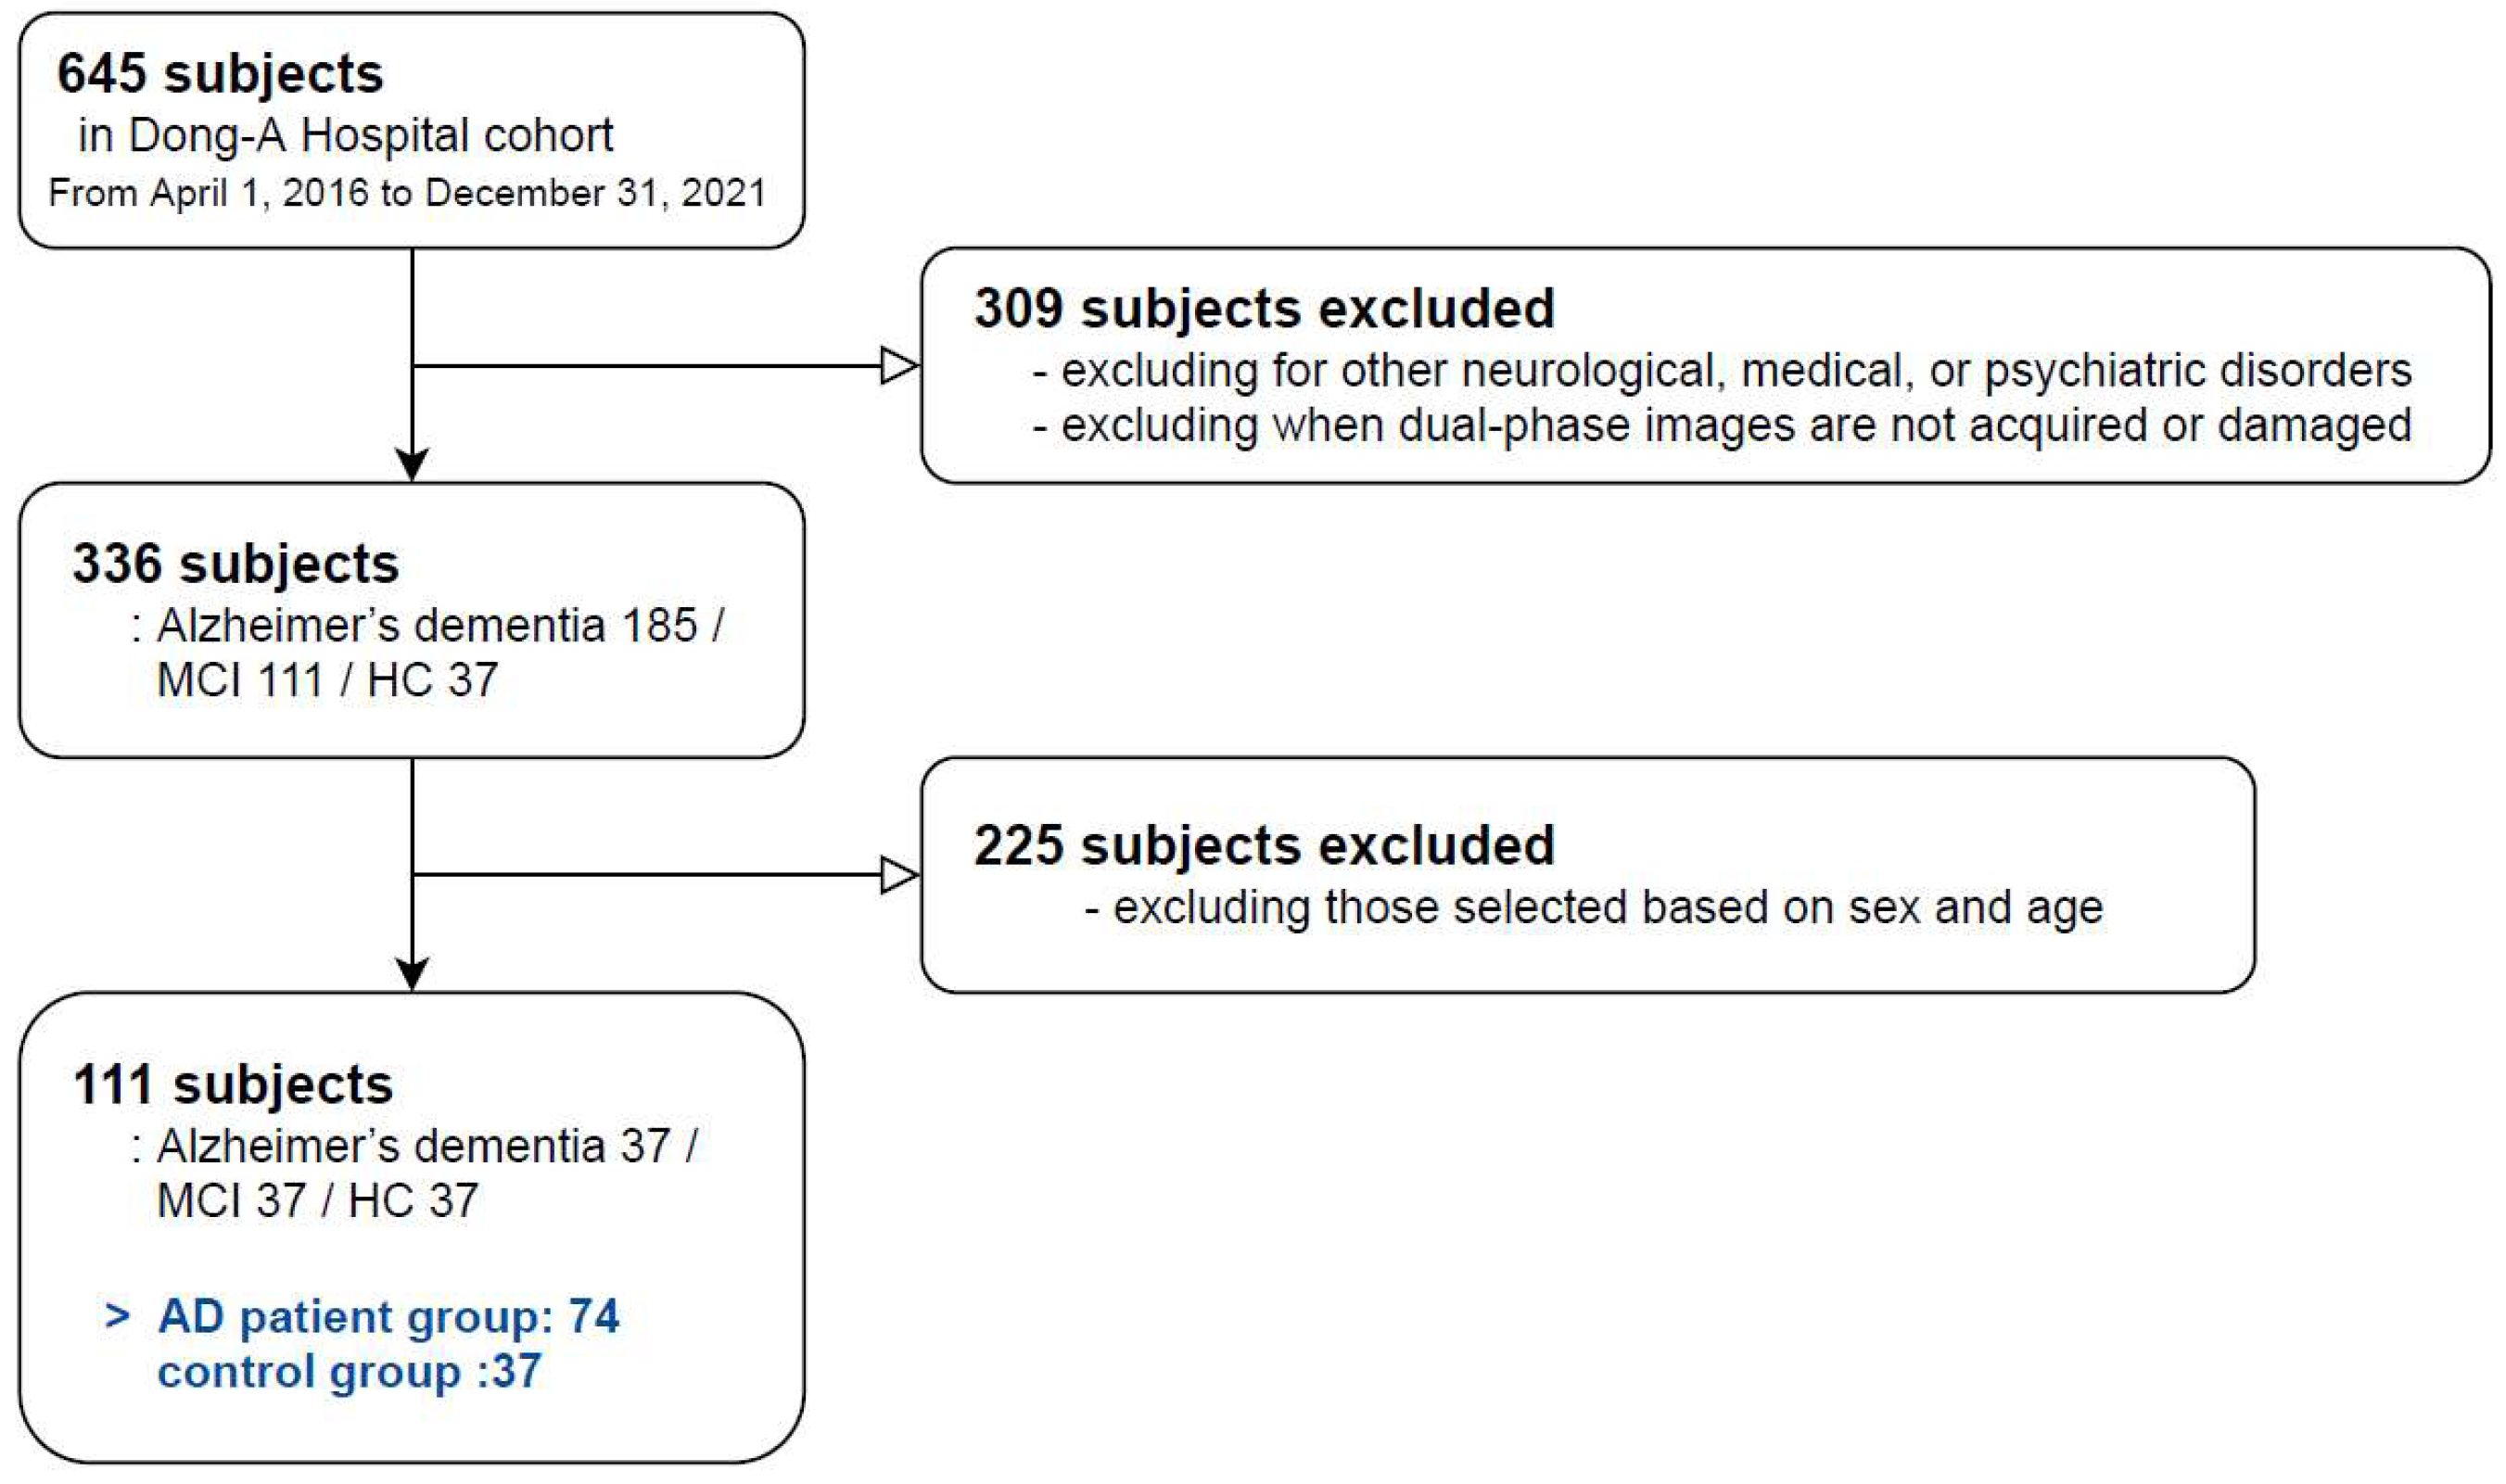
2.1. Subjects

This study included subjects with dual FBB images who underwent FBB testing between April 2016 and December 2021 in the Dong-A University cohort. A total of 645 subjects underwent FBB testing during this period. We included 336 subjects, excluding those with neurological, medical, or psychiatric disorders and cases in which dual FBB images were not obtained or were damaged. The 336 subjects were classified according to their diagnoses into 188 patients with Alzheimer’s dementia, 111 patients with mild cognitive impairment diagnosis (MCI), and 37 subjects as healthy controls (HCs). Because the proportion of subjects in the three groups was very disproportionate, 37 patients with Alzheimer’s dementia and 37 patients with MCI who were the most similar based on sex and age to the HC subjects were selected (Figure 1). As a result, 37 subjects with Alzheimer’s dementia, 37 subjects with MCI, and 37 HC subjects were selected (Figure 2, Table 1). Each phase of the FBB image was confirmed by a nuclear medicine physician after collection, to ensure that the Aβ distribution labels were accurate. We classified subjects with Alzheimer’s dementia and MCI into an “AD patient group” and HC subjects into a “control group”. As a result, the subjects participating in the experiment were divided into two classes: AD patient group and control group.
The Dong-A University Hospital Institutional Review Board (DAUHIRB) reviewed this study with the members who participated in the Institutional Review Board Membership List and finally approved this study protocol (DAUHIRB-17–108).

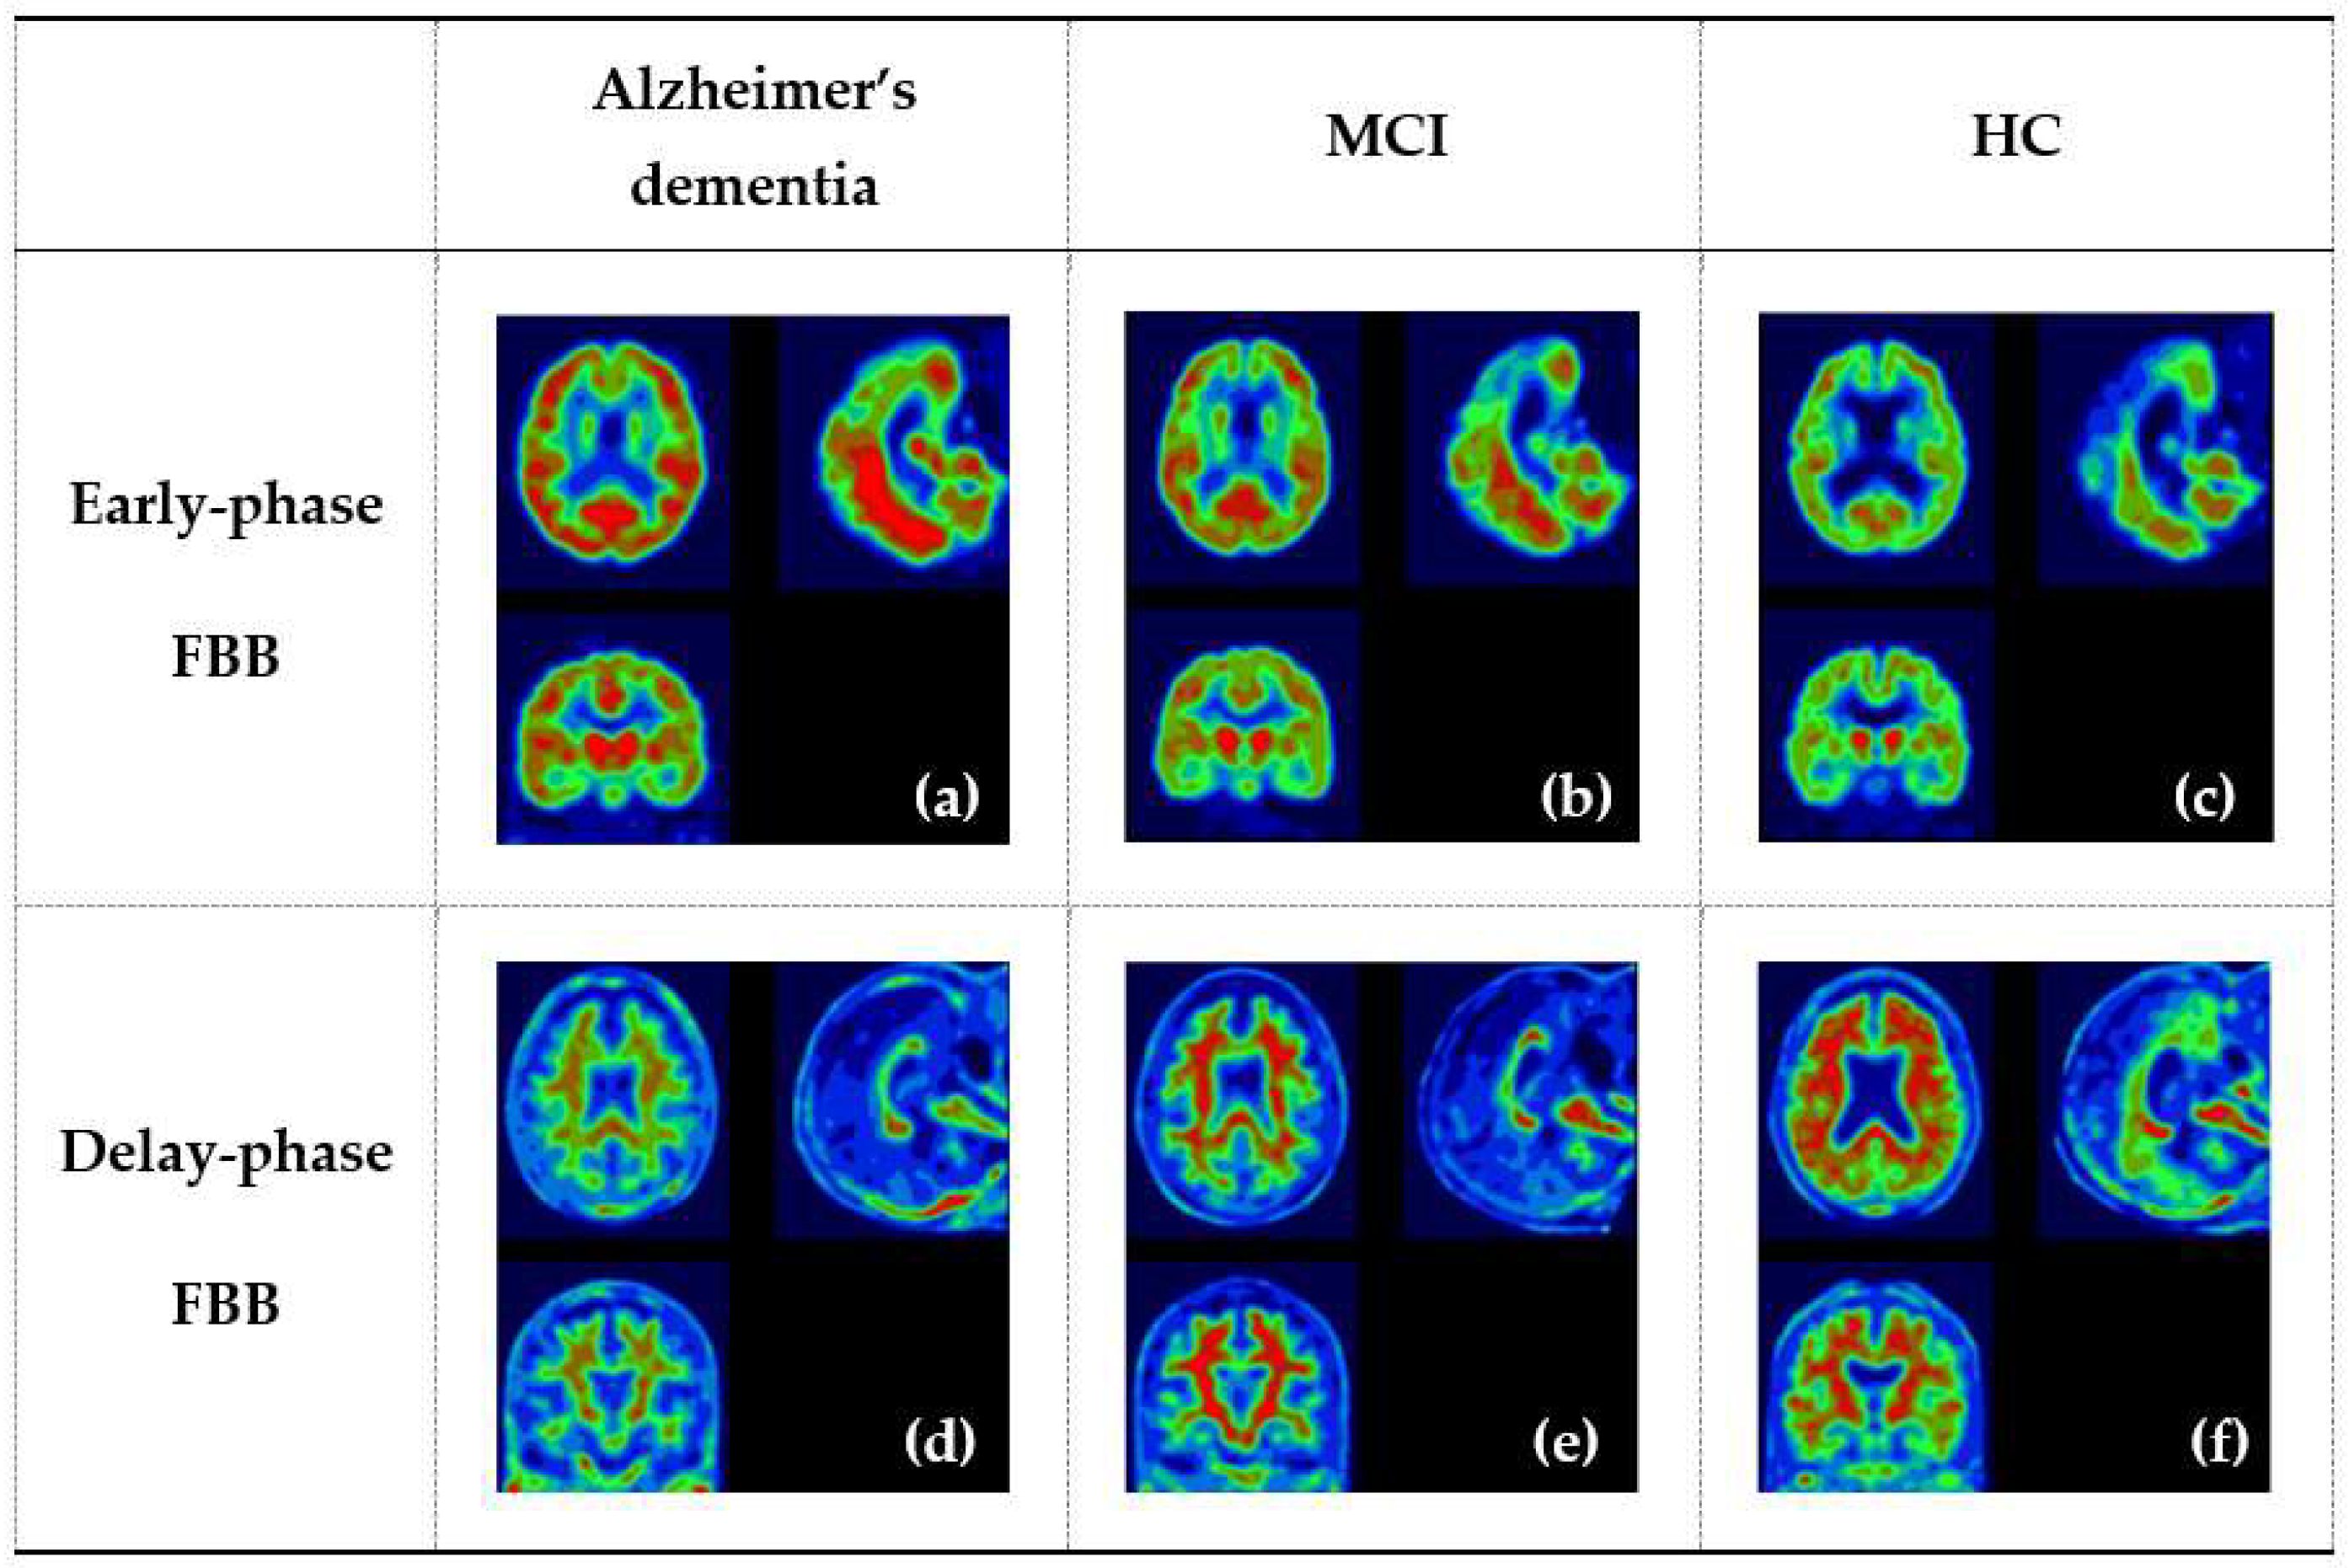
2.2. Image Acquisition and Analysis

2.2.1. Image Acquisition

All PET examinations were performed using a Biograph 40 m CT Flow PET/CT scanner (Siemens Healthcare, Knoxville, TN, USA). Images obtained through scanning were reconstructed using Ultra HD-PET (TrueX-TOF). All images were obtained from the skull vertex to the skull base. eFBB images were acquired for 0–20 min after intravenous injection of FBB of 370 MBq in all subjects. dFBB images were acquired 90–110 min after the injection. Spiral CT was performed with a rotation time of 0.5 s at 100 kVP and 228 mA without an intravenous contrast medium.

2.2.2. Image Preprocessing

Both the eFBB and dFBB images underwent the same preprocessing. The eFBB image was acquired by averaging frames of 1.5–6 min, which is a time range with a high correlation with FDG, considering the initial noise and the minimum image length between 0–20 min (Figure S1). The program used for the pretreatment process was the PMOD software (version 3.613, PMOD Technologies Ltd., Zurich, Switzerland). For the pretreatment process, we referred to the paper of Yoon et al. [14].

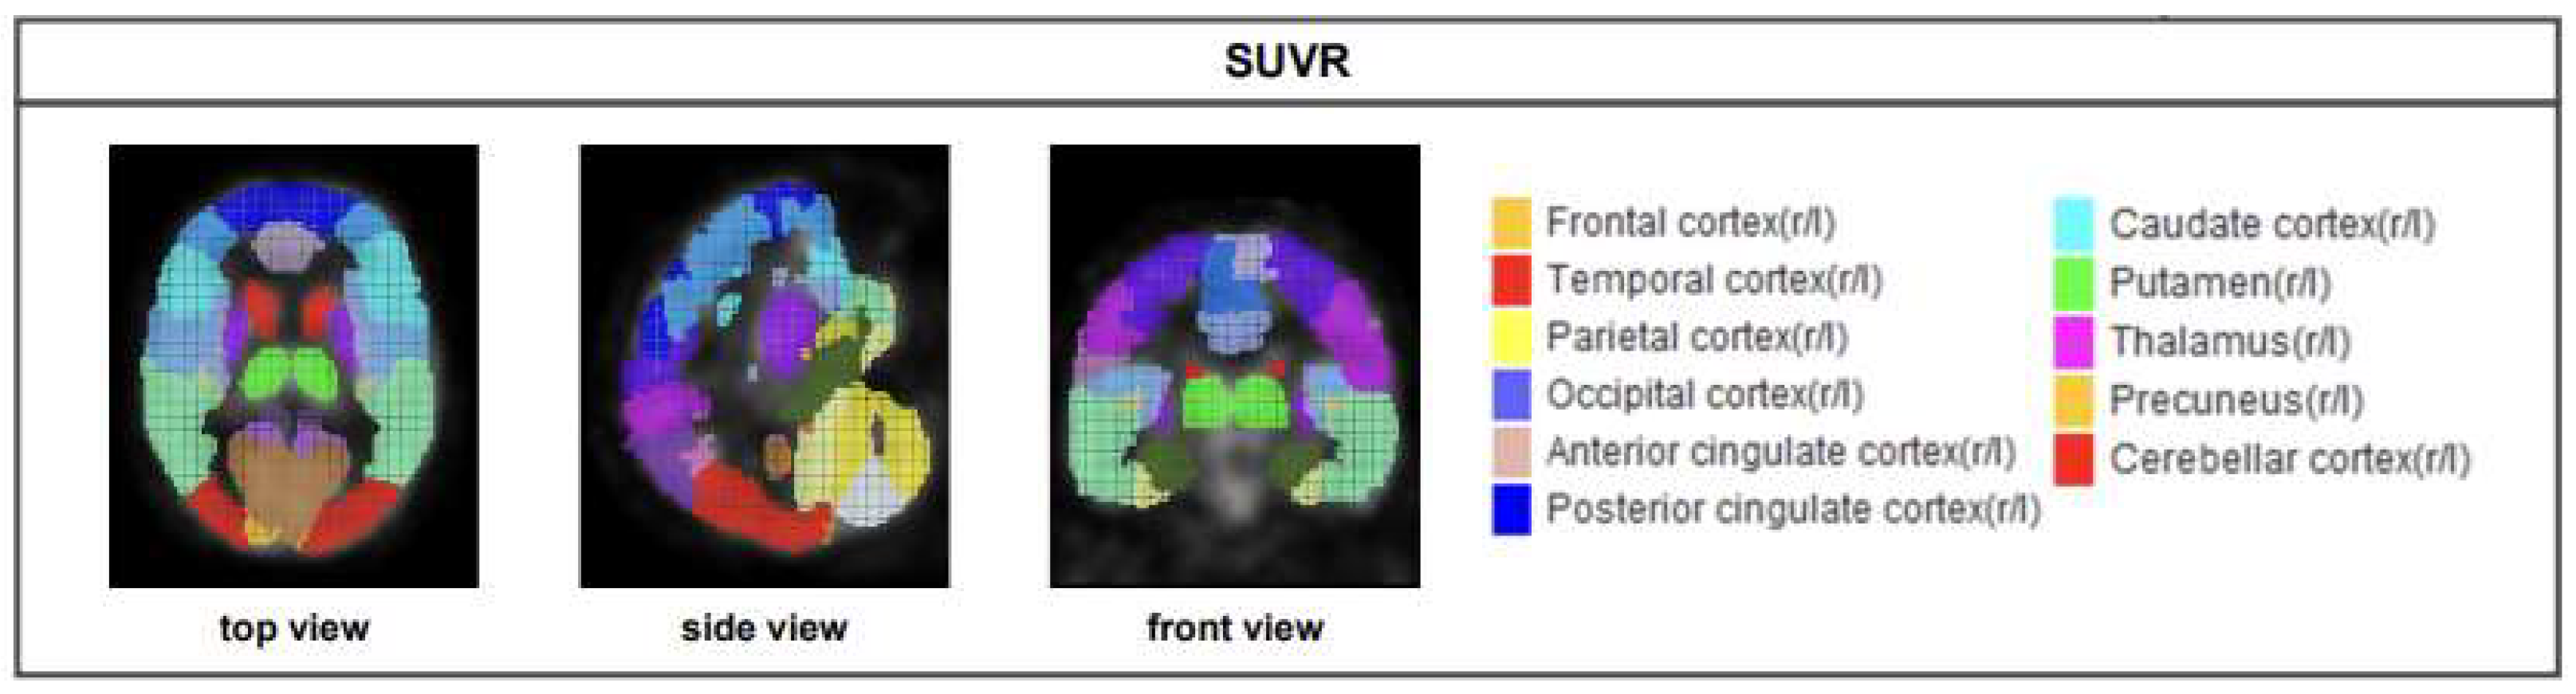
2.2.3. SUVR acquisition
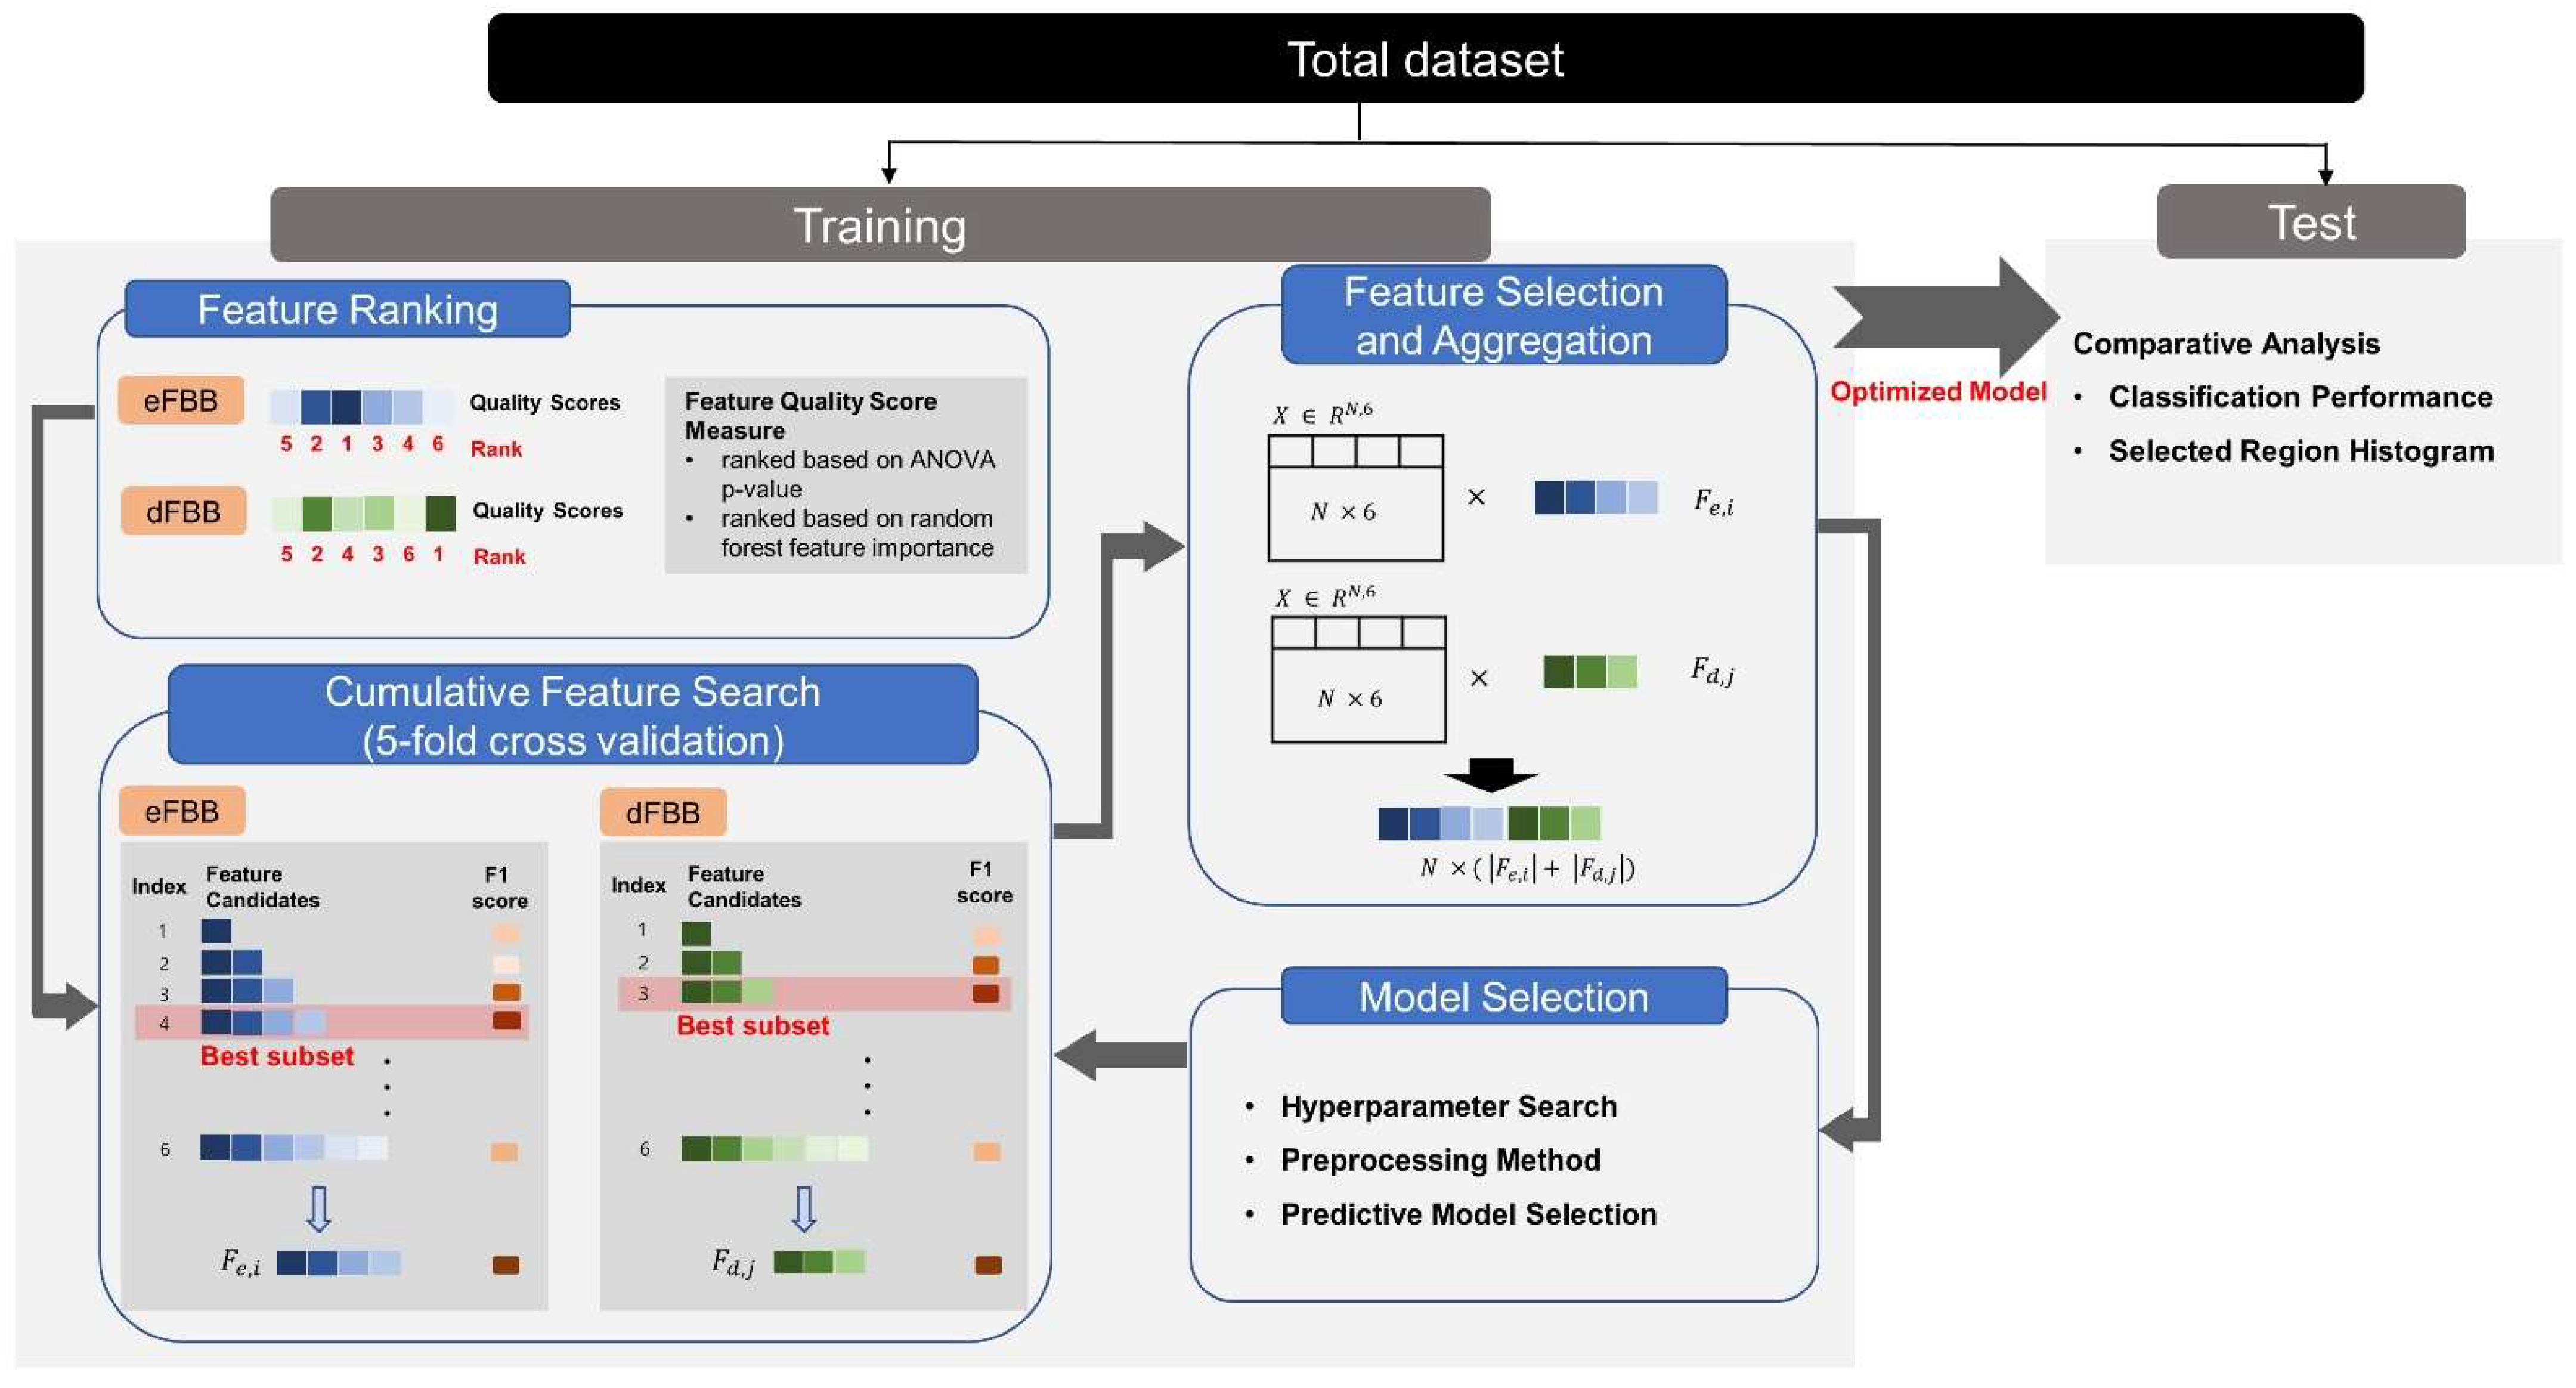
SUVR was obtained for 10 brain areas using the “view” program of PMOD. These 10 brain areas were averaged out of 67 areas in the AAL-merged volume-of-interest provided by PMOD (10 brain areas: frontal cortex (r/l), temporal cortex (r/l), parietal cortex (r/l), occipital cortex (r/l), anterior cingulate cortex (r/l), posterior cingulate cortex (r/l), caudate cortex (r/l), putamen (r/l), thalamus (r/l), precuneus (r/l), and cerebellar cortex (r/l)) (Figure 3). In the experiment, a composite SUVR [15] and regional SUVR were used. Composite SUVR is the average SUVR of the six regions (frontal cortex (r/l), temporal cortex (r/l), parietal cortex (r/l), occipital cortex (r/l), anterior cingulate cortex (r/l), and posterior cingulate cortex (r/l)). Regional SUVR is the SUVR of each considered in the composite SUVR.

2.3. Experiment

Figure 4 presents an overview of our proposed framework to demonstrate the feasibility of using a dual FBB. The experimental process consisted of the following four steps:
  • Feature ranking methods were applied to the preprocessed data.
  • Feature subset was determined by cumulative feature search with 5-fold cross validation.
  • As a series of model selection procedures, the hyperparameters, preprocessing methods, and types of predictive model were reconsidered without test set.
  • The best model was tested and feature distribution observed to test our hypotheses.
In the above experimental procedure, we observed the major cortical brain area through frequency analysis and the effect of the extracted features on patient classification, as well as the performance of the classification model. We split the data into training and testing sets (8:2). In particular, we conducted a feature ranking method with a cross-validated F1 score for feature selection and compared four representative ML methods to observe the classification performance of the selected regional SUVR and composite SUVR from each phase of FBB.

2.3.1. Feature Selection and Aggregation for Dual-Phase FBB

In our experiment, we used ranking-based feature selection that individually evaluated each feature and sorted those features based on the evaluated scores [16]. We adopted a one-way F-test [17] and the Gini score [18] estimated by random forest to measure the quality of the feature subset. We scored each numerical regional SUVR with the p-Value from the one-way F-test and Gini scores in the training set. Subsequently, we evaluated the performance of the feature subset created by cumulatively adding individual features sorted according to their scores using five-fold cross validation in the training set. Finally, the top feature combinations selected from each phase of the FBB were aggregated as follows:
C i , j = F e , i     F d , j   ( i , j = 1 , 2 , , 10 ) .
Here, F e , i and F d , j are the top feature combinations for each phase of the FBB; C is the feature set aggregated from a dual FBB and is used to extract the input variables for the predictive models. That is, C includes i + j feature combinations, and these combinations are used to create predictive models. In the comparison model with only a single-phase FBB (single FBB), without aggregating C , either F e , i   o r   F d , j is used to make the respective predictive models.

2.3.2. Evaluation for Classification Model and Selected Feature Distribution

As shown in Figure 4, in this experiment, we attempted to show improved patient classification performance of dual FBB compared to single FBB and the brain regions contributing to the classification task through our proposed framework. Therefore, we observed three types of validation items using only the test set.
First, the validation of the patient classification performance of the trained predictive model was considered as follows: representative metrics were used to measure the classification performance. A weighted F1 score was used to overcome data imbalance issues that make a classifier biased toward a majority class [15]. We used the weighted F1 score to validate the quality of the selected feature combinations and evaluated the generalization performance of the predictive model for classifying the AD patient group and the control group.
A c c u r a c y = T P + T N T P + F P + T N + F N
Weighted   F 1   score = 1 l L | y ^ l | l L ( 1 + β 2 ) P r e c i s i o n R e c a l l β 2 P r e c i s i o n + R e c a l l
In the model evaluation, we calculated the area under the curve (AUC) score as well. The receiver operating characteristic (ROC) curve is a graph showing the performance of the classification model at all classification thresholds. The area under the ROC curve, AUC, is used when the distribution for each class is different [19].
Second, we considered the validation of the best feature set submitted by the proposed framework from the training set. Because we iteratively experimented with different seeds, we can simply present the frequencies of the regions suggested by the framework with a histogram. The histogram represents the importance of cortical brain regions in patient classification. We can observe the importance of each cortical region in eFBB imaging, which has rarely been covered in previous studies, or in dFBB imaging.

2.3.3. Machine Learning Methods for Classifying AD Patient Group and Control Group

We considered several representative classifiers to handle simple or complex feature spaces visited during the feature selection step. We built support vector machine (SVM) [20], naïve Bayes (NB) [21], logistic regression (LR) [22], and random forest (RF) [23] as feature quality assessment functions and AD patient classifiers. The kernel of the SVM was set as linear. A radial basis function or polynomial kernel was also tested in our internal experiments, but the results are not presented because there were no meaningful differences. The RF was trained with several estimators of 100, and the Gini impurity [18] was used to measure the quality of the split. The hyperparameters of all models were heuristically determined. There was no specific hyperparameter setting for LR and NB.

2.3.4. Experimental Machine Learning Tool

Python 3.6 was used to conduct the rest of the experimental procedures for feature selection and model evaluation (version 1.0.2 of scikit–learn). The experimental tool was implemented and tested on a Linux Ubuntu 18.04 LTS with an Intel® Xeon® CPU 2.20 GHz without a GPU and 12.68 GB of system memory.

2.4. Statistical Analysis

To provide statistical evidence of the experimental results and the reproducibility of this work, we used statistical tests to observe the significant differences in the performance distribution of the predictive models with each phase of FBB. The best predictive models with regional or composite SUVR were engaged in 100 repeated tests to estimate their F1 score distributions. We considered the Kolmogorov–Smirnov test [24] for the normality test of the F1 score distributions. Furthermore, we performed the Kruskal–Wallis test and post-hoc analysis to evaluate the superiority of dual FBB over single FBB. All experiments were tested at a significance level of p < 0.01 with a two-sided test. Statistical analysis was performed using IBM SPSS Statistics version 23 (Chicago, IL, USA).

3. Results

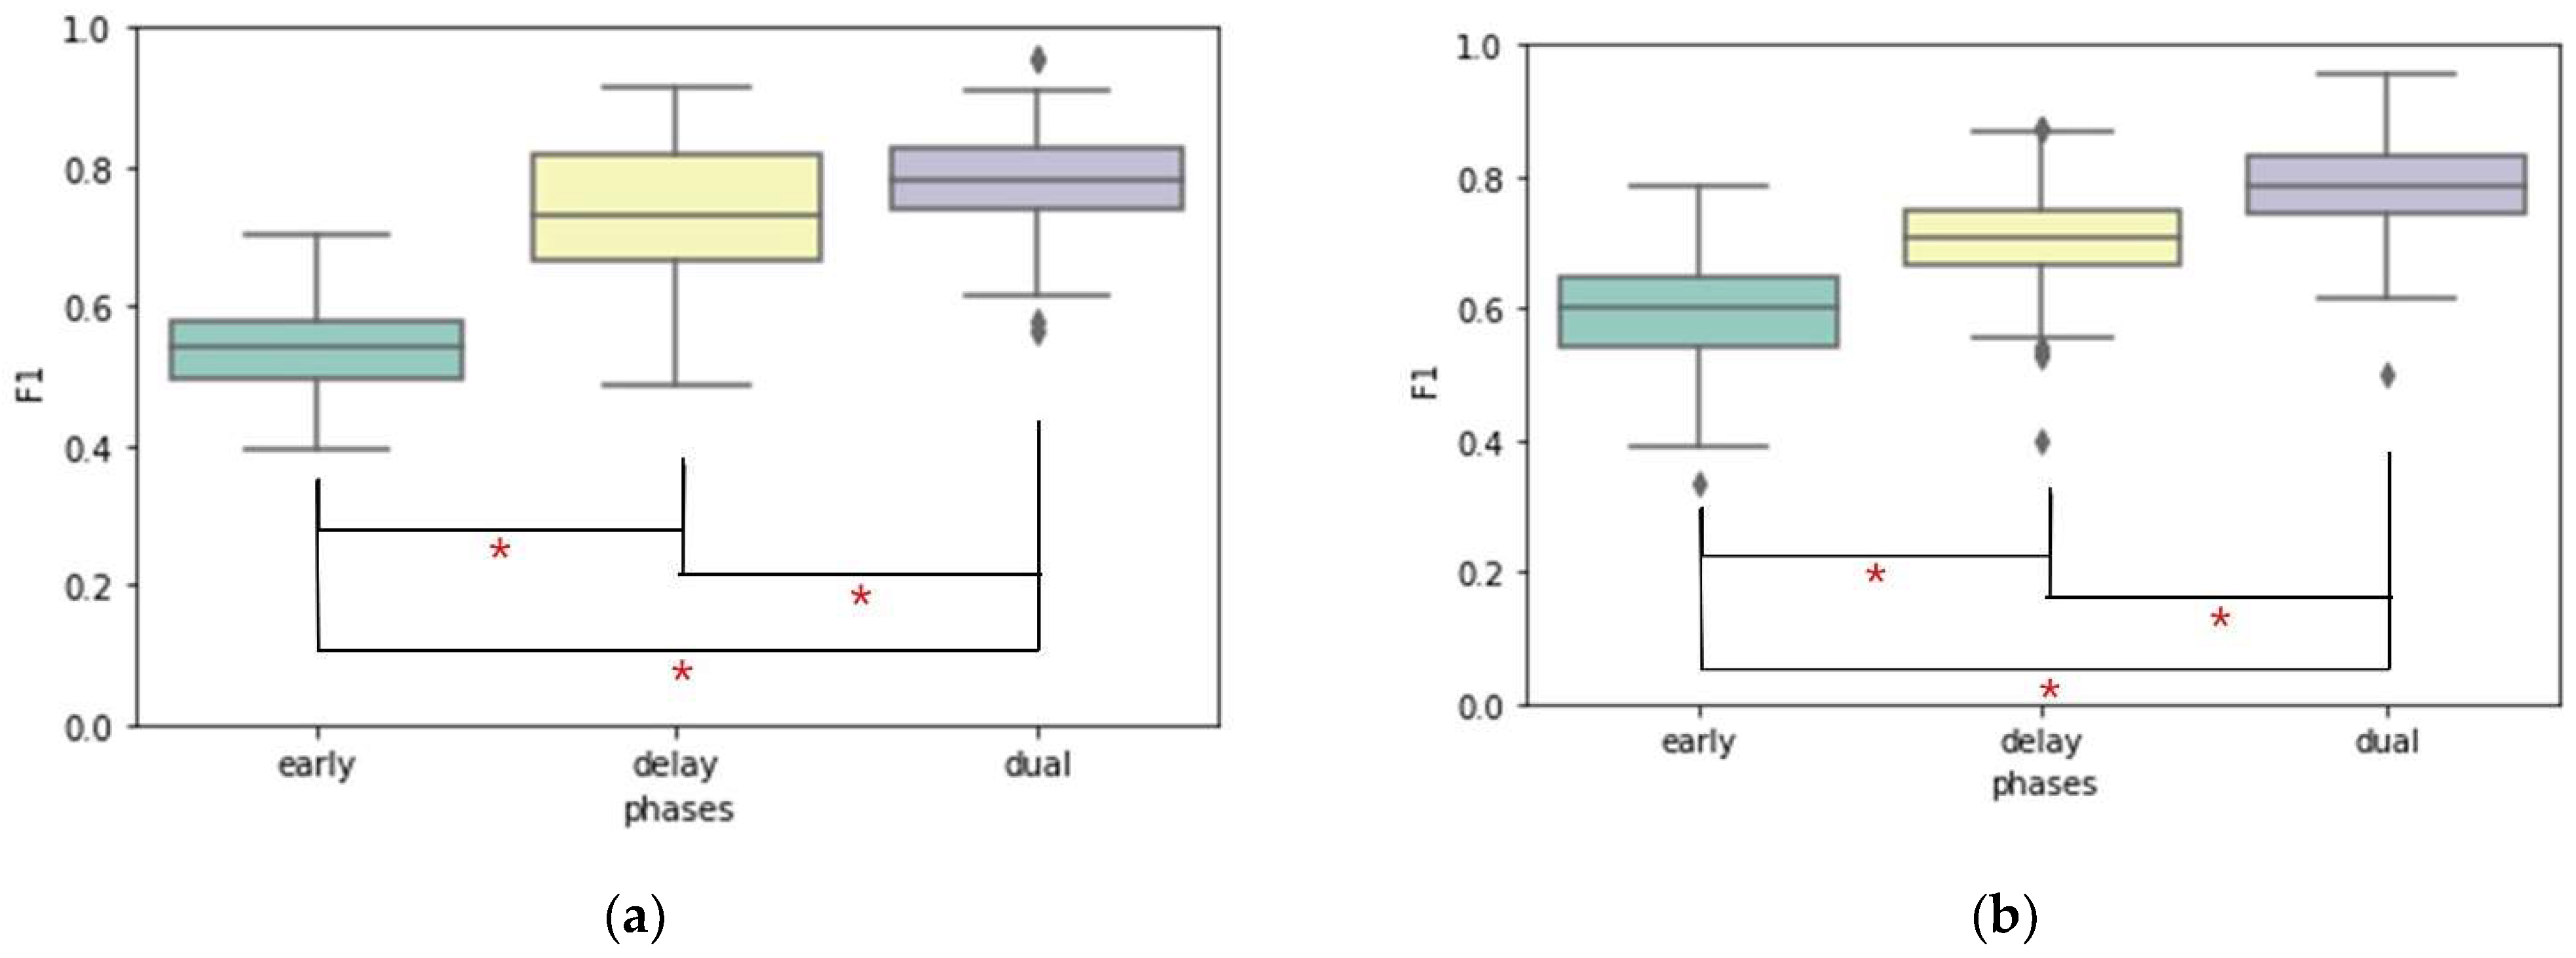
3.1. Comparison of Classification Performance for AD Patient Group and Control Group

Table 2 shows the classification performance of ML-based predictive models. In composite SUVR, RF (ACC: 78.21%, F1: 78.06%, AUC: 0.8724) was the best performing model for dual FBB, followed by NB (ACC: 76.08%, F1: 76.52%, AUC: 0.8469) and LR (ACC: 72.91%, F1: 65.56%, AUC: 0.8469). For the classifier of only dFBB, which reflects conventional FBB reading, RF (ACC: 73.56%, F1: 73.23%, AUC: 0.8336) was the best performing model, followed by NB (ACC: 71.34%, F1: 71.96%, AUC: 0.7350) and LR (ACC: 67.91%, F1: 56.31%, AUC: 0.7809). In comparison among all phases of FBB, the predictive model with dual FBB was the best model, followed by models with dFBB. In addition, the performance of the prediction model with dual FBB was 4.83% higher than that with dFBB. In regional SUVR, RF (ACC: 78.52%, F1: 78.54%, AUC: 0.8456) ranked based on one-way ANOVA p-Value was the best model for dual FBB, followed by NB (ACC: 76.13%, F1: 76.58%, AUC: 0.8486).

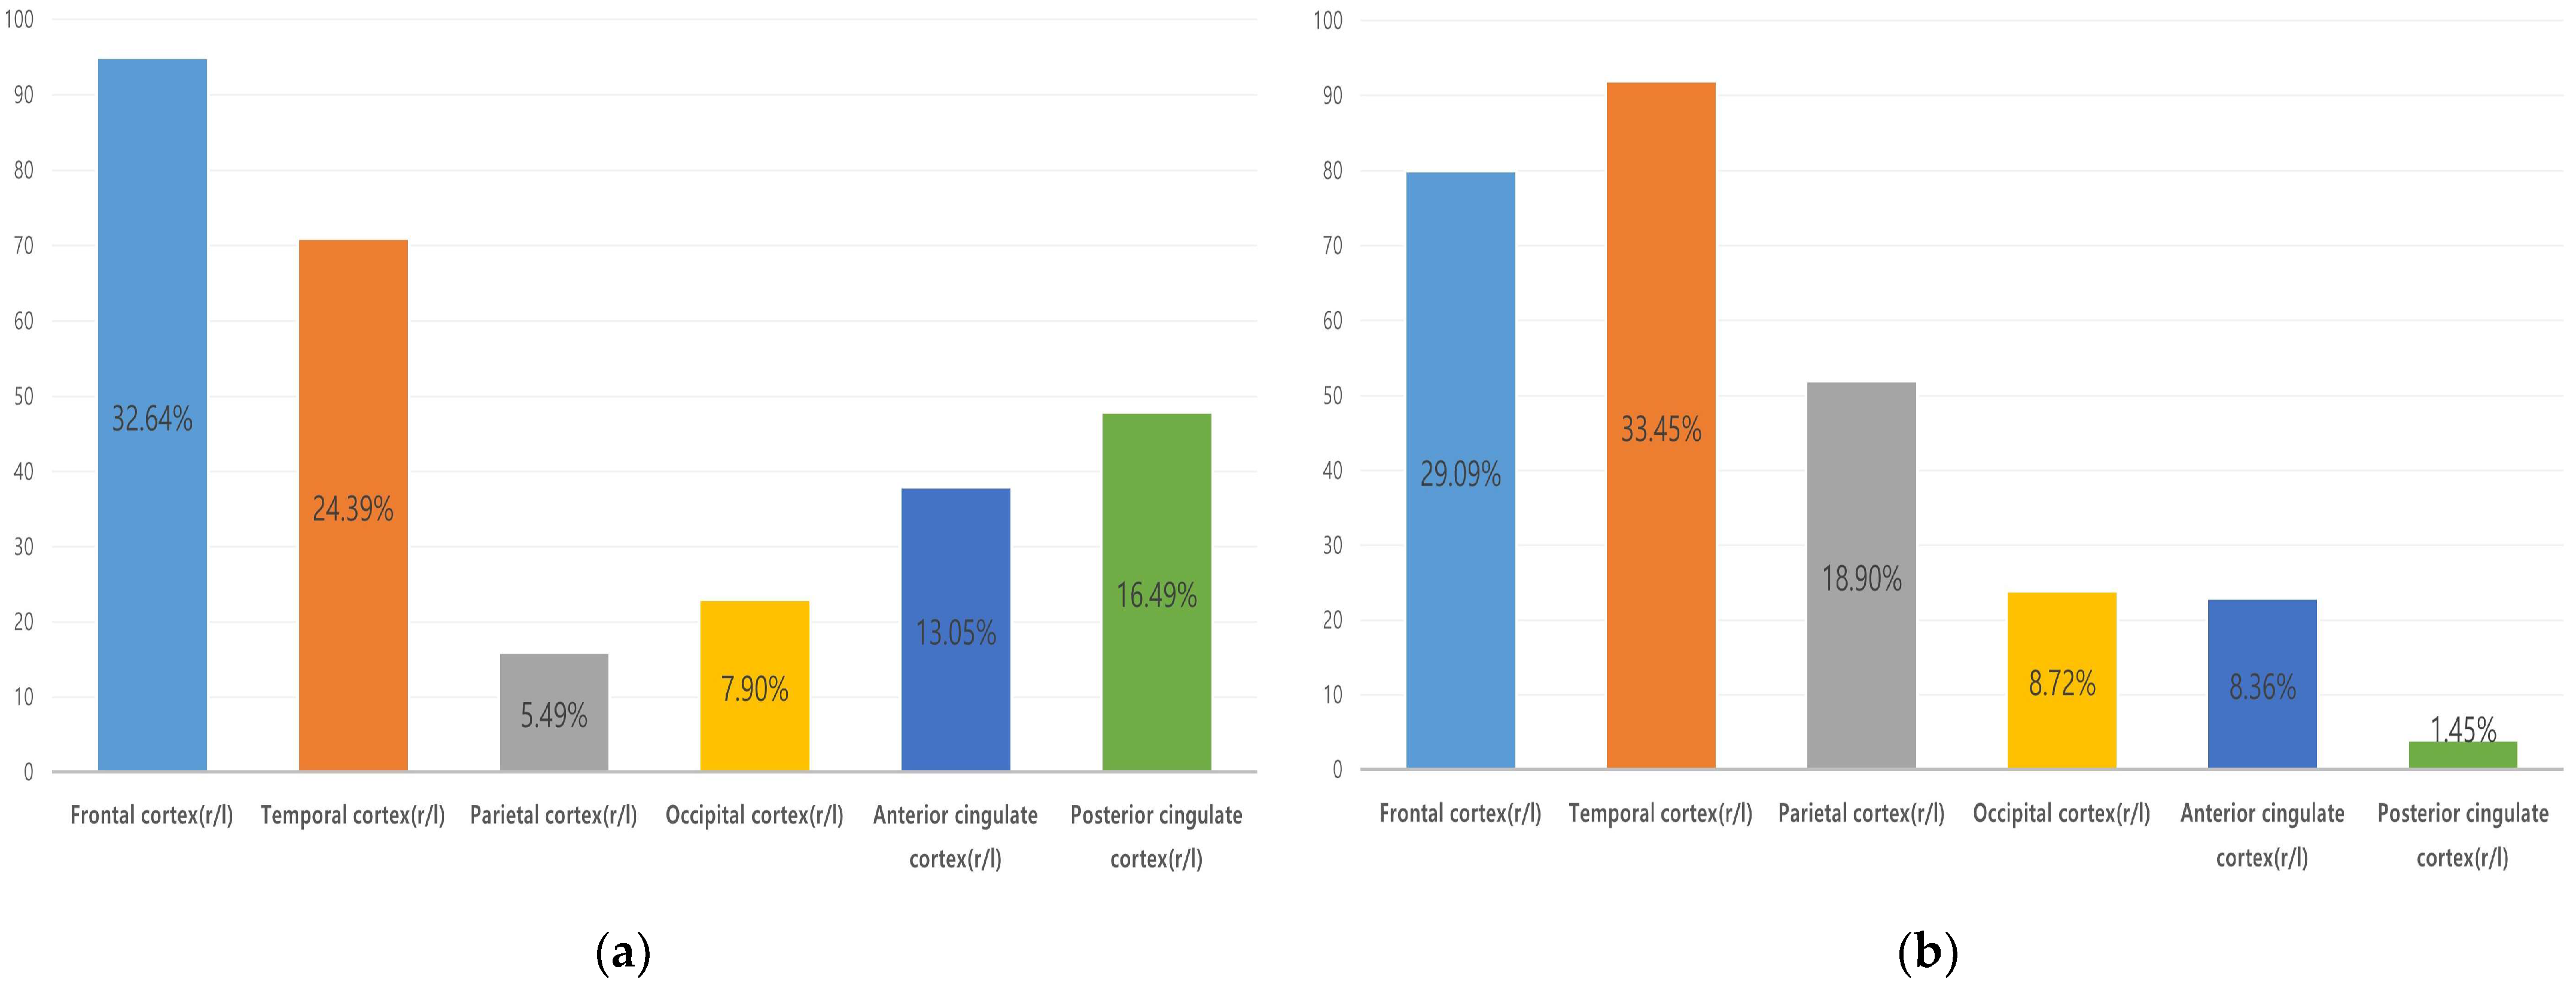
3.2. Frequency-Based Analysis for Feature Selection

We observed the frequency of feature selection ranked based on cross-validated F1 scores. In Figure 5, it can be seen that dFBB has a higher performance than eFBB, and dual FBB has a higher performance than dFBB in both the composite SUVR and regional SUVR. In addition, it can be seen that the performance difference between eFBB, dFBB, and dual FBB is statistically significant. There was no normality in the F1 score distribution; therefore, the Kruskal–Wallis test was used to test for significant differences between the three groups. The three groups were significantly different (p < 0.0001), and it was confirmed through post-hoc testing that there were significant differences between eFBB and dFBB, dFBB and dual FBB, and eFBB and dual FBB.
Table 3 presents the summary statistics from Figure 5. Minimum, maximum, median, mean, and standard deviation (SD) are shown for the F1 score obtained in 100 experiments. In eFBB, the F1 score distribution had a minimum of 33.66%, median of 60.19%, mean of 59.51%, maximum of 78.63%, and SD of 8.4251. In dFBB, the F1 score distribution had a minimum of 40.05%, median of 70.92%, mean of 71.24%, maximum of 82.26%, and SD of 7.9509. In dual FBB, the F1 score distribution had a minimum of 49.89%, median of 78.52%, mean of 78.54%, maximum of 95.70%, and SD of 7.6105. In all statistical values except for SD, the F1 score of dual FBB was higher than that of eFBB and dFBB; eFBB had the highest SD, and dual FBB had the lowest.
From Figure 6 and Table 4, among the six regions constituting the composite SUVR, an influential area for classifying the AD patient group and control group was identified. In the case of the eFBB, the order of regions influencing classification was frontal (32.65%), temporal (24.4%), posterior cingulate (16.49%), anterior cingulate (13.06%), occipital cingulate (7.9%), and parietal (5.5%). In the case of the dFBB, the order of regions influencing classification was temporal (33.45%), frontal (29.09%), parietal (18.91%), and occipital (8.73%), anterior cingulate (8.36%), and posterior cingulate (1.45%).
We compared the execution time taken according to the individual feature evaluation methods. The execution time of one-way ANOVA p-value (23 ms for eFBB, 18 ms for dFBB) was shorter than that of Gini score of RF (322 ms for eFBB, 279 ms for dFBB).
Table 5 and Table 6 list the frequency distributions according to the number of selected features in each phase. In other words, each region from Table 4 was observed in detail. For one selected feature, eFBB showed the largest frequency of frontal region features and dFBB of temporal region features. In the case of two selected features, frontal and temporal region features were the most observed in eFBB and dFBB. In the case of three and four selected features, increased frequencies of the posterior cingulate and anterior cingulate region features were observed in the eFBB, and parietal and occipital region features increased in the dFBB.

4. Discussion

In this study, an ML classification model showed a higher classification performance with dual FBB than with dFBB. This is because eFBB and dFBB have complementary properties as biomarkers [25]. dFBB provides information on amyloid deposition and eFBB provides information on neurodegeneration [5,6,7]. Some patients with AD have at least one important neurodegenerative marker, including reduced FDG metabolism, but no detectable amyloid deposition [26]. Dual FBB is more likely to detect cognitive impairment at follow-up by identifying both markers of amyloid deposition and neurodegeneration [26,27]. In addition, dual FBB has advantages, such as cost savings, reduced radiation exposure, improved convenience for patients and caregivers, and reduced social costs [28].
In this regard, the preceding studies classified using multimodal data are as follows. Grueso et al. (2021) [29] reviewed 116 studies that applied machine learning to neuroimaging data from 2010 to May 2021. In this paper, to predict the progression from MCI to AD, or early prediction, we analyzed the existing classification method based on ML algorithms applied to neuroimaging data together with other variables. Most of the studies used data such as MRI and PET, and multimodal data achieved better classification accuracy than one image. SVM, the most used algorithm, showed an average accuracy of 75.4%, and the average accuracy of the convolutional neural network was 78.5%, which was higher than that of SVM. El-Sappagh et al. (2021) [30] classified AD, MCI, and HC using RF with multimodal data (including MRI images, FDG PET, and cognitive scores). As a result, cross-validation accuracy of 93.95% and F1 score of 93.94% were obtained. Lin et al. (2022) [11] classified subjective cognitive decline (SCD) and HC using SVM for multimodal data including MRI images and genetic information. When only MRI images were classified, the classification accuracy was SCD 79.49% and HC 83.13%, and when classified as multimodal data, the classification accuracy improved to SCD 85.36% and HC 82.52%. Kumari et al. (2022) [31] classified multimodal data including FDG, PiB PET, and cognitive test data using adaptive hyper parameter tuning random forest ensemble classifier. Among the three classes (AD, MCI, and HC), two classes were selected and classified. In the case of binary classification of AD and HC, it showed accuracy of 100%. In the case of binary classification of MCI and HC, it showed accuracy of 91% and specificity of 100%. In the case of binary classification of AD and MCI, it showed accuracy of 95%, specificity of 100%, and sensitivity of 80%.
Recent studies used ML algorithms to classify images of Alzheimer’s dementia, MCI, and HC with very high accuracy. In general, by adding data rather than a single image, it was classified as multimodal data to increase the classification accuracy. When multimodal data is used, classification accuracy increases, but tests for data increase. However, additional tests to obtain multimodal data are costly, time consuming, and delay treatment. Our study uses dual FBB to improve classification performance as if using multimodal data with one test.
In addition, this study evaluated the influence of feature selection of each brain region on classification of eFBB and dFBB. This brain region SUVR constitutes the composite SUVR, and frontal and temporal regions are important when observing early and delayed amyloid regions. The priorities for the remaining regions differed for dFBB and eFBB. This means that eFBB and dFBB have different brain regions of focus. In the eFBB, the posterior cingulate had the third highest influence, but in the dFBB, it had the lowest influence among the six regions. According to previous studies, Aβ accumulation has the greatest effect on the temporal and parietal lobes in dFBB [32].
With the recognition that a single biomarker cannot provide diagnostic certainty when considering comorbidities and potential overlapping pathologies [33] and the increasing availability of medical artificial intelligence, the number of studies using multimodal data has increased [11,12,13]. However, to the best of our knowledge, no study has quantitatively analyzed dual-phase amyloid PET with ML models. Most studies using dual-phase amyloid have confirmed the time range of early amyloid PET, which showed the highest correlation with FDG [5,6,7,34,35,36]. A classification study using dual-phase amyloid confirmed that readers could compare dual-phase amyloid PET and delayed amyloid PET [7]. Therefore, to the best of our knowledge, this paper is the first to classify amyloid PET images through ML using quantitative values of dual FBB images.
The image of each phase was preprocessed so that the feature element represents a specific brain region, and the rank-based cumulative feature search, which evaluates the quality of the feature elements individually, was adopted and applied to the feature subsets representing each phase. That is, in the case of the ANOVA method for individual feature scores, only the main effect of each feature is considered. For dual FBB analysis, the two features were aggregated at the input level so that the classification model could analyze the features of both phases simultaneously. The method used in this study was designed to find subsets by evaluating the quality of individual features and arranging them according to their ranking. Therefore, one limitation of this method is that it does not consider the potential for attributes brought about by textures or nonlinear kernel mapping that appear in a subset of the original features. Therefore, it is considered a suitable method to use with sufficient preprocessing, such as adding interaction effects, and additional feature engineering; the individual features should be sufficiently reviewed by the practitioner.
Computer-aided diagnosis and treatment expert systems using multimodal data have been proposed to manage various chronic diseases owing to the increase in the aging population. Cai et al. provided a detailed summary of how to combine different related knowledge to make an important decision in a multimodal data-driven approach for a smart healthcare system [37]. Multimodal fusion is largely divided into three types: early, medium-term, and late fusion. Early fusion refers to an array of methods that directly combine features before inputting them to a predictive system [38]. This method can train a predictive system using various types of knowledge and can lead to a model that makes comprehensive decisions on multimodal data. In medium-term fusion, the model receives multiple data and individually processes each data point within the model, which is mainly implemented by neural network-based algorithms, and then combines each feature set [39]. Finally, late fusion trains a universal model for each data source and directly integrates all the inferences made by individual models.
In this study, to achieve the task of classifying patient groups from HC, only the early fusion method was considered. In the case of the medium-term fusion method, it is important to create a good latent representation by a neural-network-based model, and to build a reliable model, a sufficient dataset is required. In terms of the advantages of late fusion, it is possible to avoid model complexity and training difficulty owing to higher dimensions in feature-level fusion approaches, combine models without retraining, and scale up easily [40].
In our study, late fusion was not considered because the input features were obtained through sufficient image preprocessing steps, and we expected that those features for each phase would only express the state of each phase for a representative brain region. However, we will consider the medium-term or late fusion method for complex data analysis, such as multiple modalities or imaging data, as well as an additional dataset in future studies.
This study has the following limitations and considerations for future work.
First, the amount of data used in our experiment may be insufficient or biased to generalize the performance of the model. In future research, it will be necessary to secure sufficient samples and separately secure external data or data for verification.
Second, in the feature selection section, we only considered the feature selection algorithm as a filter-based method, especially the feature ranking method, despite many opportunities to use diverse feature selection techniques in medical data analysis [16]. One of the benefits of the feature ranking method is that these methods are independent of the learning algorithm and require less computational time than wrapper methods. We expected that these properties could be used to avoid making our learning model overfitted under a limited number of samples and to observe the significant regions to distinguish the AD patient group from the control group. We could reproduce our experiment with an additional or external dataset.
Third, because only limited information (quantitative analysis result of dual FBB) was used, and the classification was performed using the feature selection method, it is impossible to explain the changes in the brain as a whole. Changes in beta-amyloid deposition appear locally or globally in the cortical areas. In the future, we propose to reduce the time consumption of the quantitative analysis process and analyze the entire brain region by using the brain image of amyloid PET as it is for data analysis. In this study, with sufficient preprocessing steps, we divided cortical regions into several representative compartments to extract hand-created features and attempted to explain how each cortical region contributes to patient classification. However, in reality, changes in beta-amyloid deposition appear locally or globally in the cortical regions. In future studies, we could apply a local explanation method, such as local interpretable model–agnostic explanation [41] or Shapley additive explanation [42], which provides feature information about the classifier behavior for each sample.
Finally, in this study, we performed complex preprocessing steps to extract regional SUVR from dual FBB and applied four representative ML techniques to handcrafted features. Deep learning technology, which has recently been in the spotlight, has achieved excellent results in the field of medical image analysis related to AD by learning the appropriate feature representation for a given task from input data without a feature engineering procedure [43,44,45,46]. As an extension of this study, we will perform an analysis using a convolutional neural network when sufficient data are obtained.
Additionally, we propose a method to analyze multimodal data, including cognitive and movement tests, in dual-phase amyloid PET image data.

5. Conclusions

In this study, using dual FBB had a higher classification accuracy than using dFBB in classifying the AD patient group and control group. In the case of dual FBB, the classification accuracy was highest when RF was used among the ML classification models. The RF achieved accuracy of 78.21% (F1 score: 78.06%, AUC: 0.8724) in the composite SUVR and accuracy of 78.52% (F1 score: 78.54%, AUC: 0.8456) in the regional SUVR. It was confirmed that the frontal and temporal lobes are important areas in the early and delayed amyloid regions. The ratio of the number of features selected was 32.64% for frontal lobe and 24.39% for temporal lobe in eFBB and 33.45% for temporal lobe and 29.09% for frontal lobe in dFBB.
Although ML helps in the quantitative analysis of dual amyloid PET by reducing subjectivity and ambiguity, this study still has limitations. In future studies, it will be necessary to improve the classification accuracy for use in a clinical environment by using multimodal data, including dual imaging data.

Supplementary Materials

The following supporting information can be downloaded at: https://www.mdpi.com/article/10.3390/app12157355/s1, Figure S1: Correlation between early-phase 18F FBB PET SUVR and 18F FDG PET SUVR.

Author Contributions

Conceptualization, H.-J.S. and D.-Y.K.; methodology, H.-J.S., H.Y. and S.K.; software, H.-J.S. and H.Y.; validation, H.-J.S. and H.Y.; formal analysis, H.-J.S., H.Y., D.-Y.K. and S.K.; investigation, H.-J.S. and H.Y.; resources, D.-Y.K. and S.K.; data curation, H.-J.S.; writing—original draft preparation, H.-J.S. and H.Y.; writing—review and editing, S.K. and D.-Y.K.; visualization, H.-J.S. and H.Y.; supervision, S.K. and D.-Y.K.; project administration, S.K. and D.-Y.K.; funding acquisition, S.K. and D.-Y.K. All authors have read and agreed to the published version of the manuscript.

Funding

This research was funded by the National Research Foundation (NRF) of Korea, funded by the Ministry of Science, ICT & Future Planning (NRF-2018 R1A2B2008178).

Institutional Review Board Statement

This study was performed in accordance with the ethical standards laid down in the Helsinki Declaration of 1964 and its later amendments or comparable ethical standards. The research protocol was reviewed and approved by the Institutional Review Committee of Dong-A University Hospital.

Informed Consent Statement

Informed consent was obtained from all individual participants included in this prospective study.

Data Availability Statement

The data used for this study are available upon request from the corresponding author.

Conflicts of Interest

The authors declare no conflict of interest.

References

  1. Nichols, E.; Steinmetz, J.D.; Vollset, S.E.; Fukutaki, K.; Chalek, J.; Abd-Allah, F.; Abdoli, A.; Abualhasan, A.; Abu-Gharbieh, E.; Akram, T.T.; et al. Estimation of the global prevalence of dementia in 2019 and forecasted prevalence in 2050: An analysis for the Global Burden of Disease Study 2019. Lancet Public Health 2022, 7, e105–e125. [Google Scholar] [CrossRef]
  2. Khan, A. An Investigative Study into Alzheimer’s Disease (AD): Development, Pathway and Progression, and Novel Treatment; University of Tennessee: Knoxville, TN, USA, 2022. [Google Scholar]
  3. Ponisio, M.R.; Iranpour, P.; Benzinger, T.L. Amyloid Imaging in Dementia and Neurodegenerative Disease; Hybrid PET/MR Neuroimaging; Springer: Berlin/Heidelberg, Germany, 2022; pp. 99–110. [Google Scholar]
  4. Zhao, X.; Li, C.; Ding, G.; Heng, Y.; Li, A.; Wang, W.; Hou, H.; Wen, J.; Zhang, Y. The Burden of Alzheimer’s Disease Mortality in the United States, 1999–2018. J. Alzheimer’s Dis. 2021, 82, 803–813. [Google Scholar] [CrossRef] [PubMed]
  5. Myoraku, A.; Klein, G.; Landau, S.; Tosun, D. Regional uptakes from early-frame amyloid PET and 18F-FDG PET scans are comparable independent of disease state. Eur. J. Hybrid Imaging 2022, 6, 2. [Google Scholar] [CrossRef] [PubMed]
  6. Albano, D.; Premi, E.; Peli, A.; Camoni, L.; Bertagna, F.; Turrone, R.; Borroni, B.; Calhoun, V.D.; Rodella, C.; Magoni, M. Correlation between brain glucose metabolism (18F-FDG) and cerebral blood flow with amyloid tracers (18F-Florbetapir) in clinical routine: Preliminary evidences. Rev. Española De Med. Nucl. E Imagen Mol. (Engl. Ed.) 2022, 41, 146–152. [Google Scholar] [CrossRef]
  7. Vanhoutte, M.; Landeau, B.; Sherif, S.; de la Sayette, V.; Dautricourt, S.; Abbas, A.; Manrique, A.; Chocat, A.; Chételat, G. Evaluation of the early-phase [18F] AV45 PET as an optimal surrogate of [18F] FDG PET in ageing and Alzheimer’s clinical syndrome. NeuroImage Clin. 2021, 31, 102750. [Google Scholar] [CrossRef]
  8. Massa, F.; Chincarini, A.; Bauckneht, M.; Raffa, S.; Peira, E.; Arnaldi, D.; Pardini, M.; Pagani, M.; Orso, B.; Donegani, M.I. Added value of semiquantitative analysis of brain FDG-PET for the differentiation between MCI-Lewy bodies and MCI due to Alzheimer’s disease. Eur. J. Nucl. Med. Mol. Imaging 2022, 49, 1263–1274. [Google Scholar] [CrossRef]
  9. Arafa, D.A.; Moustafa, H.E.; Ali-Eldin, A.M.; Ali, H.A. Early detection of Alzheimer’s disease based on the state-of-the-art deep learning approach: A comprehensive survey. Multimed. Tools Appl. 2022, 81, 23735–23776. [Google Scholar] [CrossRef]
  10. Stoleru, G.I.; Iftene, A. Prediction of Medical Conditions Using Machine Learning Approaches: Alzheimer’s Case Study. Mathematics 2022, 10, 1767. [Google Scholar] [CrossRef]
  11. Lin, H.; Jiang, J.; Li, Z.; Sheng, C.; Du, W.; Li, X.; Han, Y. Identification of subjective cognitive decline due to Alzheimer’s disease using multimodal MRI combining with machine learning. Cereb. Cortex 2022, bhac084. [Google Scholar] [CrossRef]
  12. Qiu, S.; Miller, M.I.; Joshi, P.S.; Lee, J.C.; Xue, C.; Ni, Y.; Wang, Y.; Anda-Duran, D.; Hwang, P.H.; Cramer, J.A. Multimodal deep learning for Alzheimer’s disease dementia assessment. Nat. Commun. 2022, 13, 3404. [Google Scholar] [CrossRef]
  13. Sharma, S.; Mandal, P.K. A Comprehensive Report on Machine Learning-based Early Detection of Alzheimer’s Disease using Multi-modal Neuroimaging Data. ACM Comput. Surv. (CSUR) 2022, 55, 43. [Google Scholar] [CrossRef]
  14. Yoon, H.J.; Jeong, Y.J.; Kang, D.; Kang, H.; Yeo, K.K.; Jeong, J.E.; Park, K.W.; Choi, G.E.; Ha, S. Effect of Data Augmentation of F-18-Florbetaben Positron-Emission Tomography Images by Using Deep Learning Convolutional Neural Network Architecture for Amyloid Positive Patients. J. Korean Phys. Soc. 2019, 75, 597–604. [Google Scholar] [CrossRef]
  15. Hossin, M.; Sulaiman, M.N. A review on evaluation metrics for data classification evaluations. Int. J. Data Min. Knowl. Manag. Process 2015, 5, 1. [Google Scholar]
  16. Remeseiro, B.; Bolon-Canedo, V. A review of feature selection methods in medical applications. Comput. Biol. Med. 2019, 112, 103375. [Google Scholar] [CrossRef] [PubMed]
  17. Ziegel, E.R.; Girden, E. Anova: Repeated Measures, 1st ed.; SAGE Publications Inc.: Newbury Park, CA, USA, 1993; pp. 10–13. [Google Scholar]
  18. Biau, G.; Scornet, E. A random forest guided tour. Test 2016, 25, 197–227. [Google Scholar] [CrossRef] [Green Version]
  19. Bradley, A.P. The use of the area under the ROC curve in the evaluation of machine learning algorithms. Pattern Recognit. 1997, 30, 1145–1159. [Google Scholar] [CrossRef] [Green Version]
  20. Vapnik, V.N. Support Vector Machine: Statistical Learning Theory, 1st ed.; John Wiley & Sons Inc.: New York, NY, USA, 1998; pp. 401–415. [Google Scholar]
  21. Zhang, H. The optimality of naive Bayes. In Proceedings of the Seventeenth International Florida Artificial Intelligence Research Society Conference, Miami Beach, FL, USA, 17–19 May 2004; Volume 1, p. 3. [Google Scholar]
  22. Fernandes, A.A.T.; Figueiredo, D.B.; Rocha, E.C.d.; Nascimento, W.d.S. Read this paper if you want to learn logistic regression. Rev. De Sociol. E Politica 2021, 28, e006. [Google Scholar] [CrossRef]
  23. Breiman, L. Random forests. Mach. Learn. 2001, 45, 5–32. [Google Scholar] [CrossRef] [Green Version]
  24. Chakravarti, I.M.; Laha, R.G.; Roy, J. Handbook of Methods of Applied Statistics; Wiley Series in Probability and Mathematical Statistics (USA) Eng; Wiley: Hoboken, NJ, USA, 1967. [Google Scholar]
  25. Chételat, G.; Arbizu, J.; Barthel, H.; Garibotto, V.; Law, I.; Morbelli, S.; van de Giessen, E.; Agosta, F.; Barkhof, F.; Brooks, D.J. Amyloid-PET and 18F-FDG-PET in the diagnostic investigation of Alzheimer’s disease and other dementias. Lancet Neurol. 2020, 19, 951–962. [Google Scholar] [CrossRef]
  26. Wirth, M.; Villeneuve, S.; Haase, C.M.; Madison, C.M.; Oh, H.; Landau, S.M.; Rabinovici, G.D.; Jagust, W.J. Associations between Alzheimer disease biomarkers, neurodegeneration, and cognition in cognitively normal older people. JAMA Neurol. 2013, 70, 1512–1519. [Google Scholar] [CrossRef] [Green Version]
  27. Knopman, D.S.; Jack, C.R.; Wiste, H.J.; Weigand, S.D.; Vemuri, P.; Lowe, V.; Kantarci, K.; Gunter, J.L.; Senjem, M.L.; Ivnik, R.J. Short-term clinical outcomes for stages of NIA-AA preclinical Alzheimer disease. Neurology 2012, 78, 1576–1582. [Google Scholar] [CrossRef] [PubMed] [Green Version]
  28. Teipel, S.; Drzezga, A.; Grothe, M.J.; Barthel, H.; Chételat, G.; Schuff, N.; Skudlarski, P.; Cavedo, E.; Frisoni, G.B.; Hoffmann, W. Multimodal imaging in Alzheimer’s disease: Validity and usefulness for early detection. Lancet Neurol. 2015, 14, 1037–1053. [Google Scholar] [CrossRef]
  29. Grueso, S.; Viejo-Sobera, R. Machine learning methods for predicting progression from mild cognitive impairment to Alzheimer’s disease dementia: A systematic review. Alzheimer’s Res. Ther. 2021, 13, 162. [Google Scholar] [CrossRef]
  30. El-Sappagh, S.; Alonso, J.M.; Islam, S.M.; Sultan, A.M.; Kwak, K.S. A multilayer multimodal detection and prediction model based on explainable artificial intelligence for Alzheimer’s disease. Sci. Rep. 2021, 11, 2660. [Google Scholar] [CrossRef] [PubMed]
  31. Kumari, R.; Nigam, A.; Pushkar, S. An efficient combination of quadruple biomarkers in binary classification using ensemble machine learning technique for early onset of Alzheimer disease. Neural Comput. Appl. 2022, 34, 11865–11884. [Google Scholar] [CrossRef]
  32. Kim, J.P.; Kim, J.; Kim, Y.; Moon, S.H.; Park, Y.H.; Yoo, S.; Jang, H.; Kim, H.J.; Na, D.L.; Seo, S.W. Staging and quantification of florbetaben PET images using machine learning: Impact of predicted regional cortical tracer uptake and amyloid stage on clinical outcomes. Eur. J. Nucl. Med. Mol. Imaging 2020, 47, 1971–1983. [Google Scholar] [CrossRef] [Green Version]
  33. Thientunyakit, T.; Shiratori, S.; Ishii, K.; Gelovani, J.G. Molecular PET Imaging in Alzheimer’s Disease. J. Med. Biol. Eng. 2022, 42, 301–317. [Google Scholar] [CrossRef]
  34. Asghar, M.; Hinz, R.; Herholz, K.; Carter, S.F. Dual-phase [18F] florbetapir in frontotemporal dementia. Eur. J. Nucl. Med. Mol. Imaging 2019, 46, 304–311. [Google Scholar] [CrossRef] [Green Version]
  35. Ottoy, J.; Verhaeghe, J.; Niemantsverdriet, E.; De Roeck, E.; Ceyssens, S.; Van Broeckhoven, C.; Engelborghs, S.; Stroobants, S.; Staelens, S. 18F-FDG PET, the early phases and the delivery rate of 18F-AV45 PET as proxies of cerebral blood flow in Alzheimer’s disease: Validation against 15O-H2O PET. Alzheimer’s Dement. 2019, 15, 1172–1182. [Google Scholar] [CrossRef]
  36. Son, S.H.; Kang, K.; Ko, P.; Lee, H.; Lee, S.; Ahn, B.; Lee, J.; Yoon, U.; Jeong, S.Y. Early-phase 18F-florbetaben PET as an alternative modality for 18F-FDG PET. Clin. Nucl. Med. 2020, 45, e8–e14. [Google Scholar] [CrossRef]
  37. Cai, Q.; Wang, H.; Li, Z.; Liu, X. A survey on multimodal data-driven smart healthcare systems: Approaches and applications. IEEE Access 2019, 7, 133583–133599. [Google Scholar] [CrossRef]
  38. Meng, X.; Jiang, R.; Lin, D.; Bustillo, J.; Jones, T.; Chen, J.; Yu, Q.; Du, Y.; Zhang, Y.; Jiang, T. Predicting individualized clinical measures by a generalized prediction framework and multimodal fusion of MRI data. Neuroimage 2017, 145, 218–229. [Google Scholar] [CrossRef] [PubMed] [Green Version]
  39. Shi, J.; Zheng, X.; Li, Y.; Zhang, Q.; Ying, S. Multimodal neuroimaging feature learning with multimodal stacked deep polynomial networks for diagnosis of Alzheimer’s disease. IEEE J. Biomed. Health Inform. 2017, 22, 173–183. [Google Scholar] [CrossRef]
  40. Wu, L.; Oviatt, S.L.; Cohen, P.R. Multimodal integration-a statistical view. IEEE Trans. Multimed. 1999, 1, 334–341. [Google Scholar]
  41. Ribeiro, M.T.; Singh, S.; Guestrin, C. “Why should I trust you?” Explaining the predictions of any classifier. In Proceedings of the 22nd ACM SIGKDD International Conference on Knowledge Discovery and Data Mining, San Francisco, CA, USA, 13–17 August 2016; pp. 1135–1144. [Google Scholar]
  42. Lundberg, S.M.; Lee, S. A unified approach to interpreting model predictions. Adv. Neural Inf. Process. Syst. 2017, 30, 4768–4777. [Google Scholar]
  43. Jo, T.; Nho, K.; Saykin, A.J. Deep learning in Alzheimer’s disease: Diagnostic classification and prognostic prediction using neuroimaging data. Front. Aging Neurosci. 2019, 11, 220. [Google Scholar] [CrossRef] [Green Version]
  44. Liu, J.; Li, M.; Luo, Y.; Yang, S.; Li, W.; Bi, Y. Alzheimer’s disease detection using depthwise separable convolutional neural networks. Comput. Methods Programs Biomed. 2021, 203, 106032. [Google Scholar] [CrossRef]
  45. López-Sanz, D.; Bruña, R.; Delgado-Losada, M.L.; López-Higes, R.; Marcos-Dolado, A.; Maestú, F.; Walter, S. Electrophysiological brain signatures for the classification of subjective cognitive decline: Towards an individual detection in the preclinical stages of dementia. Alzheimer’s Res. Ther. 2019, 11, 49. [Google Scholar] [CrossRef]
  46. Zhang, L.; Xie, D.; Li, Y.; Camargo, A.; Song, D.; Lu, T.; Jeudy, J.; Dreizin, D.; Melhem, E.R.; Wang, Z. Improving Sensitivity of Arterial Spin Labeling Perfusion MRI in Alzheimer’s Disease Using Transfer Learning of Deep Learning-Based ASL Denoising. J. Magn. Reson. Imaging 2022, 55, 1710–1722. [Google Scholar] [CrossRef]
Figure 1. Selection of subjects. MCI: mild cognitive impairment, HC: healthy control, AD: Alzheimer’s disease.
Applsci 12 07355 g001
Figure 2. Dual-phase FBB images of subjects. The time range for dFBB is 90–110 min, and the time range for eFBB is 1.5–6 min. (a) eFBB image of Alzheimer’s dementia. (b) eFBB image of MCI. (c) eFBB image of HC. (d) dFBB image of Alzheimer’s dementia. (e) dFBB image of MCI. (f) dFBB image of HC. eFBB: early-phase FBB, dFBB: delay-phase FBB, dual FBB: dual-phase FBB, MCI: mild cognitive impairment, HC: healthy control.
Applsci 12 07355 g002
Figure 3. Brain region map.
Applsci 12 07355 g003
Figure 4. Overview of the proposed framework to make the feasibility of AD classification with dual FBB. eFBB: early-phase FBB, dFBB: delay-phase FBB, dual FBB: dual-phase FBB, CV: cross validation, F e , i : best feature combination of eFBB, F d , j : best feature combination of dFBB. F e , i and F d , j are used to filter raw data, and the filtered data are used as independent variables for predictive models in the model selection and evaluation.
Applsci 12 07355 g004
Figure 5. Boxplot of F1 score: (a) F1 score boxplot of composite SUVR experiment and (b) F1 score boxplot of regional SUVR experiment. F1: F1 score, * indicates the result of the Kruskal–Wallis test and post-hoc analysis to evaluate superiority, significant at p < 0.0001.
Applsci 12 07355 g005
Figure 6. Histogram of frequency-based analysis: (a) distribution of eFBB and (b) distribution of dFBB. eFBB: early-phase FBB, dFBB: delay-phase FBB.
Applsci 12 07355 g006
Table 1. Subject characteristics.
AD Patient GroupControl Group
Alzheimer’s
Dementia
MCIHC
Subjects373737
M/F14/2314/2314/23
Average Age (range)66.59 (51–81)66.43 (44–83)66.32 (37–80)
BAPL 1/2/39/7/2121/4/1235/2/0
Amyloid +/−28/916/212/35
MCI: mild cognitive impairment, HC: healthy control, BAPL: beta-amyloid plaque load, AD: Alzheimer’s disease, M/F: Male/Female.
Table 2. Comparison of classification performance of models according to each phase of FBB.
eFBBdFBBDual FBB
AccuracyF1 ScoreAUCAccuracyF1 ScoreAUCAccuracyF1 ScoreAUC
Composite SUVR performance
SVM67.0453.83%0.542366.78%54.10%0.708070.65%64.97%0.8415
RF58.39%53.98%0.644473.56%73.23%0.833678.21%78.06%0.8724
LR66.91%55.87%0.735167.91%56.31%0.780972.91%65.56%0.8478
NB66.52%63.27%0.716471.34%71.96%0.735076.08%76.52%0.8469
Regional SUVR performance
SVM (A.p)66.47%53.76%0.570166.47%61.80%0.787471.17%70.21%0.8223
SVM (F.i)65.91%53.57%0.547566.60%61.83%0.789270.86%69.55%0.8223
RF (A.p)61.52%59.51%0.659271.00%71.24%0.804078.52%78.54%0.8456
RF (F.i)59.95%57.92%0.658269.82%70.10%0.786176.82%76.76%0.8440
LR (A.p)65.39%56.95%0.701564.91%62.04%0.786572.60%70.73%0.8399
LR (F.i)65.60%56.61%0.712464.86%61.57%0.790972.65%70.74%0.8383
NB (A.p)63.34%63.43%0.681171.95%72.47%0.794476.13%76.58%0.8486
NB (F.i)64.69%65.10%0.695872.56%73.07%0.792776.13%76.58%0.8476
eFBB: early-phase FBB, dFBB: delay-phase FBB, dual FBB: dual-phase FBB, SVM: support vector machine, RF: random forest, LR: logistic regression, NB: naïve Bayes, AUC: area under the curve, A.p: feature of the rank based on one-way ANOVA F-test p-value, F.i: feature of the rank based on Gini score by random forest.
Table 3. Summary statistics of Figure 5.
MinMedianMeanMaxSD
eFBB33.66%60.19%59.51%78.63%8.4251
dFBB40.05%70.92%71.24%87.26%7.9509
dual FBB49.89%78.52%78.54%95.70%7.6105
eFBB: early-phase FBB, dFBB: delay-phase FBB, dual FBB: dual-phase FBB, SD: standard deviation.
Table 4. Simple and relative frequency distribution for feature selection in multiple training runs.
FrontalTemporalParietalOccipitalAnterior CingulatePosterior Cingulate
eFBBNumber of features957116233848
Ratio (%)32.64%24.39%5.49%7.90% 13.05%16.49%
dFBBNumber of features80925224234
Ratio (%)29.09%33.45%18.90%8.72%8.36%1.45%
eFBB: early-phase FBB, dFBB: delay-phase FBB.
Table 5. Frequency distribution according to the number of selected features in a single FBB.
Features123456All
Region
Frequency distribution by the number of featuresof eFBB
Frontal182913188995
Temporal02510198971
Parietal02113916
Occipital00257923
Anterior cingulate124157938
Posterior cingulate149187948
Frequency distribution by the number of features of dFBB
Frontal71827168480
Temporal162127168492
Parietal0321168452
Occipital001118424
Anterior cingulate10558423
Posterior cingulate0000044
eFBB: early-phase FBB, dFBB: delay-phase FBB, k feature: frequency distribution for regions with k optimal features in the experiment (k = 1, 2, …, 6).
Table 6. Frequency distribution according to the number of selected features in dual FBB.
Features 234567891011All
Region
Frequency distribution by the number of features of eFBB
Frontal21115201812754195
Temporal076151511754171
Parietal008023333016
Occipital008135434123
Anterior cingulate004776634138
Posterior cingulate02371110644148
Frequency distribution by the number of features of dFBB
Frontal1613171710654180
Temporal1716211713754192
Parietal00612109554152
Occipital001364342124
Anterior cingulate000726133123
Posterior cingulate00000210014
eFBB: early-phase FBB, dFBB: delay-phase FBB, dual FBB: dual-phase FBB, k feature: frequency distribution for regions with k optimal features in the experiment (k = 2, 3, …, 11).
Publisher’s Note: MDPI stays neutral with regard to jurisdictional claims in published maps and institutional affiliations.

