Article

Random Vibration Fatigue Life Analysis of Airborne Electrical Control Box

College of Aerospace Engineering, Shenyang Aerospace University, Shenyang 110136, China
*
Author to whom correspondence should be addressed.
Appl. Sci. 2022, 12(14), 7335; https://doi.org/10.3390/app12147335
Submission received: 25 June 2022 / Revised: 14 July 2022 / Accepted: 19 July 2022 / Published: 21 July 2022
(This article belongs to the Special Issue Machine Diagnostics and Vibration Analysis)

Abstract

:
To study the influence of random vibration on the fatigue life of airborne equipment, an aircraft electrical control box was selected as the research object. First, finite element software was used to model the dynamics of the airborne electrical control box to investigate its mode frequencies. The accuracy of finite element simulations was verified by performing mode experiments. Second, the mode superposition method was used to analyze the flight direction (X axis), side direction (Y axis), and altitude direction (Z axis) random vibration responses of the electrical control box. The analysis results were combined with the Miner linear cumulative damage criterion and the Gaussian-distribution Steinberg method to estimate the fatigue life of the electrical control box in the three directions. Finally, the calculation results were verified by performing the random vibration durability test on the electrical control box. The finite element mode analysis results show good agreement with the vibration experiment results, and the maximum error is 13.4%, indicating that the finite element model established in this paper is acceptable. The fatigue life of the electrical control box in the three axes meets the user requirements, and random vibration along the side direction (Y axis) has the greatest impact on the fatigue life, which is consistent with the results of the actual experimental data. The research method can be extended to predict the fatigue life of other airborne equipment and thus has practical significance for structural design and reliability analysis of airborne equipment.

1. Introduction

An aircraft is subjected to complex and volatile aerodynamic loads, engine loads, and inertial loads during flight. The vibration caused by the complex mechanical setup is mostly random in nature. The long-term effect of load leads to the fatigue failure of airborne equipment. This phenomenon is more pronounced when the vibration frequency of the aircraft and airborne equipment overlap. Therefore, the fatigue problem of structural vibration of airborne equipment has received increased attention in recent years.
The stability and safety of aircraft flight depend to a certain extent on the reliability of airborne equipment. Accurate evaluation of random vibration of airborne equipment is one of the key steps to ensure its normal operation. Random vibration is the motion of a structure excited by a random input. The mathematical theory of random vibration is used for the realistic modeling of structural dynamic systems [1]. By using a group of 7075-T651 aluminum alloy specimens, Wu et al. [2] studied the practicability of the fatigue damage and fatigue life estimation method under random load and verified the method by performing a series of low-cycle fatigue tests. An effective strain damage (ESD) model has been proposed to predict the fatigue life under random load. Tovo [3] proposed a rain flow damage assessment method in the frequency-domain by performing an extensive literature review. For the analytical solution of the expected damage, in addition to the calculation program, an exact approximate solution of fatigue damage under Gaussian load has been developed. Nieslony et al. [4] proposed a spectrum estimation method for estimating the fatigue life considering the high-cycle fatigue state. By using the model proposed by Miles and Dirlik [5] as an example, two types of multi-axial fatigue failure criteria were established, and the two groups of test data were compared with the calculation data. Under multi-axial random loading, when the appropriate failure criterion is selected, the calculated fatigue life exhibits a good correlation with the test results. Marques JME et al. [6] presents a new algorithm to implement the Carpinteri–Spagnoli–Vantadori (CSV) multiaxial fatigue criterion for random loading. By calculating the exact expressions of stress spectral moments in every rotated plane, the maximum variance and expected maximum peak of normal/shear stress can be calculated directly, thus shortening the calculation time. Jun et al. [7] proposed an approximate fatigue damage model based on the Gaussian broad-band model by using data processing, time analysis, regression analysis, and other methods. This method summarizes four probability density functions and introduces correction factors. The experimental results showed that the results obtained using this method are very close to those obtained using the rain flow method.
Zhang et al. [8] established an accurate parametric finite element model and obtained mode frequencies and shapes by solving dynamics equations of aviation airborne equipment. Li et al. [9] proposed an algorithm that integrates Karhunen–Loeve expansion (KLE) and finite element method (FEM) to perform the random vibration analysis of complex dynamic systems excited by stationary or non-stationary random processes. Zhang et al. [10] proposed a method combining random vibration spectrum analysis, dynamic strength reliability theory, and sensitivity analysis. The dynamic strength reliability and parameter sensitivity of the aircraft fuel pipeline system are analyzed using this method. This method can also be used for the dynamic strength reliability evaluation of engineering structures.
In this study, the fatigue life of an electrical control box on an aircraft under random excitation was investigated. First, the finite element method was used to analyze the random vibration response of the electrical control box. Second, the fatigue life of the electrical control box was estimated using the Gaussian-distribution Steinberg method and Miner linear cumulative damage theory. Finally, the rationality of the analysis method was verified using the random vibration durability test.

2. Basic Theory and Solution Method

The fatigue analysis approach of random vibration can be divided into time-domain and frequency-domain approaches. In the time-domain approach, uses a technique called rainflow cycle counting to decompose a variable amplitude time signal of stress into fatigue cycles, and then calculate the fatigue life combined with the stress-life (S-N) curve of the material. A large amount of storage space is used for the processing and calculation time-domain signals in the finite element analysis. This is not convenient for engineering applications.
The frequency-domain approach is established on the power spectral density (PSD) of stress. It is easy to calculate and has strong engineering applicability. The variance, amplitude probability distribution and peak frequency of random stress signal can be obtained by PSD function, and then the cumulative damage can be calculated. Therefore, in this study, the frequency-domain method was used.

2.1. Linear Cumulative Damage Theory

According to the fatigue cumulative damage theory, the cyclic action of the load causes structural fatigue damage. The fatigue damage under different stress amplitudes is affected by the number of cycles under this amplitude and the total number of cycles.
Miner theory [11] holds that the fatigue damage of the structure is independent of each other under various stresses, and the total damage can be obtained by the linear superposition of independent fatigue damage. According to the linear cumulative damage theory, the cumulative fatigue damage of components under multiple load cycles can be expressed as follows:
D = 0 n s N s d s
where ns is the number of cycles when the stress amplitude is s and can be expressed by the probability density function p(s) of the stress amplitude. The number of failure cycles Ns with stress amplitude s can be determined using the S-N curve equation:
n s = E p · p s · T
s m · N s = C
where E(p) is the expected peak frequency of the random stress response signal, T is the action time of the random response, and m and c are the S-N curve constants related to the characteristics of structural materials.
By substituting Equations (2) and (3) into Equation (1), the linear fatigue cumulative damage equation is obtained:
D = E p T C 0 s m p s d s
When the cumulative damage of the cycle reaches the structural fatigue damage threshold D under various stress levels, the structure will suffer from fatigue failure. Numerous random vibration fatigue tests in engineering applications have demonstrated that the fatigue threshold set by the Miner fatigue criterion is close to 1. The formula is simple in principle and can provide an acceptable accuracy range for engineering applications.

2.2. Frequency-Domain Analysis

The steps involved in the frequency-domain analysis are as follows (Figure 1):
(1)
Determining random time-domain waveforms of stress/strain at structural specific positions by testing.
(2)
Determining the frequency-domain curve by Fourier transform for time-domain waveforms and analyzing the load PSD.
(3)
Establishing the frequency-domain fatigue model.
(4)
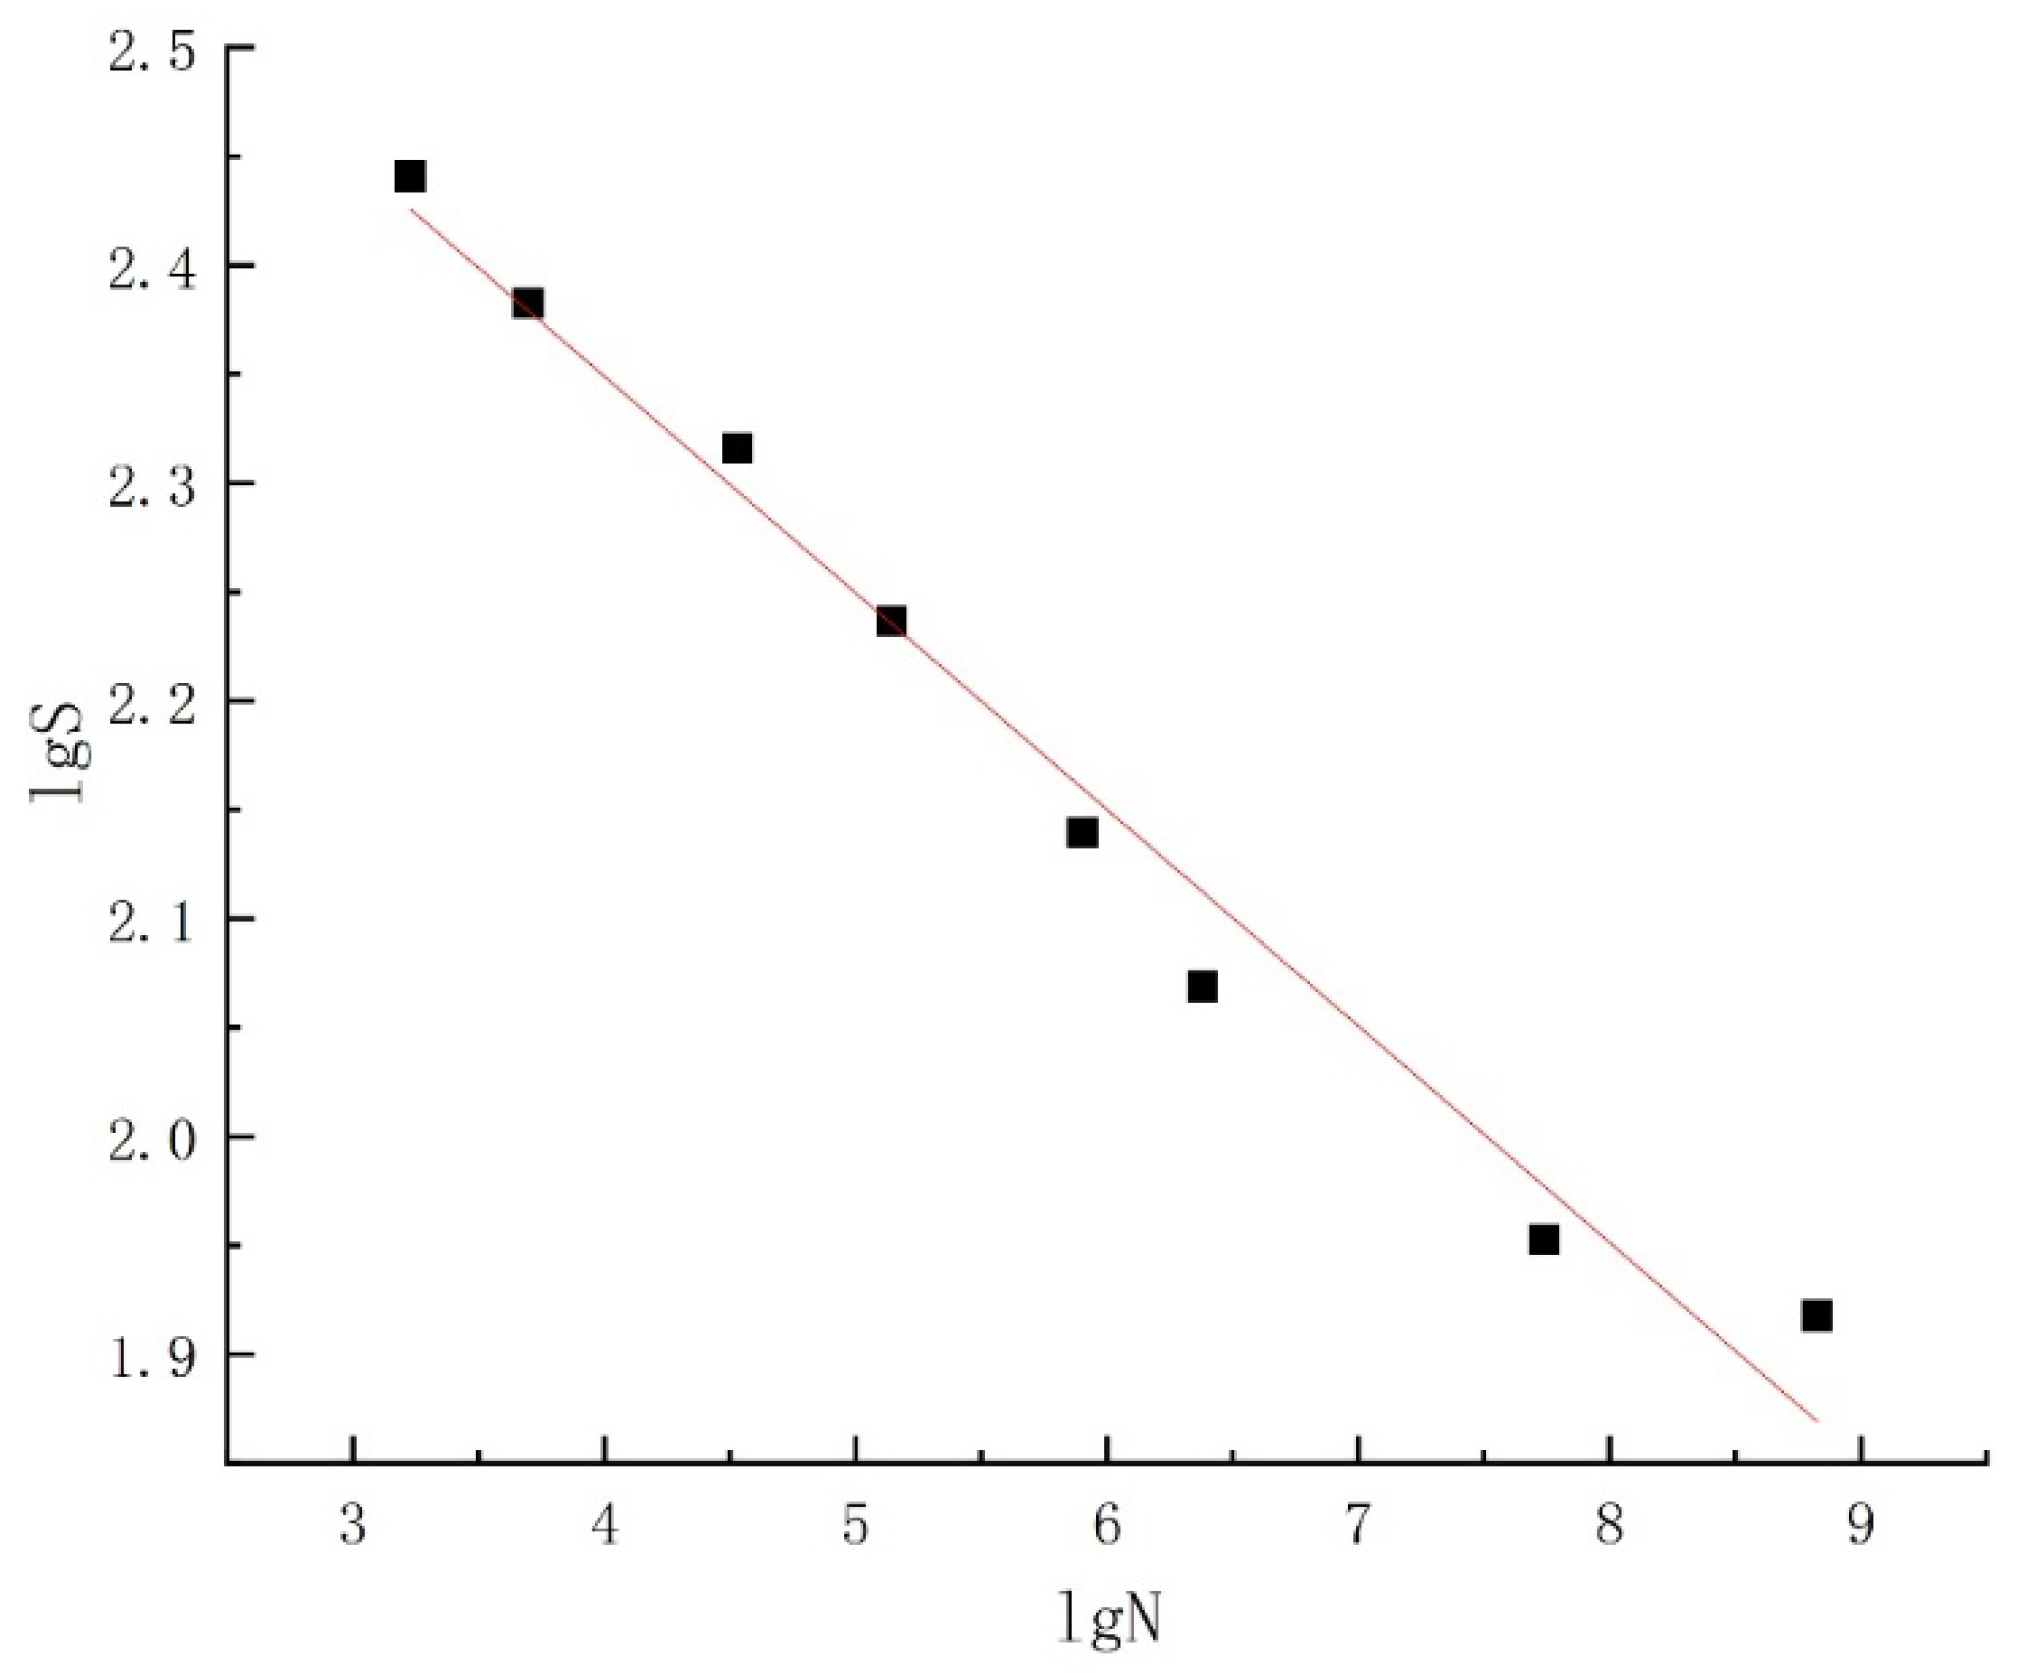
Obtaining the S-N curve of the material by consulting literatures.
(5)
Calculating the structural fatigue life based on the Miner linear cumulative damage criterion.
The frequency-domain analysis method of the PSD function can be divided into narrow-band and broad-band methods.
Figure 1. Frequency-domain analysis.
Applsci 12 07335 g001

2.2.1. Narrow-Band Method

Bendat [12] proposed a classical narrow-band method. When the effective bandwidth ε < 0.3–0.35, the random process can be regarded as a narrow-band process. The peak and amplitude of the stress cycle response are assumed to be equal; that is, the mean value of the stress cycle is usually close to zero. The peak probability density function of the narrow-band response random process can be expressed as follows:
p s N B = S σ 2 e x p ( S 2 2 σ 2 )
where σ2 is the variance of the random process and s is the stress.
From Equations (4) and (5), the fatigue cumulative damage formula of narrow-band method can be obtained:
D N B = E p T C σ 2 m Γ 1 + m 2
where Γ(x) is a gamma function that is usually defined as:
Γ x = 0 y x 1 e x p y d y
The peak frequency is similar to the zero-crossing frequency; thus, it is assumed that E(p) = f0 is the center frequency of the narrow-band peak.

2.2.2. Broad-Band Method

In the broad-band random process, due to the large difference between peak frequency and crossing frequency in unit time. If the traditional narrow-band method is still used to calculate the fatigue damage will make the result larger. Therefore, Wirsching [13] introduced the correction factor λ to compensate the calculation results of narrow-band process fatigue damage by using the approximate narrow-band method. When the correction factor λ is substituted into Equation (6), the fatigue damage formula for the broad-band stationary process is obtained:
D W = λ f 0 T C σ 2 m Γ 1 + m 2
where correction factor λ is a function of exponent m of the effective bandwidth ε and S-N curve:
λ = 0.962 0.033 m + 0.074 + 0.033 m 1 ε 1.587 m 2.323
The irregular factor γ varies between 0 and 1. When the stress signal approaches the narrow band process (sine wave γ = 1), it approaches 1. When the stress signal is close to the white noise process, it is close to 0.
ε = 1 γ 2
The n-order spectral moment of the stress power spectral density S(f) can be expressed as follows:
m n = 0 f n · S f d f
γ = m 2 m 0 m 4

2.3. Steinberg Method

Generally, the stress amplitude and average stress of the random response vary randomly. Steinberg [14] proposed a three-interval method based on Gaussian-distribution and Miner linear cumulative damage theory to analyze the fatigue life from the perspective of probability. The stress can be divided into three ranges in terms of probability, as shown in Figure 2 and Table 1.
Most of the time, the stress is (−1σ, +1σ), and the probability is 68.3%. Outside (−3σ, +3σ), the probability is 0.27%, which is very small. Thus, the time greater than 3σ will cause almost no damage to the structure. Therefore, the overall fatigue damage can be simplified from Equation (1) to Equation (13) by using the Miner linear cumulative damage theory:
D = n 1 σ N 1 σ + n 2 σ N 2 σ + n 3 σ N 3 σ = 0.6831 V a + T N 1 σ + 0.271 V a + T N 2 σ + 0.0433 V a + T N 3 σ
When D = 1, the fatigue life of structural components can be expressed as follows:
T = 1 V a + 0.6831 N 1 σ + 0.271 N 2 σ + 0.0433 N 3 σ
Fatigue damage to structural components when D ≥ 1. N is the number of cycles under the iσ stress value obtained according to the S-N curve (i = 1, 2, 3).

3. Finite Element Modeling and Analysis

The finite element model of the electric control box was established using the ANSYS Workbench 2020 R1, and the fatigue life analysis was performed. The analysis process is showed in Figure 3.

3.1. Model Description of The Electrical Control Box

The electrical control box was installed on the aircraft by using lugs and bolts (Figure 4). To facilitate the preprocessing for model simplification, meshing, and element definition, the 3D model of the electrical control box was established using CATIA.

3.2. Model Simplification

The airborne equipment was designed to meet the requirements of machining and assembly. To obtain accurate analysis results, we ensured that the load transmission path did not change, the connections of the parts were consistent with the actual situation, and the integrity of the main structure was not compromised [15]. Accordingly, the following simplifications were performed before modeling.
(1)
Treatment of transition fillets: Too many fillets lead to the generation of a complex mesh and increase the amount of meaningless computation. Therefore, the circular angle that exists in the non-stress concentration region and the radius r 3   mm was directly ignored, and the circular angle that affects the analysis results in the stress concentration region was retained. When the fillet radius was 3   mm < r 8   mm , the transition was divided by a row of grids. The transition was divided by two rows of grids when the fillet radius was 8   mm < r 15   mm .
(2)
Treatment of holes: Excessive perforation of the structure leads to uneven meshing and stress concentration which not only increases the amount of calculation but may also lead to divergence of simulation results. Thus, the non-installed hole with a radius of r 2   mm was ignored, and the hole was located in the stress concentration area left behind. When the radius of the hole was 2   mm < r 3   mm , the tetrahedral mesh with a central node was used.
(3)
Simplification of the bolt connection: The bolt connection is the main fixation way employed for the electrical control box and the aircraft body. The screw thread structure is complex, and the bolt model exhibits a cumbersome nonlinear contact problem, which does not reflect the load and load transmission form of the main structure and results in excessive calculation time. Therefore, the bolt connection was simulated using a common node with the connector.
By using the aforementioned methods, under the premise of satisfying the calculation and analysis accuracy, the simplified electrical control box model was obtained to improve the modeling efficiency.

3.3. Finite Element Modeling

For the simplified electric control box, considering the complex geometry of the front and lower panels and the uneven thickness of the component, the solid element was used to discretize the component model, and the tetrahedral mesh with good adaptability was selected. The unit size was 2 mm. Because the upper cover was fabricated using the stamping process, the thickness was much less than the size in the other two directions, so the shell element is used for discrete. To study the strength and stiffness of the shell structure of the electric control box by performing random vibration analysis, the mass element used for the light electronic circuit board in the box was simplified. The finite element model established in this study is depicted in Figure 5.
Tetrahedral and shell elements with intermediate nodes were adopted in the model, with a total of 71,410 nodes and 142,873 elements. The electrical control box housing was made of PA6 (upper cover) and 7075 aluminum alloy (fixed base plate), and the mechanical properties are presented in Table 2.

4. Random Response Analysis

4.1. Finite Element Modeling

In the actual working process of the electric control box, the bottom of the box is in a constraint state. Therefore, four fixed holes at the bottom of the box were constrained in the mode analysis, as shown in Figure 6.
The finite element software was used to perform a constrained mode analysis on the electrical control box. The calculations revealed that the structure has 42 natural frequencies in the experimental frequency-domain (20–2000 Hz). Among them, the first and last natural frequencies are 251.5 and 1987.6 Hz, respectively. The frequencies of the first 10 modes were selected, as shown in Table 3.
The first 10 mode shapes are shown in Figure 7.

4.2. Mode Frequency Testing

The experimental setup included sensors, a vibration test bench, and a control and acquisition system. The natural frequency test of the electrical control box was performed using the MPA409/M437A high-thrust high-frequency electrodynamic vibration table (ETS Solutions Ltd., Beijing, China) and the LMS Test Lab 14A software (Siemens, Munich, Germany). The details of the experimental equipment and the site are presented in Table 4 and Figure 8.
Using the finite element calculation results, the acceleration sensors were affixed to the maximum displacement positions of each mode, and the first 10 order natural frequencies were measured and compared with the finite element results. The comparison results are shown in Figure 9.
The first 10 natural frequencies obtained by finite element calculation exhibited good agreement with the test results (Figure 9), and the maximum relative error was 13.4%, which meets the requirements of engineering calculation, thereby indicating that the finite element model can be used for random response and fatigue life analysis.

4.3. Random Response Analysis

By using the finite element software and mode superposition method, the random vibration response of the electric control box was analyzed based on mode analysis.
The boundary conditions were not changed during the calculation. The applied random load spectrum is shown in Figure 10; the abscissa f represents the frequency (Hz), and the ordinate Wf represents the acceleration PSD (g2/Hz). The loading was performed in the X, Y, and Z directions. The calculated total acceleration root mean square ( G R M S i n ) was 8.42 g.
Figure 11 shows the equivalent stress change of the electrical control box at the dangerous point in the X, Y, and Z directions; in the figure, the abscissa is the frequency, and the ordinate is the stress. The second-order mode in the X direction, the fourth-order mode in the Y direction, and the third-order mode in the Z direction exhibited the maximum stress, and the corresponding mode frequencies were f X = 258.3 Hz, f Y = 377.7 Hz, and f Z = 309.8 Hz, respectively.
During the actual flight, random vibrations may cause the local equivalent stress of the component to be too large and may result in the premature plastic deformation of the component and fatigue failure during service. For the electrical control box, when the vibration frequency is 250–400 Hz, the stress is large; thus, this frequency range should be avoided during its operation.

5. Fatigue Life Analysis

5.1. Material Fatigue Life Curve of the Electrical Control Box

The main material of the electrical control box is 7075 aviation aluminum alloy. According to the multi-axial fatigue test in Ref. [16], the American material test standard ASTM E2077 [17] was adopted. The fatigue test data are presented in Table 5 for the stress concentration factor Kt = 2.4 and stress ratio R = −1.
According to the experimental data, the S-N curve equation was obtained using the curve fitting method as follows:
l g N = 20.62 7.11 l g S
From Equation (15), the lgS-lgN curve of the material was obtained, as shown in Figure 12.

5.2. Fatigue Life Analysis of the Electrical Control Box

The equivalent stress of the dangerous point of the electric control box as determined through random vibration response analysis is shown in Figure 13; the confidence interval and confidence level of the stress are presented in Table 6.
Based on the GJB150.16A-2009 [18] standard, simulation was carried out of long-life random vibration fatigue test. The total fatigue damage of the structure under random excitation load of 1.5 h (0.5 h in each direction) in X, Y, and Z directions was investigated. By using the Miner linear cumulative damage criterion and fatigue life Steinberg method, the fatigue life of the electric control box was estimated by substituting the stress of the dangerous point into Equation (15). The data [19] for the working environment of the electrical control box revealed that the average frequency of random vibration V a + = 18 Hz and vibration time T = 1.8 × 10⁴ s. The cumulative damage was calculated using Equation (13).
The results of the random vibration fatigue life analysis of the electrical control box are shown in Table 7. Its structural fatigue life is much higher than the 1.5 h required by GJB150.16A-2009 standard, and the total damage of the electrical control box is less than 1, indicating that the structural fatigue resistance of the electrical control box meets the design requirements. The vibration in the Y direction has the greatest influence on the fatigue life of the electric control box, followed by that in the Z and X directions. In the product design stage, attention must be paid to the strength of the maximum stress position of the electrical control box, such as the rear floor and the upper floor fixed bolts, to improve the fatigue strength of the electrical control box.

6. Random Vibration Test

6.1. Experimental Procedures

The vibration test fixture in X, Y and Z directions of the electrical control box were de-signed and manufactured based on GJB150.16 A-2009 standard before the test, and in-stalled on the vibration test bench, as shown in Figure 14.
(1)
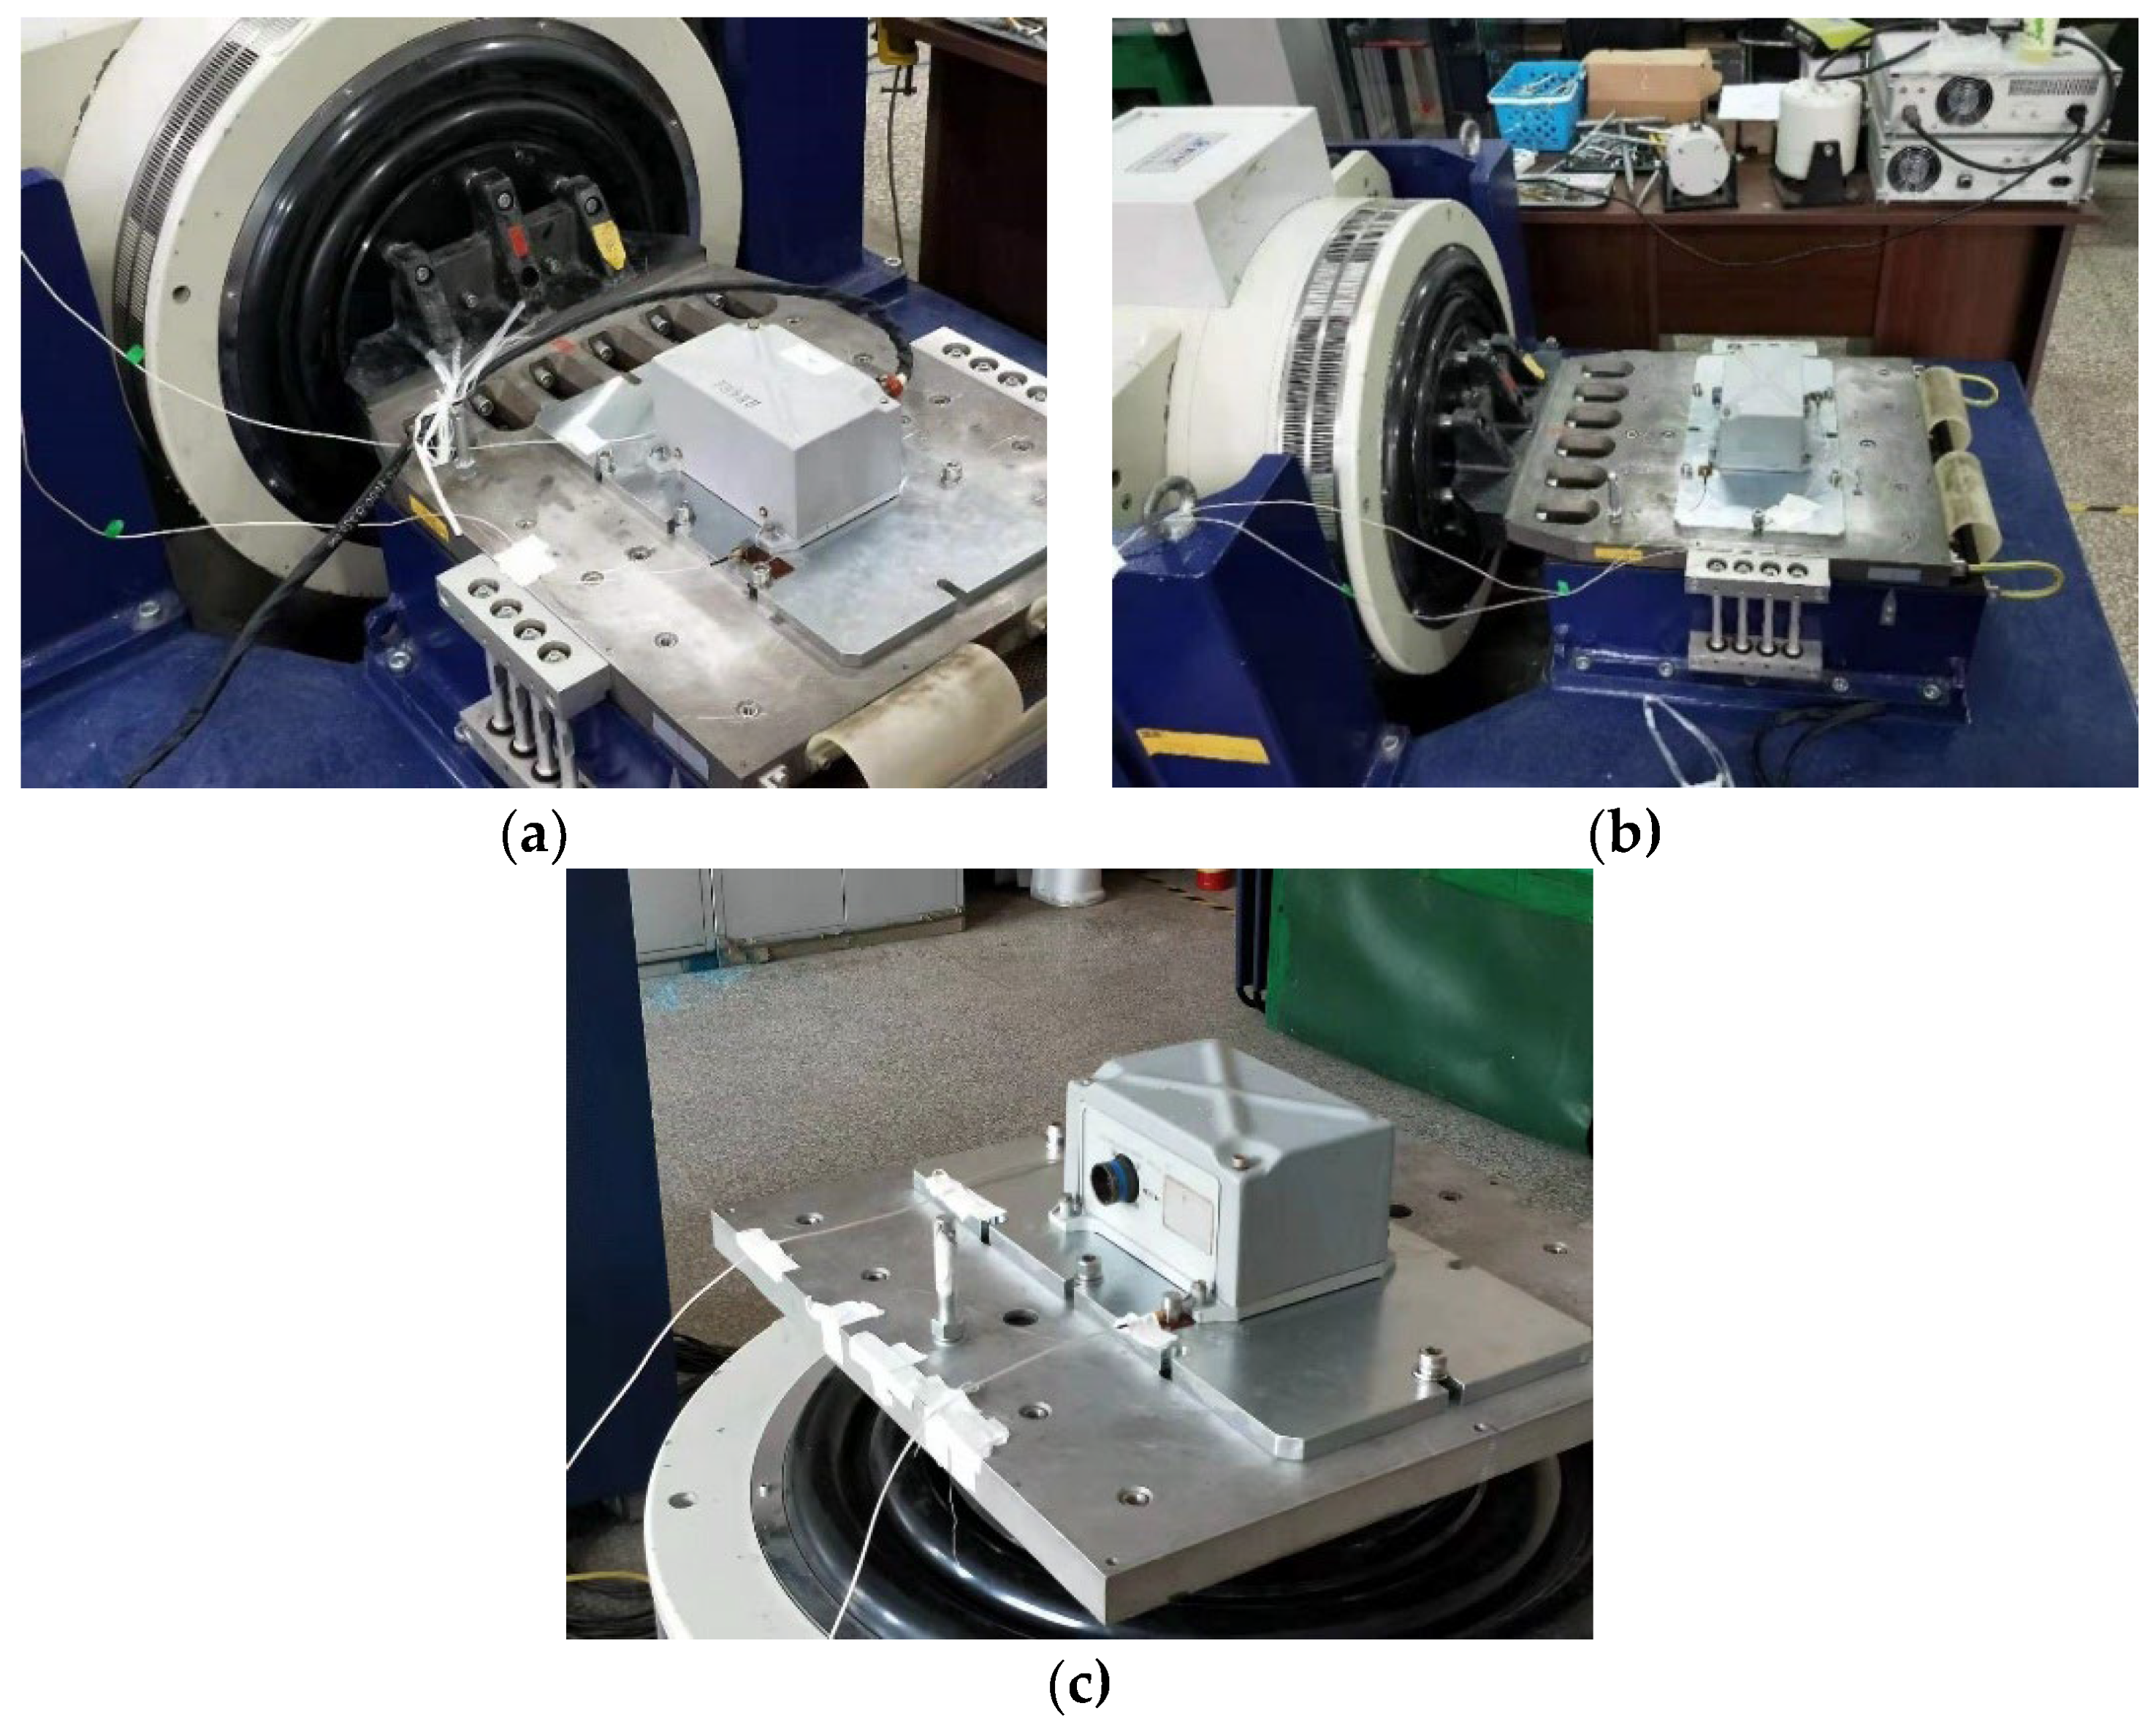
The random vibration function of the vibration table was debugged, and the electrical control box was fixed on the surface of the vibration table according to the installation requirements.
(2)
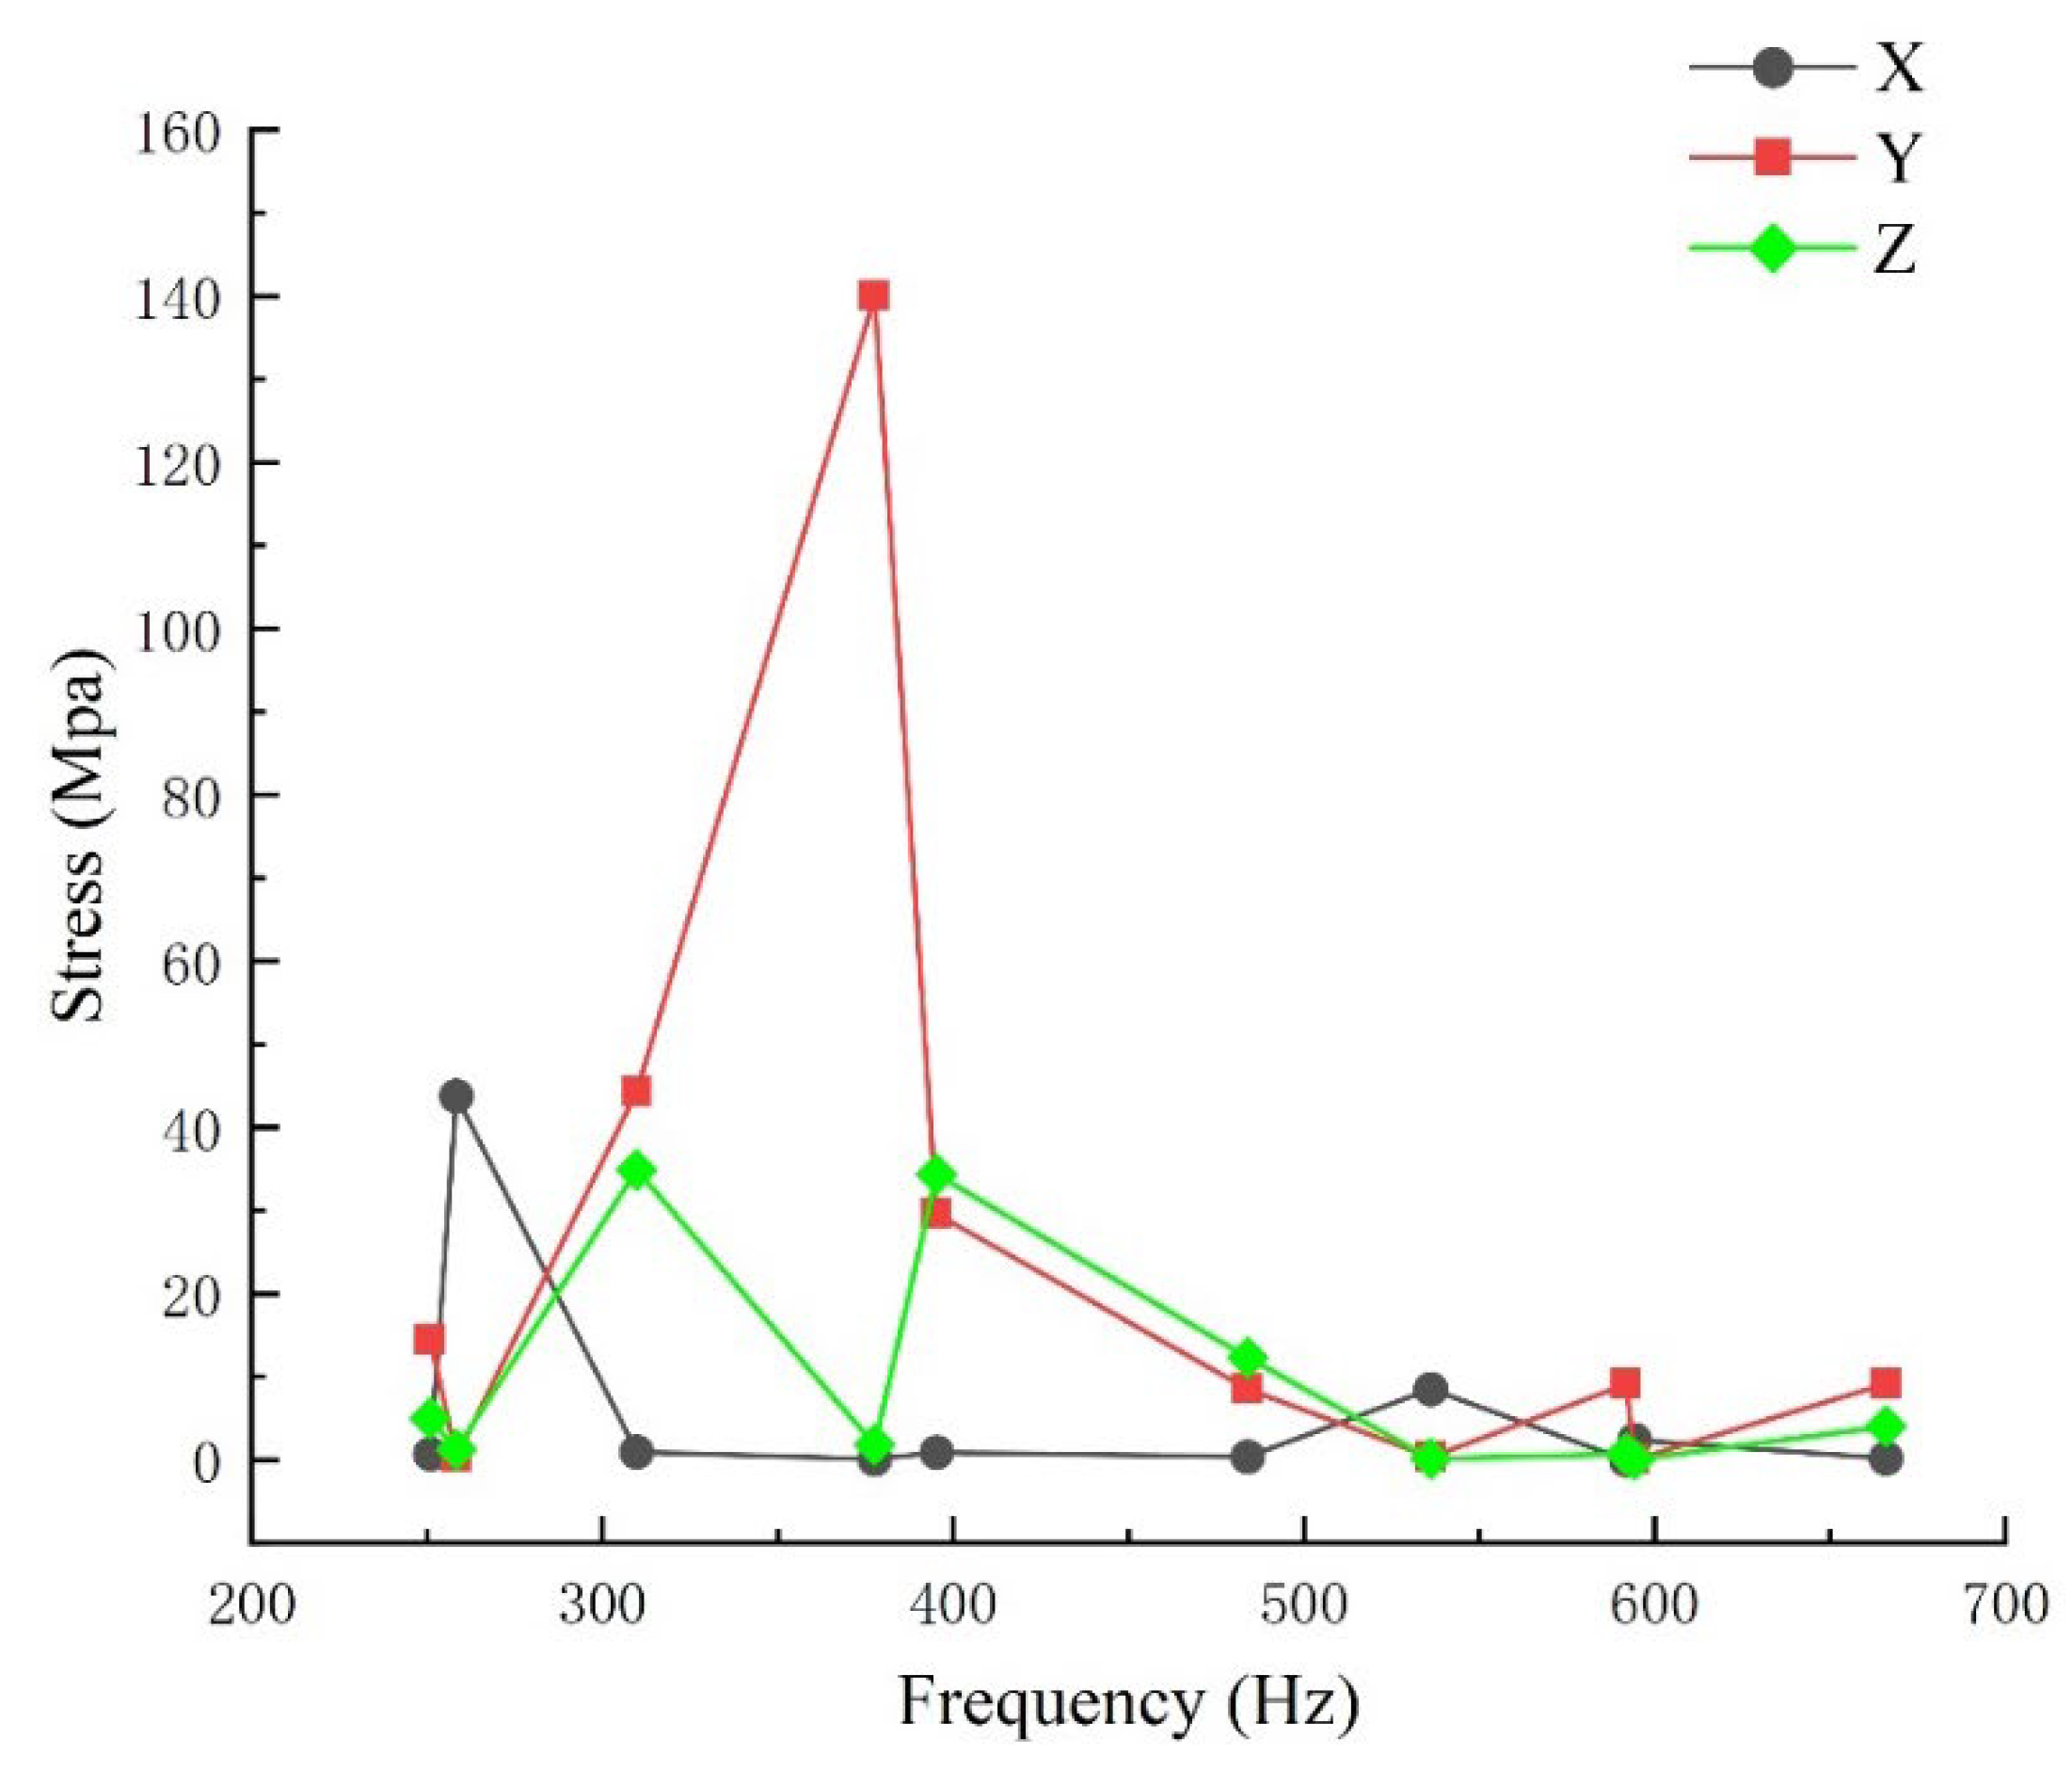
Two calibrated acceleration sensors were attached to the fixture, as close as possible to the diagonal position of the fixed bolt of the electrical control box, for accurate two-point average random vibration control. The frequency response under each axis excitation is illustrated in Figure 15.
(3)
Durability vibration tests in the X, Y, and Z directions of the electrical control box were performed.
(4)
The electrical control box was examined after the functional vibration tests.
Figure 15. Different direction random vibration test control. (a) X direction; (b) Y direction; (c) Z direction.
Applsci 12 07335 g015aApplsci 12 07335 g015b
In the Figure 15, the green line is the target spectrum, and the blue line is the actual vibration spectrum. When the vibration is between the two orange lines, the random vibration is within the control error range, and the red line is the interrupt mark, indicating that, when the vibration PSD value reaches or exceeds the red line, the vibration is too large. In order to protect the specimen and equipment, the vibration control system sends out instructions and the random vibration stops.

6.2. Test Results

Based on the GJB150.16A-2009 standard, the electrical control box experienced random vibration under given load spectrum excitation for 1.5 h (0.5 h per direction), and its dimensions, weight, and internal components were not abnormal. The electrical control box passed the durability test, indicating the correctness of the random vibration fatigue life analysis results and proving that the anti-fatigue performance of the electrical control box structure meets the design requirements.

7. Conclusions

An aircraft electric control box was employed as the research object, and the modal and random vibration response analyses of the electric control box were performed using the finite element software. In addition, the fatigue life of the electric control box was estimated using the frequency-domain analysis theory of fatigue damage and the Gaussian-distribution Steinberg method. Moreover, the finite element analysis results were verified by performing the random vibration test on the electric control box, and the following conclusions were obtained:
(1)
A comparison of the results of finite element calculation and mode analysis revealed that the mechanical model of the electrical control box could be established using the finite element software. The random vibration response analysis of the electrical control box in the X, Y, and Z directions was performed using this model. Furthermore, the fatigue life estimation of the electrical control box under random excitation was performed.
(2)
A comparison of the fatigue damage under random vibration excitation in the X, Y, and Z directions revealed that random excitation in the Y direction has the greatest influence on the fatigue life of the electrical control box, followed by random excitation in the Z and X directions.
(3)
The durability random vibration test on the electrical control box in the X, Y, and Z directions revealed that the dimensions, weight, and internal components are not abnormal, further verifying the correctness of the finite element numerical analysis results.

Author Contributions

Conceptualization, D.Z.; Supervision, D.Z.; Writing—original draft, Y.C.; Writing—review & editing, D.Z. All authors have read and agreed to the published version of the manuscript.

Funding

This research was funded by the “Fatigue life test and verification of airborne equipment (20210101)”.

Institutional Review Board Statement

Not applicable.

Informed Consent Statement

Not applicable.

Data Availability Statement

The data presented in this study cannot be shared at this time as the data also forms part of an ongoing study.

Conflicts of Interest

The authors declare that they have no conflict of interest in this work. The funders had no role in the design of the study; in the collection, analyses, or interpretation of data; in the writing of the manuscript, or in the decision to publish the results.

References

  1. Yang, Y.; Zheng, Q.; Wang, J.; Ma, Z.; Liu, X. Dynamics response analysis of airborne external storage system with clearance between missile-frame. Chin. J. Aeronaut. 2020, 33, 3278–3287. [Google Scholar] [CrossRef]
  2. Wu, W.; Liou, H.; Tse, H. Estimation of fatigue damage and fatigue life of components under random loading. Int. J. Press. Vessel. Pip. 1997, 72, 243–249. [Google Scholar] [CrossRef]
  3. Tovo, R. Cycle distribution and fatigue damage under broad-band random loading. Int. J. Fatigue 2002, 24, 1137–1147. [Google Scholar] [CrossRef]
  4. Nieslony, A. Comparison of some selected multi-axial fatigue failure criteria dedicated for spectral method. J. Theor. Appl. Mech. 2010, 48, 233–254. [Google Scholar]
  5. Dirlik, T. Application of Computers in Fatigue Analysis. Ph.D. Thesis, University of Warwick, Coventry, UK, 1985. [Google Scholar]
  6. Marques, J.M.E.; Benasciutti, D.; Carpinteri, A.; Spagnoli, A. An algorithm for fast critical plane search in computer-aided engineering durability analysis under multiaxial random loadings: Application to the Carpinteri–Spagnoli–Vantadori spectral method. Fatigue Fract. Eng. Mater. Struct. 2020, 43, 1978–1993. [Google Scholar] [CrossRef]
  7. Jun, S.; Park, J. Development of a novel fatigue damage Figurel for Gaussian wide band stress responses using numerical approximation methods. Int. J. Nav. Archit. Ocean. Eng. 2020, 12, 755–767. [Google Scholar] [CrossRef]
  8. Zhang, J.; Qi, X.; Tang, R. Modal Analysis of Airborne Equipment Mounting Rack. Appl. Mech. Mater. 2013, 2382, 282–286. [Google Scholar] [CrossRef]
  9. Li, Y.; Mulani, S. Non-stationary random vibration analysis of multi degree systems using auto-covariance orthogonal decomposition. J. Sound Vib. 2016, 372, 147–167. [Google Scholar] [CrossRef]
  10. Zhang, Z.; Li, B.; Muchun, Y.; Liu, Y. Dynamic strength reliability analysis of an aircraft fuel pipe system. In Proceedings of the 2017 Second International Conference on Reliability Systems Engineering (ICRSE), Beijing, China, 10–12 July 2017; pp. 1–6. [Google Scholar] [CrossRef]
  11. Miner, M. Culative damage in fatigue. J. Appl. Mech. 1945, 12, A159–A164. [Google Scholar] [CrossRef]
  12. Bendat, J.S. Probability Functions for Random Responses: Prediction of Peaks, Fatigue Damage, and Catastrophic Failures; NASA Report on Contact NASA-5–4590; NASA: Washington, DC, USA, 1964. [Google Scholar]
  13. Wirsching, P. Probabilistic design for random fatigue loads. J. Eng. Mech. 1973, 99, 1165–1179. [Google Scholar] [CrossRef]
  14. Steinberg, D. Vibration Analysis for Electronic Equipment, 2nd ed.; John Wiley & Sons: New York, NY, USA, 1988. [Google Scholar]
  15. Li, L.; Bai, Y.; He, X.; Wang, Y. Random response simulation of ejection seat and comparison with test. J. Ordnance Equip. Eng. 2019, 40, 227–231. [Google Scholar]
  16. Chen, Y.J.; Liu, C.C.; Zhu, Y.L.; Song, X.X. Multiaxial Low-cycle Fatigue Behavior and Life Prediction of 7075-T651 Aluminum Alloy Thin-walled Tubular Specimens. J. Mater. Eng. 2018, 46, 60–69. [Google Scholar]
  17. ASTM E2207-15; Standard Practice for Strain-Controlled Axial-Torsional Fatigue Testing with Thin-Walled Tubular Specimens. ASTM International: West Conshohocken, PA, USA, 2015.
  18. GJB150.16A-2009; Laboratory Environmental Test Methods for Military Materiel Part16: Vibration Test. PLA General Armament Department: Beijing, China, 2009.
  19. Zaitsev, V. Designing vibration strength tests of flight vehicle airborne equipment. Russ. Aeronaut. 2009, 52, 145–150. [Google Scholar] [CrossRef]
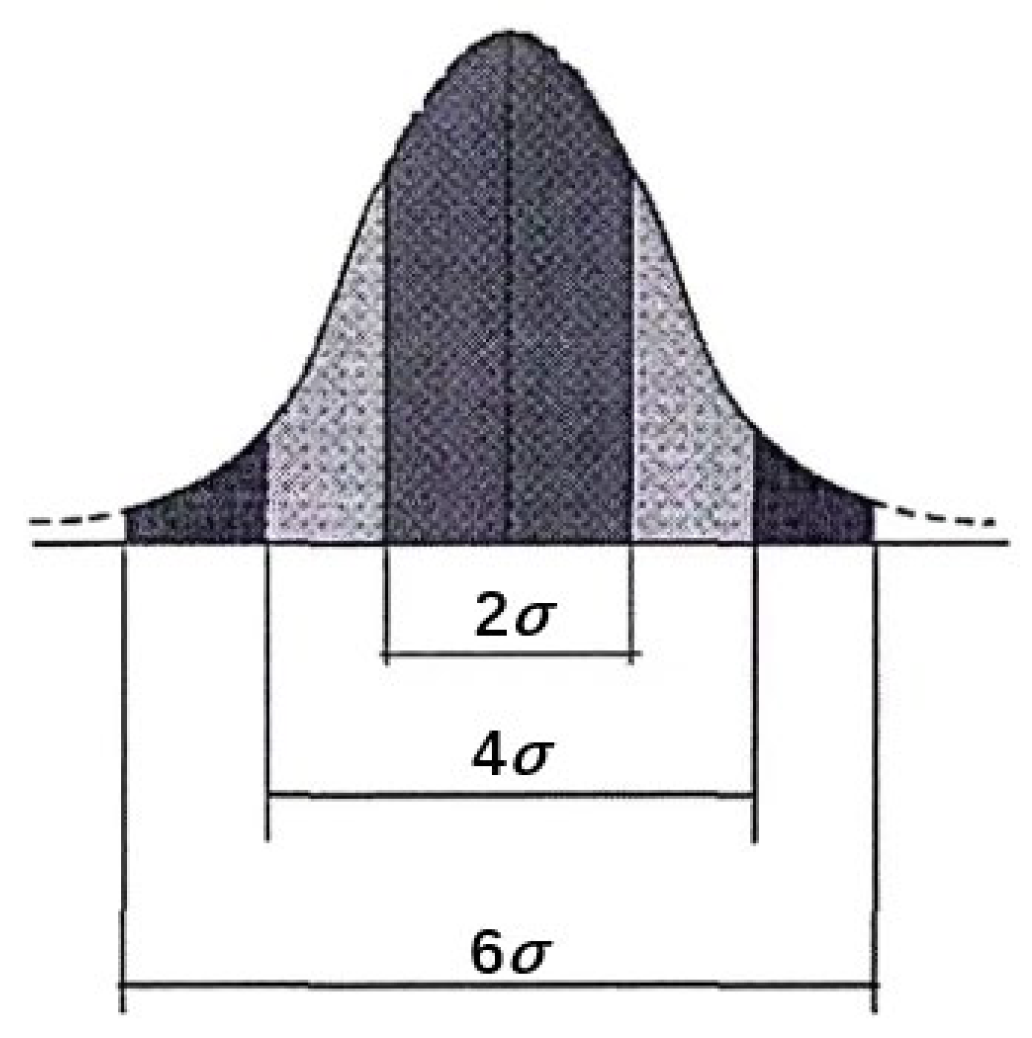
Figure 2. Stress interval.
Applsci 12 07335 g002
Figure 3. Finite element fatigue life analysis process.
Applsci 12 07335 g003
Figure 4. Electrical control box: (a) control box; (b) front panel cable interface; (c) the lug under the rear panel.
Applsci 12 07335 g004
Figure 5. Electric control box finite element model.
Applsci 12 07335 g005
Figure 6. Fixation of electrical control box.
Applsci 12 07335 g006
Figure 7. The first 10 order modes of the electrical control box. (aj): 1 to 10 mode.
Applsci 12 07335 g007aApplsci 12 07335 g007bApplsci 12 07335 g007c
Figure 8. Experimental site and equipment: (a) experimental equipment; (b) Test Lab software.
Applsci 12 07335 g008
Figure 9. Mode analysis resonance frequency comparison.
Applsci 12 07335 g009
Figure 10. PSD curve of random excitation.
Applsci 12 07335 g010
Figure 11. Equivalent stress of the electric control box in the X, Y, and Z directions.
Applsci 12 07335 g011
Figure 12. Fatigue life curve of 7075 aviation aluminum alloy.
Applsci 12 07335 g012
Figure 13. Stress in the X, Y, and Z directions and local hazard points: (a) stress and local hazard point in the X direction; (b) stress and local hazard point in the Y direction; (c) stress and local hazard point in the Z direction.
Applsci 12 07335 g013
Figure 14. Installation direction of the electrical control box on the test bench: (a) X direction; (b) Y direction; (c) Z direction.
Applsci 12 07335 g014
Table 1. Gaussian-distribution Steinberg method.
Stress IntervalCycle NumberProbability of Occurrence/%
−1σ~+1σ 0.6831 V a + T 68.3%
−2σ~−1σ, +1σ~+2σ 0.2710 V a + T 27.1%
−3σ~−2σ, +2σ~+3σ 0.0433 V a + T 4.33%
Aggregate 99.73%
V a + represents the average frequency, and T is the action time of the random response.
Table 2. Mechanical properties of PA6 (upper cover) and 7075 aluminum alloy (fixed base plate).
MaterialsDensity ρ /(kg/m3)Poisson’s Ratio
μ
Yield Strength σ S /(MPA) Elastic Modulus
E/(MPa)
PA61.13 × 1030.331002.32 × 104
7075 aluminum alloy2.81 × 1030.34557.12 × 104
Table 3. Low-order mode analysis results of the electrical control box.
Mode OrderFrequency/HzDescription of Vibration Mode
1251.5First-order symmetric bending of left and right panels
2258.3First-order antisymmetric bending of left and right panels
3309.8First-order bending of upper panel and rear panels (reverse)
4377.7First-order bending of upper panel and rear panels ( same direction)
5395.3First-order bending of rear panel
6483.9Second-order symmetric bending of left and right panels
7536.2Second-order antisymmetric bending of left and right panels
8591.9Second-order bending of Upper and rear panels
9594.3Second-order bending of rear panel
10665.9Combination of first-order bending of the upper panel and second-order bending of the rear panel
Table 4. Experimental equipment.
NameModel NumberQuantityManufacturer
Acceleration sensorPCB333B322PCB Piezotronics, Inc., New York, USA.
Shock acceleration sensorCA-YD-18812Sinocera Piezotronics, Inc., Jiangsu, China.
Large-thrust high-frequency electric vibration test benchMPA409/M437A1ETS Solutions Ltd., Beijing
Control and acquisition systemLMS Test Lab1Siemens Germany
Table 5. Fatigue test data of 7075 aerospace aluminum alloy.
σ m a x /MPa275.8241.3172.4
Life/cycle1699.815000.351,399,909.96
Table 6. Confidence interval and confidence level of stress.
Confidence IntervalConfidence Level
(−σ, +σ)68.269%
(−2σ, +2σ)95.46%
(−3σ, +3σ)99.73%
Table 7. Fatigue analysis of electrical control box.
DirectionMaximum Stress Point LocationStress/MPaFatigue Life/CycleCumulative Damage in Different DirectionsTotal Damage
1 σ 2 σ 3 σ N 1 σ N 2 σ N 2 σ D
XLower part of right fixing bolt on bottom plate of electric control box14.78729.57344.362.004 × 10121.452 × 10108.128 × 1082.3418 × 10−50.10197
YUpper part of left fixing bolt on bottom plate of electric control box48.03996.078144.124.613 × 1083.342 × 1061.866 × 1050.1019
ZUpper part of right fixing bolt on bottom plate of electric control box16.41332.82649.2399.55 × 10116.918 × 1093.873 × 1084.9147 × 10−5
Publisher’s Note: MDPI stays neutral with regard to jurisdictional claims in published maps and institutional affiliations.

