Article

Combining High-Resolution Hard X-ray Tomography and Histology for Stem Cell-Mediated Distraction Osteogenesis

1
Biomaterials Science Center, Department of Biomedical Engineering, University of Basel, 4123 Allschwil, Switzerland
2
Biomaterials Science Center, Department of Clinical Research, University of Basel, 4031 Basel, Switzerland
3
Clinic of Oral and Cranio-Maxillofacial Surgery, Department of Surgery, University Hospital of Basel, 4031 Basel, Switzerland
4
Institute of Materials Physics, Helmholtz-Zentrum Hereon, 21502 Geesthacht, Germany
5
Core Facility for Micro- and Nanotomography, Department of Biomedical Engineering, University of Basel, 4123 Allschwil, Switzerland
6
Vascularized Bone Biofabrication, Department of Biomedical Engineering, University of Basel, 4123 Allschwil, Switzerland
7
Bone Regeneration, Department of Biomedicine, University of Basel, 4031 Basel, Switzerland
*
Author to whom correspondence should be addressed.
Appl. Sci. 2022, 12(12), 6286; https://doi.org/10.3390/app12126286
Submission received: 5 June 2022 / Revised: 17 June 2022 / Accepted: 18 June 2022 / Published: 20 June 2022
(This article belongs to the Topic Medical Image Analysis)

Abstract

:

Featured Application

Combining microtomography before and after decalcification with histology data by means of registration enables tri-variate histograms for labeling mature and newly formed bone as well as soft tissue components in rat jaw.

Abstract

Distraction osteogenesis is a clinically established technique for lengthening, molding and shaping bone by new bone formation. The experimental evaluation of this expensive and time-consuming treatment is of high impact for better understanding of tissue engineering but mainly relies on a limited number of histological slices. These tissue slices contain two-dimensional information comprising only about one percent of the volume of interest. In order to analyze the soft and hard tissues of the entire jaw of a single rat in a multimodal assessment, we combined micro computed tomography (µCT) with histology. The µCT data acquired before and after decalcification were registered to determine the impact of decalcification on local tissue shrinkage. Identification of the location of the H&E-stained specimen within the synchrotron radiation-based µCT data collected after decalcification was achieved via non-rigid slice-to-volume registration. The resulting bi- and tri-variate histograms were divided into clusters related to anatomical features from bone and soft tissues, which allowed for a comparison of the approaches and resulted in the hypothesis that the combination of laboratory-based µCT before decalcification, synchrotron radiation-based µCT after decalcification and histology with hematoxylin-and-eosin staining could be used to discriminate between different types of collagen, key components of new bone formation.

Graphical Abstract

1. Introduction

Distraction osteogenesis is an established treatment employed to correct craniofacial deformities [1,2,3]. The scheme in Figure 1 illustrates the sequence of the bone formation between surgically cut bone segments, which are gradually distracted at a speed of about a millimeter per day [4]. Therefore, the distraction phase requires about a week, before a consolidation phase of about eight weeks [5]. This consolidation phase can be made more efficient by injecting autologous mesenchymal stromal cells (MSCs) at the end of the distraction period [6,7]. We hypothesize that injecting MSCs at the beginning of the distraction phase will be even more effective. In order to evaluate this hypothesis, we performed a preliminary animal study with four rats and evaluated bone formation via a multi-modal imaging strategy.
Characterizing the outcome of distraction osteogenesis is a major challenge, since established histological protocols yield only a few two-dimensional datasets, which are generally compromised of preparation artefacts [8]. Especially in the case of non-union, bony components are shifted against each other, which prevents a meaningful morphological analysis of the distraction volume.
To master the imaging challenge, we propose employing micro computed tomography (µCT), a method that enables us to non-destructively visualize hard and soft tissues with isotropic micrometer resolution [9,10]. This approach, however, has several limitations. Micrometer resolution combined with reasonable contrast is associated with a high dose, therefore in vivo studies can achieve a spatial resolution of about 10 µm while several microns’ resolution is reserved for post mortem imaging.
Microtomography with conventional X-ray sources is easily accessible, but the broad photon energy spectrum impedes the measurement of any local X-ray absorption values. The combination of synchrotron radiation and monochromators allows for selecting photon energy and thus measuring local X-ray absorption at the optimized photon energy. Beamtime preparation is demanding and time-consuming, particularly in light of the limited available beamtime at the few dedicated microtomography beamlines.
Local X-ray absorption values provide a map of tissue microstructure based on a combination of elemental composition and density. Therefore, it is rather simple to identify bony components with their high calcium content. Soft tissue components, however, yield less contrast, albeit this can be improved through staining and embedding [11]. Nevertheless, µCT provides structural information and, with a few exceptions [12], no functional information. Therefore, the information content of three-dimensional µCT data and two-dimensional histology slides should be combined [13,14]. The task is to identify the location of the cutting plane for histology within the µCT data [15]. Due to expected deformations caused by histological sectioning, a non-rigid registration algorithm must be employed. The wealth of anatomical structures simplifies manual and automatic approaches. Registering the mandible before and after decalcification, as captured on µCT, provides further information of the bony structures. Once the data are suitably registered, bi- and tri-variate histograms can be built. Such histograms can help to segment anatomical features that cannot be identified by a single technique alone [16].
This multidisciplinary study is aimed at tackling the challenge of multimodal post mortem imaging of rat jaws after distraction osteogenesis, which consist of soft and hard tissues, i.e., mature bone, newly formed bone, muscles, vessels, skin, etc. The appropriate registration of functional data from two-dimensional histology with structural information from high-resolution hard X-ray tomography leads to a comprehensive anatomical map of the surgically treated rat mandible and subsequent regeneration.

2. Materials and Methods

2.1. Stem Cell Preparation

A bone marrow aspirate was obtained from the iliac crest of one healthy human donor during a routine orthopedic procedure, after informed consent and according to a protocol approved by the local Ethical Committee (Ethikkommission beider Basel, Ref. 78/07). Nucleated cells were isolated from the aspirate by Ficoll density-gradient centrifugation. Nucleated cells were counted after staining with crystal violet 0.01% (Sigma-Aldrich, St. Louis, MO, USA, http://www.sigmaaldrich.com, accessed on 4 June 2022) in phosphate-buffered saline (PBS), pH 7.2. The cells were then plated onto Petri dishes at a density of 105 nucleated cells per square centimeter in an MEM medium containing 10% fetal bovine serum supplemented with 5 ng/mL fibroblast growth factor-2 (FGF-2). At 80% confluence, the cells were detached and replated into another Petri dish at 3 × 10³ cells per square centimeter and used for the experiments when confluence was reached.

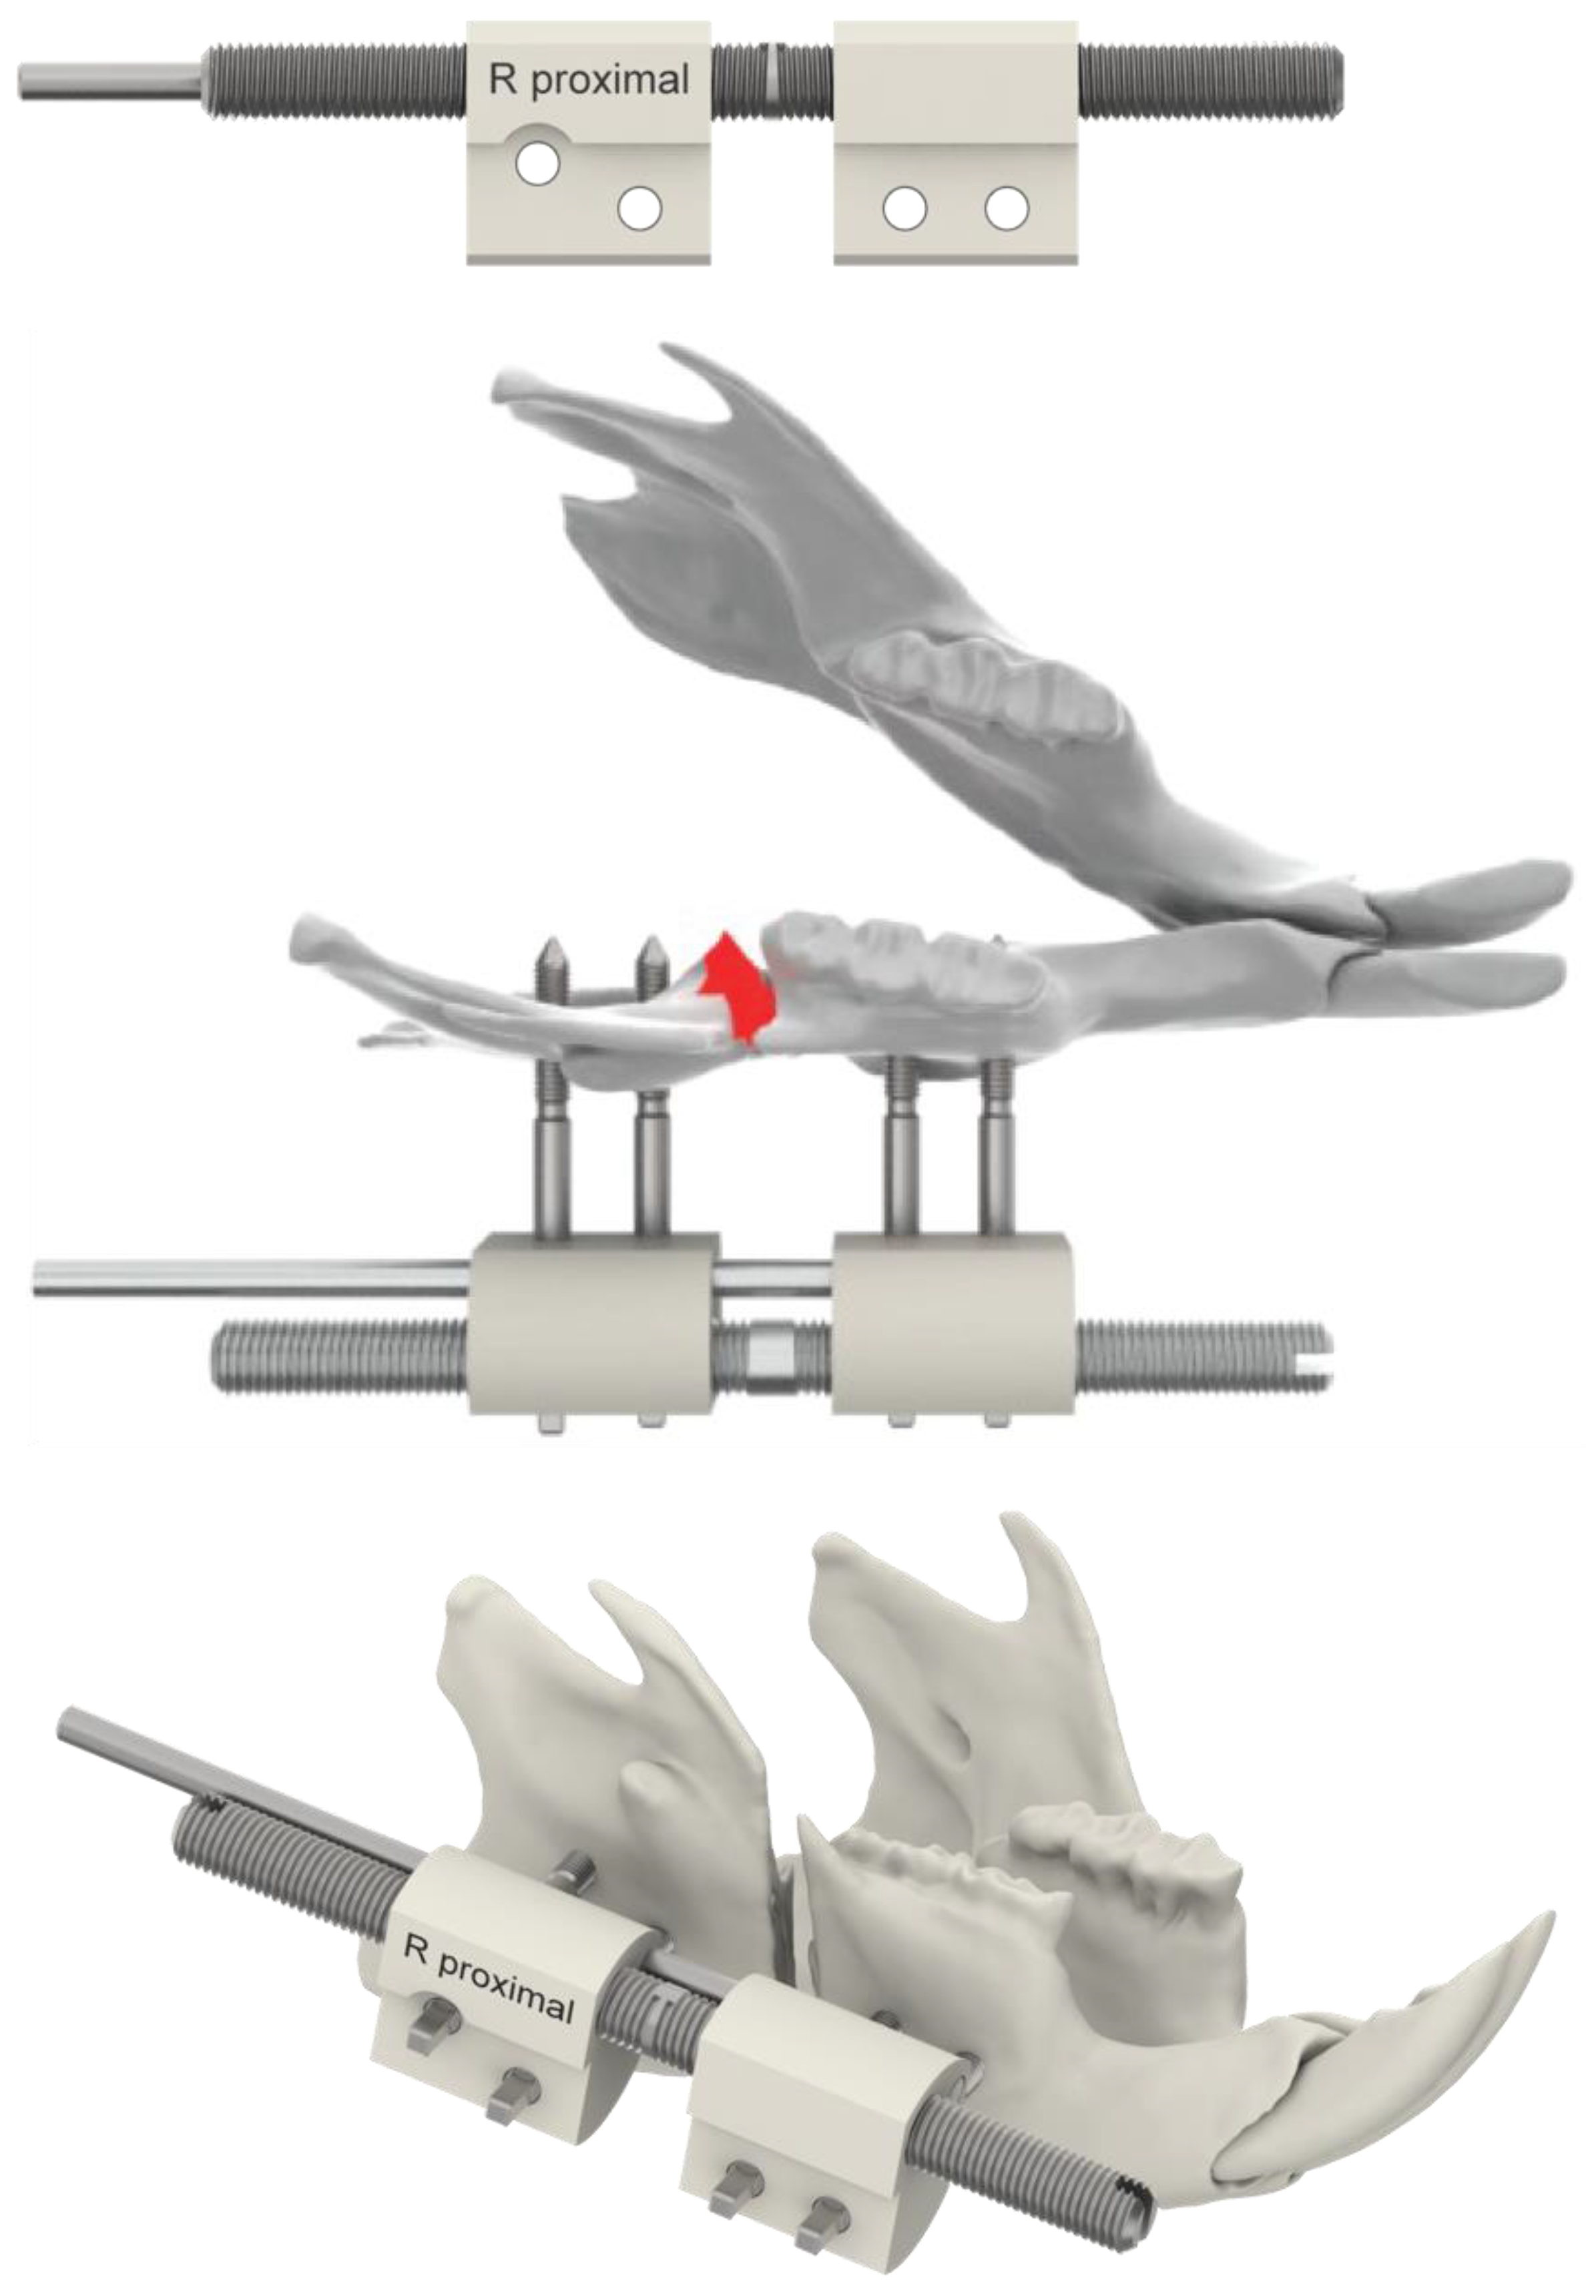
2.2. Surgical Procedure, Osteotomy and Distractor Application

Four nude rats (RNU rat, Charles River Laboratories, Sulzfeld, Germany) with an average weight of 178 g were operated on according to the protocol approved by the Veterinary Office Basel, Switzerland (ethical approval code 2295). The animals were anesthetized by inhalation of a mixture of isoflurane (1.5% to 3.0%) and oxygen with a flow rate of 0.01 L/s. This was followed by the intra-peritoneal injection of fentanyl/fluanisone (Hypnorm, Janssen Pharmaceutical, Beerse, Belgium), using a volume of 0.3 to 0.6 mL/kg, and diazepam with a mass of 2.5 mg/kg. After shaving and disinfection, the mandible was exposed. Bilateral osteotomy of the mandibular angle was performed in the retromolar area, using a piezoelectric instrument. After osteotomy, the locked extraoral distractors made of polyetheretherketone (PEEK), Ti6Al7Nb (TAN) and 316L stainless steel with a pitch of 0.5 mm per full turn (RatDis Mandible, RISystem AG, Davos, Switzerland) were applied and fixed to the mandible with two pins made of TAN and one standard length (RatExFix Mounting pin 0.85 mm, RISystem AG, Davos, Switzerland) on each side of the osteotomy, as illustrated in Figure 2.
In Rat 1 and Rat 2, one million MSCs were injected at each distraction gap after resuspending the cells in a volume of 50 µL fibrinogen mixed with thrombin. The control animals Rat 3 and Rat 4 were only treated with fibrin glue, containing the same composition of fibrinogen and thrombin as for Rat 1 and Rat 2 (Tissucol, Baxter, Vienna, Austria). The skin was closed with 5-0 polypropylene sutures (Surgipro, Syneture, Norfolk, VA, USA). Postoperatively, 0.01 to 0.05 mg/kg buprenorphine was administered every twelve hours for a period of maximal 72 h.
After a latency period of five days, the mandibles were distracted according to a regular or rapid distraction protocol until a distraction gap of 6 mm was reached. The regular distraction protocol applied to Rat 1 and Rat 3 included an initial lengthening of 1.0 mm at Day 1, followed by a distraction speed of 0.5 mm per day. In the rapid distraction protocol, applied to Rat 2 and Rat 4, the distraction speed was set to 1.5 mm, started on Day 1.
After the consolidation period (regular distraction: 72 days, rapid distraction: 66 days), the animals were sacrificed by inhaling carbon dioxide. The mandibles were dissected from the heads and fixed in 4% phosphate-buffered formalin (pH 7.4).

2.3. Conventional Microtomography

The fixed mandible specimens were three-dimensionally investigated by means of the phoenix nanotom m (GE Sensing and Inspection Technologies GmbH, Wunstorf, Germany). This system incorporates a 180-kV nanofocus transmission source and a temperature-stabilized digital GE DXR 500L detector with a minimum effective pixel size of 0.3 µm.
The data were acquired with an acceleration voltage of 100 kVp and a beam current of 100 µA. The 2000 equiangular projections were recorded along 360° with an exposure time of 0.5 s per frame. Therefore, the acquisition time was about 100 min per specimen. To fit the entire mandible into the field of view, the pixel size was set to 6.9 µm. Before reconstruction, the projections were binned by a factor of four, i.e., an effective pixel size of 27.6 µm, to increase density resolution and reduce the size of the dataset [17]. The tomograms were reconstructed using the software phoenix datos|x (GE Sensing and Inspection Technologies GmbH, Wunstorf, Germany). The reconstruction software used a modified Feldkamp algorithm and provided ring-artefact and beam-hardening corrections.

2.4. Decalcification and Paraffin-Embedding of the Mandibles

Decalcification was necessary for preparing the histology slides and was beneficial for tomographic imaging. The mandibles were put in 20% ethylenediaminetetracetic acid (EDTA), used as a chelating agent. For this purpose, 200 g sodium-EDTA was added to 800 mL water and heated with constant stirring, before a 40% solution of about 50 mL NaOH was included until a pH-value of 7.4 was reached, following filling it up by 1 L of water. The EDTA-containing jar had a volume more than ten times greater than the volume of the mandible. The jar and the contained specimen were heated to a temperature of 30 °C under magnetic stirring for a period of ten days. The solution was replaced twice a day.
Once decalcification was finalized, the specimens were rinsed and dehydrated in an ascending isopropanol series (20%, 40%, 60%, 80%, 90%, 100%), followed by xylene, before embedding into paraffin according to standard protocol.

2.5. Synchrotron Radiation-Based Tomography

After decalcification, the rat mandibles were scanned at the tomography setup of the beamline BW 2 (HASYLAB at DESY, Hamburg, Germany) [18]. The data were acquired in absorption contrast mode with a photon energy of 14 keV. The data were recorded using an asymmetric rotation axis [19] to image the entire sample with a magnification of 1.76. This setup led to a pixel size of 5.2 μm and a spatial resolution of 9.4 μm, derived from the 10% value of the modulation transfer function obtained from a metal edge [20]. The 1440 equidistant angular radiographs recorded between −180° and 180° were binned by a factor of two before reconstruction, using a filtered back-projection algorithm, to increase density resolution [17]. The reconstructed images were binned by a factor of two to reduce image size, resulting in an effective pixel size of 20.6 µm.

2.6. Three-Dimensional Visualization of the Tomography Data

Volume renderings were generated by means of the VG Studio Max 2.1 software (Volume Graphics, Heidelberg, Germany).

2.7. Histology and Immune-Histochemical Preparation

For histological assessment, the rat mandible specimens were cut in the horizontal plane to attain sections that included both osteotomy sites and the complete distraction gap zone. The paraffin-embedded sections selected for histological processing were sliced to 2 μm thickness with a microtome Leica SM2010R (Leica Instruments GmbH, Nussloch, Germany). Hematoxylin and eosin (H&E) was used as a surface stain for the decalcified bone sections.
Selected sections were used to identify human mesenchymal stromal cells (hMSCs) by means of human-specific repetitive Arthrobacter luteus (Alu) sequences as well as immunostaining for a human leukocyte antigen Class 1 (HLA-1). To detect repetitive human-specific Alu sequences, chromogenic in situ hybridization was performed on paraffin sections, as described by Osinga [21]. To improve probe binding, one base of the sequence was changed from 59-cgaggcgggtggatcatgaggt-39, reverse 59-ttttttgagacggagtctcgc-39 to 59-cgaggcgggtgcatcatgaggt-39, reverse 59-ttttttgagacggagtctcgc-39. For immunostaining the human cells HLA-1 antibody W6/32 ab22432 (Abcam, Cambridge, UK) was used. The sections were digitized at 20× magnification, using a plan-apochromatic objective with a slide scanner Panoramic MIDI (3DHistech Ltd., Budapest, Hungary).

2.8. Registration of Tomography Data Acquired before and after Decalcification

Automatic registration of the conventional µCT data obtained before decalcification with the synchrotron radiation-based tomography (SRµCT) data, based on mutual information or cross-correlation, produced insufficient alignment for joint histogram analysis. The laboratory-based tomography data only show the bony structures, whereas the synchrotron radiation-based measurement after decalcification includes soft-tissue components with similar X-ray absorption to the decalcified bone. Furthermore, an affine transformation was insufficient, as the bony structures shrunk and were non-uniformly deformed during decalcification. As a consequence, the three-dimensional data were semi-automatically registered. Specifically, the data were pre-aligned based on an affine transformation determined from eight manually selected landmarks in both datasets. Subsequently, 50 corresponding landmark pairs were identified in the pre-aligned datasets by an image-processing specialist. These landmark pairs were employed for registration guidance and have been denoted as LM1. An oral and maxillofacial surgeon independently selected 50 corresponding landmark pairs (denoted as LM2), which were employed to determine registration accuracy. Landmarks were manually selected by navigating to corresponding 3D image locations in two independent itk-SNAP viewers (version 3.6.0) [22] showing orthogonal slices. Furthermore, masks were automatically created by thresholding and extracting the largest connected components to focus registration on the foreground regions. Note: these masks included bony tissue for the non-decalcified data and all tissue components of the decalcified data.
The elastix image registration software version 4.9 was employed [23,24], as this well-established approach supports the use of masks for defining image regions to be matched and allows the combination of image dissimilarity measures and landmark distances in the cost function. Registration was optimized by maximizing normalized cross-correlation within the overlapping region of the masks with weight one and minimizing the Euclidean distance of the 50 LM1 landmark pairs with weight ten. Spatial transformations were restricted to either (i) affine or (ii) affine followed by a three-level cubic B-Spline transformation with a final grid spacing of 32 voxels, termed non-rigid. Full sampling was used for more stable convergence behavior.

2.9. Semi-Automatic Registration of Histology Slides to SRµCT Data

Identifying the precise location of two-dimensional (2D) histological data within the µCT volume remains a challenge, especially considering multi-modality and non-uniform deformations introduced during slide preparation [15]. Automatic approaches have been suggested based on automatic feature detection and matching [25]; however, reliable matching could not be found for the data presented in this study. Therefore, a semi-automatic approach with reasonable accuracy was identified [26]. Compared to a fully manual approach, the workload was substantially reduced.
Two dimensional to three dimensional registration relied on expert input, albeit only for coarse pre-alignment and the identification of anatomical features. First, two rotations of 45° and 20° were applied to the µCT volume to roughly align the major and minor axes of the rat mandible with the selected histological slide. Next, an oral and maxillofacial surgeon labelled 50 corresponding anatomical features in the histology slide and the µCT volume. This process took around 30 min per slide. To determine the slide location, a surface was fitted to manually determined features within the µCT volume. A thin-plate spline as well as polynomial surfaces up to the third order were examined. Based on visual inspection, the thin-plate spline fit was selected. Corresponding two-dimensional data were extracted from the µCT volume, and feature-based, rigid, 2D-2D pre-registration was performed. Final registration was achieved with hierarchical non-rigid 2D-2D registration based on mutual information [23,24].
Coarse rotation, feature labelling, surface fitting and feature-based rigid registration were performed in MATLAB (release 2020a, The MathWorks, Inc., Natick, MA, USA). Non-rigid 2D-2D registration was performed with the open-source software toolbox elastix (version 4.9) [23,24].

2.10. Joint Histograms, k-Means Clustering, and Segmentation

Having established spatial correspondence between structures in the images via registration, the relationship of the tissue appearance between the modalities was investigated via bi- and tri-variate histograms for common areas and volumes, respectively. K-means clustering was employed in order to automatically over-segment these joint distributions into eight clusters. The k-means approach was chosen as it is an efficient method that minimizes within-cluster variances and finds clusters of comparable spatial extent in a feature space [27,28]. A meaningful reduction in the automatically determined clusters into five classes was achieved via manual merging. This analysis was performed in MATLAB (release 2020a, The MathWorks, Inc., Natick, MA, USA).
This segmentation captured the direct relationship between tissue appearances in various images, without taking account of the tissue’s spatial arrangement, i.e., independent of anatomical features and their positions. This procedure has the advantage that general relationships for the whole image can be identified, that tissue properties at the pixel resolution are investigated and that the least complex segmentation approach is first investigated.

3. Results and Discussion

3.1. New Bone Formation and the Risk of Non-Union

Rats treated according to the rapid distraction protocol showed atrophic non-union. A hypertrophic callus—as a sign of the inadequate mechanical stabilization of the distractor—was not found. Most frequently, non-union is caused by biological and mechanical factors [29]. When the distraction speed is slow, a premature consolidation of the interzone could occur. If the speed is too fast, vascular ingrowth with the risk of atrophic non-union arises [30]. Another cause of atrophic non-union could be damage to the surrounding soft tissue following periosteum and endosteum destruction during the surgical procedure [31], although we can exclude this scenario for the present study. We speculate that atrophic non-union, due to high distraction speed, has led to poor vascularization.
Rats treated according to the regular distraction protocol showed a distraction zone that was completely bridged by the newly formed bone.
The current study is restricted to the right half of the jaw from Rat 1, which was injected with MSCs at the beginning of the distraction phase.

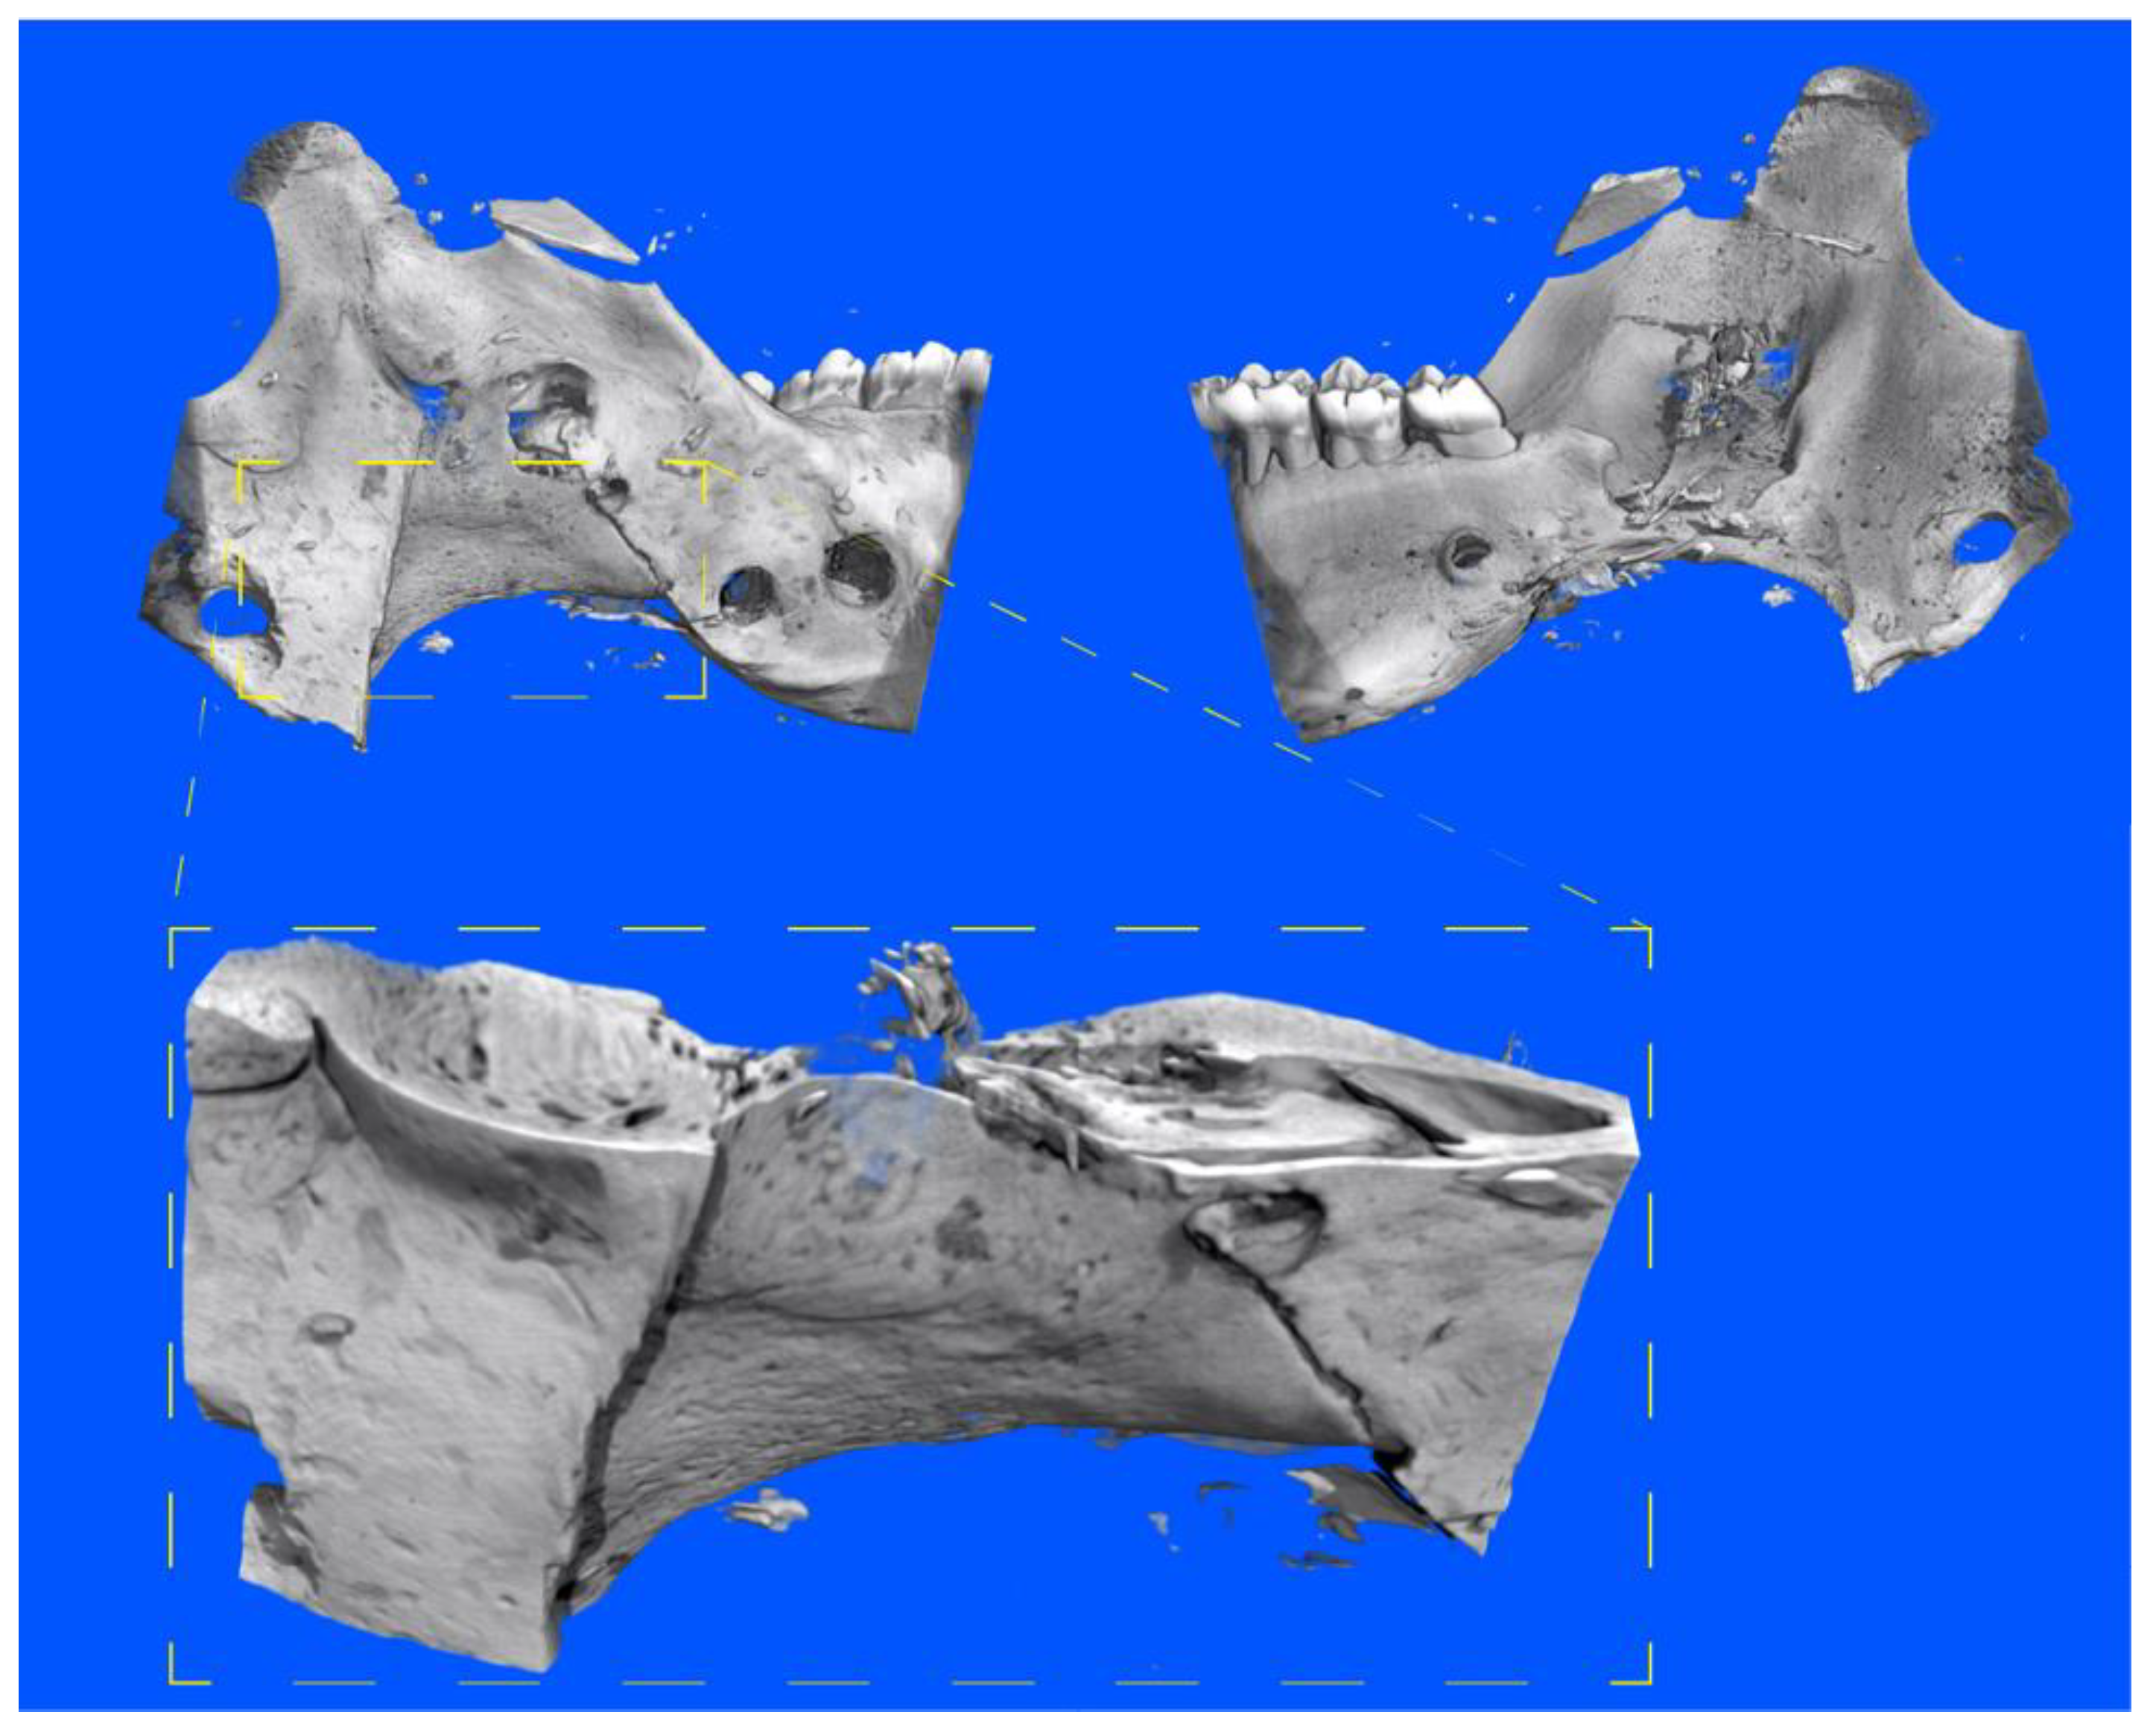
3.2. Three-Dimensional Imaging of the Distracted Jaws Post Mortem

Figure 3 shows three-dimensional representations of the jaw based on laboratory-based µCT. Hard tissues, i.e., crowns, mature bone and newly formed bone were detected because of their calcium content. Drilled holes with a diameter of about 1 mm for fixing the distraction device are clearly visible.

3.3. Impact of Decalcification on the Hard Tissue Microstructure

The preparation of histological sections from distracted jaws generally requires the decalcification of the jawbone. SRµCT obtained after the decalcification process, but before physical sectioning, could be helpful in identifying the slices of interest, because both hard and soft tissues are three-dimensionally visible. The impact of decalcification can be evaluated by means of a bi-variate histogram. For this purpose, tomographic datasets must be well registered and the common volume extracted.
Composition and shape changes as a result of decalcification, led to a challenging registration problem, so we applied a semi-automatic approach, whereby registration was optimized with respect to selected corresponding landmark pairs, denoted as LM1, and image similarity. Figure 4 shows the spatial distribution of the selected landmarks and two examples of µCT volumes in regions surrounding the corresponding landmarks.
Since conventional µCT data only reveals calcified tissues, we investigated if a rigid-and-isotropic-scaling registration with seven parameters (three for translation, three for rotation, one for scaling), abbreviated in the text below by ‘rigid’, would yield the desired fit. The selected virtual cut displayed in Figure 5, however, clearly proves that such a rigid transformation does not account for decalcification-induced local shrinkages. In the first row of Figure 5, the virtual cut of the non-decalcified bone from the conventional tomography data is presented in turquoise and compared with decalcified tissue covering the grayscale on the central and left images. The superposition of the turquoise-colored edges and the grayscale image clearly indicate non-uniform shrinkage.
The second row of images in Figure 5 shows that the non-rigid procedure applied resulted in reasonable fitting (see the orange-colored edge representation overlaid on the grayscale slice from the synchrotron radiation-based tomography data). The related three-dimensional strain field is given by a color bar ranging from yellow (0%) to blue (50% shrinkage). The largest strain values were above 40% and are found in mature bone related to the highest calcium content.
The content of the box represented by the dashed lines in Figure 5 is also shown in Figure 6, top row. The second and third rows in Figure 6 contain orthogonal virtual cuts for the rigid and non-rigid approaches. Hence, these data help to gain a three-dimensional impression of the local strain fields, i.e., shrinkage induced by decalcification and paraffin embedding. They also reflect the necessity to apply non-rigid registration. The similarities between tissue morphology from the non-decalcified and the decalcified bone, together with landmark anchoring, form the basis for the non-rigid registration procedure.
Registration accuracy was evaluated based on 50 landmark pairs from an expert (LM2). The mean Euclidean distance between these landmark pairs improved from (361 ± 218) µm (purely rigid), via (119 ± 75) µm (rigid and isotropic scaling) to (83 ± 62) µm (non-rigid). Note that this result compares favorably to the voxel sizes of the images, namely 20.7 and 27.8 µm. The non-decalcified tissue required a global shrinkage by 21.7% due to isotropic scaling in rigid registration and a mean shrinkage of 20.0% for non-rigid alignment to fit the decalcified tissue.
From visual inspection and registration accuracy, we can conclude that non-rigid registration yielded the desired correspondence between tomographic data obtained before and after decalcification. This correspondence is a prerequisite to generate a bi-variate histogram, which is shown in Figure 7. A bi-variate histogram is a useful means for evaluating the relationship between gray values of corresponding voxels in the two three-dimensional datasets. Therefore, such a diagram is also termed a joint histogram.
In this study, the laboratory-based µCT data only allow for visualizing bone. The calcium content varies widely within the distracted jaw, as demonstrated by the histogram in Figure 7. Note that the greyscale bars in Figure 7 correspond to the greyscales used for the virtual slices in the following figures. The highest X-ray attenuation values were found for dense mature bone, while less attenuation was noted for bone formed during the consolidation phase of distraction osteogenesis. Some voxels were only partly filled by bone and thus gave rise to partial volume phenomena. The highest frequency, of about 2 × 10⁷, was found for the first bin, which relates to surrounding media but also includes soft tissue components, which hardly show attenuation of the X-ray photons used.
The orange-colored histogram in Figure 7 is derived from SRµCT data and exhibits three peaks. The sharpest peak at an X-ray absorption slightly above 1 cm−1 corresponds to paraffin employed for embedding after decalcification. The peak slightly below an X-ray absorption of 2 cm−1 originates from the soft tissues, as illustrated in the subsequent images. The third peak at an X-ray absorption of about 2.5 cm−1 can be associated with newly formed and old bone. The grayscale bar shows X-ray absorption values as represented in the related slices in Figure 5 and Figure 6 and the figures below.
The bi-variate histogram supported a direct comparison between the two tomography datasets regarding the decalcification process, but it is limited for further conclusions. Both data contain the three-dimensional distribution of the bone given by the prominent two-dimensional peak with a maximal frequency of 104 related to the orange color with the yellow halo. Note: the highest frequency, given in white, was found at an X-ray absorption value just above 1 cm−1 and at an X-ray attenuation close to zero. It originates from the embedding material (paraffin).

3.4. Identifying the Location of the Histology Slide within the Tomography Dataset: 2D-3D Registration

The physical cutting of paraffin-embedded tissues often induces local deformations, and thus rigid registration approaches usually fail. The required non-rigid 2D-3D registration, however, is not only multi-modal, but it also offers plenty of degrees of freedom and is therefore complex or even impossible. Automatic algorithms have been developed, but these only lead to reasonable results in specific cases [25,32,33]. Therefore, the semi-automatic approach described in Section 2.9 was employed. The result is represented in Figure 8. One can virtually cut the registered tomography data in any desired direction to find a reasonable approximation for the plane of the histological slice, as illustrated in the three-dimensional representation on the top row of Figure 8. Based on manually selected landmark pairs, a non-planar surface can be extracted. This procedure is straightforward, as many anatomical features of micrometer size are present in both SRµCT and histology data. The same landmark pairs of the microanatomical features can be subsequently utilized for automatic 2D-2D registration. The selected landmarks are marked in the slices, see bottom row of Figure 8.

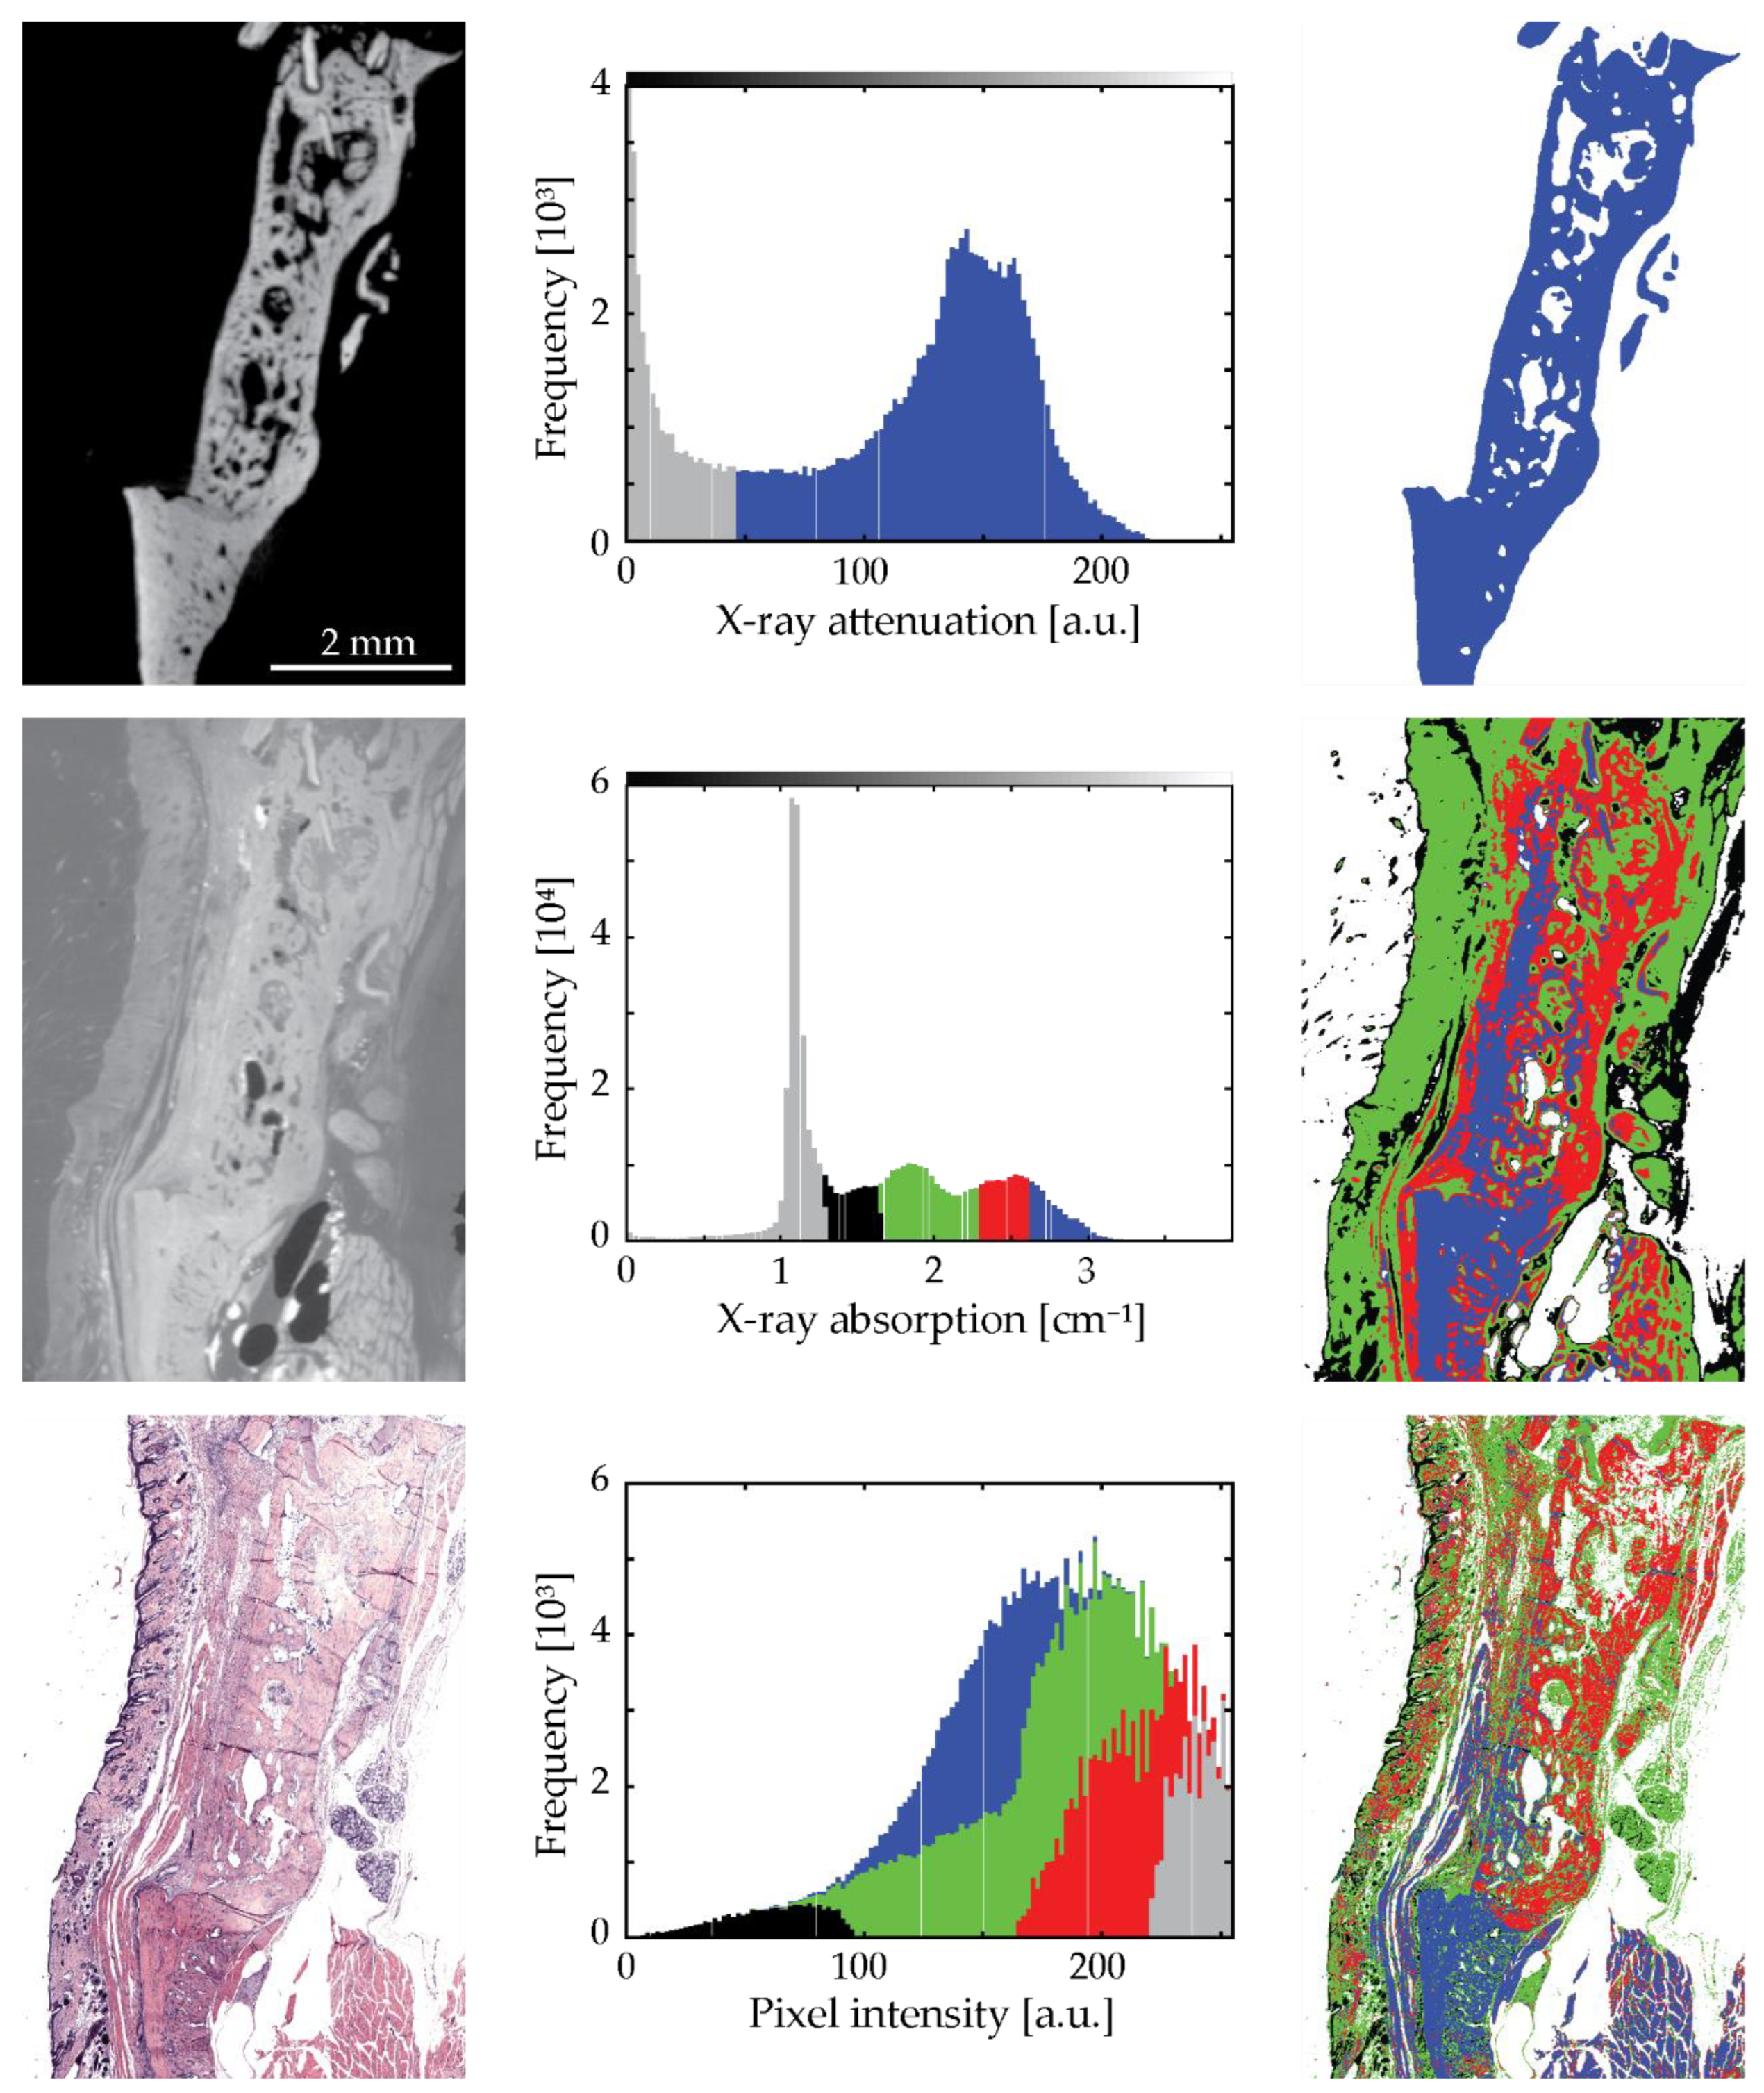
3.5. Univariate Histogram Analysis of the Three Modalities

The first column of Figure 9 displays the virtual tomography slices registered to the selected histology slice. In the second column, related univariate histograms using a linear scale are depicted. K-means clustering was applied to each dataset, and the related clusters are visualized on the univariate histograms (middle) and the slices themselves (right). As expected, the pixel-intensity distributions of the selected modalities are diverse. The origin of the histogram peaks from hard X-ray tomography are discussed above. Whereas tomography data represented by grayscale have only one channel, histology data can be analyzed with respect to three color channels. Thus, k-means clustering based on the three RGB values can yield overlapping clusters when displayed on a univariate histogram of greyscale intensity, as shown with the colored bars of the middle column bottom histogram. For the conventional µCT of non-decalcified tissue, we reasonably found only two clusters representing bone and environment, which are blue-colored and transparent on the slice in the third column of Figure 9. For the SRµCT and histology data, five clusters were selected. Using black, green, red and blue, similar regions were colored accordingly. The pixels indicated in gray within the histograms were made transparent in the third column’s slices.

3.6. Bivariate Histogram Analysis of the Three Modalities

Bivariate histograms of the registered slices were pair-wise generated, see Figure 10. The three possible combinations of X-ray attenuation from conventional µCT, X-ray absorption from SRµCT and the grayscale histology data yielded differing 2D histograms, as shown in the central column of Figure 10. Their k-means analyses-based recoloring exhibit slices with many similarities. The cluster borders are outlined in the bivariate histograms. Differences between the recolored slices are mainly related to the bony parts, cp. red and blue colors.

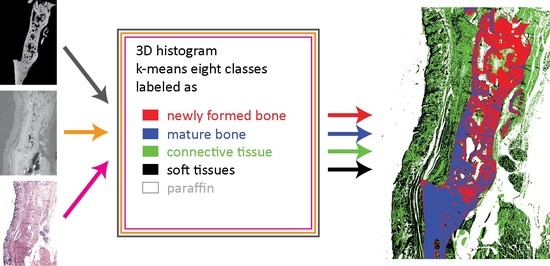
3.7. Trivariate Histogram Analysis of the Three Modalities

The logical extension of the uni- and bivariate histogram analysis of registered slices is the generation of a trivariate histogram. This 3D histogram also allowed for a meaningful application of k-means clustering, see Figure 11. Recoloring of the histology slice gave rise to an unexpected insight into the components of the jaw tissues: the clustering discriminates mature bone (blue-colored), newly formed bone (red-colored), connective tissue with fat (green-colored) and soft tissues with many nuclei (black). The clear separation between green-black and red-blue regions in the trivariate histogram corresponds to the evident delineation between soft and hard tissues. We observe from the angle of the green-black division on the SRµCT-histology axis of the trivariate histogram that discrimination of connective tissue and fat from soft tissues with many nuclei is mostly based on the H&E-stained histology. Even the hard tissues can be divided into mature bone and newly formed bone, mainly because of the degree of calcification detected by hard X-ray imaging. The further discrimination of the soft tissue components led to the hypothesis that combining the three modalities could be a way of discriminating between different types of collagen. This hypothesis could be tested in a future study with suitable staining [34,35].

3.8. Stem Cell Survival and Differentiation

Histological analyses of selected sections from the animal experiments confirmed that parts of the implanted hMSC survived after implantation and that some of them differentiated into human osteocytes and contributed to new bone formation. Figure 12 shows human cells with human nuclei stained in blue for human-specific genomic Alu sequences (see optical micrographs in the top row).
Immunostaining for HLA-1, a human-specific marker, shows human osteocytes. i.e., red-colored features in the optical micrographs, as presented at the bottom row of Figure 12. Neighboring rat osteocytes are characterized by blue-color stain in a zone of ossification inside the distracted region.
For the µCT measurements, the grey values of newly formed bone were similar to those of the mature bone. The newly formed bone exhibited 81 to 97% of the mature bone’s density. A potential impact of the applied hMSC on the bone density is therefore not detectable.

4. Conclusions

This preliminary animal study was restricted to a single rat, because we found incomplete osseous bridging in the other animals. This single rat became the basis of a thorough imaging study combining µCT before and after de-calcification with histology. Non-rigid registration and the extraction of common volumes allowed for segmenting anatomical features, which led to the hypothesis that the combination of the three modalities, i.e., laboratory-based µCT before decalcification, synchrotron radiation-based tomography after decalcification and histology with H&E stain, could be used to discriminate between different types of collagen. This hypothesis should be tested by means of dedicated histological analysis, preferably using a protocol with higher chances of osseous bridging.
The results of this study are in line with the hypothesis that injecting hMSC at the beginning of the distraction phase is effective. We could confirm that at least some implanted hMSC survived and differentiated into human osteocytes, which contributed to new bone formation. In order to quantify the impact of injecting hMSC at the beginning of the distraction phase, an animal study with a sufficiently large number of rats should be performed. The methodology presented herein forms a sound basis for such a study.

Author Contributions

Conceptualization, C.J., C.K. and B.M.; Formal analysis, G.R., G.R.S. and C.T.; Funding acquisition, S.E.H., C.K. and B.M.; Methodology, G.R.S., S.E.H., C.K. and B.M.; Project administration, C.K.; Resources, C.J., C.K. and B.M.; Software, G.R., C.T. and G.S.; Validation, G.R.S.; Visualization, G.R., G.R.S., C.T., S.E.H., F.B., G.S. and A.S.; Writing—original draft, B.M.; Writing—review and editing, G.R., G.R.S., C.T., G.S. and B.M. All authors have read and agreed to the published version of the manuscript.

Funding

This research was partially funded by a research fellowship of the PhD program in Biomedical Engineering of the University of Basel (G. S.). Beamtime at DESY (Hamburg, Germany) was granted through the project proposals I-20110780 EC and I-20110555 EC.

Institutional Review Board Statement

The study was conducted according to guidelines set out in the Declaration of Helsinki and approved by the local Ethical Committee (Ethikkommission beider Basel, Ref. 78/07) and by the Veterinary Office of Basel (ethical approval code 2295, 15 August 2008).

Informed Consent Statement

Not applicable.

Data Availability Statement

Data presented in this study are available on request from the corresponding author.

Acknowledgments

The authors would like to thank Francine Wolf, Gernot Jundt and Bernd Ilgenstein for their support. The work of Nunzia Di Maggio in preparing the stem cells and Marta S. Imholz in preparing the H&E-stained slide is gratefully acknowledged.

Conflicts of Interest

The authors declare no conflict of interest.

References

  1. Cope, J.B.; Samchukov, M.L.; Cherkashin, A.M. Mandibular distraction osteogenesis: A historic perspective and future directions. Am. J. Orthod. Dentofac. Orthop. 1999, 115, 448–460. [Google Scholar] [CrossRef]
  2. McCarthy, J.G.; Stelnicki, E.J.; Mehrara, B.J.; Longaker, M.T. Distraction osteogenesis of the craniofacial skeleton. Plast. Reconstr. Surg. 2001, 107, 1812–1827. [Google Scholar] [CrossRef] [PubMed]
  3. Heggie, A.A.; Kumar, R.; Shand, J.M. The role of distraction osteogenesis in the management of craniofacial syndromes. Ann. Maxillofac. Surg. 2013, 3, 4–10. [Google Scholar] [CrossRef] [PubMed] [Green Version]
  4. Hariri, F. Distraction Osteogenesis in Oral and Craniomaxillofacial Reconstructive Surgery. In Osteogenesis and Bone Regeneration; IntechOpen: London, UK, 2018. [Google Scholar]
  5. Felemovicius, J.; Ortiz Monasterio, F.; Gomez Radillo, L.S.; Serna, A. Determining the optimal time for consolidation after distraction osteogenesis. J. Craniomaxillofac. Surg. 2000, 11, 430–436. [Google Scholar] [CrossRef]
  6. Qi, M.; Hu, J.; Zou, S.; Zhou, H.; Han, L. Mandibular distraction osteogenesis enhanced by bone marrow mesenchymal stem cells in rats. J. Craniomaxillofac. Surg. 2006, 34, 283–289. [Google Scholar] [CrossRef]
  7. Suehiro, F.; Ishii, M.; Asahina, I.; Murata, H.; Nishimura, M. Low-serum culture with novel medium promotes maxillary/mandibular bone marrow stromal cell proliferation and osteogenic differentiation ability. Clin. Oral Investig. 2017, 21, 2709–2719. [Google Scholar] [CrossRef]
  8. Ilgenstein, B.; Deyhle, H.; Jaquiery, C.; Kunz, C.; Stalder, A.; Stübinger, S.; Jundt, G.; Beckmann, F.; Müller, B.; Hieber, S.E. Combined micro computed tomography and histology study of bone augmentation and distraction osteogenesis. Proc. SPIE 2012, 8506, 85060M. [Google Scholar] [CrossRef]
  9. Holme, M.N.; Schulz, G.; Deyhle, H.; Weitkamp, T.; Beckmann, F.; Lobrinus, J.A.; Rikhtegar, F.; Kurtcuoglu, V.; Zanette, I.; Saxer, T.; et al. Complementary X-ray tomography techniques for histology-validated 3D imaging of soft and hard human tissues using plaque-containing blood vessels as examples. Nat. Protoc. 2014, 9, 1401–1415. [Google Scholar] [CrossRef]
  10. Khimchenko, A.; Schulz, G.; Deyhle, H.; Hieber, S.; Hasan, S.; Bikis, C.; Schulz, G.; Costeur, L.; Müller, B. Non-destructive phase contrast hard X-ray imaging to reveal the three-dimensional microstructure of soft and hard tissues. Proc. SPIE 2016, 9797, 97970B. [Google Scholar] [CrossRef]
  11. Müller, B.; Lang, S.; Dominietto, M.; Rudin, M.; Schulz, G.; Deyhle, H.; Germann, M.; Pfeiffer, F.; David, C.; Weitkampf, T. High-resolution tomographic imaging of microvessels. Proc. SPIE 2008, 7078, 70780B. [Google Scholar] [CrossRef] [Green Version]
  12. Müller, B.; Riedel, M.; Thurner, P. Three-dimensional characterization of cell clusters using synchrotron-radiation-based micro computed tomography. Microsc. Microanal. 2006, 12, 97–105. [Google Scholar] [CrossRef] [PubMed] [Green Version]
  13. Campioni, I.; Pecci, R.; Bedini, R. Ten Years of Micro-CT in Dentistry and Maxillofacial Surgery: A Literature Overview. Appl. Sci. 2020, 10, 4328. [Google Scholar] [CrossRef]
  14. Trejo-Iriarte, C.G.; Serrano-Bello, J.; Gutiérrez-Escalona, R.; Mercado-Marques, C.; García-Honduvilla, N.; Buján-Varela, J.; Medina, L.A. Evaluation of bone regeneration in a critical size cortical bone defect in rat mandible using microCT and histological analysis. Arch. Oral Biol. 2019, 101, 165–171. [Google Scholar] [CrossRef] [PubMed]
  15. Ferrante, E.; Paragios, N. Slice-to-volume medical image registration: A survey. Med. Image Anal. 2017, 39, 101–123. [Google Scholar] [CrossRef] [Green Version]
  16. Stalder, A.; Ilgenstein, B.; Chicherova, N.; Deyhle, H.; Beckmann, F.; Müller, B.; Hieber, S.E. Combined use of micro computed tomography and histology to evaluate the regenerative capacity of bone grafting materials. Int. J. Mater. Res. 2014, 105, 679–691. [Google Scholar] [CrossRef] [Green Version]
  17. Thurner, P.; Beckmann, F.; Müller, B. An optimization procedure for spatial and density resolution in hard X-ray micro-computed tomography. Nucl. Instrum. Methods Phys. Res. B 2004, 225, 599–603. [Google Scholar] [CrossRef]
  18. Beckmann, F.; Herzen, J.; Haibel, A.; Müller, B.; Schreyer, A. High density resolution in synchrotron-radiation-based attenuation-contrast microtomography. Proc. SPIE 2008, 7078, 70781D. [Google Scholar] [CrossRef]
  19. Müller, B.; Bernhardt, R.; Weitkamp, T.; Beckmann, F.; Bräuer, R.; Schurigt, U.; Schrott-Fischer, A.; Glueckert, R.; Ney, M.; Beleites, T.; et al. Morphology of bony tissues and implants uncovered by high-resolution tomographic imaging. Int. J. Mater. Res. 2007, 98, 613–621. [Google Scholar] [CrossRef]
  20. Müller, B.; Thurner, P.; Beckmann, F.; Weitkamp, T.; Rau, C.; Bernhardt, R.; Karamuk, E.; Eckert, L.; Buchloh, S.; Wintermantel, E.; et al. Nondestructive three-dimensional evaluation of biocompatible materials by microtomography using synchrotron radiation. Proc. SPIE 2002, 4503, 178–188. [Google Scholar] [CrossRef]
  21. Osinga, R.; Di Maggio, N.; Todorov, A.; Allafi, N.; Barbero, A.; Laurent, F.; Schaefer, D.J.; Martin, I.; Scherberich, A. Generation of a bone organ by human adipose-derived stromal cells through endochondral ossification. Stem Cells Transl. Med. 2016, 5, 1090–1097. [Google Scholar] [CrossRef]
  22. Yushkevich, P.A.; Piven, J.; Hazlett, H.C.; Smith, R.G.; Ho, S.; Gee, J.C.; Gerig, G. User-guided 3D active contour segmentation of anatomical structures: Significantly improved efficiency and reliability. Neuroimage 2006, 31, 1116–1128. [Google Scholar] [CrossRef] [PubMed] [Green Version]
  23. Klein, S.; Staring, M.; Murphy, K.; Viergever, M.A.; Pluim, J.P.W. Elastix: A toolbox for intensity-based medical image registration. IEEE Trans. Med. Imaging 2010, 29, 196–205. [Google Scholar] [CrossRef] [PubMed]
  24. Kunkel, S.; Schmidt, M.; Eppler, J.M.; Plesser, H.E.; Masumoto, G.; Igarashi, J.; Ishii, S.; Fukai, T.; Morrison, A.; Diesmann, M.; et al. Spiking network simulation code for petascale computers. Front. Neuroinform. 2014, 8, 78. [Google Scholar] [CrossRef] [PubMed]
  25. Chicherova, N.; Hieber, S.E.; Khimchenko, A.; Bikis, C.; Müller, B.; Cattin, P. Automatic deformable registration of histological slides to μCT volume data. J. Microsc. 2018, 271, 49–61. [Google Scholar] [CrossRef]
  26. Khimchenko, A.; Deyhle, H.; Schulz, G.; Schweighauser, G.; Hench, J.; Chicherova, N.; Bikis, C.; Hieber, S.; Müller, B. Extending two-dimensional histology into the third dimension through conventional micro computed tomography. Neuroimage 2016, 139, 26–36. [Google Scholar] [CrossRef] [PubMed] [Green Version]
  27. Forgy, E.W. Cluster analysis of multivariate data: Efficiency versus interpretability of classifications. Biometrics 1965, 21, 768–769. [Google Scholar]
  28. Lloyd, S.P. Least squares quantization in PCM. IEEE Trans. Inf. Theory 1982, 28, 129–137. [Google Scholar] [CrossRef] [Green Version]
  29. Stewart, S.K. Fracture non-union: A review of clinical challenges and future research needs. Malays. Orthop. J. 2019, 13, 1–10. [Google Scholar] [CrossRef]
  30. Ashman, O.; Phillips, A.M. Treatment of non-unions with bone defects: Which option and why? Injury 2013, 44, S43–S45. [Google Scholar] [CrossRef]
  31. Toosi, S.; Behravan, N.; Behravan, J. Nonunion fractures, mesenchymal stem cells and bone tissue engineering. J. Biomed. Mater. Res. A. 2018, 106, 2552–2562. [Google Scholar] [CrossRef]
  32. Becker, K.; Stauber, M.; Schwarz, F.; Beißbarth, T. Automated 3D–2D registration of X-ray microcomputed tomography with histological sections for dental implants in bone using chamfer matching and simulated annealing. Comput. Med. Imaging Graph. 2015, 44, 62–68. [Google Scholar] [CrossRef] [PubMed]
  33. Lundin, E.L.; Stauber, M.; Papageorgiou, P.; Ehrbar, M.; Ghayor, C.; Weber, F.E.; Tanner, C.; Goksel, O. Automatic registration of 2D histological sections to 3D microCT volumes: Trabecular bone. Bone 2017, 105, 173–183. [Google Scholar] [CrossRef] [PubMed] [Green Version]
  34. Herman-de-Sousa, C.; Pinheiro, A.R.; Paramos-de-Carvalho, D.; Costa, M.A.; Ferreirinha, F.; Magalhães-Cardoso, T.; Ribeiro, S.; Pelletier, J.; Sévigny, J.; Correia-de-Sá, P. Opposing effects of adenosine and inosine in human subcutaneous fibroblasts may be regulated by third party ADA cell providers. Cells 2020, 9, 651. [Google Scholar] [CrossRef] [PubMed] [Green Version]
  35. Tullberg-Reinert, H.; Jundt, G. In situ measurement of collagen synthesis by human bone cells with a sirius red-based colorimetric microassay: Effects of transforming growth factor beta2 and ascorbic acid 2-phosphate. Histochem. Cell. Biol. 1999, 112, 271–276. [Google Scholar] [CrossRef] [PubMed]
Figure 1. The phases of distraction osteogenesis. (a) Starting condition. (b) Latency phase of five days, in which the osteotomy-induced hematoma is formed and subsequently converted into granulation tissue. (c) Distraction phase with a regular speed of eleven days or with an elevated speed of four days, in which the two parts of the jawbone drift away through tension, and non-mineralized callus tissues are formed at a distraction gap. (d) During the consolidation phase of 40 days, osteogenesis extends to the middle of the gap. (e) During the late consolidation phase, the gap between the bone segments matures into a newly formed bone. (f) The remodeling phase begins after the completion of distraction osteogenesis. Here, the distractor is disconnected and lamellar bone forms.
Applsci 12 06286 g001
Figure 2. Extraoral distraction osteogenesis device for rat mandible: each of the two PEEK blocks comprises two holes for incorporating the TAN screws to be fixed in the mandible; a supporting rod guides the threaded rod for the adjustment of distraction distance. Details on the device and the surgical procedures can be found in www.risystem.com, accessed on 4 June 2022.
Applsci 12 06286 g002
Figure 3. Three-dimensional representation of the distracted jaw generated from tomography data before decalcification, illustrating bone formation and the location of the holes used for the distractor screws.
Applsci 12 06286 g003
Figure 4. (a) Spatial distribution of corresponding landmark pairs, with landmarks LM1 used for registration (shown in blue) and landmarks LM2 for determining registration accuracy (shown in red). Lines connect the manually selected landmark positions in the decalcified tissue (marked by a rectangle) with the corresponding position in the non-decalcified tissue—as determined by non-rigid image registration. This can be compared to the manually selected landmark position marked by circles. (b,c) Orthogonal slices at the manually selected landmark pairs are marked with thick lines in (a). These are at point features within (top) a tooth and (bottom) a lacuna in newly formed bone.
Applsci 12 06286 g004
Figure 5. A selected virtual cut through the tomography data indicates registration quality. Rigid registration displayed in the first row does not provide a reasonable alignment between (left) non-decalcified bone and (right) decalcified tissue. The employed non-rigid registration enabled the quantification of local shrinkage, represented by the color bar (bottom right). The dashed-line box marks the region cropped for the data in Figure 6.
Applsci 12 06286 g005
Figure 6. Turquoise- or orange-colored tomography data obtained before decalcification was registered, rigid and non-rigid, respectively, to the synchrotron radiation-based tomography data, grayscale image, and shown in the three orthogonal directions. Contour lines overlayed on the decalcified image show correspondence. The two middle columns demonstrate the need for the application of non-rigid registration procedures.
Applsci 12 06286 g006
Figure 7. Bi-variate histogram of the common volume measured before decalcification using conventional µCT (nanotom m), and after decalcification using the synchrotron radiation facility (SRµCT). The projection of these logarithmically presented bi-variate data to the axes yield the univariate histograms of the individual tomographic datasets. Note that the soft tissues are almost transparent for the nanotom study, and hence the first bin reaches a value greater than 107. The univariate histograms shown in lighter colors and with about two orders of magnitude lower frequencies capture the distribution of the virtual slice corresponding to the histological section, see below.
Applsci 12 06286 g007
Figure 8. Location of the selected histology slice within the tomography data, see top row. In a first step, the approximate location was identified manually. In a second step, landmark pairs, i.e., SRµCT and histology slices, guide surface extraction and 2D-2D pre-registration. An automatic non-rigid 2D-2D registration refines correspondences.
Applsci 12 06286 g008
Figure 9. Tomography slices in the left column were registered to the selected histology slice, resulting in a common area for the three modalities. Individual histograms in the second column were analyzed using k-means clustering and colored accordingly. Note: frequencies were not scaled equally, and the histogram in the top row was scaled to highlight the bone peak. The histogram for the histology slice represents grayscale intensity, while clustering was performed in the RGB color space. Note the resemblance of the segmented slices in the third column.
Applsci 12 06286 g009
Figure 10. Corresponding data for the common area from the selected slices of two of the three modalities can be displayed as 2D histograms. Analysis of these bivariate histograms applying k-means clustering enabled segmentation. The segmented anatomical features within the slices are colored to elucidate the structural similarities between the pair-wise combination of the three selected modalities, see images in the third column.
Applsci 12 06286 g010
Figure 11. Using the corresponding pixel intensities of the three slices from conventional µCT before decalcification, from SRµCT after decalcification and from H&E-stained histology, a trivariate histogram was built. After applying k-means clustering, we identified five classes: mature bone (blue), newly formed bone (red), connective tissue with fat (green) and soft tissues with many nuclei (black).
Applsci 12 06286 g011
Figure 12. Histological analyses of the injected stem cells (hMSC). Histological sections allowed for identifying implanted hMSC by using in situ hybridization of the repetitive human specific Alu sequences, see images in the top row. Human cells possess a blue color clearly seen in the enlarged view on the right. Immunostaining for HLA-1 (bottom row) shows human osteocytes, indicated by the red color. They are part of the newly formed bone.
Applsci 12 06286 g012
Publisher’s Note: MDPI stays neutral with regard to jurisdictional claims in published maps and institutional affiliations.

