
Effect of Wood Properties and Building Construction on Thermal Performance of Radiant Floor Heating Worldwide

 ,
,
Abstract
:1. Introduction
- Are woods with the lowest thermal conductivity efficient for use in radiant floors? The objective is to show whether the lowest conductivity woods can be used in radiant floor heating systems or, conversely, must be rejected based exclusively on that low value. Specifically, this research tried to determine whether woods with lowest thermal conductivity can meet comfort levels requirements with a low energy demand.
- Should the flooring in radiant heating systems have a maximum thermal resistance value for good thermal performance? Is the standard thermal resistance limit of 0.15 m2 K/W objectively justified?
- Do the answers to the preceding questions depend on the climate and the construction characteristics of the buildings?
2. Methodology
2.1. Simulation Types
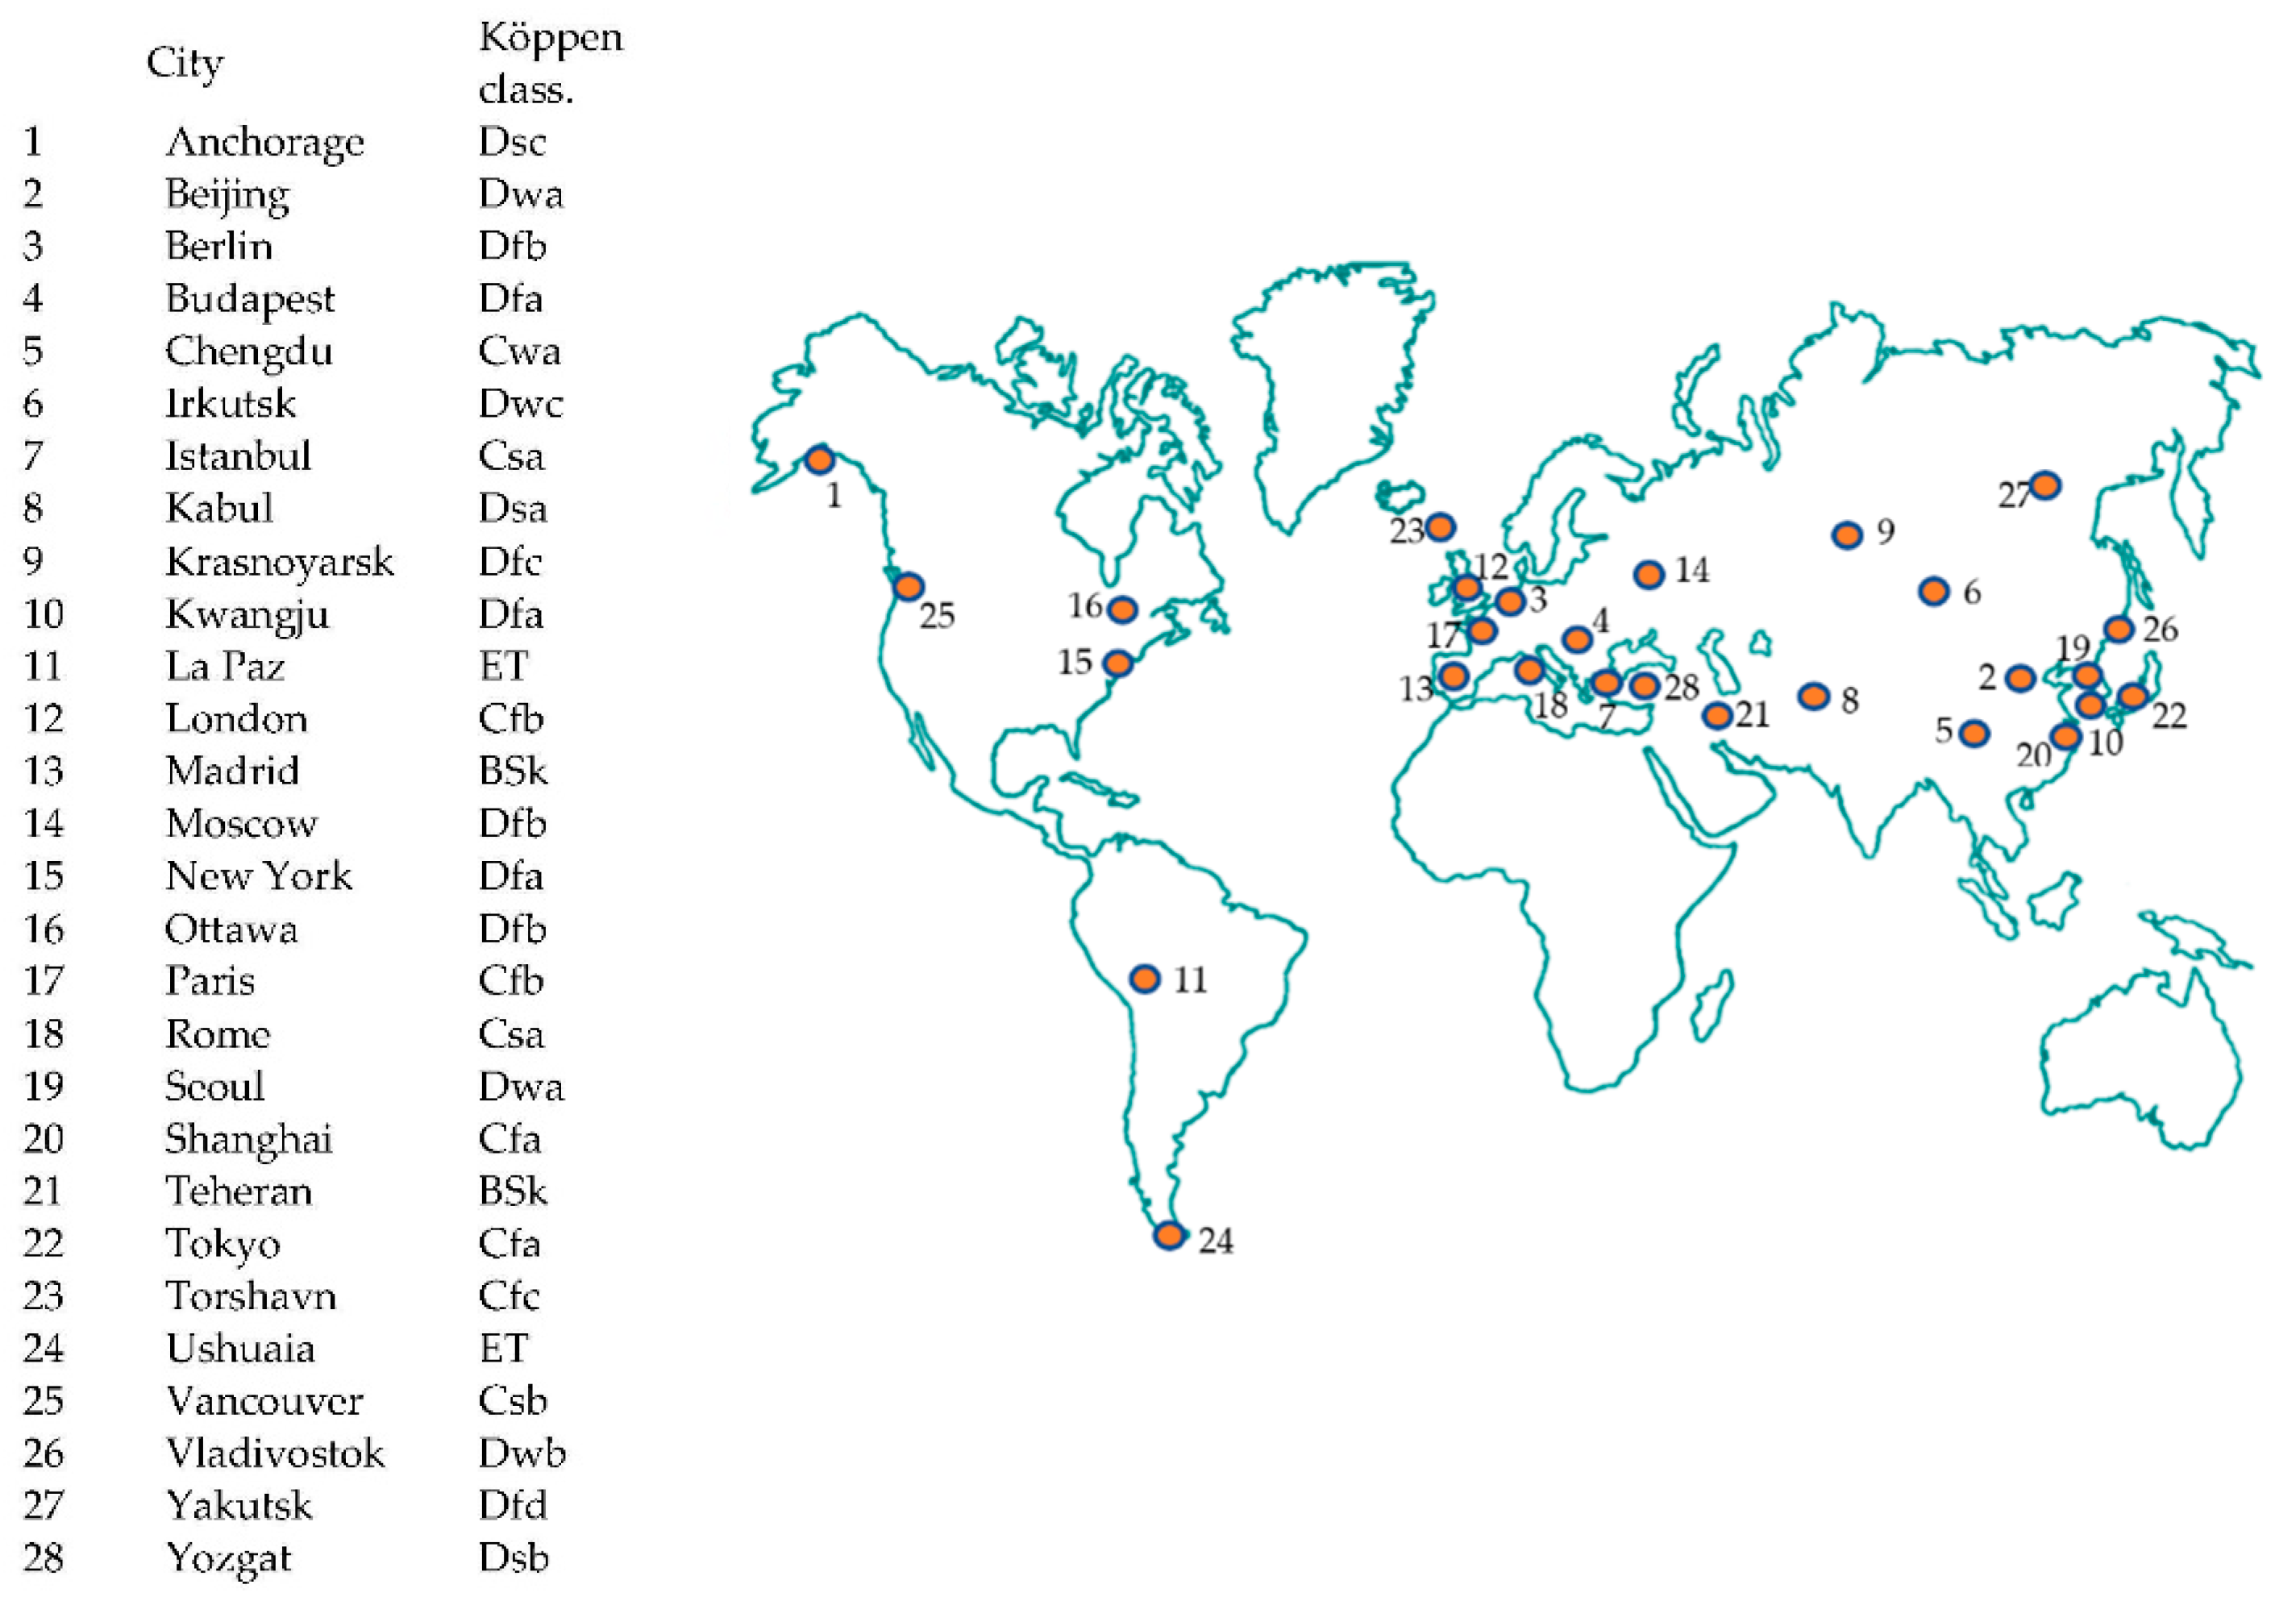
2.2. Selected Cities for Simulations
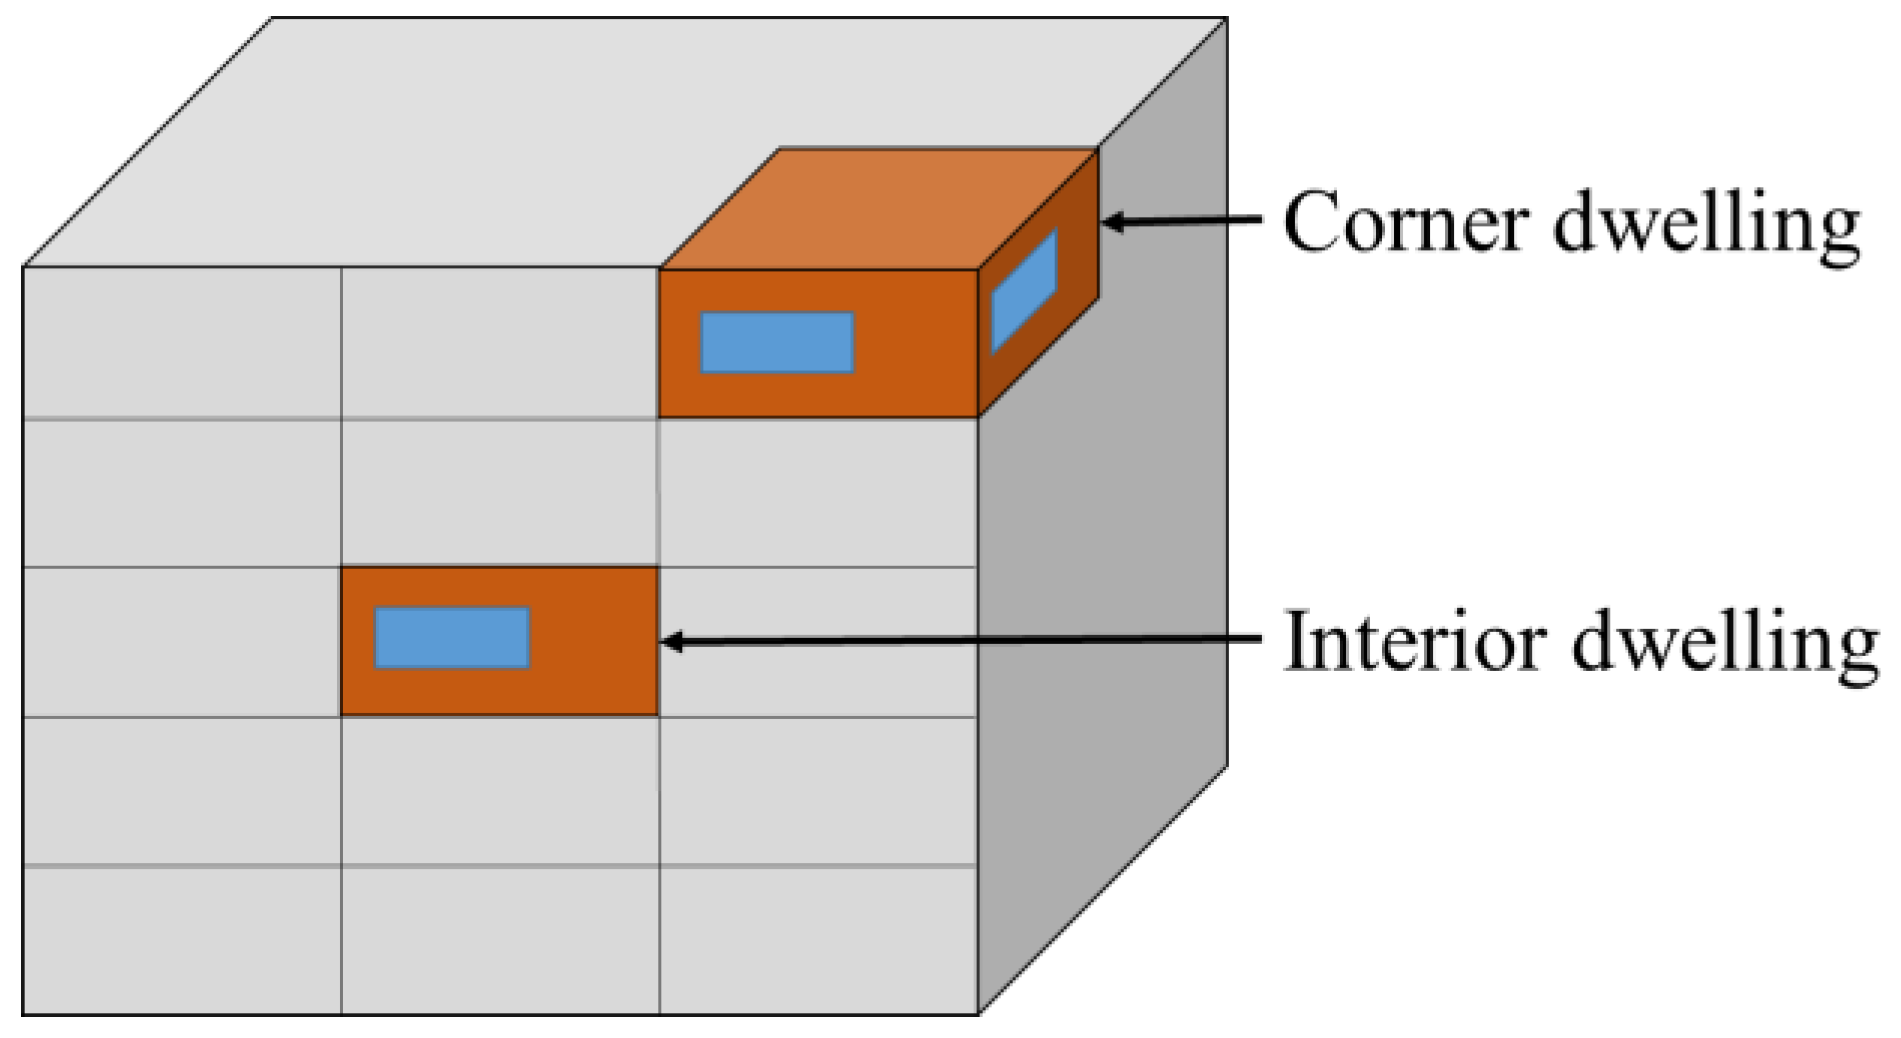
2.3. Simulated Dwellings
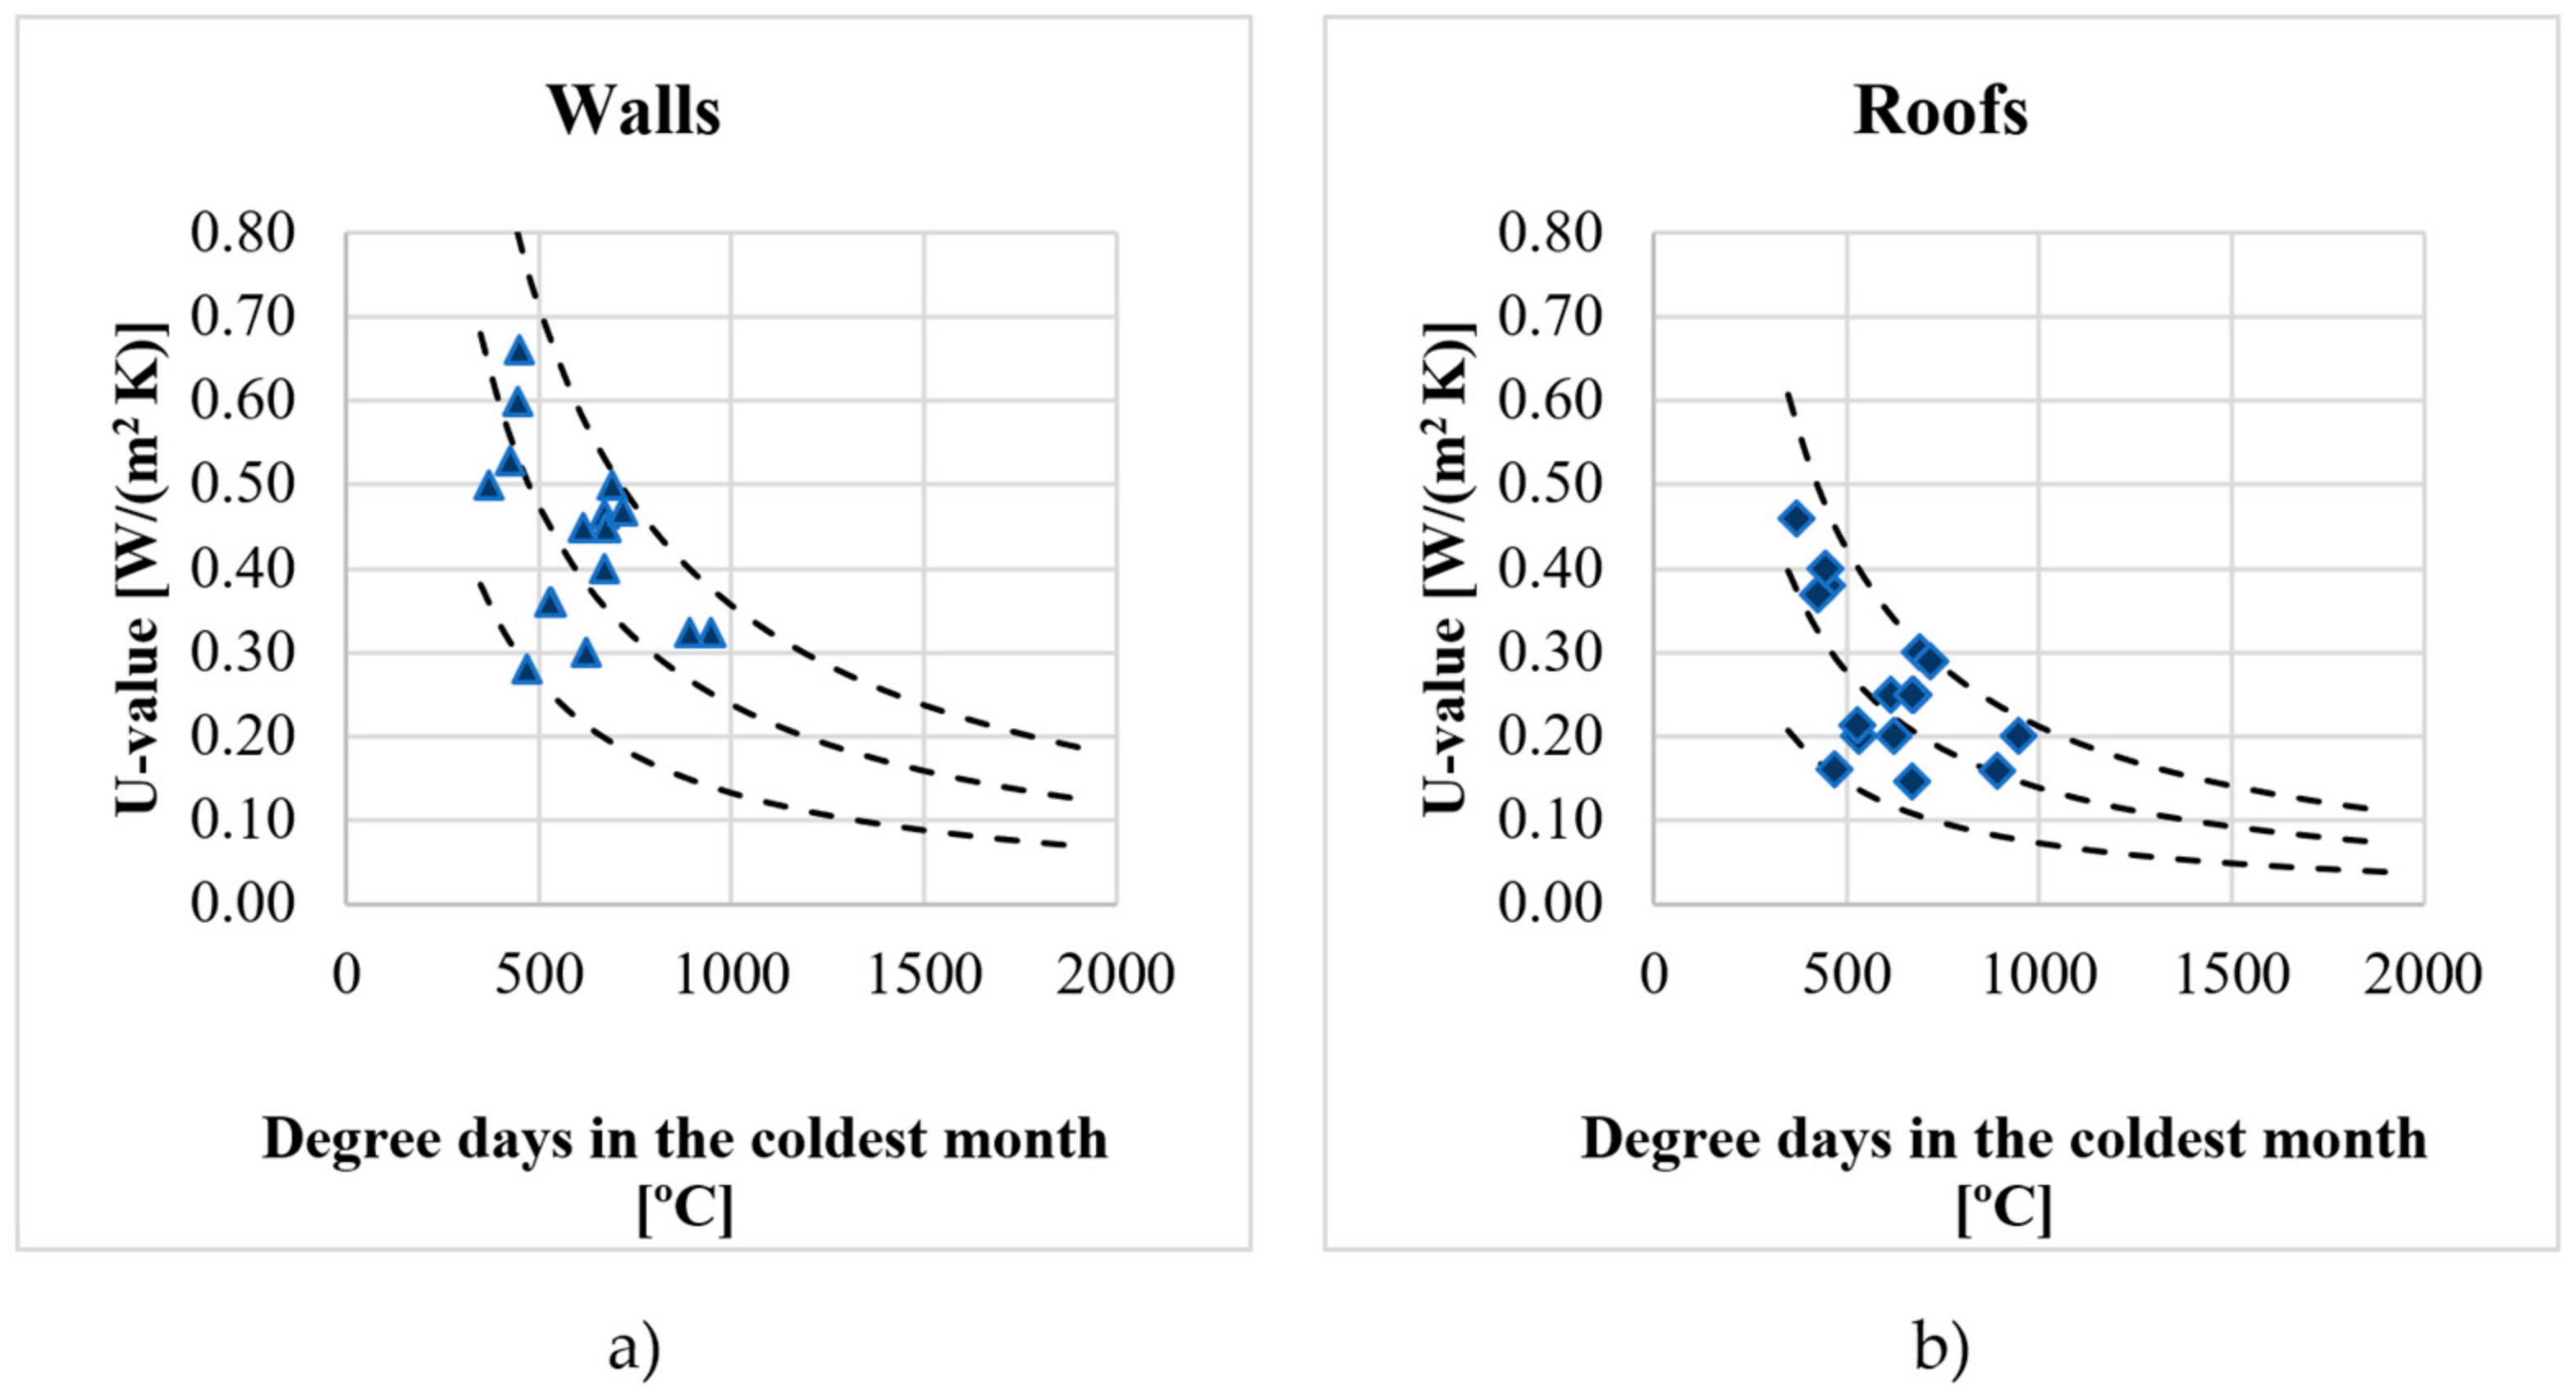
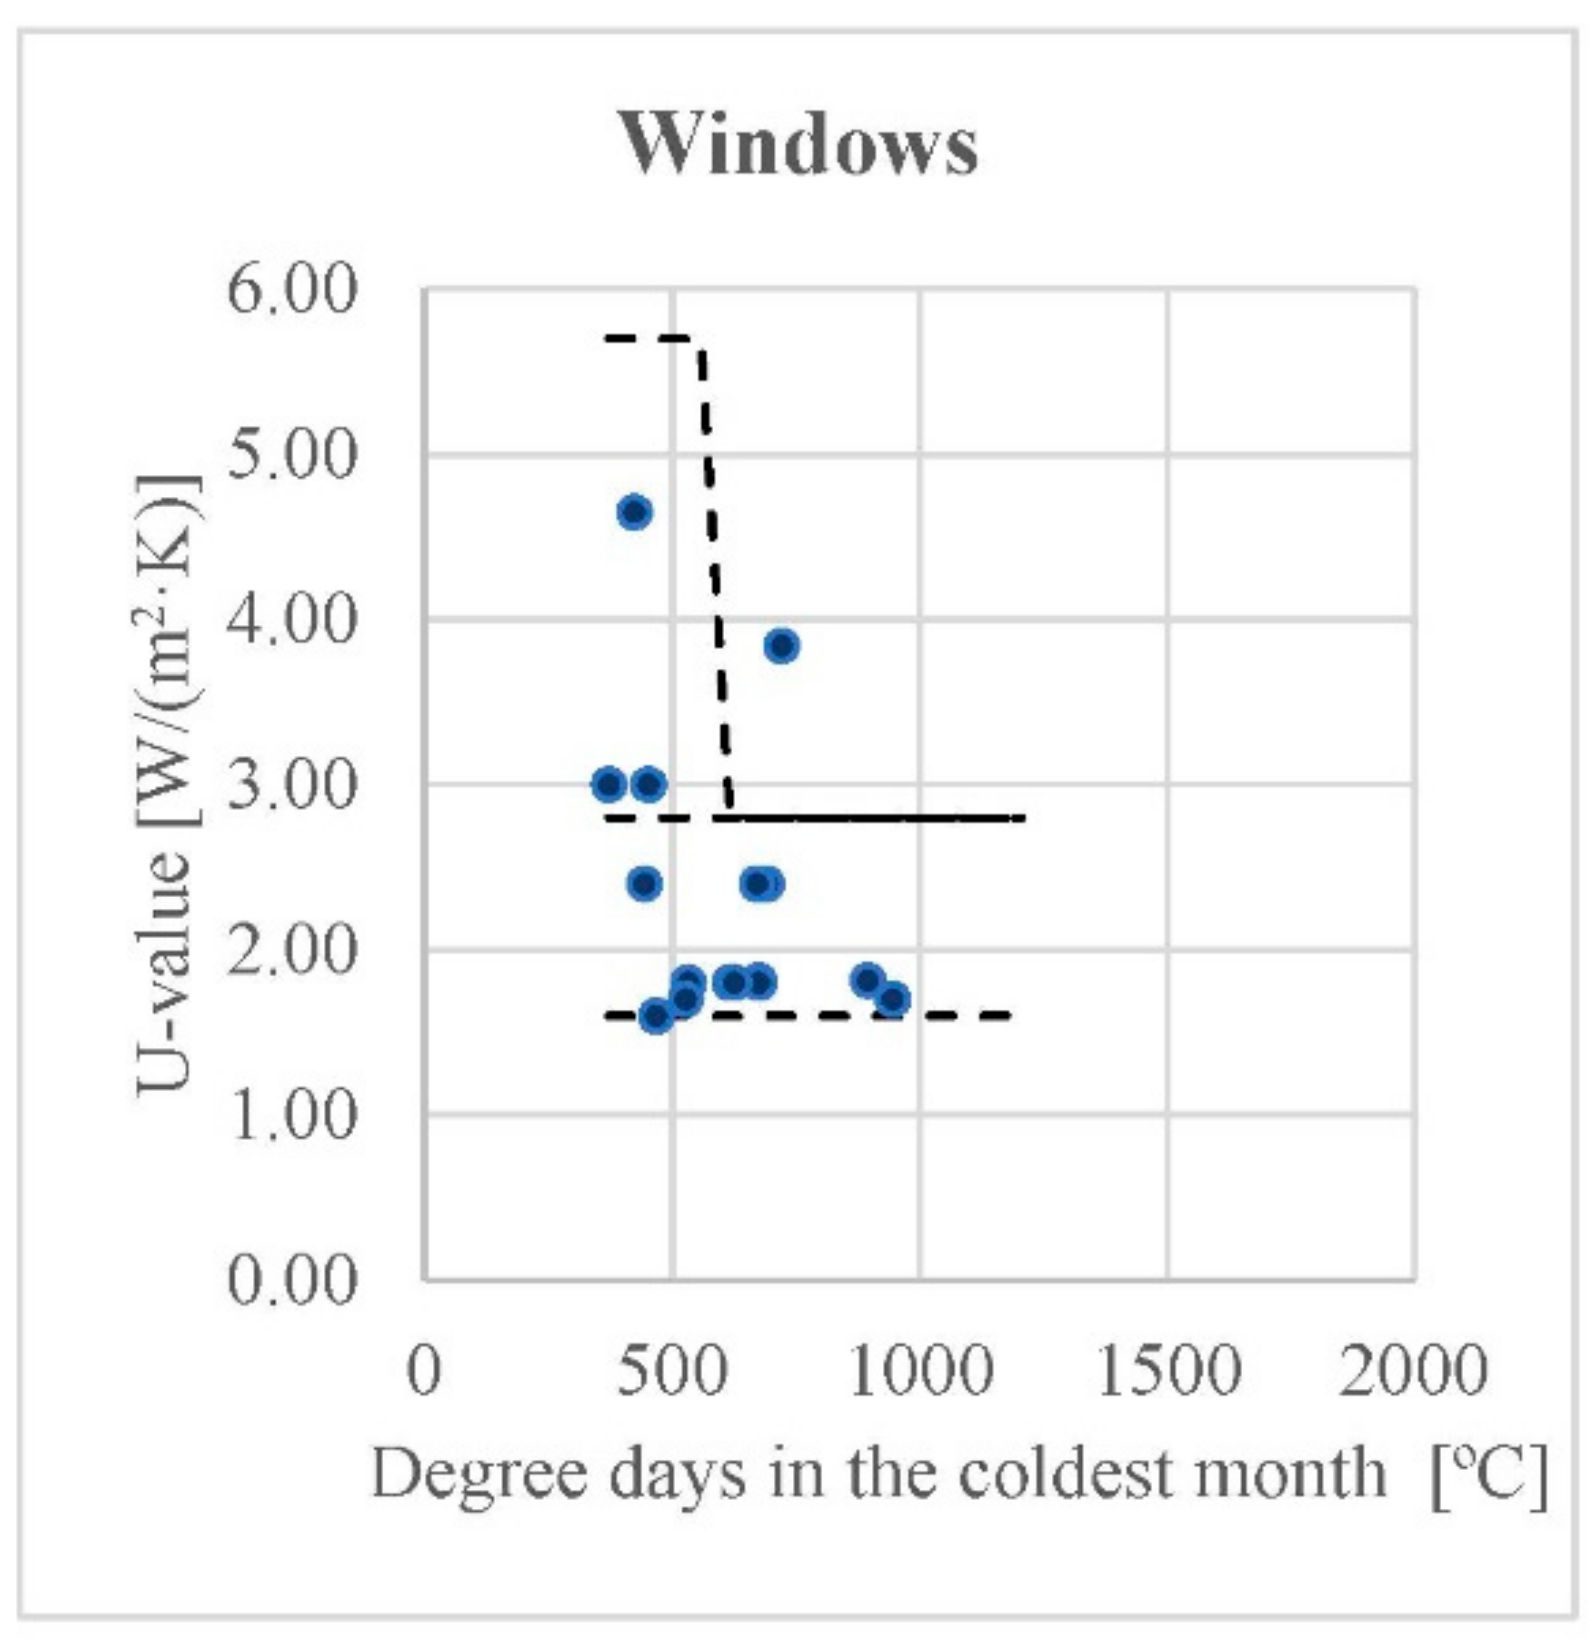
- Insulation was assumed to be consistent with the type of climate. This led us to define a simple relationship or law between the U-value of the building envelope and the climate of each city. This was merely intended to establish a logical and simple evolution between the U-value and the climate conditions to obtain coherent results. For the definition of said law, the normative values existing in a large number of countries were taken into account in such a way that although the values used in this study do not necessarily coincide with those required in each place, they are based on them.
- Three building types corresponding to levels of insulation—high, intermediate, or low—were simulated per climate. As a consequence of the definition of a law for the U-value that is applicable to this article, the results and conclusions may be expected to be framed only within a theoretical scope, without any relation to reality. To avoid this, three levels of insulation were established for each location so that, in all cases, the actual insulation values were within the proposed insulation limits. In other words, it is possible that in some cases the regulations of a certain city require a much lower U-value than other legislations for similar climates. In those cases, the established law that defines highly insulated buildings will generate a U-value that satisfies the required normative U-values. Similarly, the law that defines poorly insulated cases guarantees that, for a city in which a higher U-value is required than that which would be required by other legislations for similar climates, the generated U-value is close to that in the regulations in that place. On the other hand, in each city, there are both real buildings that exceed the requirements of current regulations and others that do not comply with them, due to their age or other reasons. In any case, establishing a law that limits the U-values in each city between an upper and lower limit based on the regulations of each region will probably include most of the existing buildings in each of the studied cities.
- Since the insulation was assumed to be consistent with the type of climate, a poorly insulated building in a very cold climate was deemed to be better insulated than a poorly insulated building in a climate with milder winters.
- The reference values assigned to the three levels of building insulation in each climate were drawn from the existing legislation in the different areas (see Table 1).

| Country | Area | Köppen–Geiger Class | DDCM | U-Value (Walls) | U-Value (Roof) | U-Value (Windows) | Ref. |
|---|---|---|---|---|---|---|---|
| °C | W/(m2 K) | W/(m2 K) | W/(m2 K) | ||||
| Italy | Lazio (Rome) | Csa | 372 | 0.50 | 0.46 | [34] | |
| Japan | Kanto (Tokyo) | Cfa | 423 | 0.53 | 0.37 | 4.65 | [35] |
| Turkey | Istanbul | Csa | 444 | 0.60 | 0.40 | 2.40 | [36] |
| Spain | Madrid | BSk | 452 | 0.66 | 0.38 | 3.00 | [37] |
| United Kingdom | London | Cfb | 467 | 0.28 | 0.16 | 1.6 | [38] |
| Canada | British Columbia (Vancouver) | Csb | 526 | 0.36 | 0.21 | 1.70 | [39] |
| France | Ile-de-France (Paris) | Cfb | 532 | 0.36 | 0.20 | [34] | |
| South Korea | Kwangju-jikhalsi | Dfa | 617 | 0.45 | 0.25 | 1.80 | [40] |
| Germany | Berlin | Dfb | 625 | 0.30 | 0.20 | [34] | |
| Turkey | Yozgat | Dsb | 671 | 0.40 | 0.25 | 2.40 | [36] |
| United States | New York | Dfa | 674 | 0.46 | 0.15 | 1.81 | [41] |
| Hungary | Budapest | Dfa | 675 | 0.45 | 0.25 | 1.80 | [34] |
| South Korea | Seoul-jikhalsi | Dwa | 722 | 0.47 | 0.29 | 3.84 | [40] |
| United States | Alaska (Anchorage) | Dsc | 895 | 0.32 | 0.16 | 1.81 | [41] |
| Canada | Ontario (Ottawa) | Dfb | 954 | 0.32 | 0.20 | 1.70 | [39] |
2.4. Simulated Radiant Heating Floors
3. Simulation Results and Discussion
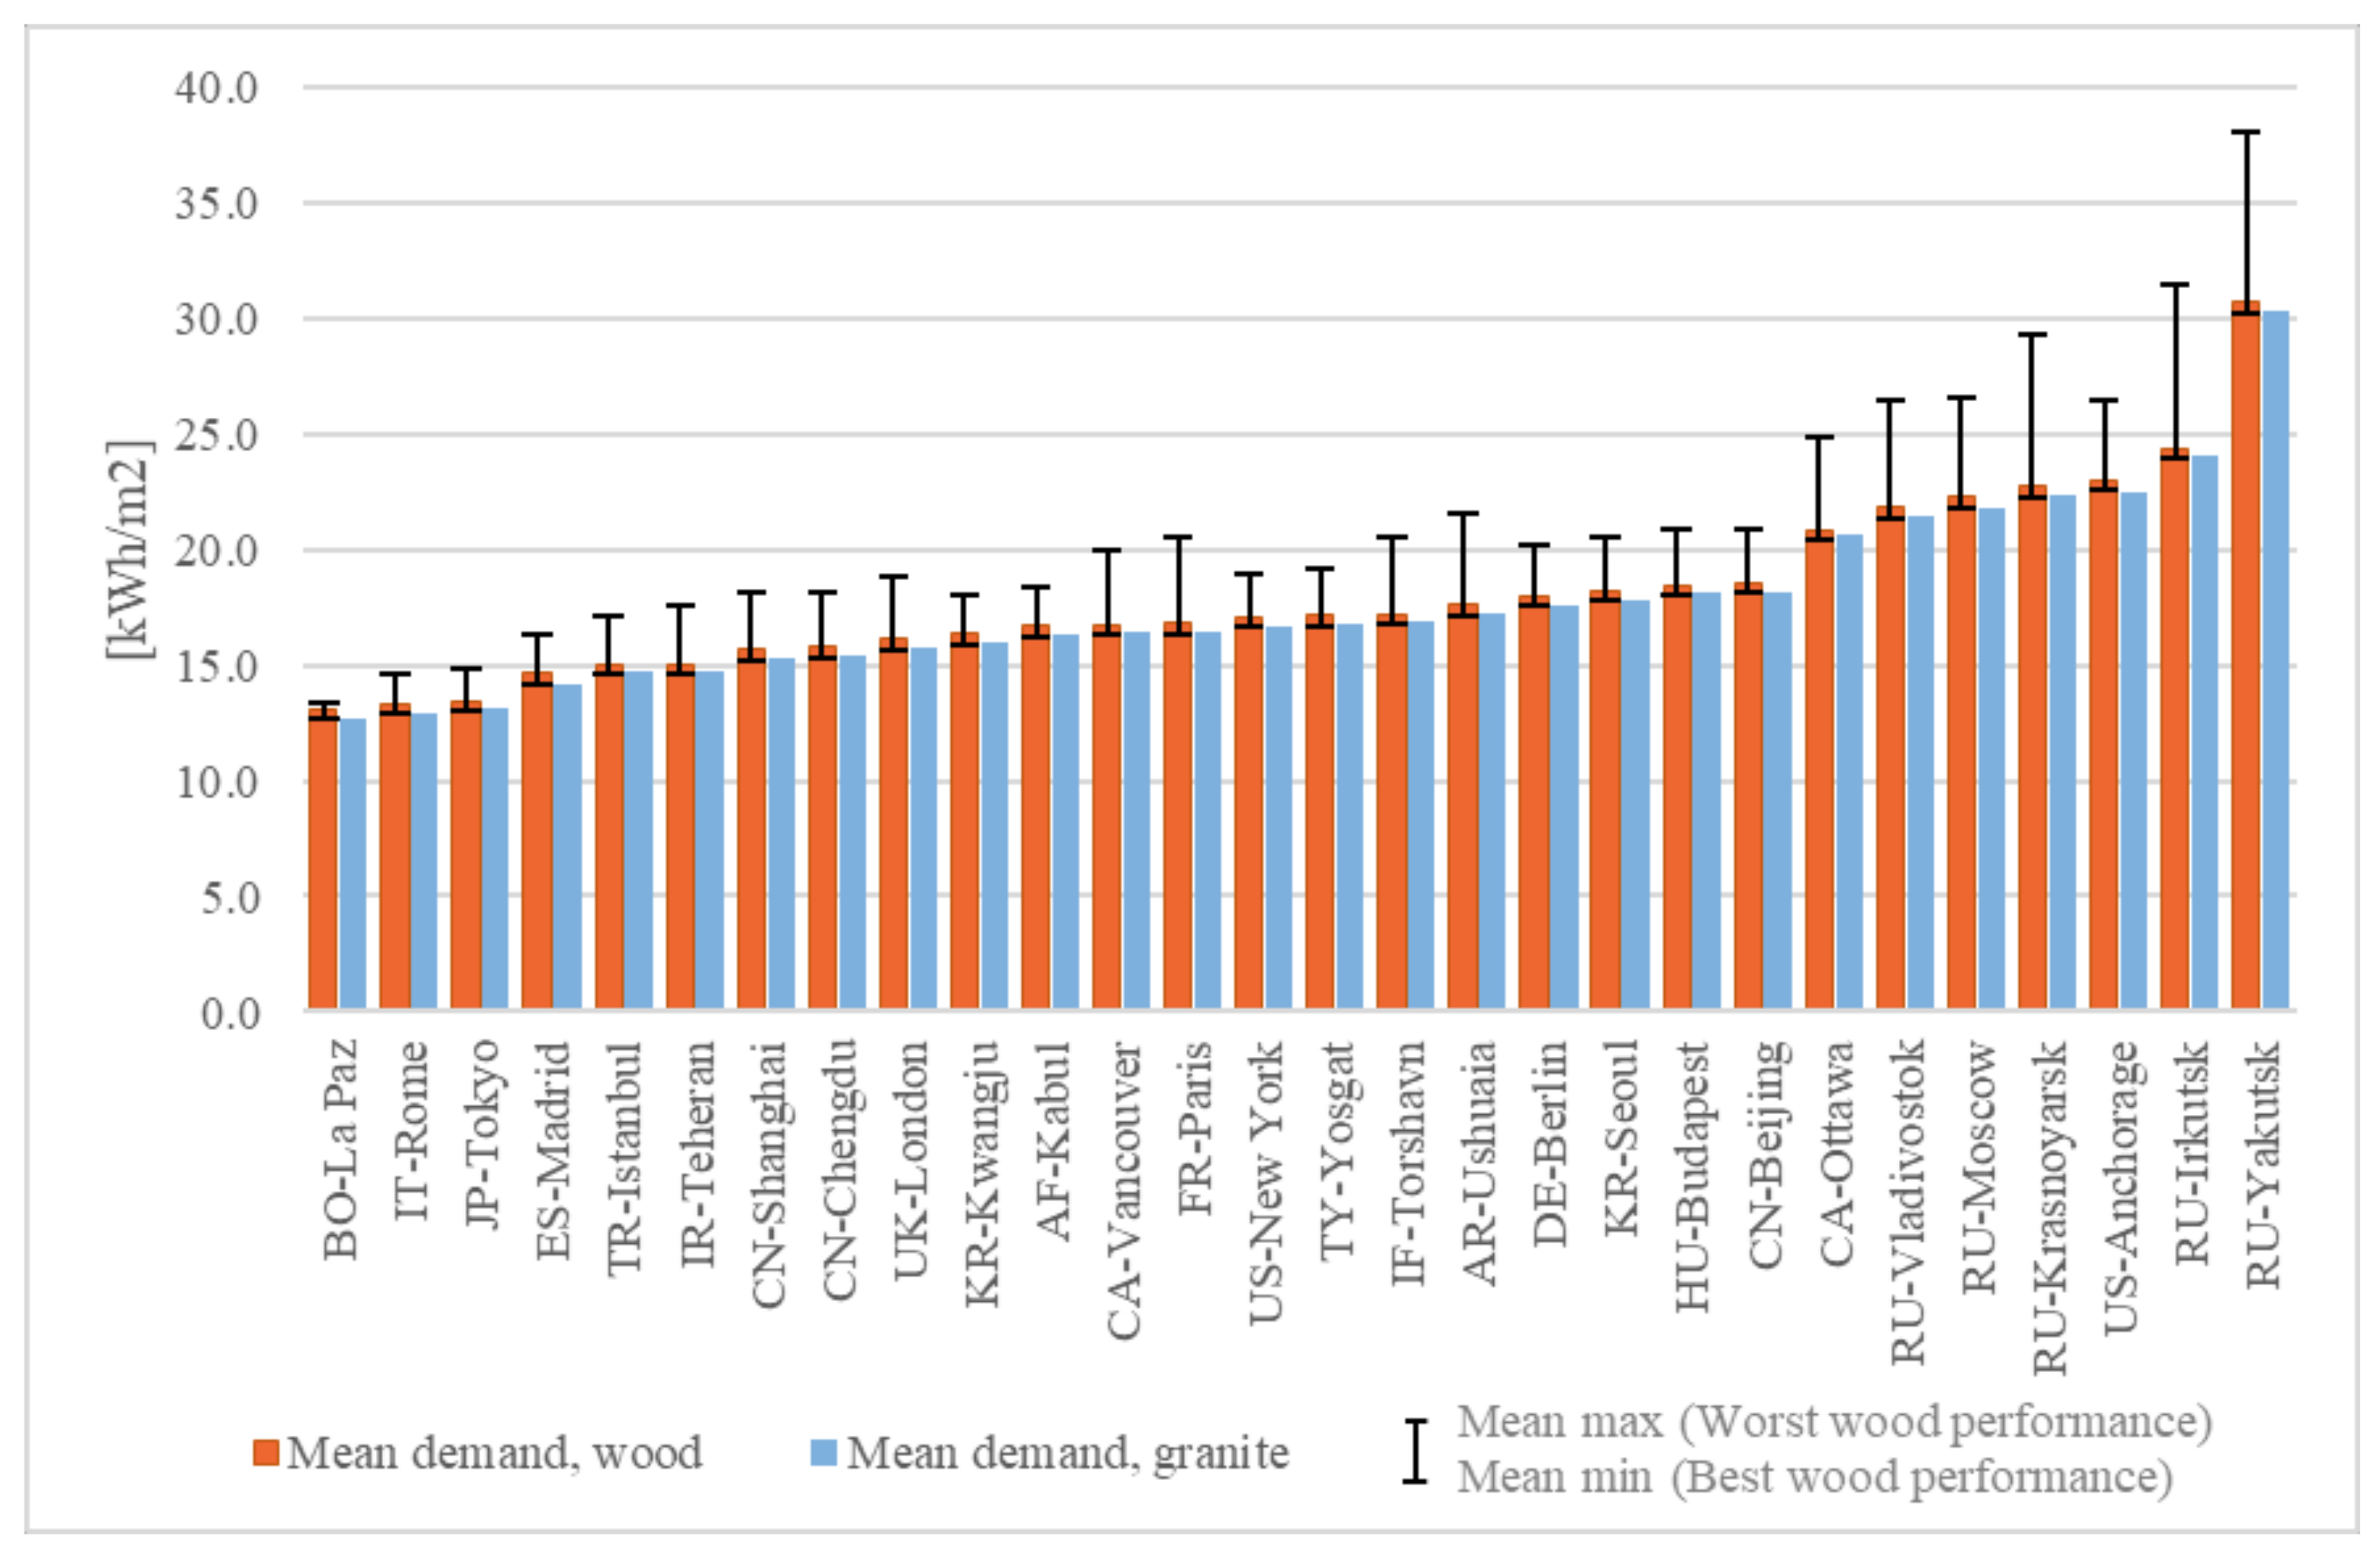
3.1. Overall Results
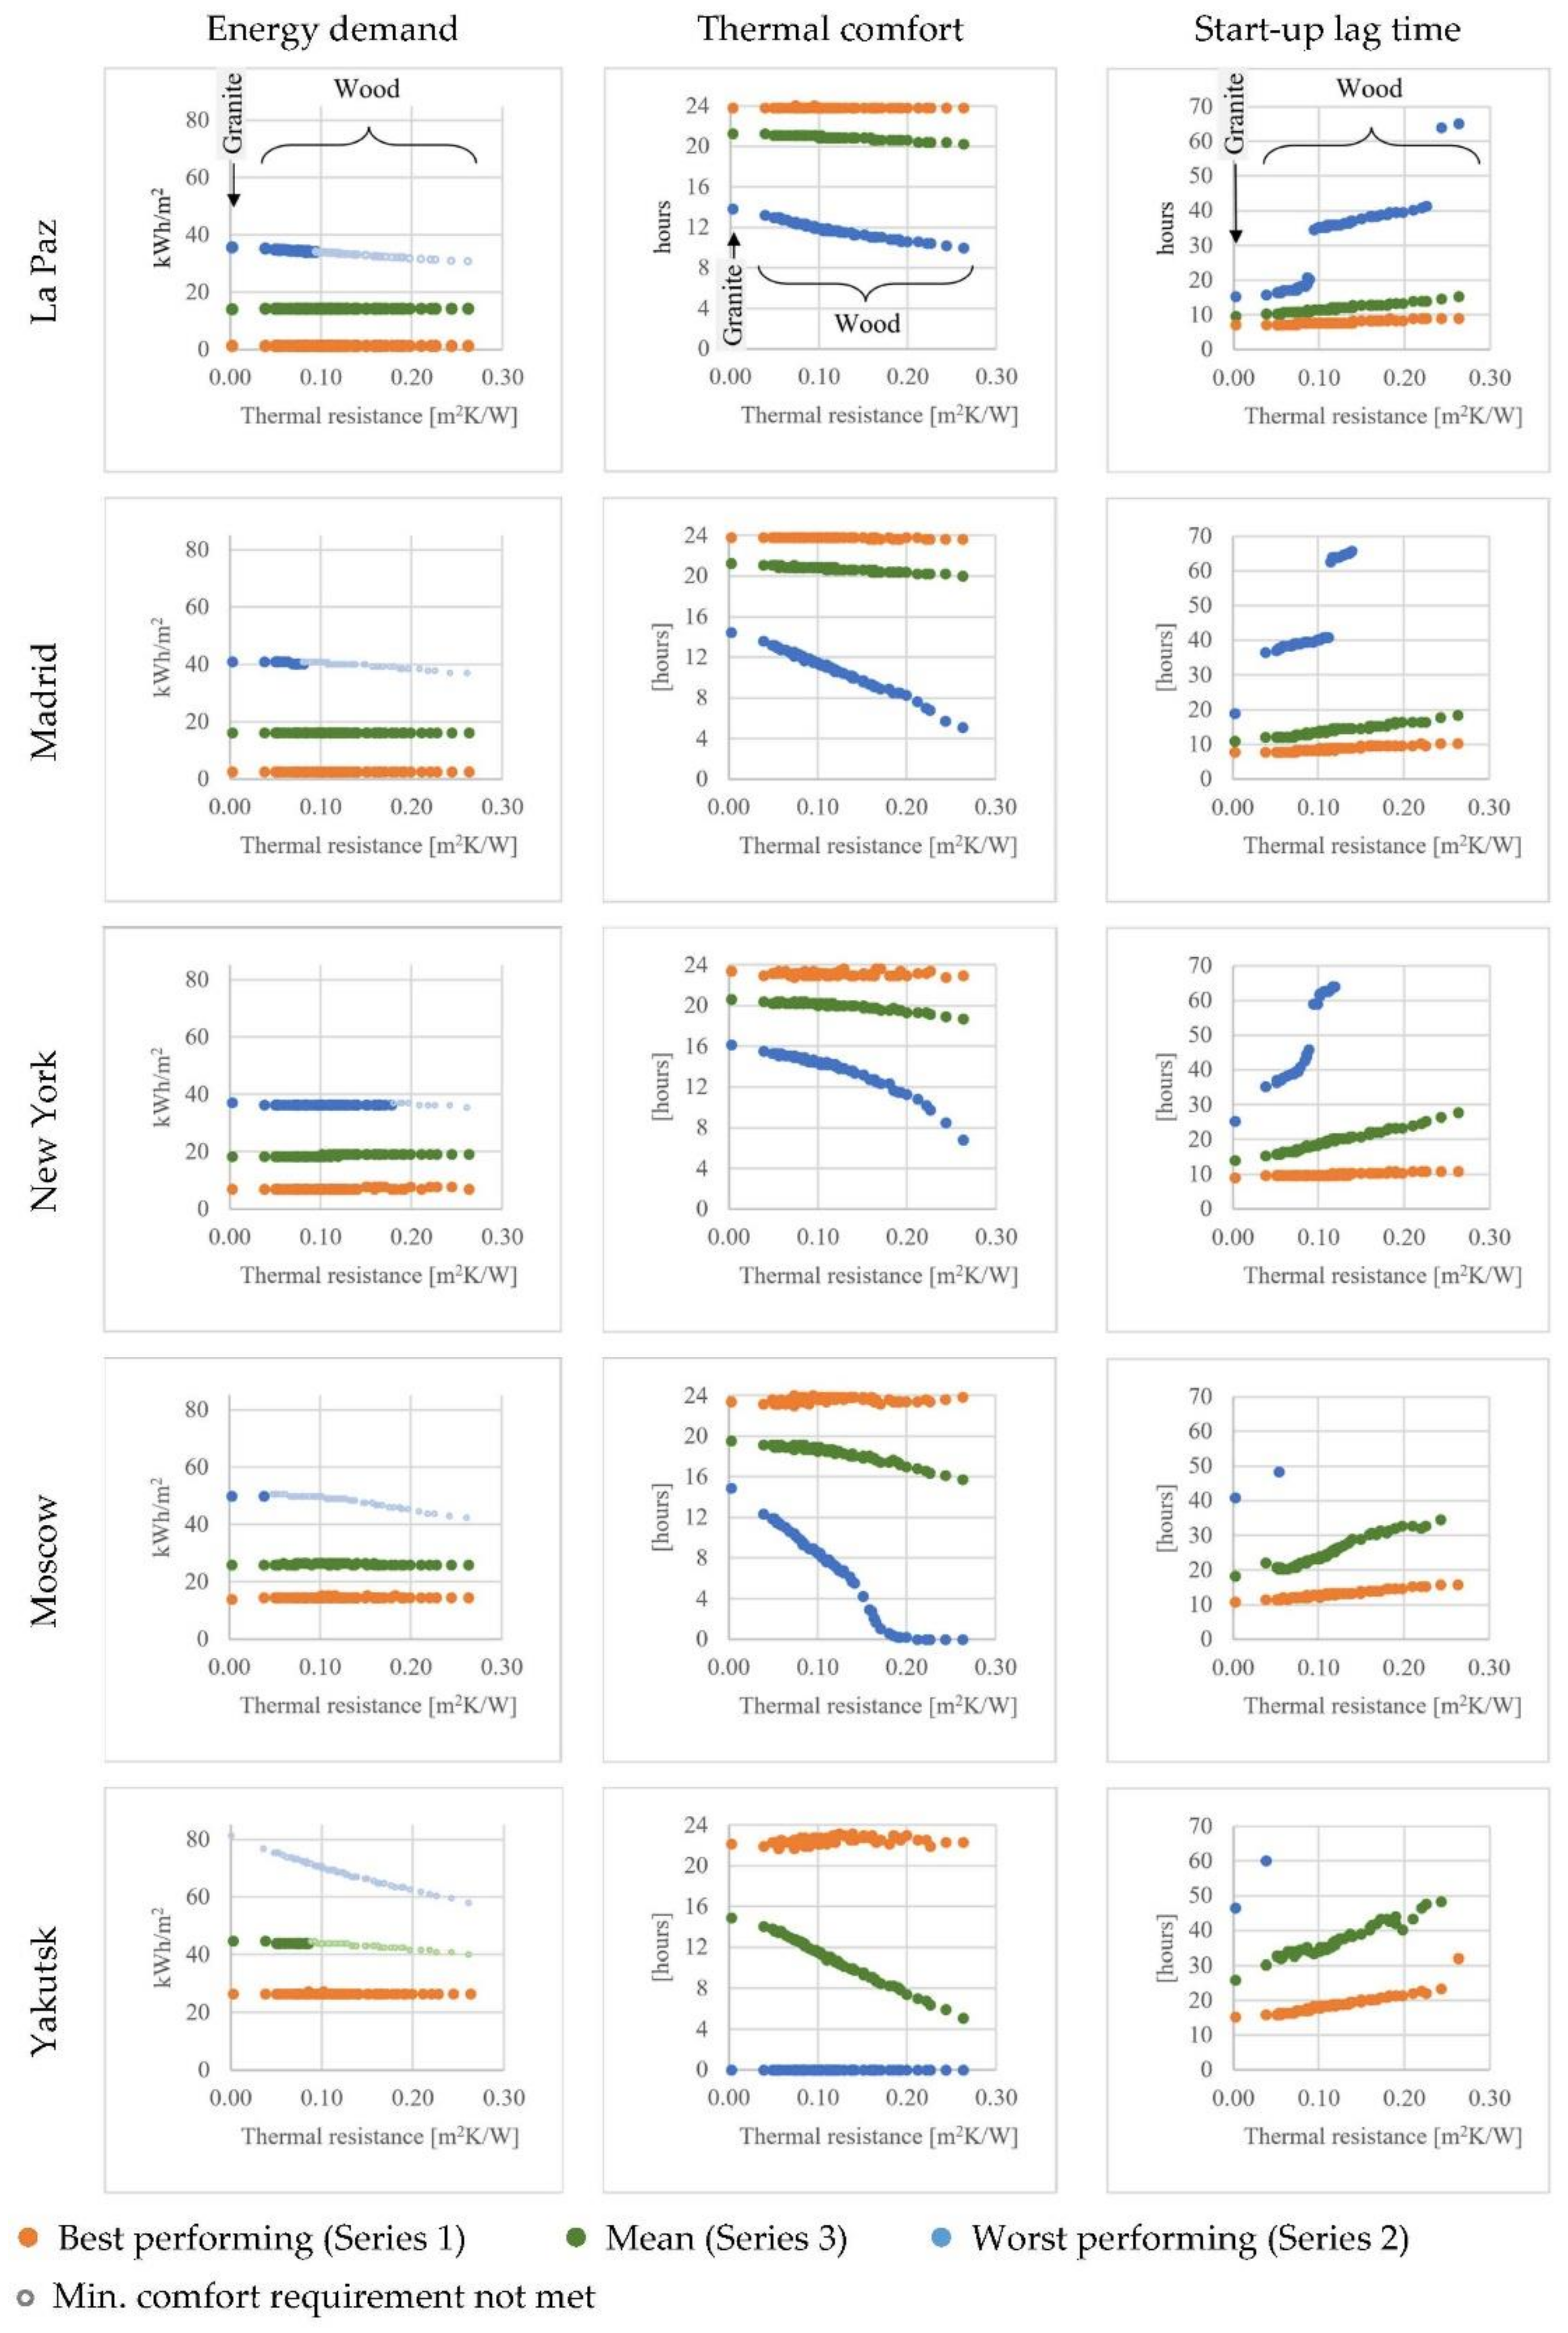
3.2. Comparison of Five Representative Cities
- Dwellings located in climates with moderate or mild winters.
- The vast majority of dwellings in cold climates.
- Low-to-moderate energy demand dwellings in extreme climates.
- Dwellings located in climates with moderate winters.
- Dwellings with low-to-moderate energy demand in mild winters.
- Dwellings with low energy demand in cold climates.
- No dwellings in extreme climates.
- Dwellings with low-to-moderate energy demand in moderate winters.
- Low energy demand dwellings in mild climates.
- No dwellings in cold and extreme climates.
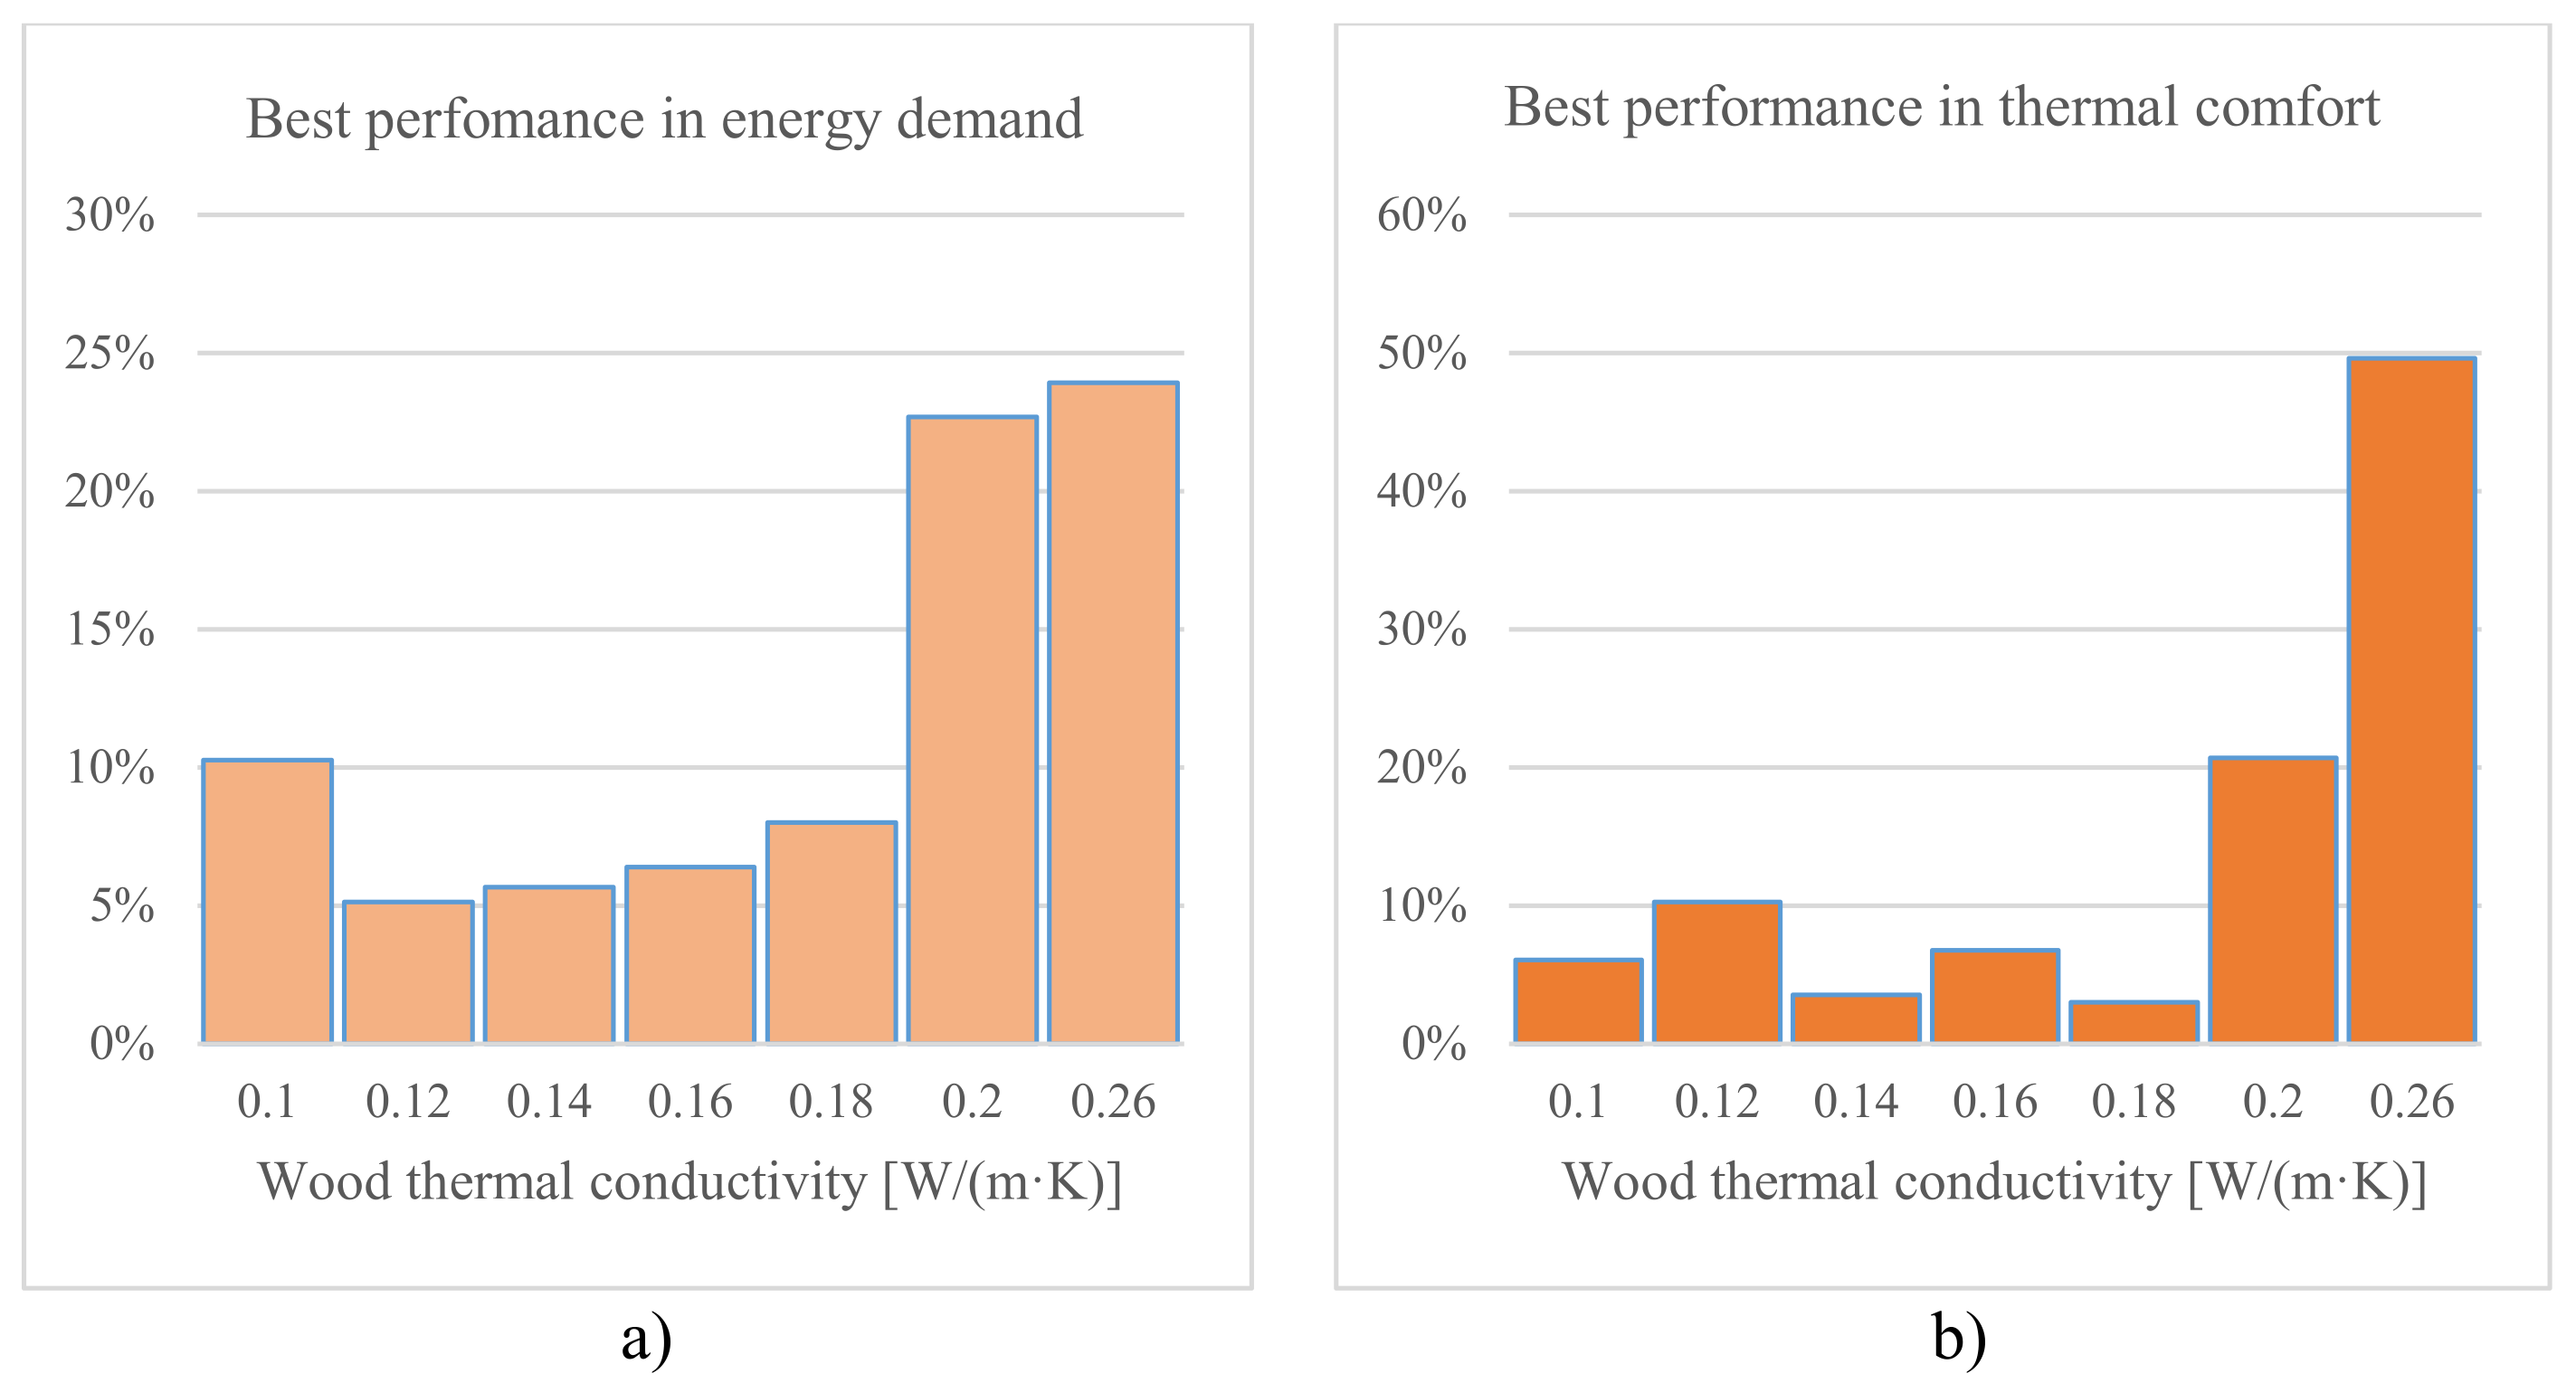
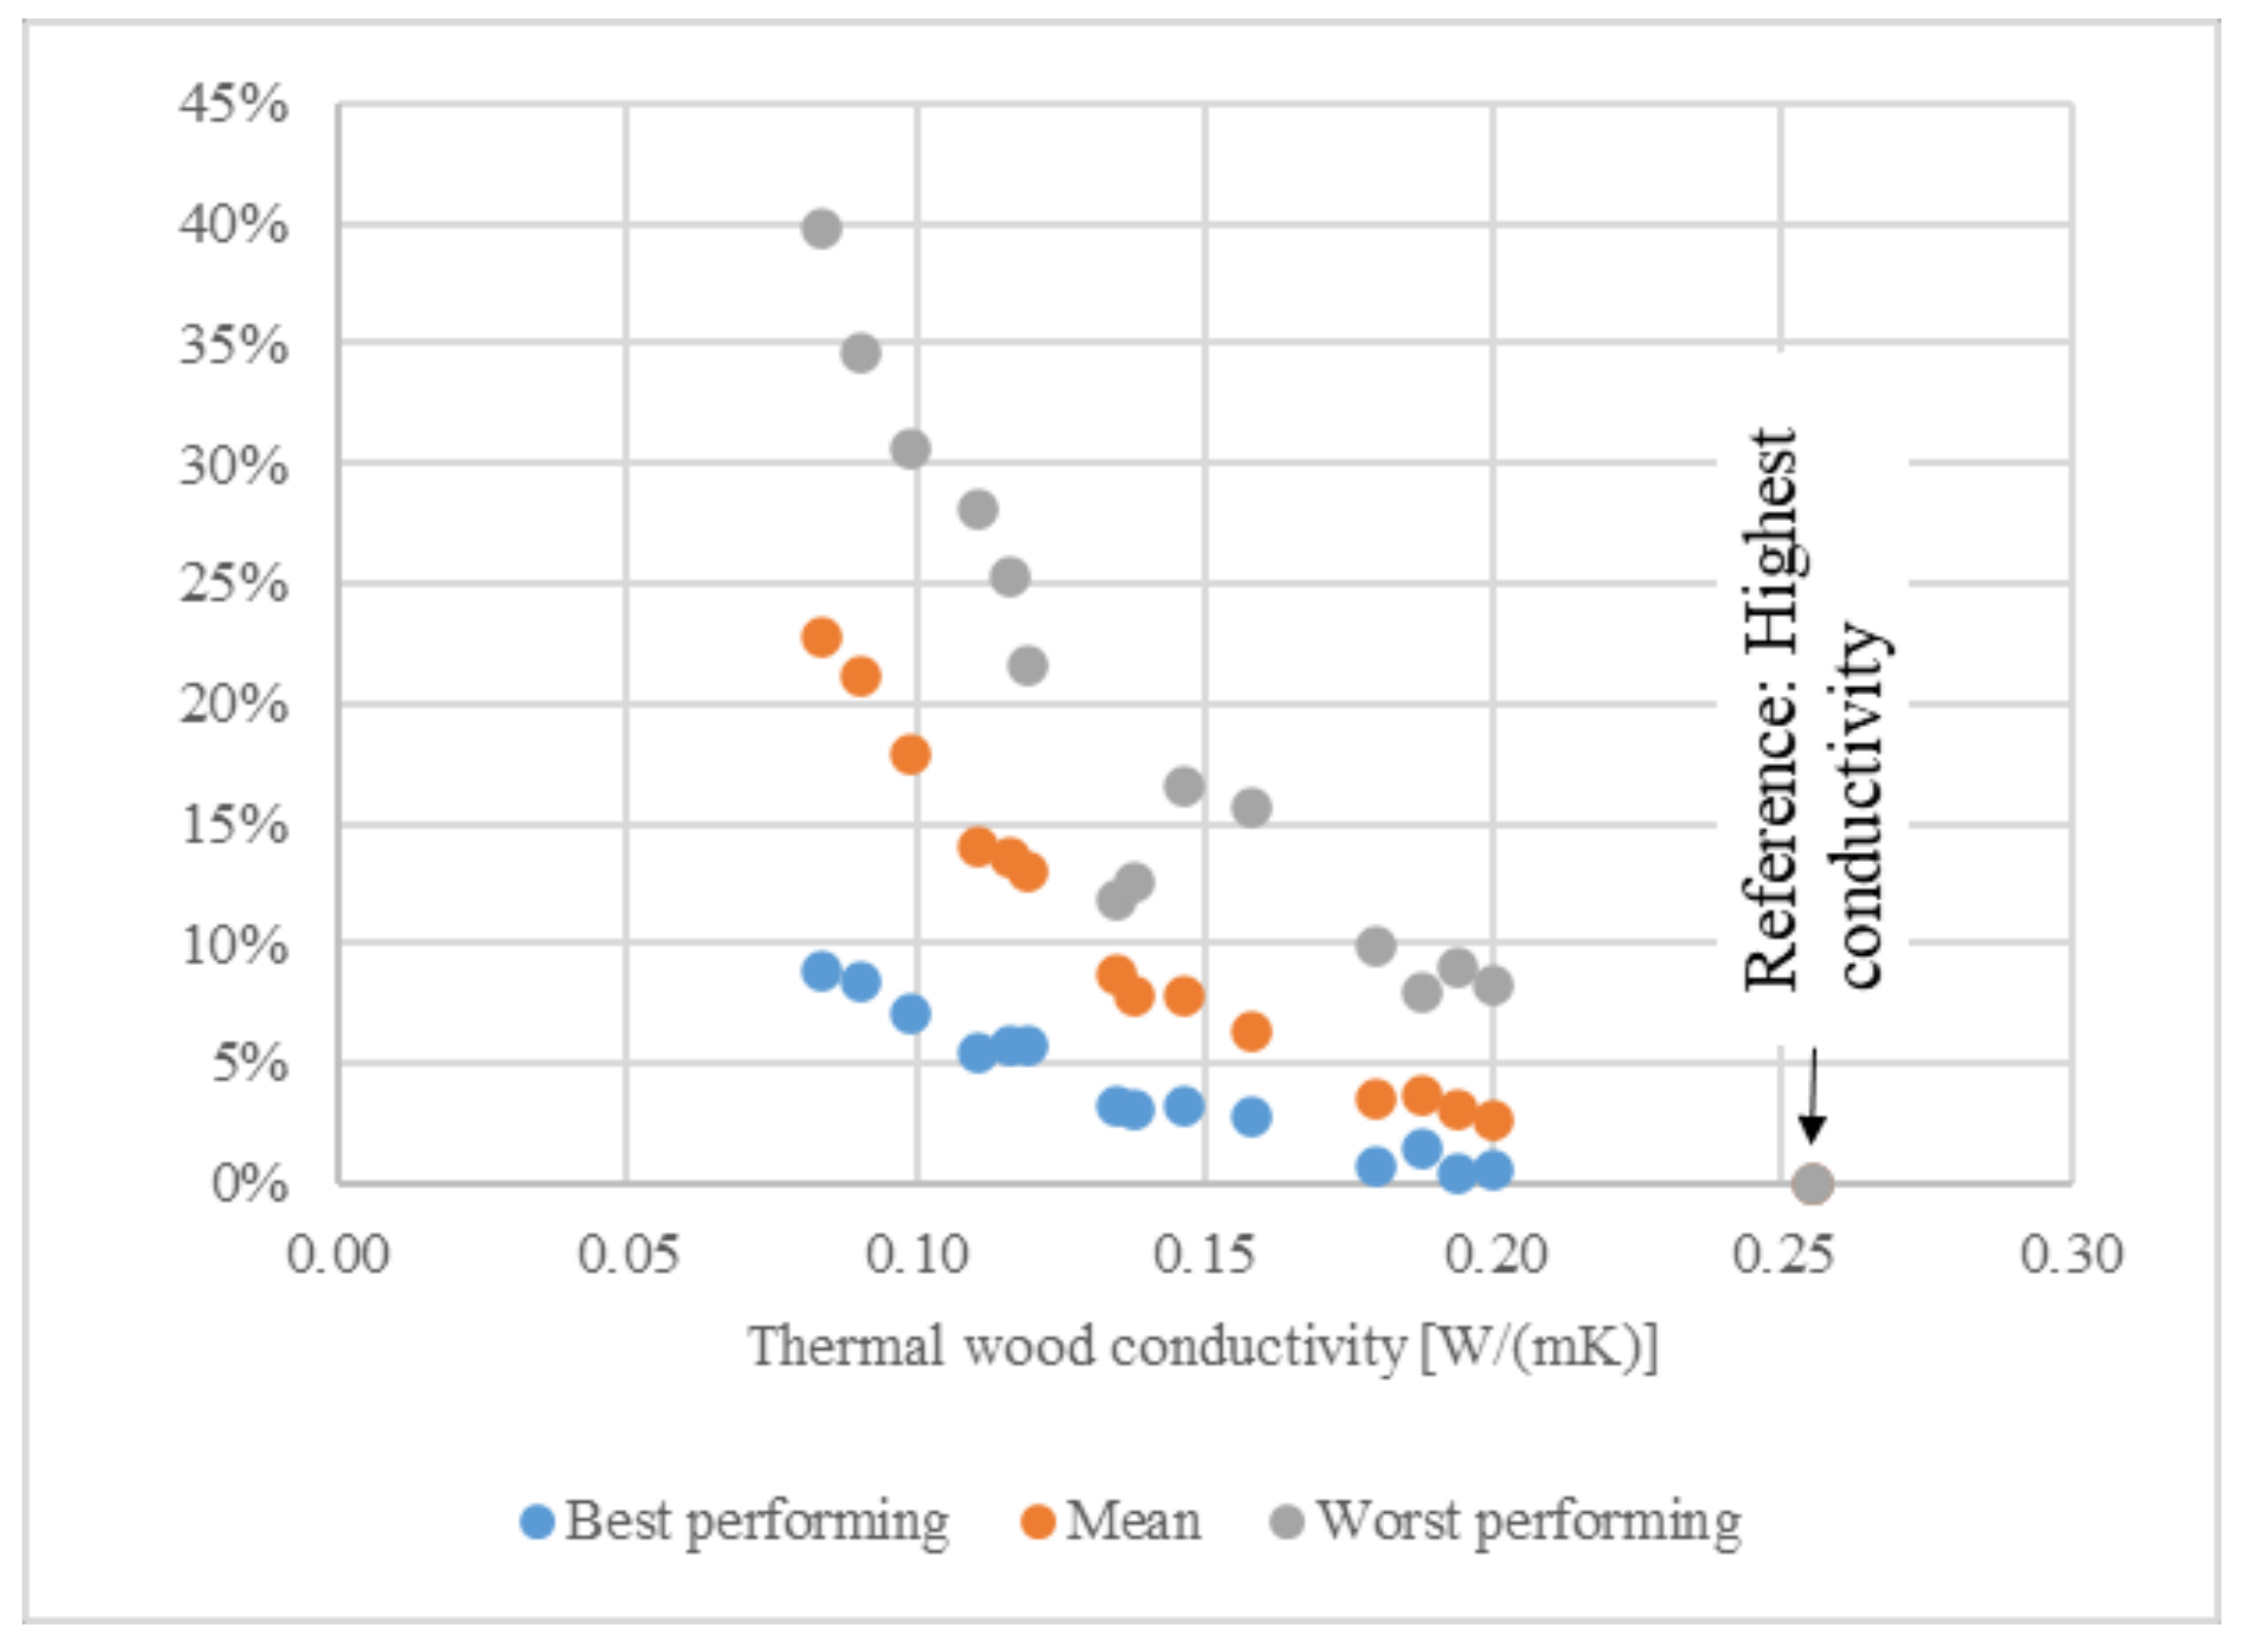
3.3. Effect of Thermal Conductivity
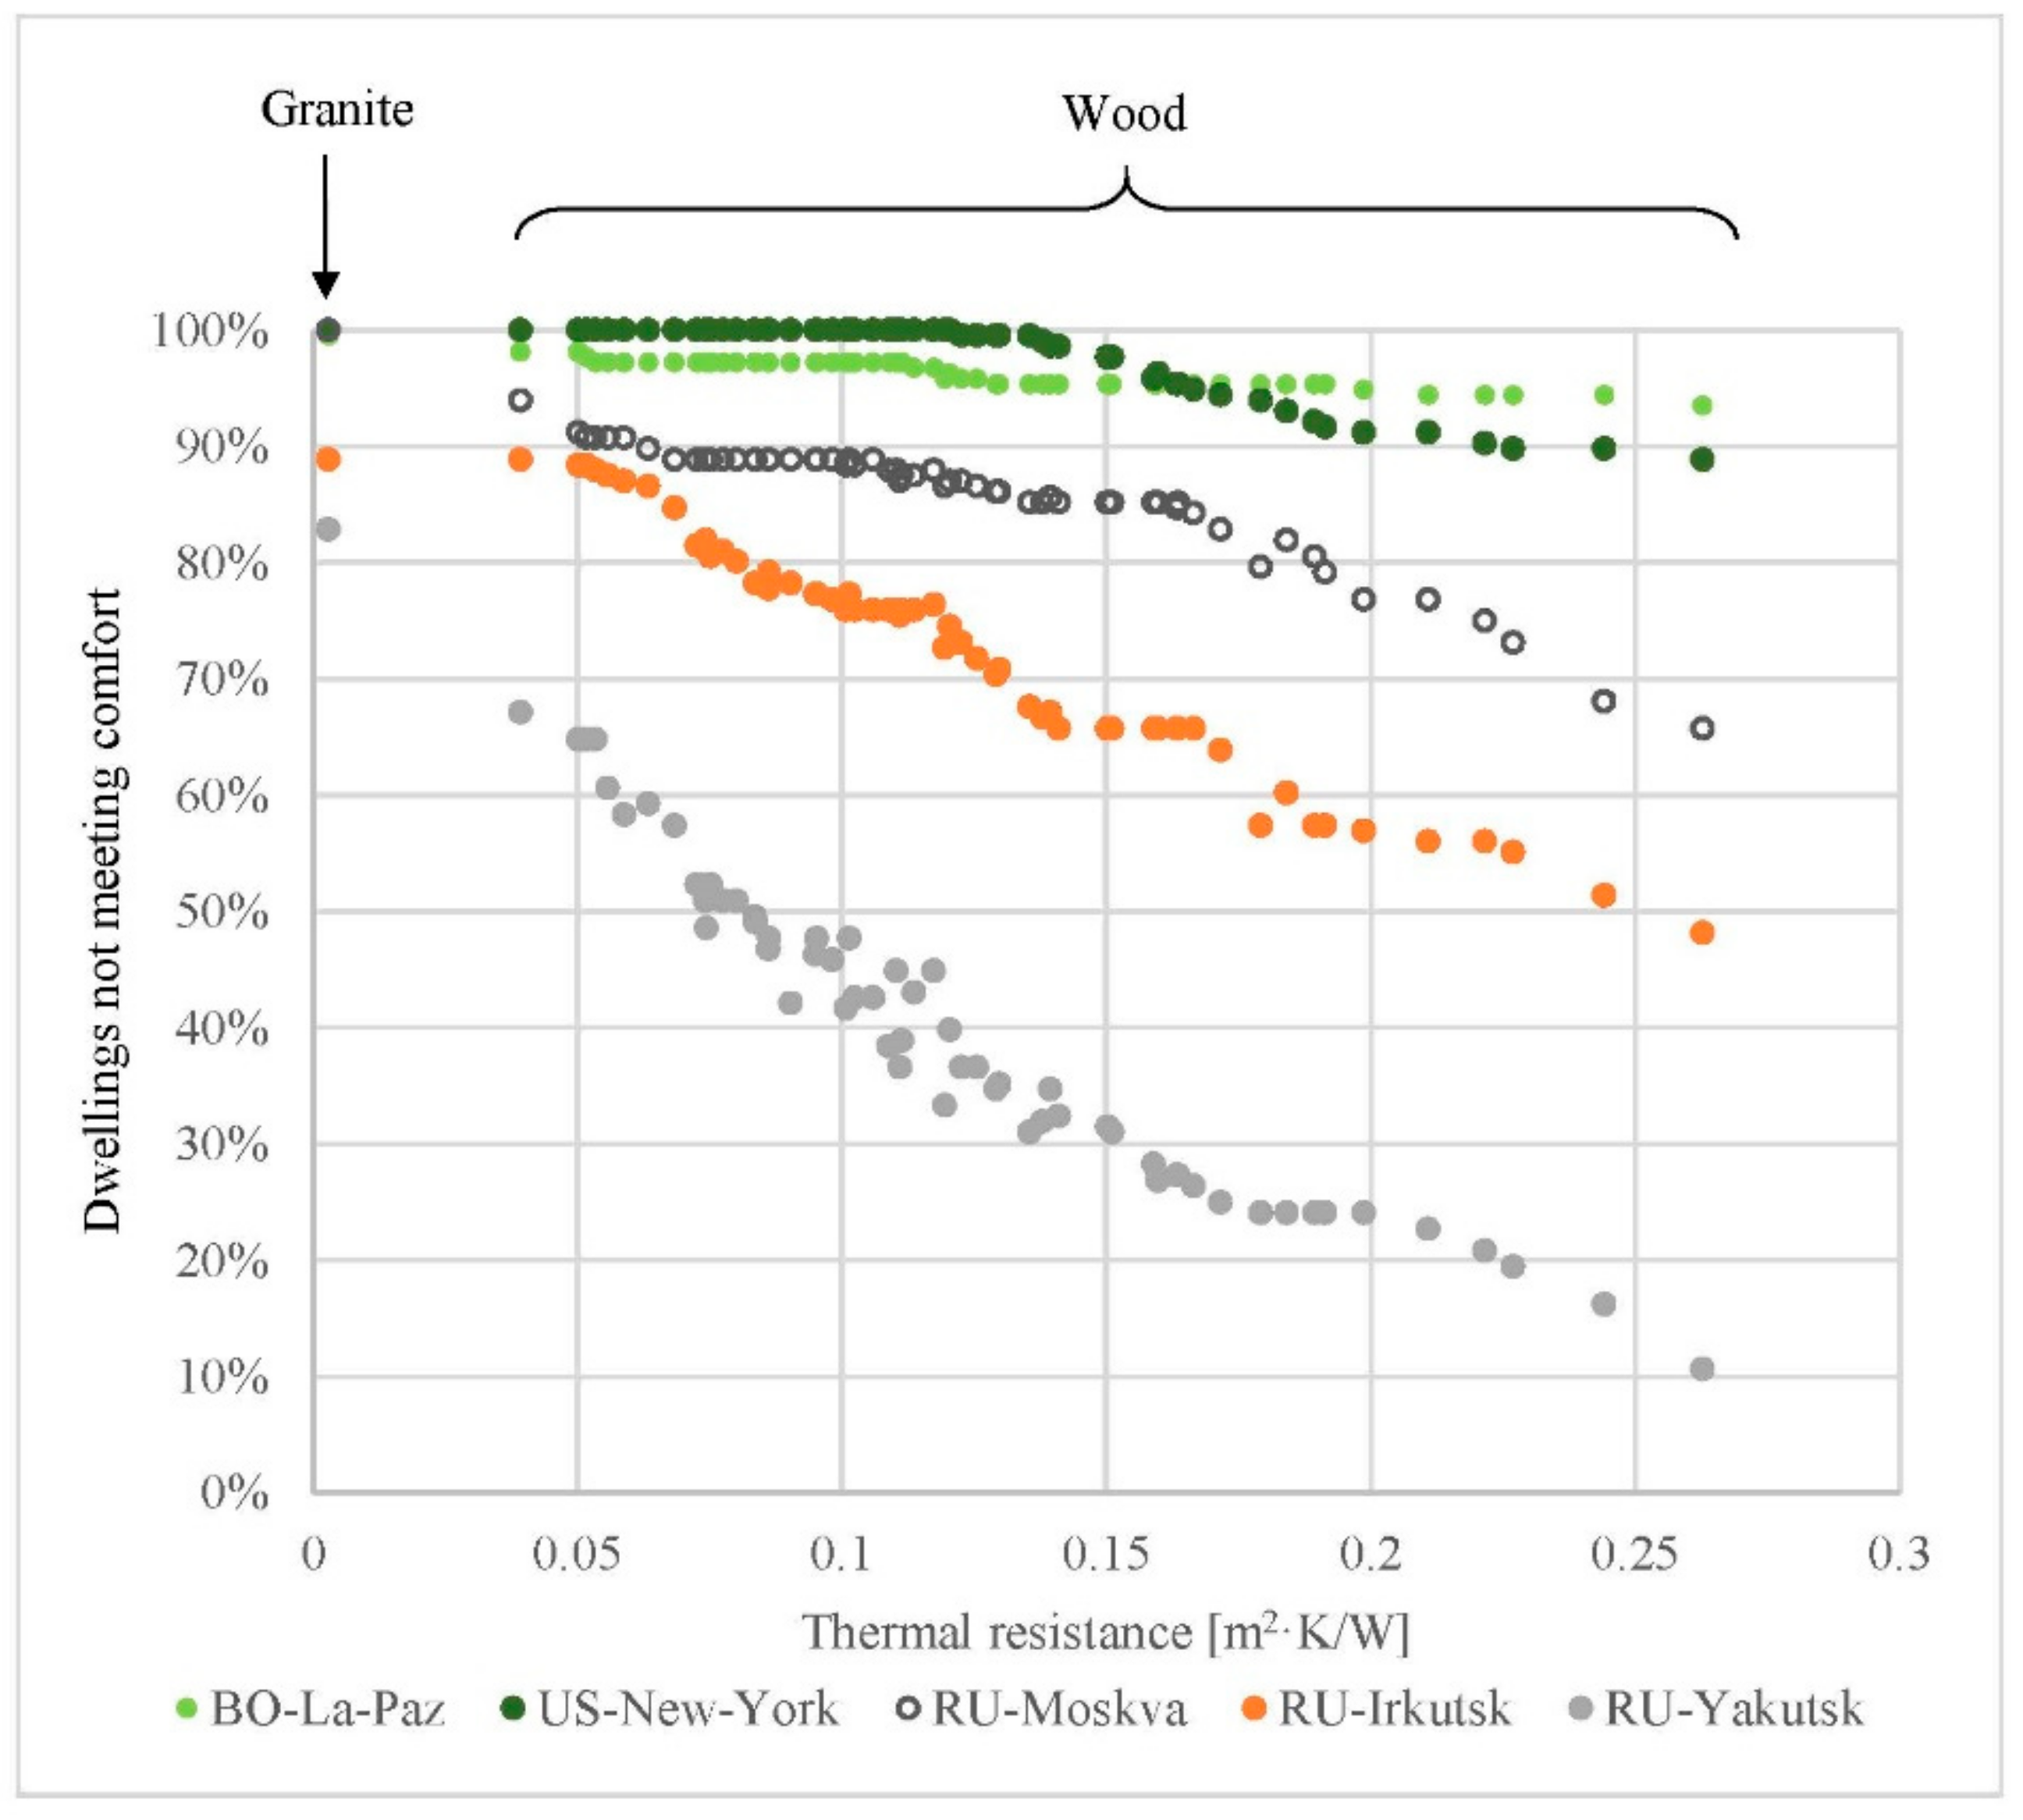
3.4. Effect of Thermal Resistance
- Wooden floors can perform similarly to granite in the vast majority of buildings and climates, although depending on the climate and the quality of the building, the choice of wood properties will be more relevant. In general terms, it can be said that the more severe the winter and the less insulated the house, the more relevant the proper choice of wood properties. In any case, for most situations it is possible to find a wood that offers performance comparable to that of granite.
- On the other hand, it was found that, although in most cases the appropriate choice of wood is the one with the highest thermal conductivity, this is not always the case, and there are cases in which a performance comparable to or even better than that of granite is achieved with low thermal conductivity wood.
4. Conclusions
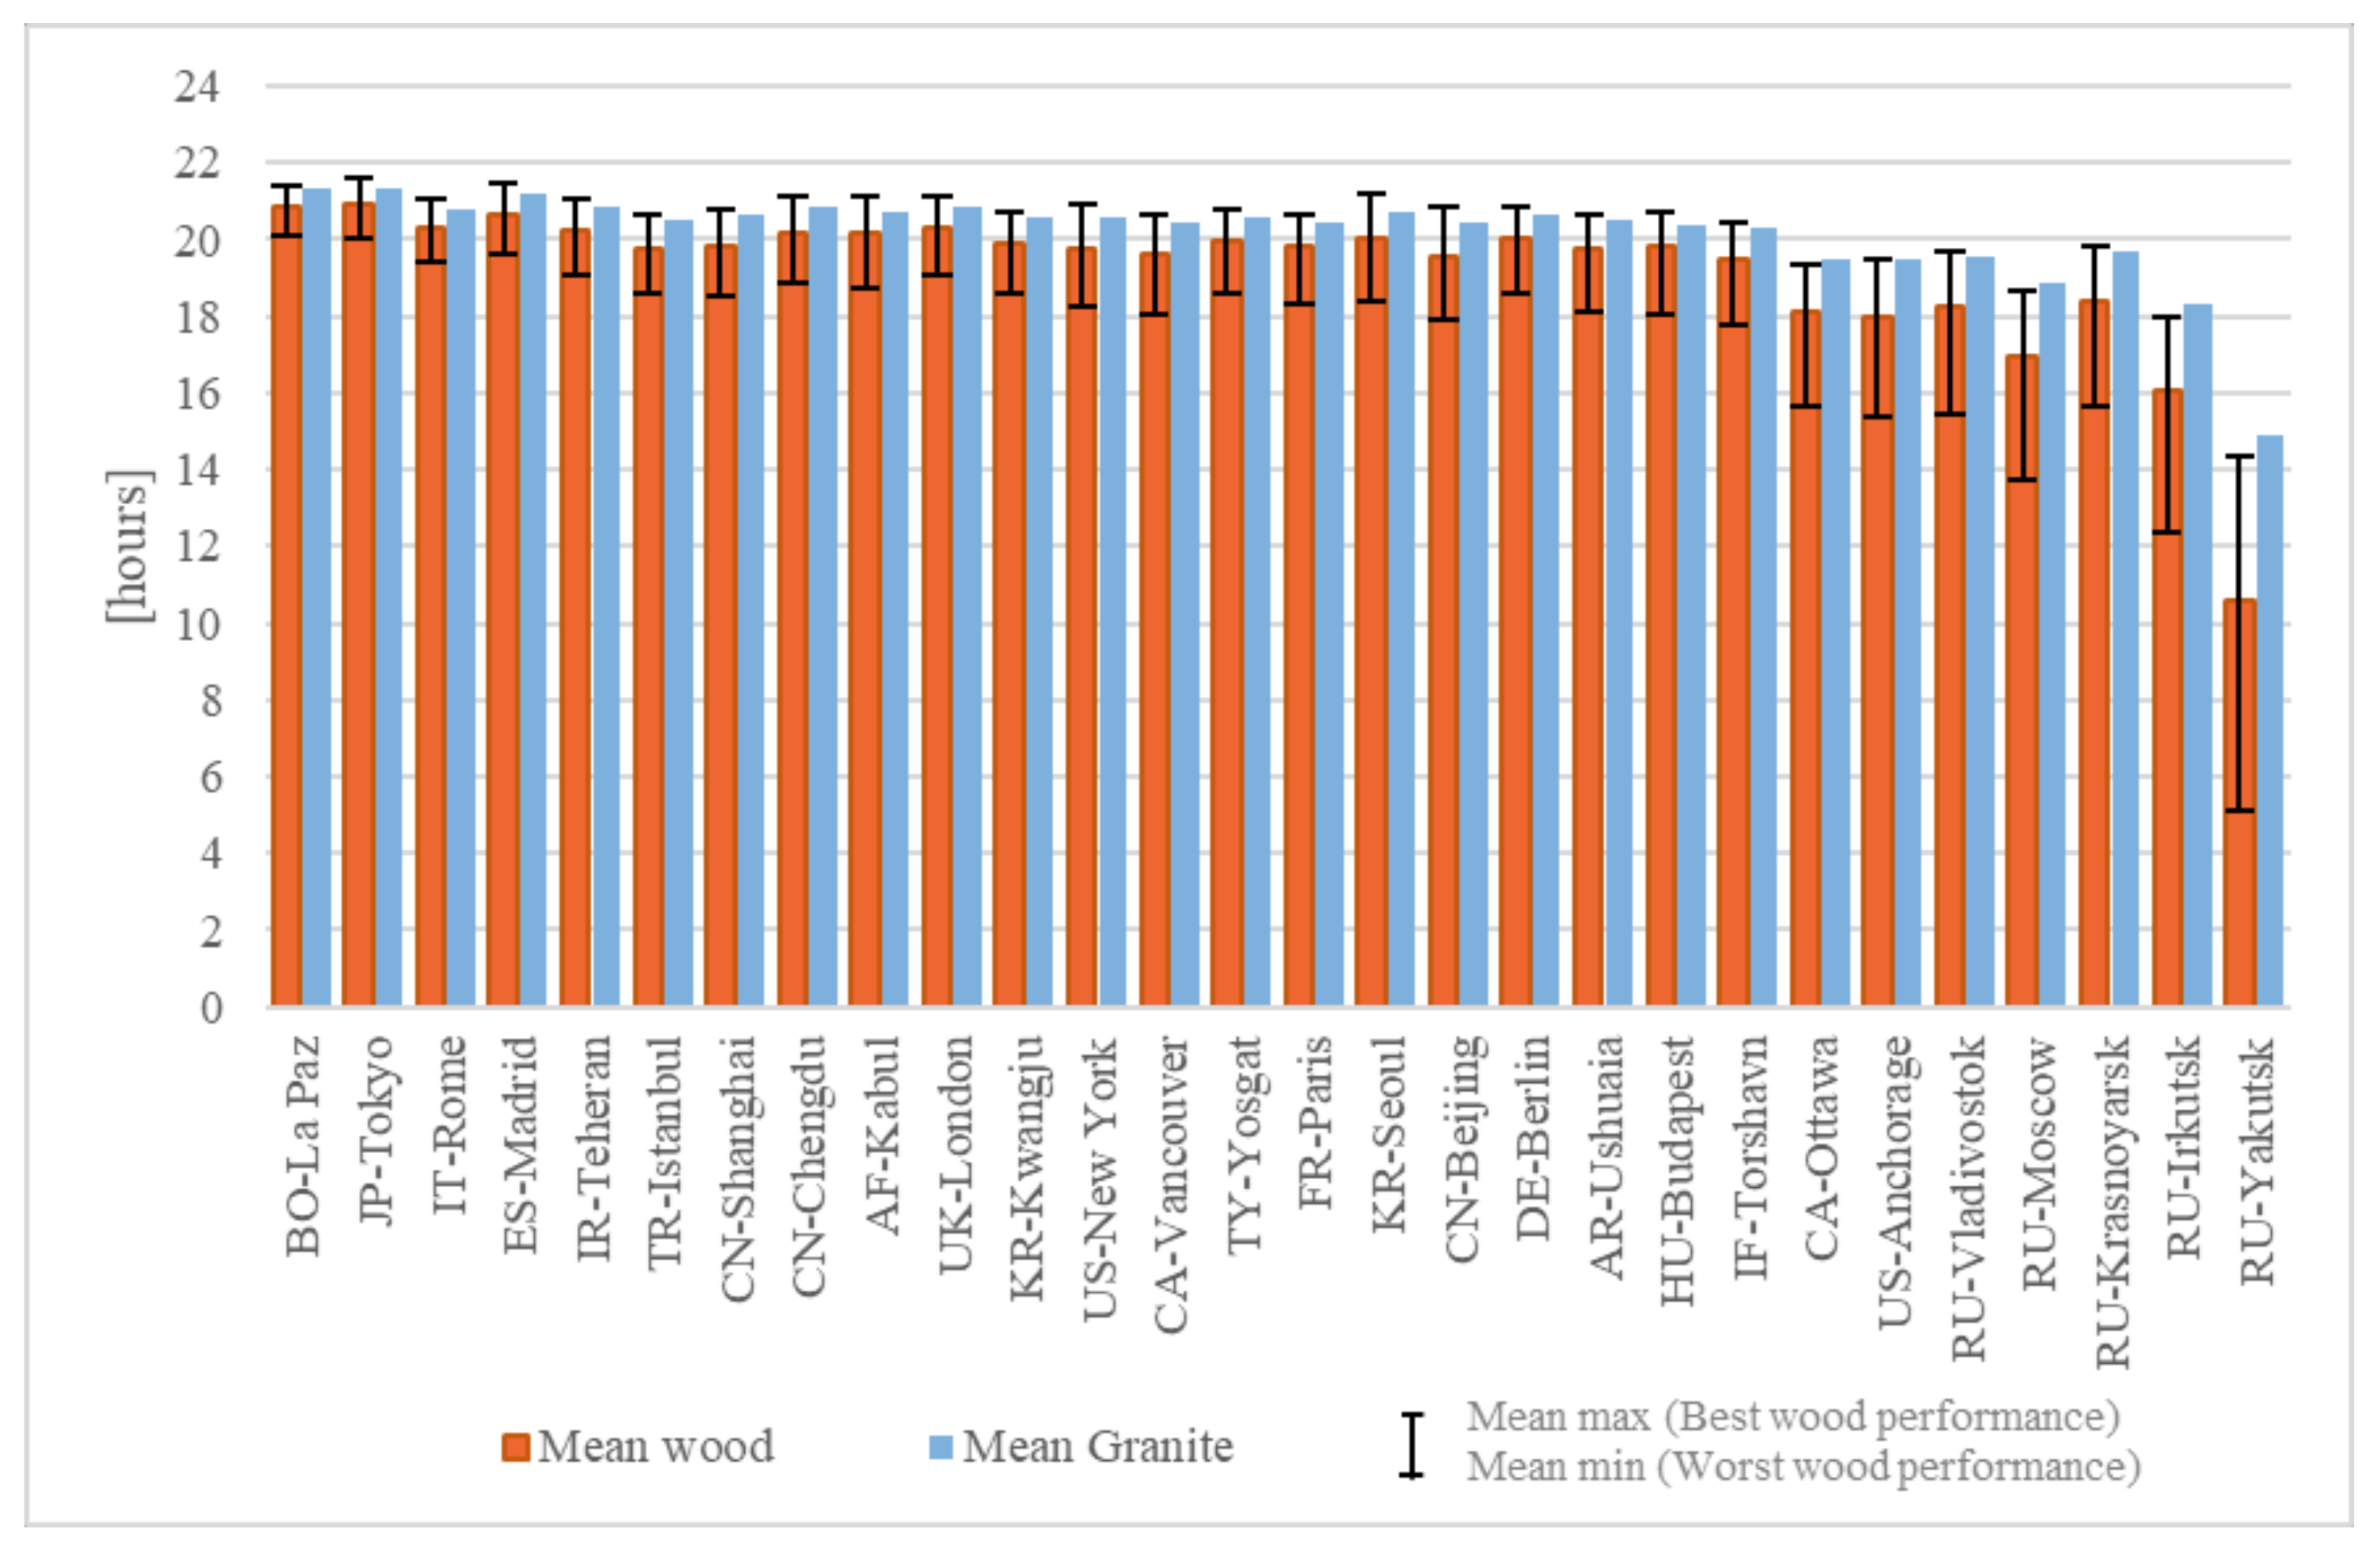
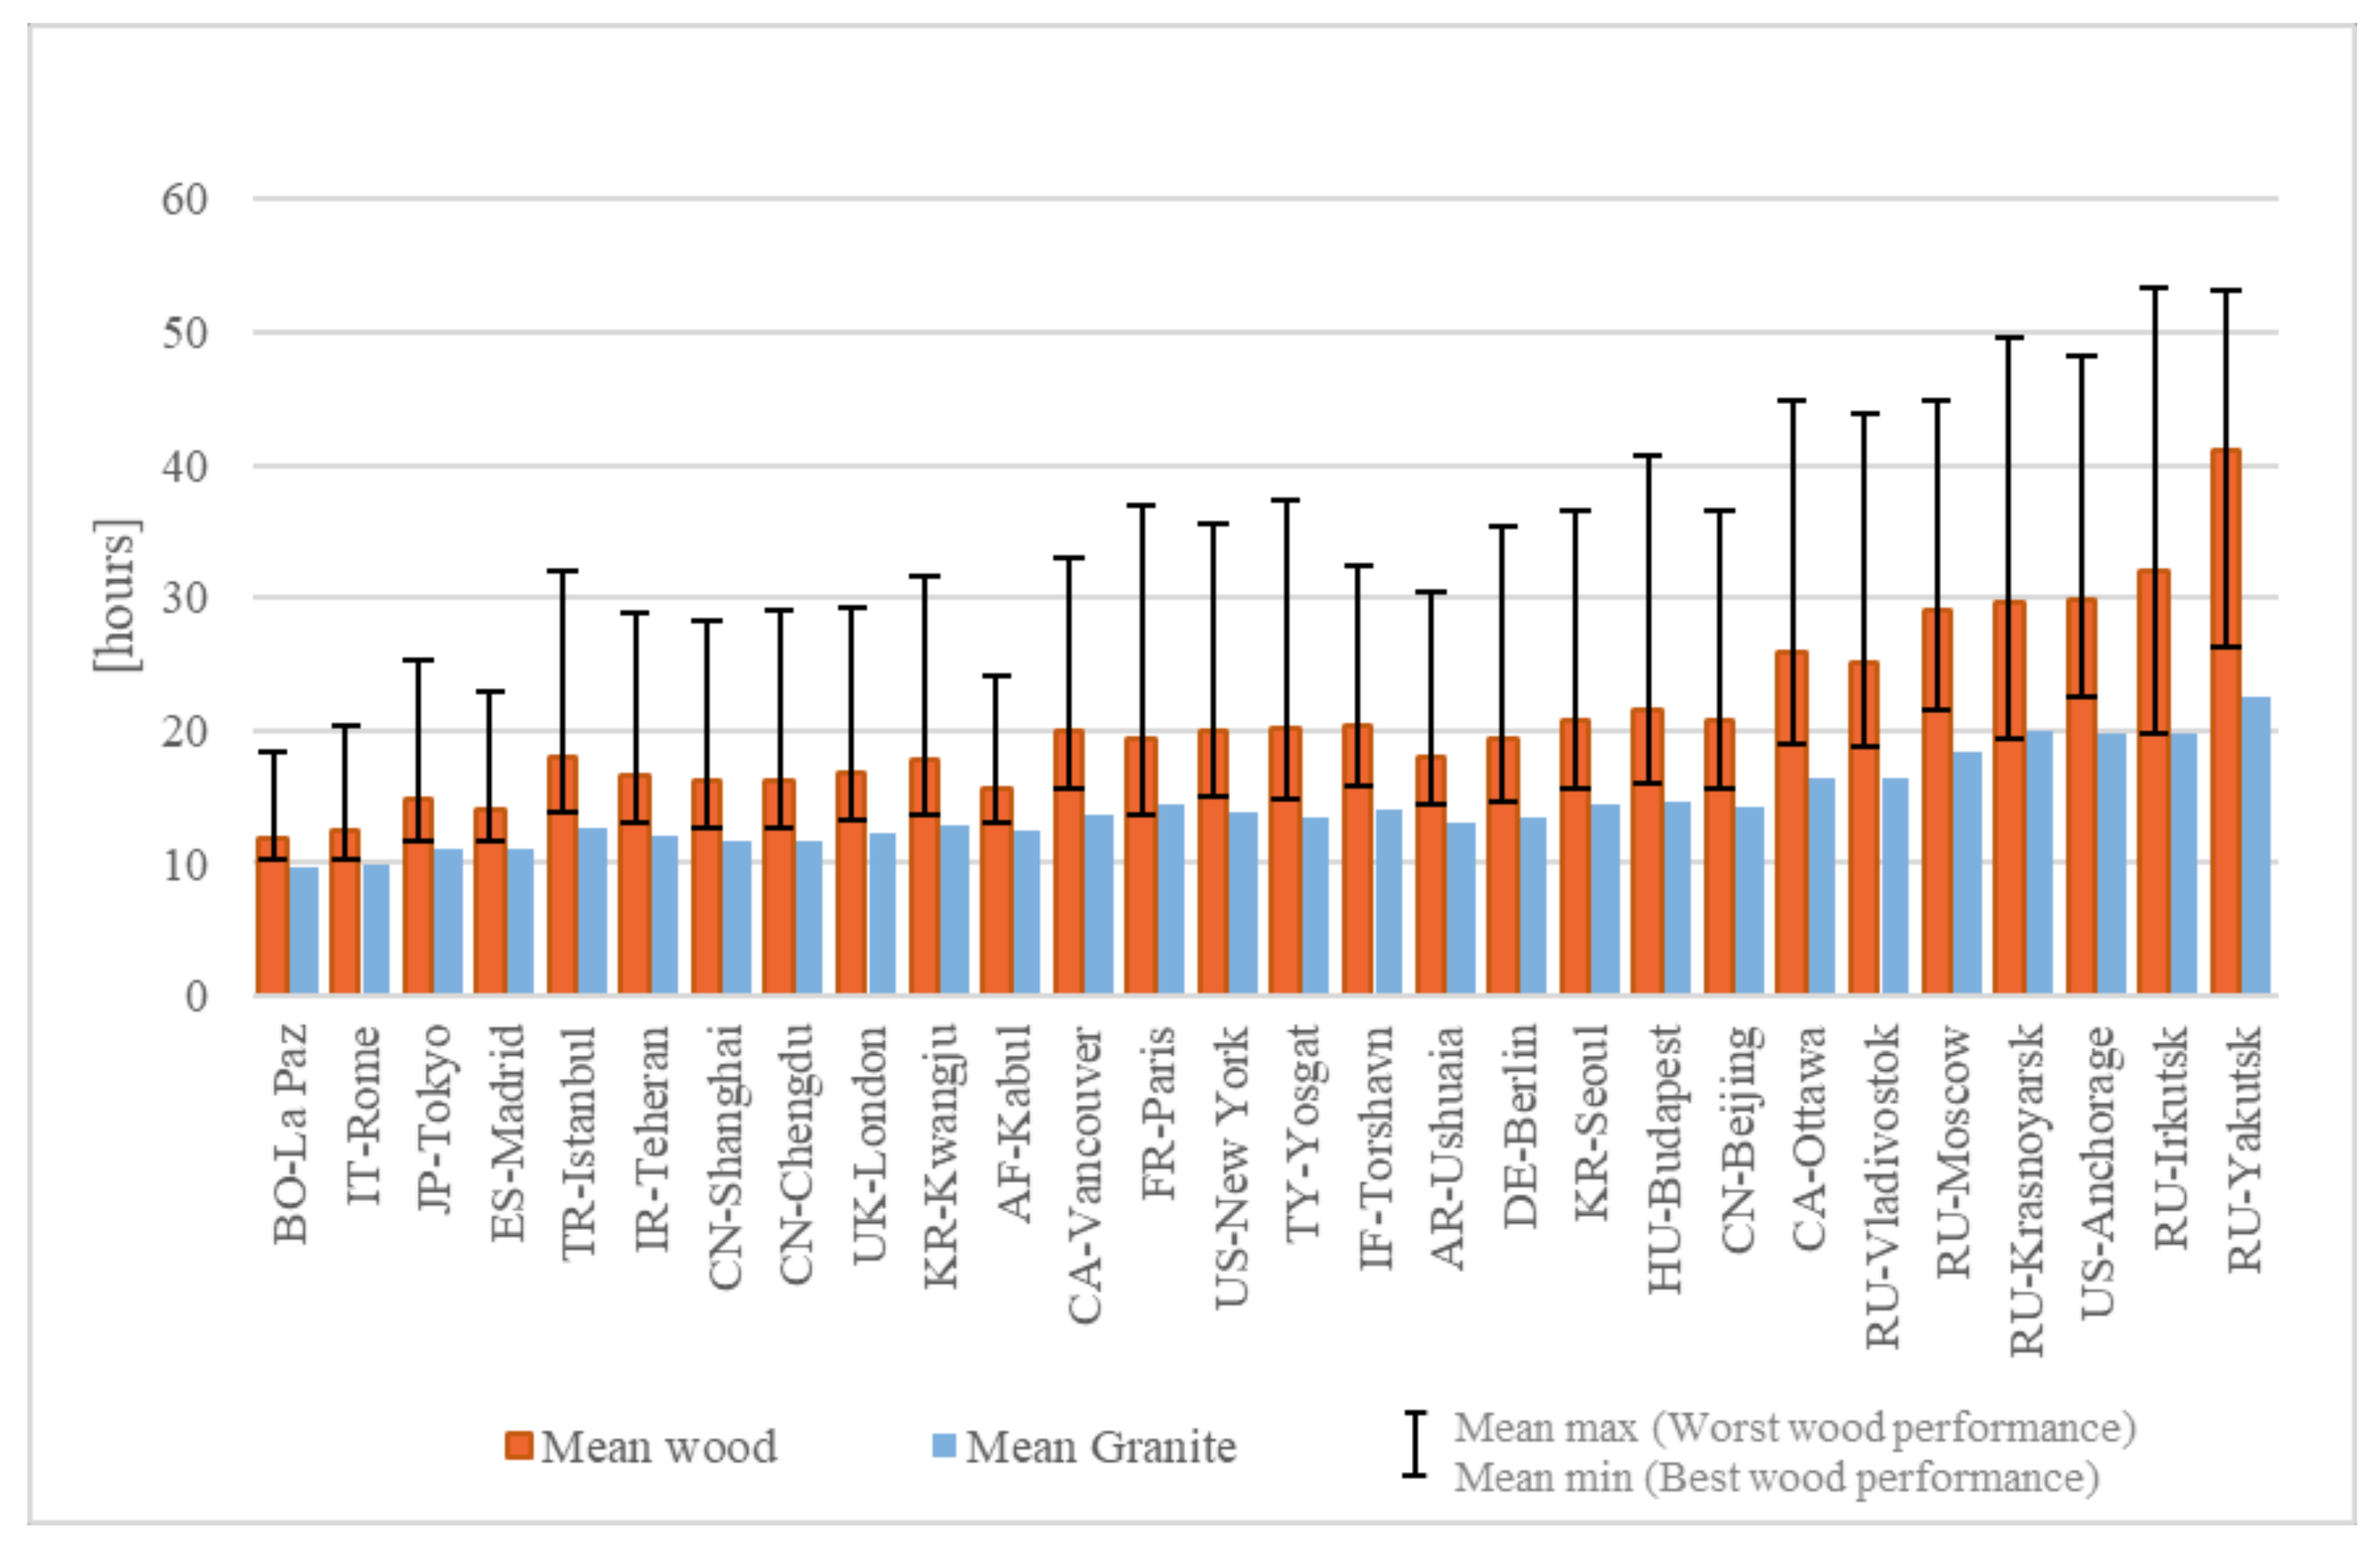
- In general, the results showed that in all the climates studied it was possible to find wooden floors with a thermal performance practically identically to granite in terms of energy demand and thermal comfort. One finding of note was that the best-performing woods delivered slightly more thermal comfort hours than the granite floor, with the exception of climates with extreme winters, where it could still be possible to find wooden floors delivering comfort levels close to those of granite. In all the climates, it was possible to find some wooden floors that exhibited start-up lag times close to those of granite.
- The first question posed was: are the lowest thermal conductivity woods appropriate/suitable for use in radiant floors? According to the findings of Section 3.3, a priori, in terms of energy demand and thermal comfort, the lowest thermal conductivity woods should not be rejected for use in radiant heat floors solely on the basis of their thermal conductivity. The findings showed that wood floorings with low thermal conductivity were able to provide thermal comfort with low energy demand in every part of the world. Specifically, woods with conductivities below 0.18 W/(m·K) presented the lowest demand, complying with comfort in just over 50% of the cases studied, and more specifically, the wood with the lowest conductivity (0.1 W/(m·K)) did so in no less than 10% of the cases. In the same range, namely below 0.18 W/(m·K), the wooden floors provided the highest number of comfort hours in 30% of the cases. Furthermore, based on the results in Section 3.3, there are cases in which the lowest values of thermal conductivity do not lead to excessive increases in the start-up times compared with granite.
- The second and third questions were: should there be a maximum limit of thermal resistance of the flooring in radiant heating systems? And, is the standard thermal resistance limit of 0.15 m2 K/W objectively justified? In view of the results in Section 3.4, in all climates it was possible to find dwellings in which any value of thermal resistance of the wooden floor provides similar comfort to a granite floor with similar energy demands. This suggests that there are no reasons to set a limit value for thermal resistance that can be universally valid to ensure low energy demand while satisfying comfort conditions. In any case, in the event of having to choose a thermal resistance limit value, a plausible criterion would be for it to be established according to the mean behaviour of the dwellings in a specific climate. In this case, the only city where setting this limit would be necessary is Yakutsk, the coldest city included in this study, and this value would be approximately 0.10 m2 K/W.
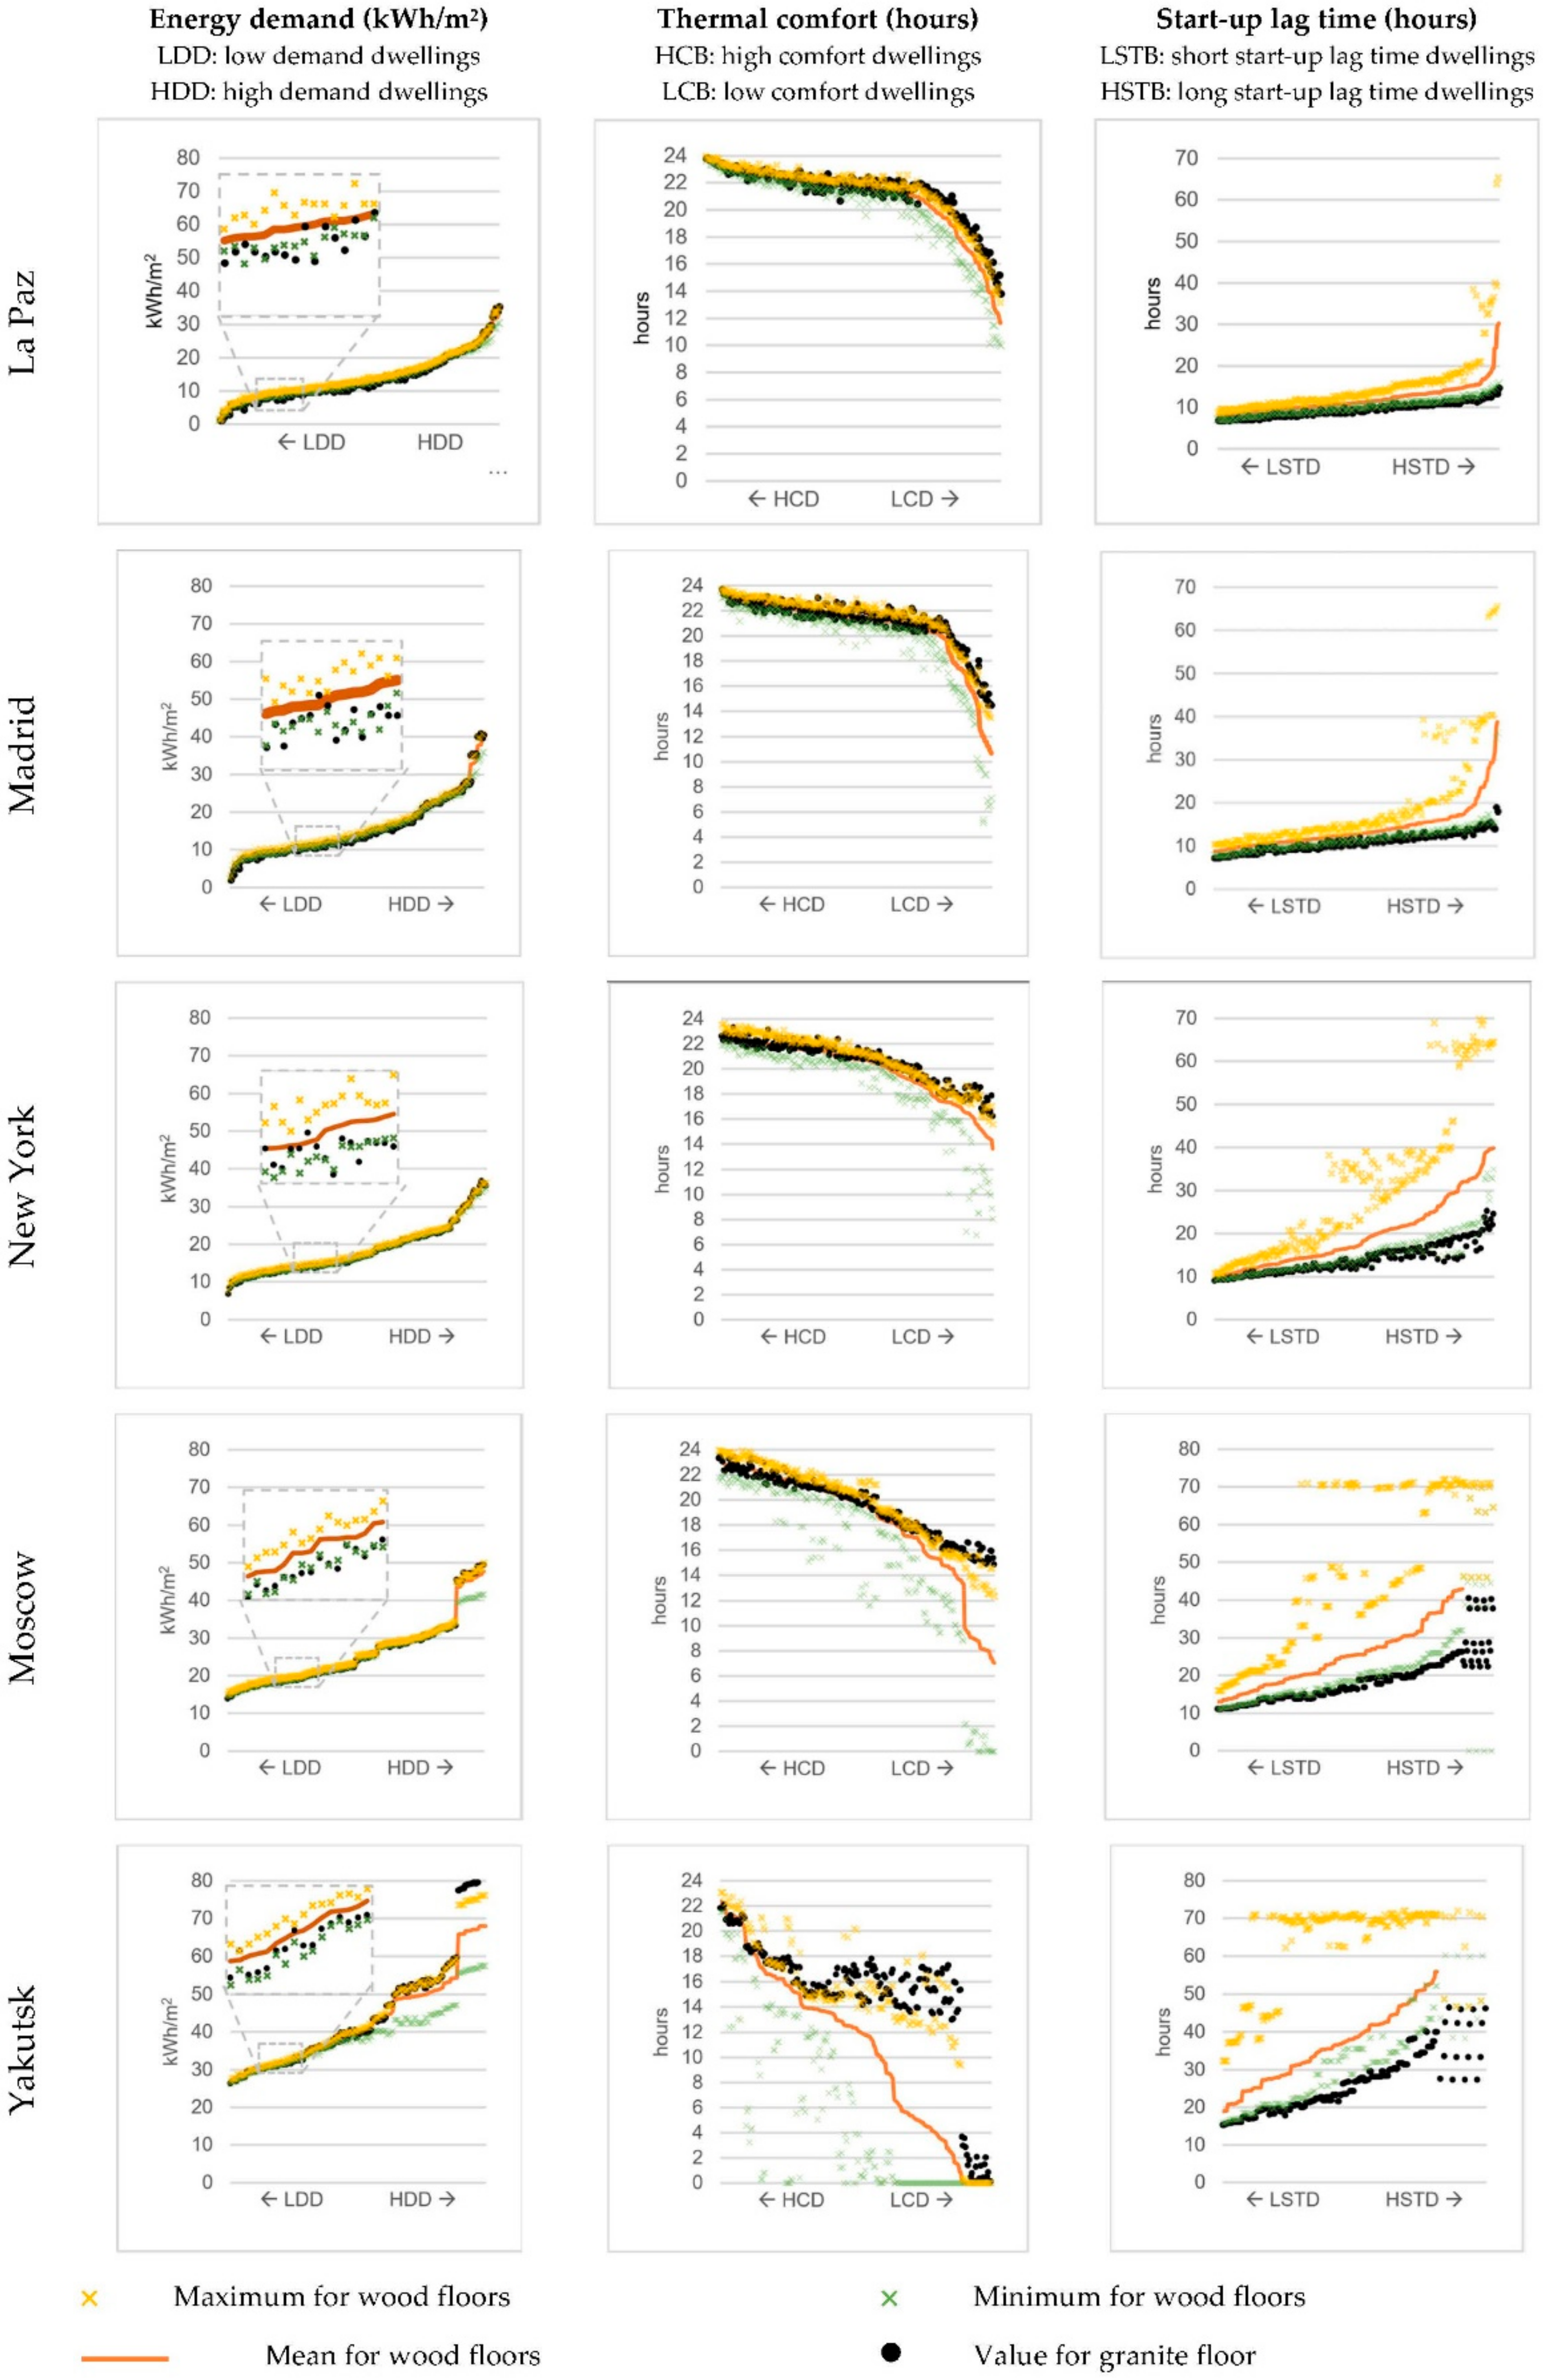
- Finally, the fourth question was: do the answers of the preceding questions depend on the climate and the building construction? The answer is yes. Building characteristics and climate can be important factors when selecting the thermal properties of the floor covering to deliver thermal comfort with low energy demand and reasonable start-up lag times. According to the findings of this research, the choice of a given wooden flooring had little impact in cities with mild winters such as Madrid or La Paz for almost all the dwellings simulated. Similar observations were found for cities with average winters such as New York in terms of energy demand and thermal comfort. However, only in the case of interior-located and better-insulated dwellings were the start-up lag times close to that of granite. In contrast, in severe winters such as Moscow or Yakutsk, the choice of wood covering had a much higher impact on the three performance parameters analysed here. In these climates, comfortable conditions and low energy demand are only possible for interior-located and better-insulated dwellings if the wooden flooring is carefully selected. Regarding start-up lag times, similar values to that of granite can be reached in almost all dwellings if the wooden floor is correctly selected.
Author Contributions
Funding
Institutional Review Board Statement
Informed Consent Statement
Conflicts of Interest
Appendix A

- Glazed area: 15%, 30% or 80%.
- Envelope insulation (U-value) defined by Equation (1).
- Heat capacity: the three levels of heat capacity applied, low, medium and high, were defined as per standard ISO 52016-1:2017 [45].
| Class | Effective Heat Capacity [kJ/(m2 K)] |
|---|---|
| Very light | 80 |
| Medium | 165 |
| Very heavy | 370 |
- Orientation: the four orientations adopted for interior dwellings were north, south, east and west and for corner dwellings southeast, southwest, northeast and northwest.
Appendix B

| Thermal Conductivity W/(m·K) | Density kg/m3 | Specific Heat J/(kg·K) | |
|---|---|---|---|
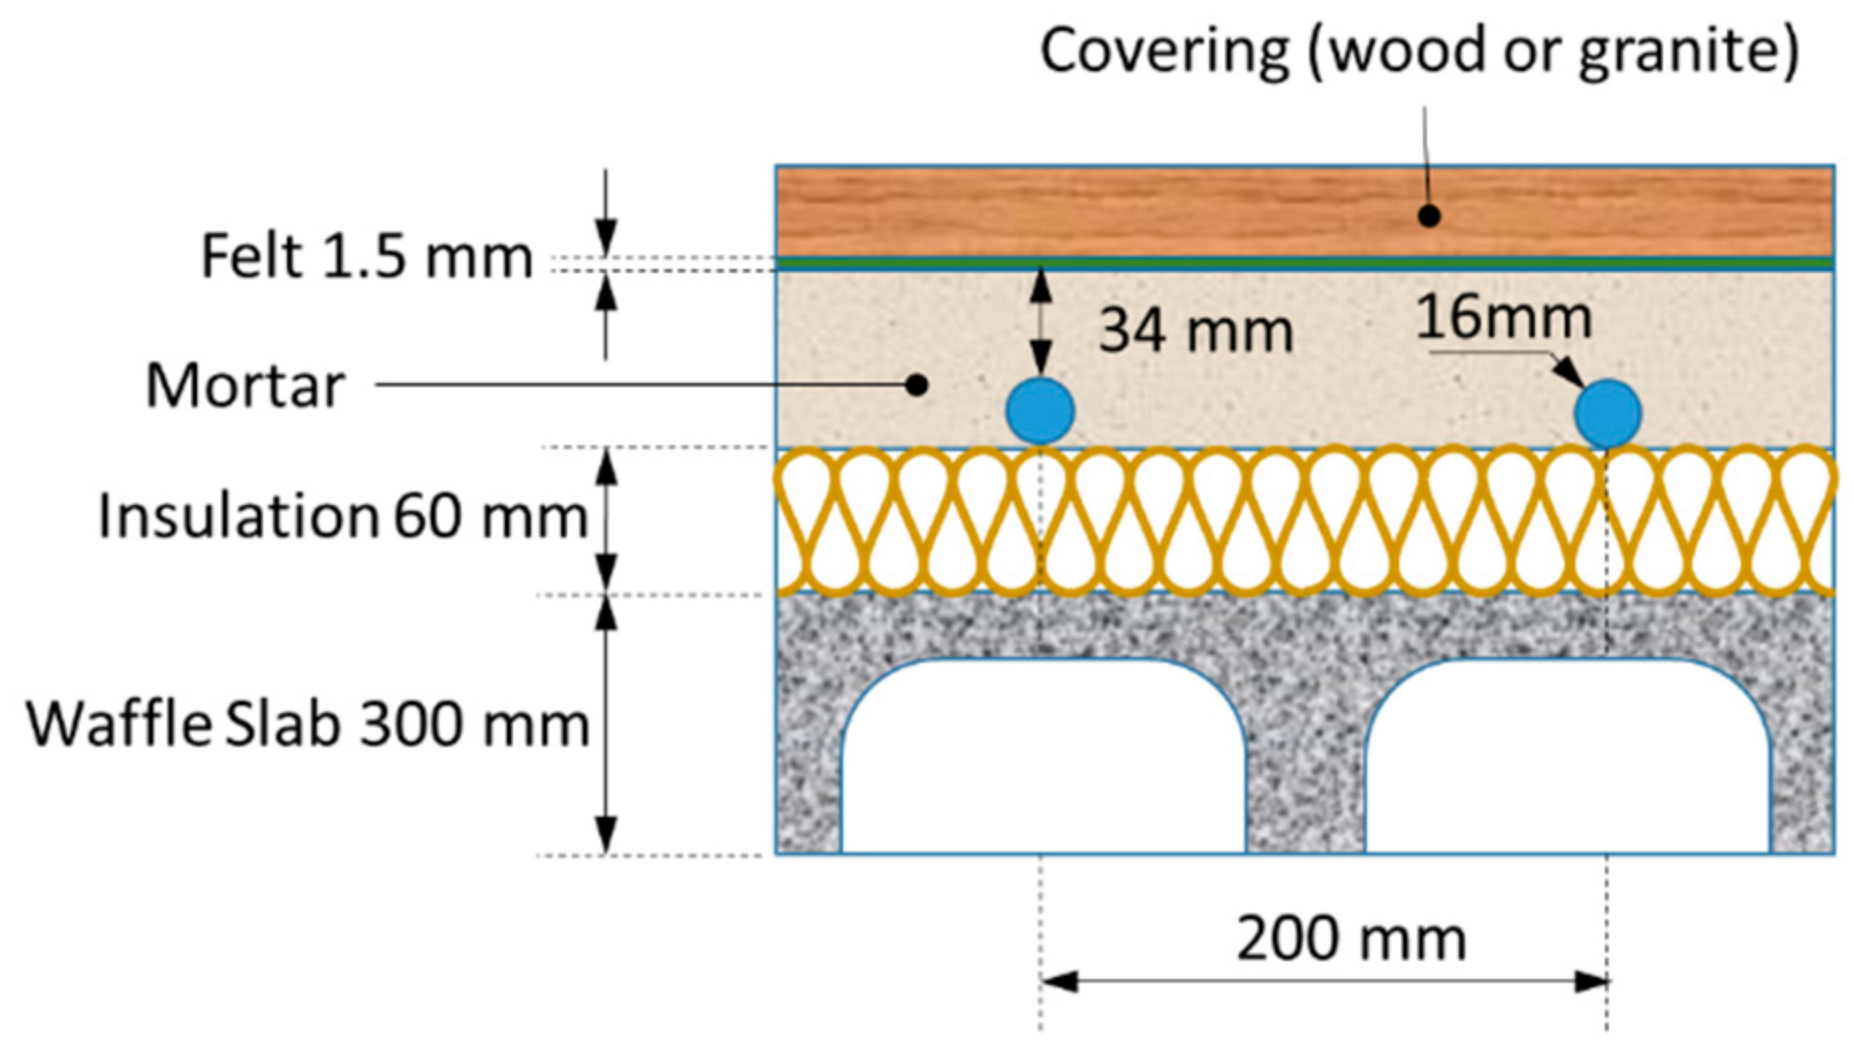
| Felt | 0.033 | 90 | 1000 |
| Mortar | 1.8 | 2100 | 2000 |
| Insulation | 0.033 | 30 | 1200 |
| Waffle slab | 1.22 | 1090 | 1000 |
| Conductivities for Each Density | |||
|---|---|---|---|
| Density | Cond. 1 | Cond. 2 | Cond. 3 |
| kg/m3 | W/(m·K) | W/(m·K) | W/(m·K) |
| 400 | 0.08 | 0.11 | 0.14 |
| 500 | 0.09 | 0.13 | 0.18 |
| 600 | 0.10 | 0.15 | 0.19 |
| 700 | 0.12 | 0.16 | 0.20 |
| 850 | 0.12 | 0.19 | 0.26 |
References
- Bean, R.; Olesen, B.W.; Kim, K.W. History of Radiant Heating 3 Cooling Systems. ASHRAE J. 2010, 52, 40–45. [Google Scholar]
- Rhee, K.N.; Olesen, B.W.; Kim, K.W. Ten questions about radiant heating and cooling systems. Build. Environ. 2017, 112, 367–381. [Google Scholar] [CrossRef] [Green Version]
- Lin, B.; Wang, Z.; Sun, H.; Zhu, Y.; Ouyang, Q. Evaluation and comparison of thermal comfort of convective and radiant heating terminals in office buildings. Build. Environ. 2016, 106, 91–102. [Google Scholar] [CrossRef]
- Izquierdo, M.; de Agustín-Camacho, P. Solar heating by radiant floor: Experimental results and emission reduction obtained with a micro photovoltaic-heat pump system. Appl. Energy 2015, 147, 297–307. [Google Scholar] [CrossRef]
- Yang, F.; Liu, J.; Sun, Q.; Cheng, L.; Wennersten, R. Simulation analysis of household solar assistant radiant floor heating system in cold area. Energy Procedia 2019, 158, 631–636. [Google Scholar] [CrossRef]
- Sebarchievici, C.; Dan, D.; Sarbu, I. Performance Assessment of a Ground-coupled Heat Pump for an Office Room Heating using Radiator or Radiant Floor Heating Systems. Procedia Eng. 2015, 118, 88–100. [Google Scholar] [CrossRef] [Green Version]
- Zhang, L.; Huang, X.; Liang, L.; Liu, J. Experimental study on heating characteristics and control strategies of ground source heat pump and radiant floor heating system in an office building. Procedia Eng. 2017, 205, 4060–4066. [Google Scholar] [CrossRef]
- Hardwood Floors & Radiant Heating: A Brief History, (n.d.). Available online: https://www.warmboard.com/hardwood-and-radiant-heating-brief-history (accessed on 25 July 2020).
- Global Wood Flooring Industry, (n.d.). Available online: https://www.reportlinker.com/p0197227/Global-Wood-Flooring-industry.html?utm_source=GNW#backAction=2 (accessed on 25 July 2020).
- UNE-EN 1264-2:2009+A1:2013; Water Based Surface Embedded Heating and Cooling Systems—Part 2: Floor Heating: Prove Methods for the Determination of the Thermal Output Using Calculation and Test Methods. EN: Brussels, Belgium, 2013.
- Merabtine, A.; Kheiri, A.; Mokraoui, S.; Belmerabet, A. Semi-analytical model for thermal response of anhydrite radiant slab. Build. Environ. 2019, 153, 253–266. [Google Scholar] [CrossRef]
- Bishara, N.; Schulz, T.; Gecks, J.; Plagge, R.; Wehsener, J. Thermal optimization and performance analysis of an innovative wooden radiant heating system made for room temperature control—Laboratory and numerical investigation of prototypes. Energy Build. 2017, 138, 569–578. [Google Scholar] [CrossRef]
- Cho, J.; Park, B.; Lim, T. Experimental and numerical study on the application of low-temperature radiant floor heating system with capillary tube: Thermal performance analysis. Appl. Therm. Eng. 2019, 163, 114360. [Google Scholar] [CrossRef]
- Werner-Juszczuk, A.J. Experimental and numerical investigation of lightweight floor heating with metallised polyethylene radiant sheet. Energy Build. 2018, 177, 23–32. [Google Scholar] [CrossRef]
- Hu, R.; Niu, J.L. A review of the application of radiant cooling & heating systems in Mainland China. Energy Build. 2012, 52, 11–19. [Google Scholar] [CrossRef]
- Alessio, G.; De Carli, M.; Zarrella, A.; di Bella, A. Efficiency in heating operation of low-temperature radiant systems working under dynamic conditions in different kinds of buildings. Appl. Sci. 2018, 8, 2399. [Google Scholar] [CrossRef] [Green Version]
- Li, S.; Joe, J.; Hu, J.; Karava, P. System identification and model-predictive control of office buildings with integrated photovoltaic-thermal collectors, radiant floor heating and active thermal storage. Sol. Energy 2015, 113, 139–157. [Google Scholar] [CrossRef]
- Cho, S.H.; Zaheer-Uddin, M. Predictive control of intermittently operated radiant floor heating systems. Energy Convers. Manag. 2003, 44, 1333–1342. [Google Scholar] [CrossRef]
- Joe, J.; Karava, P. A model predictive control strategy to optimize the performance of radiant floor heating and cooling systems in office buildings. Appl. Energy 2019, 245, 65–77. [Google Scholar] [CrossRef]
- Zhang, D.; Cai, N.; Cui, X.; Xia, X.; Shi, J.; Huang, X. Experimental investigation on model predictive control of radiant floor cooling combined with underfloor ventilation system. Energy 2019, 176, 23–33. [Google Scholar] [CrossRef]
- Shin, M.S.; Rhee, K.N.; Jung, G.J. Optimal heating start and stop control based on the inferred occupancy schedule in a household with radiant floor heating system. Energy Build. 2020, 209, 109737. [Google Scholar] [CrossRef]
- Faraj, K.; Faraj, J.; Hachem, F.; Bazzi, H.; Khaled, M.; Castelain, C. Analysis of underfloor electrical heating system integrated with coconut oil-PCM plates. Appl. Therm. Eng. 2019, 158, 113778. [Google Scholar] [CrossRef]
- Lin, K.; Zhang, Y.; Xu, X.; Di, H.; Yang, R.; Qin, P. Modeling and simulation of under-floor electric heating system with shape-stabilized PCM plates. Build. Environ. 2004, 39, 1427–1434. [Google Scholar] [CrossRef]
- Lin, K.; Zhang, Y.; Xu, X.; Di, H.; Yang, R.; Qin, P. Experimental study of under-floor electric heating system with shape-stabilized PCM plates. Energy Build. 2005, 37, 215–220. [Google Scholar] [CrossRef]
- Lu, S.; Tong, H.; Pang, B. Study on the coupling heating system of floor radiation and sunspace based on energy storage technology. Energy Build. 2018, 159, 441–453. [Google Scholar] [CrossRef]
- Seo, J.; Jeon, J.; Lee, J.-H.H.; Kim, S. Thermal performance analysis according to wood flooring structure for energy conservation in radiant floor heating systems. Energy Build. 2011, 43, 2039–2042. [Google Scholar] [CrossRef]
- Seo, J.; Park, Y.; Kim, J.; Kim, S.; Kim, S.; Kim, J.T. Comparison of thermal transfer characteristics of wood flooring according to the installation method. Energy Build. 2014, 70, 422–426. [Google Scholar] [CrossRef]
- Seo, J.; Cha, J.; Kim, S.; Kim, S.; Huh, W. Development of the thermal performance of wood-flooring by improving the thermal conductivity of plywood. J. Biobased Mater. Bioenergy 2014, 8, 170–174. [Google Scholar] [CrossRef]
- Ruiz-Pardo, Á.; Rodríguez Jara, E.Á.; Conde García, M.; Ríos, J.A.T. Influence of Wood Properties and Building Construction on Energy Demand, Thermal Comfort and Start-Up Lag Time of Radiant Floor Heating Systems. Appl. Sci. 2022, 12, 2335. [Google Scholar] [CrossRef]
- Sattari, S.; Farhanieh, B. A parametric study on radiant floor heating system performance. Renew. Energy 2006, 31, 1617–1626. [Google Scholar] [CrossRef]
- Meteonorm. 2005. Available online: http://meteonorm.com/ (accessed on 1 September 2012).
- World Maps of Köppen-Geiger Climate Classification, (n.d.). Available online: http://koeppen-geiger.vu-wien.ac.at/ (accessed on 14 June 2021).
- EN ISO 7730; Ergonomics of the Thermal Environment—Analytical Determination and Interpretation of Thermal Comfort Using Calculation of the PMV and PPD Indices and Local Thermal Comfort Criteria. EN: Brussels, Belgium, 2005.
- EURIMAU—Values in Europe, (n.d.). Available online: https://www.eurima.org/u-values-in-europe/ (accessed on 31 March 2020).
- Evans, T.; Shui, M.; Takagi, B. Contry Report on Building Energy Codes in Japan; Prepared for the U.S. Department of Energy under Contract No. PNNL-17849; Pacific Northwest National Laboratory: Richland, WA, USA, 2009. [Google Scholar]
- Schimschar, S.; Boermans, T.; Kretschmer, D.; Offermann, M.; John, A. U-Value Maps Turkey. Applying the Comparative Methodology Framework for Cost-Optimality in the Context of the EPBD; Technical Report; ECOFYS Germany GmbH: Berlin, Germany, 2016; Available online: www.ecofys.com (accessed on 31 March 2020).
- Gobierno de España; Ministerio de Fomento; Secretaría de Estado de Infraestructuras, Transporte y Vivienda; Secretaría General de Vivienda; Dirección General deArquitectura, Vivienda y Suelo. Documento Básico HE. Ahorro de energía, Official Regulation. 2013; pp. 1–129. Available online: http://www.codigotecnico.org (accessed on 25 July 2020).
- HM Gverment. L1B Conservation of Fuel and Power in Existing Dwellings. The Building Regulations 2010 (For Use in England), Official Regulation. 2010; pp. 1–32. Available online: https://assets.publishing.service.gov.uk/government/uploads/system/uploads/attachment_data/file/697629/L1B_secure-1.pdf (accessed on 25 July 2020).
- Canadian Commission on Building and Fire Codes. National Building Code of Canada: 2010, 13th ed.; National Research Council of Canada: Ottawa, ON, Canada, 2010. [CrossRef]
- Evans, M.; Chon, H. Country Report on Building Energy Codes in Republic of Korea; Pacific Northwest National Laboratory: Richland, WA, USA, 2009. [Google Scholar]
- Chapter 4: [RE] Residential Energy Efficiency, Florida Energy Conservation Code 2014|UpCodes, (n.d.). Available online: https://up.codes/viewer/florida/fl-energy-conservation-code-2014/chapter/RE_4/re-residential-energy-efficiency#R402 (accessed on 1 April 2020).
- Instituto Eduardo Torroja de Ciencias de la Construcción, CEPCO. Catálogo de Elementos Constructivos, Código Técnico de La Edificación CTE. Technical Report. 2010, p. 141. Available online: http://www.codigotecnico.org/web/recursos/aplicaciones/contenido/texto_0012.html (accessed on 25 July 2020).
- Iqbal, S.; Ul-Ain, Q.; Javaid, N. Optimizing Energy Consumption using Fuzzy Logic for HEMS in a Smart Grid. In Proceedings of the International Conference on Computing and Information Science (ICCIS), Karachi, Pakistan, 26–27 March 2018. [Google Scholar]
- Woeikof, A. Siberian meteorology. Nature 1881, 23, 437–438. [Google Scholar] [CrossRef]
- UNE-EN ISO 52016-1:2017; Energy Performance of Buildings—Energy Needs for Heating and Cooling, Internal Temperatures and Sensible Ans Latent Heat Loads—Part 1: Calculation Procedures (ISO 52016-1:2017). EN: Brussels, Belgium, 2017.


| Values in (m2/W) | Poorly Insulated Building | Intermediately Insulated Building | Highly Insulated Building |
|---|---|---|---|
| Walls | 0.0028 | 0.0042 | 0.0075 |
| Roof | 0.0047 | 0.0072 | 0.0138 |
| Description | U | SHGF | |
|---|---|---|---|
| [W/(m2 K)] | |||
| 1 | Single, 6 mm glazing 20% metallic frame with no thermal break. | 5.7 | 0.72 |
| 2 | Double glazing, 6 mm panes, 15 mm air space and 20% metallic frame with thermal break; d > 12 mm. | 2.8 | 0.63 |
| 3 | Double window with low emissivity double glazing, >10 mm spacing between panes and 20% metallic frame with thermal break. | 1.6 | 0.49 |
Publisher’s Note: MDPI stays neutral with regard to jurisdictional claims in published maps and institutional affiliations. |
© 2022 by the authors. Licensee MDPI, Basel, Switzerland. This article is an open access article distributed under the terms and conditions of the Creative Commons Attribution (CC BY) license (https://creativecommons.org/licenses/by/4.0/).
Share and Cite
Rodríguez Jara, E.Á.; Ruiz-Pardo, Á.; García, M.C.; Ríos, J.A.T. Effect of Wood Properties and Building Construction on Thermal Performance of Radiant Floor Heating Worldwide. Appl. Sci. 2022, 12, 5427. https://doi.org/10.3390/app12115427
Rodríguez Jara EÁ, Ruiz-Pardo Á, García MC, Ríos JAT. Effect of Wood Properties and Building Construction on Thermal Performance of Radiant Floor Heating Worldwide. Applied Sciences. 2022; 12(11):5427. https://doi.org/10.3390/app12115427
Chicago/Turabian StyleRodríguez Jara, Enrique Ángel, Álvaro Ruiz-Pardo, Marta Conde García, and José Antonio Tenorio Ríos. 2022. "Effect of Wood Properties and Building Construction on Thermal Performance of Radiant Floor Heating Worldwide" Applied Sciences 12, no. 11: 5427. https://doi.org/10.3390/app12115427