Article

Behaviour of Horseshoe-Shaped Tunnel Subjected to Different In Situ Stress Fields

by
Wael R. Abdellah
1,*,
Abdel Kader A. Haridy
2,
Abdou Khalaf Mohamed
2,
Jong-Gwan Kim
3 and
Mahrous A. M. Ali
4
1
Department of Mining and Metallurgical Engineering, Faculty of Engineering, University of Assiut, Assiut P.O. Box 71515, Egypt
2
Civil Engineering Department, Faculty of Engineering, Al-Azhar University, Qena P.O. Box 83513, Egypt
3
Department of Energy and Resources Engineering, Chonnam National University, Gwangju 61186, Korea
4
Mining and Petroleum Engineering Department, Faculty of Engineering, Al-Azhar University, Qena P.O. Box 83513, Egypt
*
Author to whom correspondence should be addressed.
Appl. Sci. 2022, 12(11), 5399; https://doi.org/10.3390/app12115399
Submission received: 19 March 2022 / Revised: 11 May 2022 / Accepted: 24 May 2022 / Published: 26 May 2022
(This article belongs to the Special Issue Advances in Developing Underground)

Abstract

:
At great depths, tunnel openings experience a tectonic stress field rather than overburden stress. This paper aims to examine the impact of different in situ stress ratios and multiple tunnel depths below the surface on the excavation induced-stresses and displacements around tunnel openings. Thus, a series of models has been built, using a two-dimensional elasto-plastic finite-elements code, RS2D, to conduct parametric stability analysis. The performance of tunnel opening is examined by evaluating the induced stress-deformation around the opening. The results indicate that ratio of wall convergence, roof sag and floor heave increase as in situ stress ratio and tunnel depth below surface increase. Additionally, the induced-stresses increase as depth and state of in situ stress increase. In addition, the extent of yielding zones into rock mass around tunnel roof and floor deteriorates as tunnel depth and in situ stress ratio increase. Moreover, the normal stress along rock joints is sharply dropped when joints pass in the vicinity of tunnel opening (e.g., centre of opening). As well, the direction of shear stress along joints is reversed. Consequently, inward shear displacement of rock, on the underside of the weakness plane, is produced as a result of slip occurrence.

1. Introduction

Tunnels are constructed for the purpose of conveyance; hydro-power transmission; disposal of nuclear wastes; irrigation and mining operations [1,2]. The stability of underground tunnels is determined by the ability of the rock to sustain the stress concentrated on the wall [3]. After excavating the tunnel, the tangential stress of the tunnel’s walls increases, but the redistribution of stress near the excavation limit reduces the radial stress to zero [4,5,6,7,8,9]. Additionally, as a result of high stress, there is considerable stored energy in the surrounding rocks, which can be released and ultimately cause serious accidents [10,11,12,13]. Thus, their stability is of primary concern throughout their entire/service life. In the late 1990s, the global importance of utility tunnels was recognized. Excavation diameters above 4 m significantly increase the inherent uncertainties associated with rock mass and field stresses and the difficulties encountered in tunnel construction. Earth pressure balance (EPB) was used to construct the largest concrete pipe jack tunnel (e.g., 4.67 m in diameter) along Lake Jinshan in Zhenjiang, China [1]. The strength of rock mass and the state of in situ stress field are the major factors influencing the stability of underground excavations (tunnels). Rock mass strength is ruled by the presence of discontinuities and their geometrical properties (e.g., roughness, stiffness, friction, orientation, spacing, etc.), while rock failure mechanism (e.g., stress-deformation response) is mainly affected by the in situ stress field (e.g., magnitude and direction). Consequently, high induced-stress may cause severe damage to the rock mass surrounding the tunnel opening and therefore leads to detrimental performance effects [14,15,16,17,18,19,20,21,22,23,24]. Additionally, an effective support system will not be efficiently designed unless rock mass properties, around the opening, are well-addressed in advance (e.g., before excavating the tunnel opening). Excavating an opening into rock mass disrupts the initial state of stress before opening has been introduced. Thereby, new stress regime is induced in the vicinity of the opening. Such stress (e.g., induced) is directly related to the in situ stress that primarily depends on the depth of overburden, weight of overlying rock, presence of geological features and the characteristics of rock mass. Consequently, a tremendous hazard may result due to high in situ stress, particularly at great depths. Alternatively, brittle or shear failure may result if the rock surrounding the tunnel opening is overstressed. Thus, it is strongly recommended to specify the magnitude and direction of in situ stress to evaluate their effect on stability of underground openings [25,26,27,28,29,30,31,32,33,34,35,36,37,38].
As mentioned beforehand, the stability assessment of underground openings is inevitably a prerequisite for the rational design of large underground excavations in rock (e.g., to determine whether they stand-up without the need for secondary support or not) [39,40,41]. Such stability is significantly affected by many factors such as: rock mass properties (e.g., cohesion, friction angle, modulus of deformation and presence of discontinuities), opening geometry (e.g., shape and size) and stress state surrounding the openings. Experimental, analytical (empirical) and numerical methods can be employed to investigate the state of stress-displacement around the openings. Each method has its merits and shortcomings. However, the latter (e.g., numerical simulation) is the most robust, reliable and effective method [42,43,44]. Therefore, it has been more frequently adopted in practice to evaluate the stability of underground openings and to design rock support systems. In addition, many authors [45,46,47,48] have said that the numerical analysis is necessary to investigate the mechanical behaviour of rock mass surrounding the tunnel opening, if the tunnelling problem is not axisymmetric (e.g., tunnel cross-section is not circular or in situ stress field is not hydrostatic). Moreover, rapid evolution of technology (e.g., computer software and hardware) positively facilitates/fosters the use of numerical analysis and contrarily eliminates the dependence on the other methods (e.g., empirical and experimental) [49,50,51,52,53,54].
The purpose of this study is to investigate the behaviour of a horseshoe tunnel at various depths and in situ stress ratios (e.g., horizontal-to-vertical stress ratio) in relation to induced stresses and rock mass deformation around the tunnel opening.

2. Methods of In Situ Stress Measurement

Rock failure mechanism around underground openings (e.g., tunnels) is directly related to the magnitude and direction of the in situ stress field [55,56,57,58]. Thus, the stability of rock mass around tunnel openings will not be analysed without considering in situ stress [2,5,6]. In situ stress is a natural state of stress acting upon rock mass before a certain opening exists. More importantly, this state of stress may be variable (e.g., changes according to the space and geological time) or constant (e.g., based on specific period of construction) [27,59,60,61]. Measuring the in situ stress is the most direct approach to determine geo-stress field. However, it is an expensive, difficult and sometimes unsuccessful task. Hence, due to the high cost and limited test areas, the stress measurement is conducted in local areas with a few test points. Numerical simulation is quite necessary to derive a reasonable stress field. There are several techniques that can be employed to measure such stress [27,62,63,64,65,66,67,68,69,70,71,72,73,74].

2.1. In Situ Stresses-Depth Relationship

It is common practice to conduct two-dimensional stress analysis using a vertical field stress of σ v and a lateral (horizontal) stress of K   σ v (e.g., “k” is the horizontal-to-vertical stress ratio) as depicted in Figure 1. The overburden stress (e.g., vertical) is the product of unit weight of overlying rock and the depth below surface. However, in complex tectonic environments, this stress may be lower [75,76,77] or higher than the calculated overburden stress [78,79,80]. The vertical stress can be calculated using simple relationship as per Equation (1) [81]:
σ v = 0.027   Z
where 0.027: is the average unit weight of rock mass, MN/m3. Z: is the depth below surface, m.
The lateral (e.g., horizontal) stress is affected by topographic features and plate tectonics [26,27,28,69,82,83,84,85,86,87]. The in situ stress ratio, k, is defined as the horizontal-to-vertical stress ratio, as per Equation (2) [27,88] and its limits is defined as given in Equation (3) [89]:
K = σ h σ v
100 Z + 0.3   K 1500 Z + 0.5
Thus, by substituting from Equations (1) and (2) into Equation (3), the limits of horizontal in situ stress (e.g., σ h = k   σ v )   are given as per Equation (4) [90]:
2.7 + 0.0081   Z σ h 40.5 + 0.0135   Z
where, depth (Z) is in meters and stress is in MPa units. Therefore, if the depth, Z, is 500 m, then “K” ranges from 0.50 to 3.50 (e.g., by substitution in Equation (3)) and horizontal in situ stress ( σ h ) ranges according from 6.75 MPa to 47.25 MPa (e.g., by substitution in Equation (4)). However, if depth, Z, is 2000 m, then “K” ranges from 0.35 to 1.25 and horizontal in situ stress ( σ h ) ranges according from 18.90 MPa to 67.50 MPa. Thus, the value of “K” tends to be smaller at great depths and vice versa at shallow depths (Wael Abdellah, 2015). However, these relationships between “K”, depth (Z) and in situ vertical stress ( σ v ) are useful in feasibility design studies, but it is noteworthy that they vary from the shield of one country to another [27,69,83,84,91,92,93,94,95,96,97,98,99].
In this study, sensitivity stability analysis of a tunnel opening has been investigated at different values of in situ stress ratio, K, of 0.5, 1, 1.5, 1.65, 1.80, 2.0, 2.13 and 2.50 and various depths, Z, of 50-, 100-, 150-, 200- and 250-ms below surface. Four reference points (e.g., #1, #2, #3 and #4) have been assigned in the perimeter of the tunnel as shown in Figure 1, to assess stress-displacement around them. The stability of the tunnel opening is evaluated in terms of major induced-stress, stress concentration, strength of rock mass around tunnel opening, ratios of wall convergence, roof sag and floor heave and extent of yielding zones into rock mass surrounding the tunnel. For explanations/mathematical relationships of these evaluation criteria [100,101,102,103,104,105,106,107,108,109,110]. The model geometry; dimensions and boundary conditions are presented in the following section (e.g., Section 3. Modelling set up).

2.2. Modelling Set Up

The analysis is carried out on a D-shaped tunnel opening, which is typically 5 m × 5 m in size. A typical finite element model is built with RS2D. Figure 2 portrays the dimensions, geometry and boundary conditions of the reference tunnel model (RTM). In this model (e.g., RTM), the in situ stress ratio, K, is 2.13, tunnel depth, Z, is 50 m, joint dip angle is 30 degree and joint spacing is 5 m. Consequently, a series model has been constructed using Rock-Soil, RS2D software to study the effect of two principal parameters affecting the behaviour of tunnel opening excavated in jointed rock; in situ stress ratio, K and tunnel depth, Z, respectively, as listed in Table 1. The properties of rock mass and joints used in this analysis are listed in Table 2.

3. Results

The parametric stability analysis has been conducted with focus on the impact of two basic factors; in situ stress ratio and tunnel depth, on the stability of underground tunnel opening excavated in jointed rock, and the results are assessed in terms of rock stress-displacement around the tunnel.

3.1. Case I-Impact of In Situ Stress Ratio

Various values of in situ stress ratio, K, have been used in this study (e.g., 0.5, 1, 1.5, 1.65, 1.80, 2, 2.13 and 2.5). The results of this sensitivity analysis will be presented and discussed below in terms of ratio of walls convergence, sag ratio of the roof and heave ratio of the floor, induced-stress, stress concentration, rock mass strength after opening has been introduced and the depth of failure zones into rock mass surrounding tunnel opening with respect to embedment/anchorage length of rock support.

3.1.1. Wall Convergence Ratio

The ratios of walls (e.g., right and left) convergence are calculated as given in Table 3 and Table 4 and are plotted as shown in Figure 3 and Figure 4, respectively. It can be shown that the ratio of wall closure/convergence increases as the in situ stress ratio, K, increases. After excavating a tunnel in the rock, the tunnel walls tend to move towards the entire tunnel opening, see Figure 5 (e.g., vectors of horizontal displacements contours around tunnel opening at in situ stress ratio, K, of 2.5). Additionally, the maximum left (e.g., point #2) and right (e.g., point #3) walls convergence occurs at the tunnel perimeter (e.g., at zero m lateral distances from the tunnel boundary) and in situ stress ratio, K, of 2.5 are 0.0046% and −0.0148%, respectively.

3.1.2. Roof Sag (RSR) and Floor Heave (FHR) Ratio

Table 5 and Table 6 give the ratios of tunnel roof sag and floor heave at various in situ stress ratios and variable distances from the roof (e.g., distance from reference point #1) and floor (e.g., distance from reference point #4), respectively. Figure 6 shows the ratio of roof sag and floor heave at different in situ stress ratios, K measured at various vertical distances from tunnel boundary (e.g., point #1 and point #4), respectively. It shows that, as in situ stress ratio K increases, the roof sag ratio and floor heave ratio increase. The maximum roof sag (RSR) occurs at a zero meter vertical distance from the tunnel boundary (e.g., point #1) and in situ stress ratio K of 2.5 is −0.0148%. The negative sign indicates that tunnel roof tends to move downwards, while the maximum floor heave ratio (FHR) is −0.01006% and obtained at in situ stress ratio K 2.5 and vertical distance of 2.5 m from tunnel boundary (e.g., point #4). Figure 7 depicts the vectors of vertical displacement contours of rock mass after the tunnel opening has been excavated. It is clear that both roof and floor tend to move downwards.

3.1.3. Major-Induced Stress

Figure 8 depicts the resultant induced-stresses around the tunnel boundary with respect to in situ stress ratio. It can be shown that rock mass would fail in tension (e.g., brittle failure) after the tunnel opening has been excavated as in situ stress ratio increases (e.g., overstressed rock). For instance, when in situ stress ratio K equals 0.5, the induced-stresses around tunnel roof/back, floor, right wall (RW) and left wall (LW) are −0.73 MPa, −1.21 MPa, 0.85 MPa and 1.09 MPa, while at in situ stress ratio K of 2.5, they are −0.26 MPa, −0.26 MPa, −1.82 MPa and −2.93 MPa, respectively.

3.1.4. Stress Concentration Factor (SCF)

Figure 9 shows the concentration of stresses around tunnel opening at various states of in situ stress. The results indicate that high stresses concentrate around the back and floor of the tunnel, while low stresses are developed around the right and left wall of the tunnel as in situ stress ratio increases.

3.1.5. Rock Mass Strength Factor (SF)

The strength contours of rock mass surrounding tunnel opening is given in Figure 10 below at various in situ stress ratios. It can be shown that only the stability of the tunnel back (roof) deteriorates (SF ˂ 1.0) as in situ stress ratio K increases, while the tunnel walls and floor are not disturbed. However, this does not apply to the floor if K = 2.5 (e.g., SF < 1). Additionally, it clear that there is discontinuity in the strength contours of rock around the tunnel when they are intersected by rock joints.

3.1.6. Extent of Yielding Zones

Figure 11 shows the depth of failure zones into rock mass around the tunnel opening at different in situ stress ratios. It can be shown that the depth of failure zones around tunnel roof and floor slightly extend as in situ stress ratio increases. However, small notches are found in the tunnel walls (e.g., right and left).

3.1.7. Stress-Displacements along Rock Joints

Figure 12 depicts the normal stress along a rock yielded joint that runs beneath the tunnel opening at different in situ stress ratios. It can be shown that the normal stress is sharply dropped at the centre of tunnel opening (e.g., where rock joints pass over and below tunnel opening). Alternatively, rock joints lost their strength as a result of rock mass failure/yielding surrounding tunnel opening. Moreover, it is obvious that the minimum normal stresses along rock joints (e.g., at the centre of the tunnel opening) are 0.54 MPa and 0.073 MPa obtained when in situ stress ratios K of 2.5 and 0.5, respectively.
Figure 13 depicts the shear stress along a rock yielded joint that passes beneath the tunnel opening at various in situ stress states. It can be shown that the direction of shear stress is reversed after rock joints pass next to the tunnel opening. Shear stress rises as in situ stress rises. When K equals 2.5, shear stress ranges from −0.26 MPa to 1.52 MPa, while it ranges from −0.707 MPa to 0.102 MPa when K equals 0.5. As a result, shear stress reversal indicates slip occurrence. Figure 14 depicts the inward shear displacement of rock on the underside of the plane of weakness caused by such slip.
As shown in Figure 14, shear inward displacements took place along a rock yielded joint that causes slip at various in situ stress ratios K. It can also be shown that the direction of shear displacements is reversed after joints pass over tunnel excavation.

3.2. Case II-Impact of Tunnel Depth

The effect of tunnel depth, below surface, on the state of stress-displacement around tunnel opening has been examined herein. The reference tunnel model (RTM) presents an opening initially located at 50 m depth below surface, joint dip angle is 30 degrees, spacing between joints is 5 m and in situ stress ratio is 2.13. Consequently, series of models have been constructed where the tunnel opening is situated at different depths (e.g., 100, 150, 200 and 250 ms), as introduced before in Table 1. The stability of the tunnel opening is introduced and discussed in terms of wall convergence ratio, roof sag and floor heave ratio, induced-stress, strength of rock, stress concentration and length of yielding regions. The threshold for each evaluation criterion has been set to evaluate the performance of the tunnel accordingly (e.g., under prescribed conditions).

3.2.1. Ratio of Wall Convergence

Figure 15 shows the ratio of tunnel right wall convergence (RWCR) at various depths below surface monitored at different horizontal displacements from tunnel boundary (e.g., key point #3). After tunnel opening has been excavated, both tunnel walls tend to move the entire tunnel opening. The ratio of tunnel left wall convergence ratio (LWCR), at different depths below the surface, is plotted in Figure 16. It is obvious that the closure ratio in the tunnel’s left wall increases as depth increases.

3.2.2. Roof Sag and Floor Heave Ratio

The roof sag and floor heave ratio at different tunnel depths are shown in Figure 17. The roof sag and floor heave are measured at different vertical distances from the tunnel boundary (e.g., key points #1 and #4), respectively. It shows that the ratio of sag in the roof and heave in the floor increases as depth increases.

3.2.3. Induced-Stress

Induced stress is defined as the difference between pre- (in situ stress field) and post-excavated stress. The major induced stress is the maximum resulting induced stress. The induced-stresses, around tunnel opening, against tunnel depth below surface are plotted as shown in Figure 18. It can be shown that, as depth extends downwards, the induced-stresses increase (e.g., tensile stresses).

3.2.4. Strength of Rock (SF)

The strength factor, which is equivalent to the safety factor, is defined as the ratio of the unconfined compressive strength of intact rock to the induced stress (post-excavated stress). Figure 19 depicts the strength of rock mass after tunnel opening has been created at different depths below the surface. It can be shown that, as depth increases below the surface, the stability of tunnel opening deteriorates particularly around tunnel roof, floor and right wall (e.g., SF ˂ 1.0). However, the tunnel left wall remains stable at all different depths.

3.2.5. Stress Concentration Factor (SCF)

SCF is defined as the ratio of post-excavated to pre-excavated (in situ) stress. Figure 20 shows the stress concentration around tunnel opening at different depths below the surface. It can be shown that the stress concentration decreases as the tunnel depth increases. Except for the left wall, as shown in Figure 20, this applies in the 50–100 m range. As tunnel depth increases from 100 m to 250 m, the SCF changes very little or not at all.

3.2.6. Extent of Yielding Zones

The depth of failure zones around tunnel opening at multiple depths below surface is shown Figure 21. It is clear that the depth of yielding zones increases as tunnel depth extends below surface. The development contours of yielding zones around tunnel opening at different depths are shown in Figure 22. Rock mass support measures could also be proposed in this analysis. Thus, the yielding evaluation criterion is based on the rock support’s minimum anchorage length. In this case, tunnel opening performance is unsatisfactory when the extent of yield zones exceeds the embedment length of rock support (e.g., extent of yielding exceeds 1.5 m).

3.2.7. Stress-Displacements along Rock Joints

Figure 23 shows the normal stress along a rock yielded joint that runs beneath the tunnel opening at different depths below the surface. It can be shown that the normal stress along this yielded joint is sharply dropped in the vicinity of the centre of tunnel opening. Figure 24 depicts the shear stress along a rock yielded joint that passes below the tunnel opening at different tunnel depths. It can be shown that, shear stress along that yielded joint increases as tunnel depth increases below surface. Additionally, the direction of shear stress is reversed when this joint passes close to tunnel opening. Thereby, resultant slip causes inward shear displacement along this yielded rock joint as shown in Figure 25. It is clear that the shear displacement along increases as tunnel depth increases. The maximum shear displacement is 0.0011 m obtained at tunnel depth of 250 m. Despite the fact that the analysis shows that shear displacements are insignificant. They do, however, indicate the occurrence of a slip. This means that rock rotation is likely to interact with shear displacement.

4. Discussion

Case I represents an examination of the effect of in situ stress ratio on tunnel opening performance. In the light of rock mass deformation results, it can be said that the performance of tunnel opening is satisfactory (e.g., maximum WCR in the tunnel walls ˂ 1.5%, RSR ˂ 0.5% and FHR ˂ 0.5%). Alternatively, the maximum deformations ratios occur at in situ stress ratio K of 2.5 in tunnel right wall (RWCR), left wall (LWCR), roof sag (RSR) and floor heave (FHR) are −0.0148%, 0.0046%, −0.0148% and −0.01006%, respectively. As the in situ stress increases, the shear stress increases. For instances, the minimum shear stresses along rock joints, when they pass the tunnel opening, are −0.26 MPa and −0.707 MPa at in situ stress ratios K of 2.5 and 0.5, respectively. Additionally, the shear stress ranges from −0.26 MPa to 1.52 MPa at “K” equals 2.5, while it ranges from −0.707 MPa to 0.102 MPa when ʺKʺ equals 0.5. Thereby, the reversal of shear stress indicates slip occurrence. Such slip causes inward shear displacement of rock on the underside of the plane of weakness. In addition, shear displacements increase as in situ stress K increases. For instances, the shear displacements along rock joints are −4.52 × 10⁻⁵ and −1.71 × 10⁻⁵ ms at in situ stress ratio K of 0.5 and 2.5, respectively. Shear displacement ranges from −4.52 × 10⁻⁵ m to 6.83 × 10⁻⁶ m at in situ stress ratio K of 0.5 and it ranges from −1.71 × 10⁻⁵ m to 0.00024 m when in situ stress ratio equals to 2.5. Irrespective of these insignificant shear amplitudes. They do, but nevertheless, demonstrate the incidence of a slip. In other words, rock mass rotation is expected to be associated with shear displacement.
Case II investigates the effect of tunnel depth below the surface on its stability performance. It can be shown that, as depth extends below surface, the ratio of convergence increases. The maximum RWCR is found at tunnel depth of 250 m (e.g., measured at zero distance from key point #3 on tunnel perimeter) is −0.07%. The maximum LWCR is 0.0344% at tunnel depth of 250 m (e.g., monitored at zero distance from key point #2 on tunnel boundary). However, these results reveal that the ratio of convergence increases as depth extends below surface, but stability of tunnel is still satisfactory (e.g., WCR ˂ 1.50%). The maximum roof sag ratio (e.g., RSR = −0.096%) is found at zero-meter vertical distance from the tunnel boundary (e.g., key point #1), while the maximum ratio of floor heave (FHR = 0.028%) is measured at zero-meter vertical distance from the tunnel floor boundary (e.g., reference point #4). The tunnel unsatisfactory performance is reached when the roof sag ratio (RSR ˃ 0.5%) and floor heave ratio (FHR ˃ 0.5%) exceed 0.5%. Therefore, according to the obtained results, tunnel opening is still stable. In terms of induced stress, rock mass around the tunnel would fail in tension (e.g., brittle shear failure). At tunnel depth of 50 m, the induced-stresses around tunnel roof/back, floor, right wall (RW) and left wall (LW) are 0.13, 0.57, −0.62 MPa and −2.31 MPa, while, at 250 m tunnel depth, they become −9.9 MPa, −8.9 MPa, −6.9 MPa and −11 MPa, respectively. The induced-stresses indicate the failure mechanism of rock mass. Induced stress values that are negative may indicate high in situ stresses, especially at great depths. Compressive stress is indicated by the negative sign. The state of equilibrium and uniformly distributed in situ stresses are disturbed after excavating the tunnel opening. As a result, an elasto-plastic deformation occurs following the removal of rock mass within the tunnel. The shape of the underground opening determines whether in situ stresses are distributed uniformly or not. If K < 1, the change in stress level in the rock mass is more noticeable around the sidewalls. If K > 1, the stress level changes more dramatically around the roof and reverse. However, the difference in the change in stress level decreases as it approaches the opening. On the other hand, brittle shear fractures can occur around the opening in the form of spalling, peeling, or cracks. The loss of cohesive force inherent in rock determines the brittle fracture process. When the ratio of the difference between the maximum and minimum induced stresses to the compressive strength of intact rock exceeds 33%, damage begins and the depth of brittle shear fracture can be measured. The stress concentration factor (SCF) decreased from 1.05, 0.16, 0.68 and 1.23 (e.g., at depth of 50 m) to 0.24, 0.15, 0.31 and 0.26 (e.g., at depth of 250 m) around tunnel roof, left wall (LW), right wall (RW) and floor, respectively. More importantly, the length of yielding zones, around tunnel roof and floor, extends beyond the anchorage length of rock support (e.g., depth of yielding ˃ 1.50 m) when tunnel depth is150 m. The normal stress along joints increases (e.g., stress = 11.29 MPa) as tunnel depth extends downwards (e.g., depth = 250 m). In terms of stress-displacement along rock joints, the findings suggest that normal stress, shear stress, and shear displacement along joints are more sensitive to tunnel depth than in situ stress ratio.

5. Conclusions

This paper presents parametric stability analysis of underground tunnel opening with a focus on two major factors, namely state of in situ stress field and tunnel depth below surface. The results of this sensitivity analysis are used to evaluate the tunnel performance in terms of state of stress-deformation into rock mass after tunnel opening has been excavated. Six failure evaluation criteria have been used herein in this study, namely ratios of tunnel walls convergence, roof sag, floor heave, rock strength, stress concentration, induced-stress and depth of yielding zones into rock mass around tunnel opening. The results indicate that the ratios of wall convergence, roof sag and floor heave increase as both in situ stress and tunnel depth below surface increase. More specifically:
The maximum increase in the ratio of wall convergence (e.g., RWCR = −0.07% and LWCR = 0.0344%) is monitored at tunnel perimeter (e.g., at zero-meter lateral distances from the tunnel boundary or key points #2 and #3), in situ stress ratio of 2.5 and tunnel depth of 250 m.
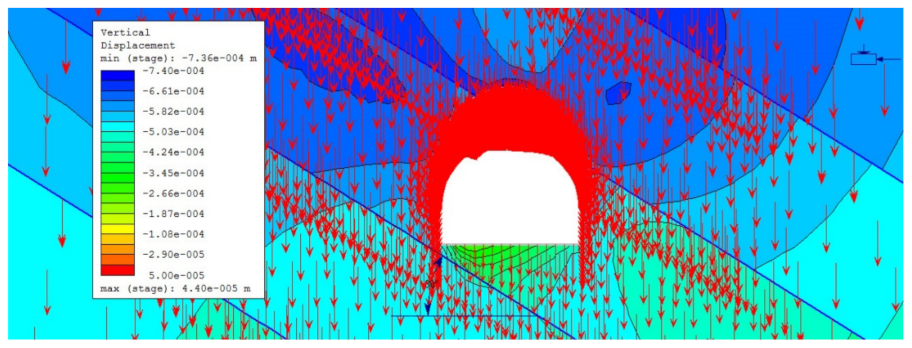
Additionally, the maximum ratio of roof sag (e.g., RSR = −0.096%) and floor heave (e.g., FHR = 0.028%) is obtained at tunnel boundary (e.g., reference points#1 and #4, respectively), in situ stress ratio of 2.5 and tunnel depth of 250 m below surface. However, the performance of tunnel opening is satisfactory (e.g., WCR ˂ 1.5%, RSR ˂ 0.5% and FHR ˂ 0.5%).
Additionally, the induced-stresses around tunnel opening increase as both in situ stress ratio and tunnel depth below surface increase. The maximum induced-stress (e.g., −11 Mpa) is found around tunnel left wall at in situ stress ratio of 2.5 and tunnel depth of 250 m below surface.
The stress concentration (SCF) around tunnel opening decreases as both in situ stress ratio and tunnel depth increase. The maximum SCF is found at the tunnel floor (e.g., SCF = 1.23) and depth of 50 m, while the lowest SCF is found at the tunnel left wall (e.g., SCF = 0.15) and depth of 250 m.
In addition, the strength of rock (SF) around tunnel back deteriorates as in situ stress ratio increases (e.g., SF = 0.95 at K = 2.5), while it deteriorates around the tunnel roof, floor and right wall as tunnel depth increases (e.g., SF = 0.95 at depth = 250 m). Additionally, there is discontinuity in the strength contours of rock around the tunnel when they are intersected by rock joints.
In addition, the depth of yielding zones increases in the rock surrounding tunnel roof (e.g., length of yield zones = 2.32 m) and floor (e.g., length of yield zones = 2.68 m) when in situ stress ratio (e.g., K = 2.5) and depth below surface increase (e.g., depth = 250 m). However, the yielding zones, around tunnel roof (e.g., 1.65 m, 1.93 m & 2.32 m) and floor (e.g., 2.28 m, 2.28 m & 2.68 m), only extend beyond the anchorage length of rock support (e.g., length > 1.5 m) when the tunnel depths reach 150, 200 and 250 ms.
Moreover, the normal stress, shear stress and shear displacement along rock yielded joint that runs below tunnel opening at various in situ stress ratios and tunnel depths have been presented and discussed. The results reveal that:
The normal stress (e.g., 11.29 Mpa) along the rock yielded joint that passes beneath tunnel opening (e.g., at the centre of tunnel opening) is sharply dropped (e.g., 0.92 Mpa) and the direction of shear stress (e.g., +8.32 Mpa) is reversed (e.g., −2.64 Mpa) after the joints pass in the vicinity of the tunnel opening.
The latter (e.g., reversal direction of shear stress) indicates slip occurrence which causes inward shear displacement (e.g., maximum shear displacement = 0.0011 m at depth of 250 m) of rock on the underside of the plane of weakness.

Author Contributions

Conceptualization, W.R.A. and M.A.M.A.; methodology, W.R.A., M.A.M.A. and J.-G.K.; software, W.R.A., M.A.M.A. and A.K.M.; validation, W.R.A., A.K.A.H. and M.A.M.A.; formal analysis, W.R.A., M.A.M.A. and J.-G.K.; investigation, M.A.M.A., A.K.A.H. and A.K.M.; resources, J.-G.K. and W.R.A.; data curation, W.R.A., J.-G.K. and M.A.M.A.; writing—original draft preparation, A.K.A.H., A.K.M. and W.R.A.; writing—review and editing, W.R.A. and M.A.M.A. and J.-G.K.; visualization, W.R.A. and M.A.M.A.; supervision, W.R.A. and J.-G.K.; project administration, W.R.A. and M.A.M.A.; funding acquisition, J.-G.K. All authors have read and agreed to the published version of the manuscript.

Funding

This research received no external funding.

Institutional Review Board Statement

Not applicable.

Informed Consent Statement

Not applicable.

Data Availability Statement

Not applicable.

Acknowledgments

The authors would like to thank RocScience for providing them with the RS2D software. The authors sincerely appreciate their assistance.

Conflicts of Interest

The authors declare no conflict of interest.

References

  1. Jiang, X.; Zhang, X.; Wang, S.; Bai, Y.; Huang, B. Case Study of the Largest Concrete Earth Pressure Balance Pipe-Jacking Project in the World. Transp. Res. Rec. 2022, 6, 101–125. [Google Scholar] [CrossRef]
  2. Wang, T.; Tan, T.; Xie, S.; Ma, B. Development and applications of common utility tunnels in China. Tunn. Undergr. Space Technol. 2018, 76, 92–106. [Google Scholar] [CrossRef]
  3. Chen, J.; Zhao, J.; Zhang, S.; Zhang, Y.; Yang, F.; Li, M. An experimental and analytical research on the evolution of mining cracks in deep floor rock mass. Pure Appl. Geophys. 2020, 177, 5325–5348. [Google Scholar] [CrossRef]
  4. Cai, M.; Kaiser, P.K. In-situ rock spalling strength near excavation boundaries. Rock Mech. Rock Eng. 2014, 47, 659–675. [Google Scholar] [CrossRef]
  5. Feng, F.; Li, X.; Rostami, J.; Peng, D.; Li, D.; Du, K. Numerical investigation of hard rock strength and fracturing under polyaxial compression based on Mogi-Coulomb failure criterion. Int. J. Geomech. 2019, 19, 04019005. [Google Scholar] [CrossRef]
  6. Feng, F.; Chen, S.; Li, D.; Hu, S.; Huang, W.; Li, B. Analysis of fractures of a hard rock specimen via unloading of central hole with different sectional shapes. Energy Sci. Eng. 2019, 7, 2265–2286. [Google Scholar] [CrossRef] [Green Version]
  7. Long, Y.; Liu, J.-P.; Lei, G.; Si, Y.-T.; Zhang, C.-Y.; Wei, D.C.; Shi, H.X. Progressive fracture processes around tunnel triggered by blast disturbances under biaxial compression with different lateral pressure coefficients. Trans. Nonferr. Met. Soc. China 2020, 30, 2518–2535. [Google Scholar] [CrossRef]
  8. Luo, Y.; Gong, F.; Li, X.-B.; Wang, S.-Y. Experimental simulation investigation of influence of depth on spalling characteristics in circular hard rock tunnel. J. Cent. South Univ. 2020, 27, 891–910. [Google Scholar] [CrossRef]
  9. Zhao, Z.; Tan, Y.; Chen, S.; Ma, Q.; Gao, X. Theoretical analyses of stress field in surrounding rocks of weakly consolidated tunnel in a high-humidity deep environment. Int. J. Rock Mech. Min. Sci. 2019, 122, 104064. [Google Scholar] [CrossRef]
  10. Li, X.; Cao, W.; Zhou, Z.; Zou, Y. Influence of stress path on excavation unloading response. Tunn. Undergr. Space Technol. 2014, 42, 237–246. [Google Scholar] [CrossRef]
  11. Li, X.; Gong, F.; Tao, M.; Dong, L.; Du, K.; Ma, C.; Zhou, Z.; Yin, T. Failure mechanism and coupled static-dynamic loading theory in deep hard rock mining: A review. J. Rock Mech. Geotech. Eng. 2017, 9, 767–782. [Google Scholar] [CrossRef]
  12. Yang, Z.; Liu, C.; Zhu, H.; Xie, F.; Dou, L.; Chen, J. Experimental study on determining ‘key strata of energy’of rock burst. J. Shandong Univ. Sci. Technol. 2018, 37, 1–10. [Google Scholar]
  13. Vernik, L.; Zoback, M.D. Estimation of maximum horizontal principal stress magnitude from stress-induced well bore breakouts in the Cajon Pass scientific research borehole. J. Geophys. Res. Solid Earth 1992, 97, 5109–5119. [Google Scholar] [CrossRef]
  14. Caudle, R.D.; Clark, G.B. Stresses around Mine Openings in Some Simple Geologic Structures; University of Illinois at Urbana Champaign, College of Engineering, Engineering Experiment Station: Champaign, IL, USA, 1955. [Google Scholar]
  15. Lee, F.T.; Nichols, T.C., Jr.; Abel, J.F., Jr. Some Relations between Stress, Geologic Structure. Geol. Surv. Prof. Pap. 1969, 650, 127. [Google Scholar]
  16. Castillo, J.; Cardenas, C.T.; Agioutantis, Z. Support Design Using the Ground Reaction Curve and Support Reaction Curves at Underground Limestone Mines. In Proceedings of the 55th US Rock Mechanics/Geomechanics Symposium, Houston, TX, USA, 20–23 June 2021. [Google Scholar]
  17. Guo, H.; Ma, Q.; Xue, X.; Wang, D. The analytical method of the initial stress field for rock masses. Chin. J. Geotech. Eng. 1983, 3. [Google Scholar]
  18. Hoek, E.; Kaiser, P.K.; Bawden, W.F. Support of Underground Excavations in Hard Rock; CRC Press: Boca Raton, FL, USA, 2000. [Google Scholar]
  19. Saiang, D. Behaviour of Blast-Induced Damaged Zone around Underground Excavations in Hard Rock Mass; Luleå Tekniska Universitet: Luleå, Sweden, 2008. [Google Scholar]
  20. Malan, D. Manuel Rocha medal recipient simulating the time-dependent behaviour of excavations in hard rock. Rock Mech. Rock Eng. 2002, 35, 225–254. [Google Scholar] [CrossRef]
  21. Palmstrom, A.; Broch, E. Use and misuse of rock mass classification systems with particular reference to the Q-system. Tunn. Undergr. Space Technol. 2006, 21, 575–593. [Google Scholar] [CrossRef]
  22. Naung, N.; Shimada, H.; Sasaoka, T.; Hamanaka, A.; Wahyudi, S.; Mao, P. Risk Evaluations for Stope Mining Affected by Slope Surface. In Proceedings of the 5th ISRM Young Scholars’ Symposium on Rock Mechanics and International Symposium on Rock Engineering for Innovative Future, Okinawa, Japan, 1–4 December 2019. [Google Scholar]
  23. Moammadi, H.; Moammadi, E.; Javamkhoshdel, S. Displacement analysis of shallow tunnels by considering spatial variability. In Rock Mechanics for Natural Resources and Infrastructure Development—Full Papers, Proceedings of the 14th International Congress on Rock Mechanics and Rock Engineering (ISRM 2019), Foz do Iguassu, Brazil, 13–18 September 2019; CRC Press: Boca Raton, FL, USA, 2019. [Google Scholar]
  24. Qiu, H.Z.; Chen, X.Q.; Wu, Q.H.; Wang, R.C.; Zhao, W.Y.; Qian, K.J. Deformation mechanism and collapse treatment of the rock surrounding a shallow tunnel based on on-site monitoring. J. Mt. Sci. 2020, 17, 2897–2914. [Google Scholar] [CrossRef]
  25. Brady, B.H.; Brown, E.T. Rock Mechanics: For Underground Mining; Springer Science & Business Media: Berlin/Heidelberg, Germany, 2006. [Google Scholar]
  26. Bao-lin, W.; Qi-chao, M. Boundary element analysis methods for ground stress field of rock masses. Comput. Geotech. 1986, 2, 261–274. [Google Scholar] [CrossRef]
  27. Zhao, H.; Ma, F.; Jiamo Xu, J.; Guo, J. In situ stress field inversion and its application in mining-induced rock mass movement. Int. J. Rock Mech. Min. Sci. 2012, 53, 120–128. [Google Scholar] [CrossRef]
  28. Zhang, Z.; Gong, R.; Zhang, H.; Lan, Q.; Tang, X. Initial ground stress field regression analysis and application in an extra-long tunnel in the western mountainous area of China. Bull. Eng. Geol. Environ. 2021, 80, 4603–4619. [Google Scholar] [CrossRef]
  29. Deng, X.; Yuan, D.; Yang, D.; Zhang, C. Back analysis of geomechanical parameters of rock masses based on seepage-stress coupled analysis. Math. Probl. Eng. 2017, 2017, 3012794. [Google Scholar] [CrossRef]
  30. Shouju, L.; Yingxi, L.; Denggang, W.; Xiang, H. Parameter identification procedure of initial stress field parameters in rock masses based on genetic algorithm. In Proceedings of the ISRM International Symposium—2nd Asian Rock Mechanics Symposium, Beijing, China, 11–14 September 2001. [Google Scholar]
  31. Wang, H.; Zhao, W. A study on initial geostress field of rock masses in valley zone. Int. J. Simul. Syst. Sci. Technol. 2016, 17, 12.1–12.8. [Google Scholar]
  32. Fu, Q.; Liu, Q.-J.; Yang, K. Optimization inversion analysis of a geo-stress field in a deep mine area: A case study. Arab. J. Geosci. 2021, 14, 1–11. [Google Scholar] [CrossRef]
  33. Zhu, W.; Yang, W.; Li, X.; Xiang, L.; Yu, D. Study on splitting failure in rock masses by simulation test, site monitoring and energy model. Tunn. Undergr. Space Technol. 2014, 41, 152–164. [Google Scholar] [CrossRef]
  34. Sitharam, T.; Sridevi, J.; Shimizu, N. Practical equivalent continuum characterization of jointed rock masses. Int. J. Rock Mech. Min. Sci. 2001, 38, 437–448. [Google Scholar] [CrossRef]
  35. Gong, M.; Qi, S.; Liu, J. Engineering geological problems related to high geo-stresses at the Jinping I Hydropower Station, Southwest China. Bull. Eng. Geol. Environ. 2010, 69, 373–380. [Google Scholar] [CrossRef]
  36. Liu, C. Distribution laws of in-situ stress in deep underground coal mines. Procedia Eng. 2011, 26, 909–917. [Google Scholar] [CrossRef] [Green Version]
  37. Liu, C.; He, X.; Mitri, H.; Aziz, N.; Nie, B.; Wang, Y.; Liu, M.; Saharan, M.R.; Ren, T.X.; Chen, W.; et al. Distribution laws of in-situ stress in deep underground coal mines. In Proceedings of the First International Symposium on Mine Safety Science and Engineering, Beijing, China, 21–23 September 2011. [Google Scholar]
  38. Nguyen, T.T.; Do., N.A.; Karasev, M.A.; Kien, D.V.; Dias, D. Influence of tunnel shape on tunnel lining behaviour. Proc. Inst. Civ. Eng. -Geotech. Eng. 2021, 174, 355–371. [Google Scholar]
  39. Golchinfar, N. Numerical Modeling of Brittle Rock Failure around Underground Openings under Statis and Dynamic Stress Loadings; Laurentian University of Sudbury: Sudbury, ON, Canada, 2013. [Google Scholar]
  40. Hoek, E. Trends in relationships between measured rock in situ stress and depth. Int. J. Rock Mech. Min. Sci. Geomech. Abstr. 1978, 15, 211–215. [Google Scholar]
  41. Mayeur, B.; Fabre, D. Mesure et modélisation des contraintes naturelles. Application au projet de tunnel ferroviaire Maurienne–Ambin. Bull. Eng. Geol. Environ. 1999, 58, 45–59. [Google Scholar] [CrossRef]
  42. Filali, M. Conductivité Thermique Apparente des Milieux Granulaires Soumis à des Contraintes Mécaniques: Modélisation et Mesures. Ph.D. Thesis, Institut National Polytechnique de Toulouse, Toulouse, France, 2006. [Google Scholar]
  43. Rizzo, K.J.; Hubert, O.; Daniel, L.; Solas, D. Mesure et modélisation du comportement magnéto-mécanique de monocristaux de fer-silicium sous contrainte. In Matériaux; École Normale Supérieure de Cachan: Gif-sur-Yvette, France, 2010. [Google Scholar]
  44. Stille, H.; Palmström, A. Ground behaviour and rock mass composition in underground excavations. Tunn. Undergr. Space Technol. 2008, 23, 46–64. [Google Scholar] [CrossRef]
  45. Brown, E.T.; Bray, J.W.; Ladanyi, B.; Hoek, E. Ground response curves for rock tunnels. J. Geotech. Eng. 1983, 109, 15–39. [Google Scholar] [CrossRef]
  46. Alonso, E.; Alejano, L.R.; Varas, F.; Fdez-Manin, G.; Carranza-Torres, C. Ground response curves for rock masses exhibiting strain-softening behaviour. Int. J. Numer. Anal. Methods Geomech. 2003, 27, 1153–1185. [Google Scholar] [CrossRef]
  47. Park, K.-H.; Tontavanich, B.; Lee, J.-G. A simple procedure for ground response curve of circular tunnel in elastic-strain softening rock masses. Tunn. Undergr. Space Technol. 2008, 23, 151–159. [Google Scholar] [CrossRef]
  48. Palmstrom, A.; Stille, H. Ground behaviour and rock engineering tools for underground excavations. Tunn. Undergr. Space Technol. 2007, 22, 363–376. [Google Scholar] [CrossRef]
  49. Kaiser, P.K.; Diederichs, M.S.; Martin, C.D.; Sharp, J.; Steiner, W. Underground works in hard rock tunnelling and mining. In Proceedings of the ISRM International Symposium, Melbourne, VC, Australia, 19–24 November 2000. [Google Scholar]
  50. Abdel-Meguid, M. Selected Three-Dimensional Aspects of Tunneling; National Library of Canada: Ottawa, ON, USA, 2003. [Google Scholar]
  51. Hoek, E.; Marinos, P. Tunnelling in overstressed rock. In Proceedings of the ISRM Regional Symposium-EUROCK 2009, Cavtat, Croatia, 29–31 October 2009. [Google Scholar]
  52. Tanimoto, C.; Hata, S.; Fujiwara, T.; Yoshioka, H.; Michihiro, K. Relationship between deformation and support pressure in tunnelling through overstressed rock. In Proceedings of the 6th ISRM Congress, Montreal, QC, Canada, 30 August–3 September 1987. [Google Scholar]
  53. Klein, S. An approach to the classification of weak rock for tunnel projects. In Proceedings of the Rapid Excavation and Tunneling Conference, San Francisco, CA, USA, 13 June 2001. [Google Scholar]
  54. Panji, M.; Asgari, M.J.; Tavousi, T.S. Evaluation of effective parameters on the underground tunnel stability using BEM. J. Struct. Eng. Geotech. 2011, 1, 29–37. [Google Scholar]
  55. Pan, X.-D.; Brown, E.T. Influence of axial stress and dilatancy on rock tunnel stability. J. Geotech. Eng. 1996, 122, 139–146. [Google Scholar] [CrossRef]
  56. Lu, M.; Grøv, E.; Holmøy, K.H.; Trinh, N.Q.; Larsen, T.E. Tunnel stability and in-situ rock stress. In Proceedings of the ISRM International Symposium on In-Situ Rock Stress, Beijing, China, 25–27 August 2010. [Google Scholar]
  57. Read, R.; Chandler, N.; Dzik, E. In situ strength criteria for tunnel design in highly-stressed rock masses. Int. J. Rock Mech. Min. Sci. 1998, 35, 261–278. [Google Scholar] [CrossRef]
  58. Lu, M.; Nguyen, N.P. In-situ Rock Stress and Tunnel Stability. In Proceedings of the ISRM VietRock International Workshop, Hanoi, Vietnam, 12–13 March 2015. [Google Scholar]
  59. Hudson, J.; Cooling, C. In situ rock stresses and their measurement in the UK—Part I. The current state of knowledge. Int. J. Rock Mech. Min. Sci. Geomech. Abstr. 1988, 25, 363–370. [Google Scholar] [CrossRef]
  60. Cooling, C.; Hudson, J.; Tunbridge, L. In situ rock stresses and their measurement in the UK—Part II. Site experiments and stress field interpretation. Int. J. Rock Mech. Min. Sci. Geomech. Abstr. 1988, 25, 371–382. [Google Scholar] [CrossRef]
  61. Zhou, D.; Wu, K.; Li, L.; Diao, X.; Kong, X. A new methodology for studying the spreading process of mining subsidence in rock mass and alluvial soil: An example from the Huainan coal mine, China. Bull. Eng. Geol. Environ. 2016, 75, 1067–1087. [Google Scholar] [CrossRef]
  62. Pine, R.; Ledingham, P.; Merrifield, C. In-situ stress measurement in the Carnmenellis granite—II. Hydrofracture tests at Rosemanowes quarry to depths of 2000 m. Int. J. Rock Mech. Min. Sci. Geomech. Abstr. 1983, 20, 63–72. [Google Scholar] [CrossRef]
  63. Pine, R.; Tunbridge, L.; Kwakwa, K. In-situ stress measurement in the Carnmenellis granite—I. Overcoring tests at South Crofty Mine at a depth of 790 m. Int. J. Rock Mech. Min. Sci. Geomech. Abstr. 1983, 20, 51–62. [Google Scholar] [CrossRef]
  64. Amadei, B. In situ stress measurements in anisotropic rock. Int. J. Rock Mech. Min. Sci. Geomech. Abstr. 1984, 21, 327–338. [Google Scholar] [CrossRef]
  65. Fama, M.D.; Pender, M.J. Analysis of the hollow inclusion technique for measuring in situ rock stress. Int. J. Rock Mech. Min. Sci. Geomech. Abstr. 1980, 17, 137–146. [Google Scholar] [CrossRef]
  66. Martna, J.; Hansen, L. Initial rock stresses around the Vietas headrace tunnels nos. 2 and 3, Sweden. In Proceedings of the ISRM International Symposium, Moscow, Russia, 24–26 June 1986. [Google Scholar]
  67. Stephansson, O.; Brown, E. Rock stress and rock stress measurements—A review. In Modelling of Mine Structures, Proceedings of the 10th Plenary Session of the International Bureau of Strata Mechanics, World Mining Congress; Stockholm, Sweden, 4 June 1987, Routledge: Oxfordshire, UK, 2021. [Google Scholar]
  68. Whyatt, J.K. Influence of Geologic Structures on Stress Variation and the Potential for Rockbursting in Mines with Particular Reference to the Lucky Friday Mine, Idaho; University of Minnesota: Minneapolis, MN, USA, 2000. [Google Scholar]
  69. Wang, S.; Elsworth, D.; Liu, J. International Journal of Rock Mechanics & Mining Sciences. Int. J. Rock Mech. Min. Sci. 2013, 58, 34–45. [Google Scholar]
  70. Martna, J.; Hansen, L. Tunnelling in a complex rock mass: Experience from Vietas, Swedish Lapland. Tunn. Undergr. Space Technol. 1988, 3, 283–294. [Google Scholar] [CrossRef]
  71. Stephansson, O.; Zang, A. ISRM suggested methods for rock stress estimation—Part 5: Establishing a model for the in situ stress at a given site. In The ISRM Suggested Methods for Rock Characterization, Testing and Monitoring: 2007–2014; Springer: Berlin/Heidelberg, Germany, 2012; pp. 187–201. [Google Scholar]
  72. Hickman, S.H. Stress in the lithosphere and the strength of active faults. Rev. Geophys. 1991, 29, 759–775. [Google Scholar] [CrossRef]
  73. Clement, C.; Merrien-Soukatchoff, V.; Dünner, C.; Gunzburger, Y. Stress measurement by overcoring at shallow depths in a rock slope: The scattering of input data and results. Rock Mech. Rock Eng. 2009, 42, 585–609. [Google Scholar] [CrossRef]
  74. Kuriyagawa, M.; Kobayashi, H.; Matsunaga, I.; Yamaguchi, T.; Hibiya, K. Application of hydraulic fracturing to three-dimensional in situ stress measurement. Int. J. Rock Mech. Min. Sci. Geomech. Abstr. 1989, 26, 587–593. [Google Scholar] [CrossRef]
  75. Friedel, M.J.; Thill, R.E. Stress Determination in Rock Using the Kaiser Effect; US Department of the Interior, Bureau of Mines: Washington, DC, USA, 1990; Volume 9286. [Google Scholar]
  76. Zhi, Y.; Honghai, F.; Gang, L.; Yunlong, W. Estimating formation pore pressure in tectonic compression zones. Pet. Sci. Technol. 2012, 30, 766–774. [Google Scholar] [CrossRef]
  77. Jayanthu, S.; Rao, G.; Prasad, B. Aacoustic emission trends in kaiser effect of rocks–a new approach for estimation of in situ stress. In Proceedings of the MINETECH’12—Workshop on Exploration, Exploitation, Equipment, Safety and Environment, Bhubhaneswar, India, 4–5 May 2012. [Google Scholar]
  78. Lavrov, A. The Kaiser effect in rocks: Principles and stress estimation techniques. Int. J. Rock Mech. Min. Sci. 2003, 40, 151–171. [Google Scholar] [CrossRef]
  79. Pestman, B.J.; Holt, R.M.; Kenter, C.J.; van Munster, J.G. Field application of a novel core-based in-situ stress estimation technique. In Proceedings of the SPE/ISRM Rock Mechanics Conference, Irving, TX, USA, 20–23 October 2002. [Google Scholar]
  80. Louchnikov, V. A Numerical Investigation into the Stress Memory Effect in Rocks. Ph.D. Thesis, University of Adelaide, Adelaide, SA, Australia, 2004. [Google Scholar]
  81. Yang, L.; Zhang, K.; Wang, Y. Back analysis of initial rock stresses and time-dependent parameters. Int. J. Rock Mech. Min. Sci. Geomech. Abstr. 1996, 33, 641–645. [Google Scholar] [CrossRef]
  82. Yao, T.; Mo, Z.; Qian, L.; He, J.; Zhang, J. Local Stress Field Correction Method Based on a Genetic Algorithm and a BP Neural Network for In Situ Stress Field Inversion. Adv. Civ. Eng. 2021, 2021, 4396168. [Google Scholar] [CrossRef]
  83. Qian, L.; Yao, T.; Mo, Z.; Zhang, J.; Li, Y.; Zhang, R.; Xu, N.; Li, Z. GAN inversion method of an initial in situ stress field based on the lateral stress coefficient. Sci. Rep. 2021, 11, 1–17. [Google Scholar] [CrossRef] [PubMed]
  84. Li, X.; Zhou, X.; Xu, Z.; Feng, T.; Wang, D.; Deng, J.; Zhang, G.; Li, C.; Feng, G.; Zhang, R.; et al. Inversion method of initial in situ stress field based on BP neural network and applying loads to unit body. Adv. Civ. Eng. 2020, 2020, 8840940. [Google Scholar] [CrossRef]
  85. Ning, Y.; Tang, H.; Smith, J.V.; Zhang, B.; Shen, P.; Zhang, G. Study of the in situ stress field in a deep valley and its influence on rock slope stability in Southwest China. Bull. Eng. Geol. Environ. 2021, 80, 3331–3350. [Google Scholar] [CrossRef]
  86. Nikolić, M.; Roje-Bonacci, T.; Ibrahimbegović, A. Overview of the numerical methods for the modelling of rock mechanics problems. Teh. Vjesn. 2016, 23, 627–637. [Google Scholar]
  87. Jing, L. A review of techniques, advances and outstanding issues in numerical modelling for rock mechanics and rock engineering. Int. J. Rock Mech. Min. Sci. 2003, 40, 283–353. [Google Scholar] [CrossRef]
  88. Gao, W.; Ge, M. Back analysis of rock mass parameters and initial stress for the Longtan tunnel in China. Eng. Comput. 2016, 32, 497–515. [Google Scholar] [CrossRef]
  89. Malan, D. Implementation of a viscoplastic model in FLAC to investigate rate of mining problems. In FLAC and Numerical Modeling in Geomechanics; CRC Press: Boca Raton, FL, USA, 2020; pp. 497–504. [Google Scholar]
  90. Zhang, L.-h. Pre-processing and post-processing method for geostress simulation using seismic interpretation results. Min. Sci. Technol. 2009, 19, 369–372. [Google Scholar] [CrossRef]
  91. Li, K. Numerical Analysis of Undersea Geostress Field around Fault. Electron. J. Geotech. Eng. 2015, 20, 1887–1896. [Google Scholar]
  92. Li, X.; Xu, M.; Wang, Y.; Wang, G.; Huang, J.; Yin, W.; Yan, G. Numerical study on crack propagation of rock mass using the time sequence controlled and notched blasting method. Eur. J. Environ. Civ. Eng. 2021, 1–19. [Google Scholar] [CrossRef]
  93. Yue, Z.; Zhou, J.; Feng, C.; Wang, X.; Peng, L.; Cong, J. Coupling of material point and continuum discontinuum element methods for simulating blast-induced fractures in rock. Comput. Geotech. 2022, 144, 104629. [Google Scholar] [CrossRef]
  94. Song, X.; Chen, C.; Xia, K.; Yang, K.; Chen, S.; Liu, X. Analysis of the surface deformation characteristics and strata movement mechanism in the main shaft area of Chengchao Iron Mine. Environ. Earth Sci. 2018, 77, 1–14. [Google Scholar] [CrossRef]
  95. Zhang, S.-r.; Hu, A.k.; Wang, C. Three-dimensional inversion analysis of an in situ stress field based on a two-stage optimization algorithm. J. Zhejiang Univ. Sci. A 2016, 17, 782–802. [Google Scholar] [CrossRef] [Green Version]
  96. Xia, K.; Chen, C.; Liu, X.; Fu, H.; Pan, Y.; Deng, Y. Mining-induced ground movement in tectonic stress metal mines: A case study. Bull. Eng. Geol. Environ. 2016, 75, 1089–1115. [Google Scholar] [CrossRef]
  97. Wang, P.; Li, H.; Li, Y.; Cheng, B. Stability analysis of backfilling in subsiding area and optimization of the stoping sequence. J. Rock Mech. Geotech. Eng. 2013, 5, 478–485. [Google Scholar] [CrossRef] [Green Version]
  98. Liu, C.; Li, H.; Mitri, H. Effect of strata conditions on shield pressure and surface subsidence at a longwall top coal caving working face. Rock Mech. Rock Eng. 2019, 52, 1523–1537. [Google Scholar] [CrossRef]
  99. Heidarzadeh, S.; Saeidi, A.; Rouleau, A. The damage-failure criteria for numerical stability analysis of underground excavations: A review. Tunn. Undergr. Space Technol. 2021, 107, 103633. [Google Scholar] [CrossRef]
  100. Li, G.; Mizuta, Y.; Ishida, T.; Li, H.; Nakama, S.; Sato, T. Stress field determination from local stress measurements by numerical modelling. Int. J. Rock Mech. Min. Sci. 2009, 46, 138–147. [Google Scholar] [CrossRef] [Green Version]
  101. Konietzky, H.; Kamp, L.; Hammer, H.; Niedermeye, S. Numerical modelling of in situ stress conditions as an aid in route selection for rail tunnels in complex geological formations in South Germany. Comput. Geotech. 2001, 28, 495–516. [Google Scholar] [CrossRef]
  102. Zhao, J.-J.; Zhang, Y.; Ranjith, P. Numerical modelling of blast-induced fractures in coal masses under high in-situ stresses. Eng. Fract. Mech. 2020, 225, 106749. [Google Scholar] [CrossRef]
  103. Yan, G.; Yang, Q.; Zhang, F.; Hao, Q.; Wang, X.; Wang, H. Experimental Study on the Effects of In Situ Stress on the Initiation and Propagation of Cracks during Hard Rock Blasting. Appl. Sci. 2021, 11, 11169. [Google Scholar] [CrossRef]
  104. Luo, Y.; Huang, J.; Lu, W.; Zhang, G.; Li, X.; Song, K. Study on transient unloading loosening simulation test of excavation of jointed rock mass. Proc. Inst. Civ. Eng.-Geotech. Eng. 2021, 174, 645–656. [Google Scholar] [CrossRef]
  105. Jin, Z.; Peng, Y.; Wen-Bo, L.; Ming, C.; Gao-Hui, W. Propagation mechanism of fracture zones in single-hole rock mass under high in-situ stress. In Proceedings of the IOP Conference Series: Earth and Environmental Science, Prague, Czech Republic, 6–10 September 2021. [Google Scholar]
  106. Wan, L.; Wang, J.; Ma, D.; Zeng, Q.; Li, Z.; Zhu, Y. Vibration Response Analysis of Hydraulic Support Based on Real Shape Coal Gangue Particles. Energies 2022, 15, 1633. [Google Scholar] [CrossRef]
  107. Zhu, Z.; Gao, W.; Wan, D.; Wang, M.; Shu, Y. Numerical Study of Fracture Characteristics of Deep Granite Induced by Blast Stress Wave. Shock Vib. 2021, 2021, 2579569. [Google Scholar] [CrossRef]
  108. Li, C.; Kang, Y.; Zhang, Y.; Luo, H. Effect of double holes on crack propagation in PMMA plates under blasting load by caustics method. Theor. Appl. Fract. Mech. 2021, 116, 103103. [Google Scholar] [CrossRef]
  109. Ghiasi, V.; Koushki, M. Numerical and artificial neural network analyses of ground surface settlement of tunnel in saturated soil. SN Appl. Sci. 2020, 2, 1–14. [Google Scholar] [CrossRef]
  110. Wasantha, P.; Guerrieri, M.; Xu, T. Effects of tunnel fires on the mechanical behaviour of rocks in the vicinity—A review. Tunn. Undergr. Space Technol. 2021, 108, 103667. [Google Scholar] [CrossRef]
  111. Abdellah, W.R.; Ali, M.A.; Yang, H.S. Studying the effect of some parameters on the stability of shallow tunnels. J. Sustain. Min. 2018, 17, 20–33. [Google Scholar] [CrossRef]
  112. Das, R.; Singh, T. Effect of closely spaced, non-persistent ubiquitous joint on tunnel boundary deformation: A case study from Himachal Himalaya. Geotech. Geol. Eng. 2021, 39, 2447–2459. [Google Scholar] [CrossRef]
  113. Sanei, M.; Faramarzi, L.; Goli, S.; Fahimifar, A.; Rahmati, A.; Mehinrad, A. Development of a new equation for joint roughness coefficient (JRC) with fractal dimension: A case study of Bakhtiary Dam site in Iran. Arab. J. Geosci. 2015, 8, 465–475. [Google Scholar] [CrossRef]
Figure 1. In situ horizontal and vertical stresses imposed on rock mass before creating tunnel opening.
Applsci 12 05399 g001
Figure 2. Geometry, dimensions and boundary conditions of the reference tunnel model (RTM).
Applsci 12 05399 g002
Figure 3. Ratio of convergence occurs in the tunnel right wall (RWCR) at various in situ stress ratios monitored at different lateral distances from tunnel boundary (e.g., point #3).
Applsci 12 05399 g003
Figure 4. Ratio of convergence occurs in the tunnel left wall (RWCR) at various in situ stress ratios measured at different lateral distances from tunnel boundary (e.g., point #2).
Applsci 12 05399 g004
Figure 5. Vectors of horizontal displacement contours of rock after tunnel opening has been introduced at in situ stress ratio, K, of 2.5.
Applsci 12 05399 g005
Figure 6. The ratio of roof sag and floor heave at various in situ stress ratios K monitored at different vertical displacements from tunnel boundary (e.g., point #1 and point #4), respectively.
Applsci 12 05399 g006
Figure 7. Vectors of vertical displacements of rock mass around tunnel boundary at in situ stress K of 2.5 after tunnel opening is created.
Applsci 12 05399 g007
Figure 8. Induced-stress against in situ stress ratio around tunnel boundary.
Applsci 12 05399 g008
Figure 9. Stress concentration around tunnel opening at different states of in situ stress K.
Applsci 12 05399 g009
Figure 10. Strength contours of rock mass around tunnel opening at different states of in situ stress.
Applsci 12 05399 g010aApplsci 12 05399 g010b
Figure 11. Extent of yielding zones around tunnel opening at various in situ stress ratios K.
Applsci 12 05399 g011aApplsci 12 05399 g011b
Figure 12. Normal stresses along rock yielded-joint that runs beneath the tunnel opening at various in situ stress ratios K.
Applsci 12 05399 g012
Figure 13. Shear stress along a rock yielded joint that passes below the tunnel opening at various in situ stress ratios K.
Applsci 12 05399 g013
Figure 14. Shear displacements along a rock yielded joint that runs below the tunnel opening at various in situ stress ratios K.
Applsci 12 05399 g014
Figure 15. Convergence ratios of tunnel right wall (RWCR) at various tunnel depths below surface measured at different lateral distances from (e.g., reference point #3) the tunnel perimeter.
Applsci 12 05399 g015
Figure 16. Convergence ratios of tunnel left wall (LWCR) at various tunnel depths below surface measured at different lateral distances from (e.g., reference point #2) the tunnel perimeter.
Applsci 12 05399 g016
Figure 17. Roof sag and floor heave percent at various tunnel depths below surface (e.g., are measured at different vertical distances from tunnel boundary).
Applsci 12 05399 g017
Figure 18. Induced-stresses around tunnel boundary at various depths below surface.
Applsci 12 05399 g018
Figure 19. Strength factor of rock mass around tunnel opening at various depths below surface.
Applsci 12 05399 g019
Figure 20. Stress concentration around tunnel opening at various depths below surface.
Applsci 12 05399 g020
Figure 21. Depth of yielding zones into rock around tunnel at different depths below surface.
Applsci 12 05399 g021
Figure 22. Development of failure zones contours around tunnel opening at various depths below surface.
Applsci 12 05399 g022
Figure 23. Normal stress along a rock yielded joint that passes below the tunnel opening at various tunnel depths below surface.
Applsci 12 05399 g023
Figure 24. Shear stress along a rock yielded joint that runs beneath the tunnel opening at various tunnel depths below surface.
Applsci 12 05399 g024
Figure 25. Shear displacement along a rock yielded joint that runs beneath the tunnel opening at different tunnel depth below surface.
Applsci 12 05399 g025
Table 1. Different factors considered during the sensitivity analysis.
Parameter/AnalysisCase ICase II
In situ stress ratio, KK = 0.5, 1, 1.5, 1.65, 1.80, 2, 2.13 & 2.52.13
Tunnel depth, m50Z = 50, 100, 150, 200 & 250
Joint dip angle, α (deg.)3030
Joint spacing, m55
Table 2. Geomechanical properties of rock mass and joints [111,112].
Rock Mass PropertyLimestoneSlate
Density (kg/m3)26002500
UCS (MPa)30–250100–200
Poisson’s ratio, υ0.300.25
Tensile strength, σt (Mpa)0.600.10
Friction angle, ϕ (deg.)4035
Young’s Modulus, E (Gpa)352.60
Cohesion, C (Mpa)10.25
Dilation angle, Ψ (deg.)2015
Rock joints properties [112]
Normal stiffness, Kn (Gpa)21
Shear stiffness, Ks (Gpa)15
Friction angle (deg.)39 [113]
Table 3. Ratio of right wall convergence (RWCR) at various in situ stresses and different distances from the right wall of the tunnel (e.g., from reference point #3).
K, ValueRight Wall Convergence Ratio (RWCR), %
Distance from the Right Wall of the Tunnel (e.g., from Reference Point #3)
0.0 m0.5 m1.0 m1.5 m2.0 m2.5 m
0.5−0.00376−0.00292−0.00264−0.00264−0.00236−0.00236
1.0−0.00622−0.00546−0.00508−0.0047−0.0047−0.00432
1.5−0.009−0.00794−0.00742−0.00688−0.00688−0.00636
1.65−0.0098−0.00862−0.00804−0.00804−0.00744−0.00686
1.80−0.0106−0.0093−0.00866−0.00866−0.008−0.008
2.0−0.0118−0.01034−0.01034−0.00962−0.00888−0.00888
2.13−0.0126−0.01102−0.01102−0.01024−0.00944−0.00944
2.50−0.0148−0.01384−0.01286−0.0119−0.0119−0.01092
Table 4. Ratio of left wall convergence (LWCR) at various in situ stresses and different distances from the left wall of the tunnel (e.g., from reference point #2).
K, ValueLeft Wall Convergence Ratio (LWCR), %
Distance from the Left Wall of the Tunnel (e.g., from Reference Point #2)
0.0 m0.5 m1.0 m1.5 m2.0 m2.5 m
0.5−0.00096−0.00124−0.00152−0.00152−0.0018−0.0018
1.00.00024−0.00014−0.00052−0.0009−0.0009−0.00128
1.50.00160.001070.000540.00001−0.00052−0.00052
1.650.0020.001410.000820.00023−0.00036−0.00036
1.800.001750.001750.00110.00045−0.0002−0.0002
2.00.00280.002080.001340.000610.00061−0.00012
2.130.00320.00240.001620.000830.000830.00004
2.500.00460.003640.002660.001690.001690.00072
Table 5. Ratio of roof sag (RSR) at various in situ stresses and different distances from the roof of the tunnel (e.g., from reference point #1).
K, ValueRoof Sag Wall Ratio (RSR), %
Distance from the Roof of the Tunnel (e.g., from Reference Point #1)
0.0 m0.5 m1.0 m1.5 m2.0 m2.5 m
0.5−0.015−0.0142−0.0142−0.0142−0.0142−0.0134
1.0−0.0148−0.01402−0.01402−0.01322−0.01322−0.01322
1.5−0.0142−0.0134−0.0134−0.0134−0.0134−0.0134
1.65−0.0142−0.0134−0.0134−0.0134−0.0126−0.0126
1.80−0.01426−0.0135−0.0135−0.01276−0.01276−0.01276
2.0−0.0142−0.0134−0.0126−0.0126−0.0126−0.0126
2.13−0.0142−0.0134−0.0126−0.0126−0.0126−0.0126
2.50−0.0148−0.01244−0.01244−0.01244−0.01244−0.01164
Table 6. Ratio of floor heave (FHR) at various in situ stresses and different distances from the floor of the tunnel (e.g., from reference point #4).
K, ValueFloor Heave Ratio (FHR), %
Distance from the Floor of the Tunnel (e.g., from Reference Point #4)
0.0 m0.5 m1.0 m1.5 m2.0 m2.5 m
0.5−0.0062−0.0062−0.007−0.007−0.007−0.007
1.0−0.0069−0.0069−0.0077−0.0077−0.0077−0.0077
1.5−0.007−0.0078−0.0078−0.0078−0.0086−0.0086
1.65−0.007−0.0078−0.0078−0.0086−0.0086−0.0086
1.80−0.0075−0.0075−0.00826−0.00826−0.009−0.009
2.0−0.0078−0.0078−0.0086−0.0086−0.0094−0.0094
2.13−0.0078−0.0078−0.0086−0.0086−0.0094−0.0094
2.50−0.0069−0.0077−0.00848−0.00928−0.01006−0.01006
Publisher’s Note: MDPI stays neutral with regard to jurisdictional claims in published maps and institutional affiliations.

