1. Introduction
A railway track is composed of a straight track and a curved track of various curvature radii. When a railway vehicle runs at high speed on a straight track, running stability according to high speed is required. On the other hand, when railway vehicles run on a curved track, the force applied by the wheels to the rail is increased because of centrifugal force, which restricts the speed at which the vehicles pass through curves and occasionally causes problems such as severe wear and noise of the wheel and rail [
1,
2]. The speed limitation on the curved section adversely affects the commercial operation of the railway, and severe wear of the wheels and rails results in early replacement of the wheels and rails, which increases the cost of vehicle maintenance. In addition, dust and noise caused by wear deteriorate the air quality of the railway section, adversely affecting the comfort of railway users.
Hence, active railway vehicle technology has been developed to resolve the above-mentioned problems. As a means to solve the speed limitation on the curved section, a tilting train has been developed to increase the speed of the curve by tilting the car body of the vehicle inward of the curve to reduce centrifugal force [
3]. In addition, research on active steering technology has been conducted to reduce the wear and noise of wheels and rails running on curved sections [
4,
5,
6]. At this time, the core technology needed is curve detection technology to detect the curved track. Tilting technology or active steering technology to improve curve running performance should be activated only in the curved section, so it is necessary to accurately detect curves and detect curve information such as curve radius and curvature. In this regard, the following curve detection technology has been developed.
As the oldest method, a curve detection method was used, in which the position and curvature of the curve were input in advance to the lookup table and used in the form of a lookup table [
7]. To apply this method for vehicle control, it is only possible to use it by accurately detecting the beginning and end of the curve and the position of the curve. If the operating track is changed, curve information for a changed track must be input into the lookup table again and utilized, and if the position is detected incorrectly while the vehicle is running, it may adversely affect vehicle safety and control. There is an internal measurement system using gyro sensors, acceleration sensors and speed sensors, which enables real-time measurement while a vehicle is running. This method has a disadvantage in that an offset error occurs due to the integration process in the curve extraction algorithm and is affected by the vehicle’s running speed [
8,
9,
10]. In addition, the above methods are inefficient because test processes are required to correct errors in curve detection through many test runs in advance. Another method to detect curves is the code measurement system. This method is mainly applied to track inspection cars that measure the state of the track for track maintenance. The principle of measuring three points of a curve at regular intervals to extract curvature from a geometric relationship is used. It is applied only to track inspection cars for track maintenance by measuring three points of a curve in a non-contact type, while running using an expensive optical sensor [
11]. In addition, many studies have been conducted on the suitability of vehicle dynamics and railway transition curves from the perspective of railway infrastructure design [
12,
13].
Since the existing curvature detection method as described above has disadvantages and inefficiencies, a new curve detection technology for efficiently controlling a vehicle in a curve section in real time is required. From this background, the author proposed a new curve detection method to extract curvature using the geometric relationship between the vehicle and the track in the curved section [
14]. This method is a practical curve detection method to estimate curvature based on the kinematic motion of the railway vehicle’s body and bogie when the vehicle is running in the curve section.
Therefore, in this paper, based on this method, a track curvature sensor for detecting the railway curve section was developed. In order to evaluate the curvature extraction performance of the track curvature sensor when running on the railway track, a curvature sensor prototype was installed on the test train, and a test run was conducted on the test track. In this paper, we describe the test results.
2. Development of the Track Curvature Sensor
2.1. Curvature Measurement Method
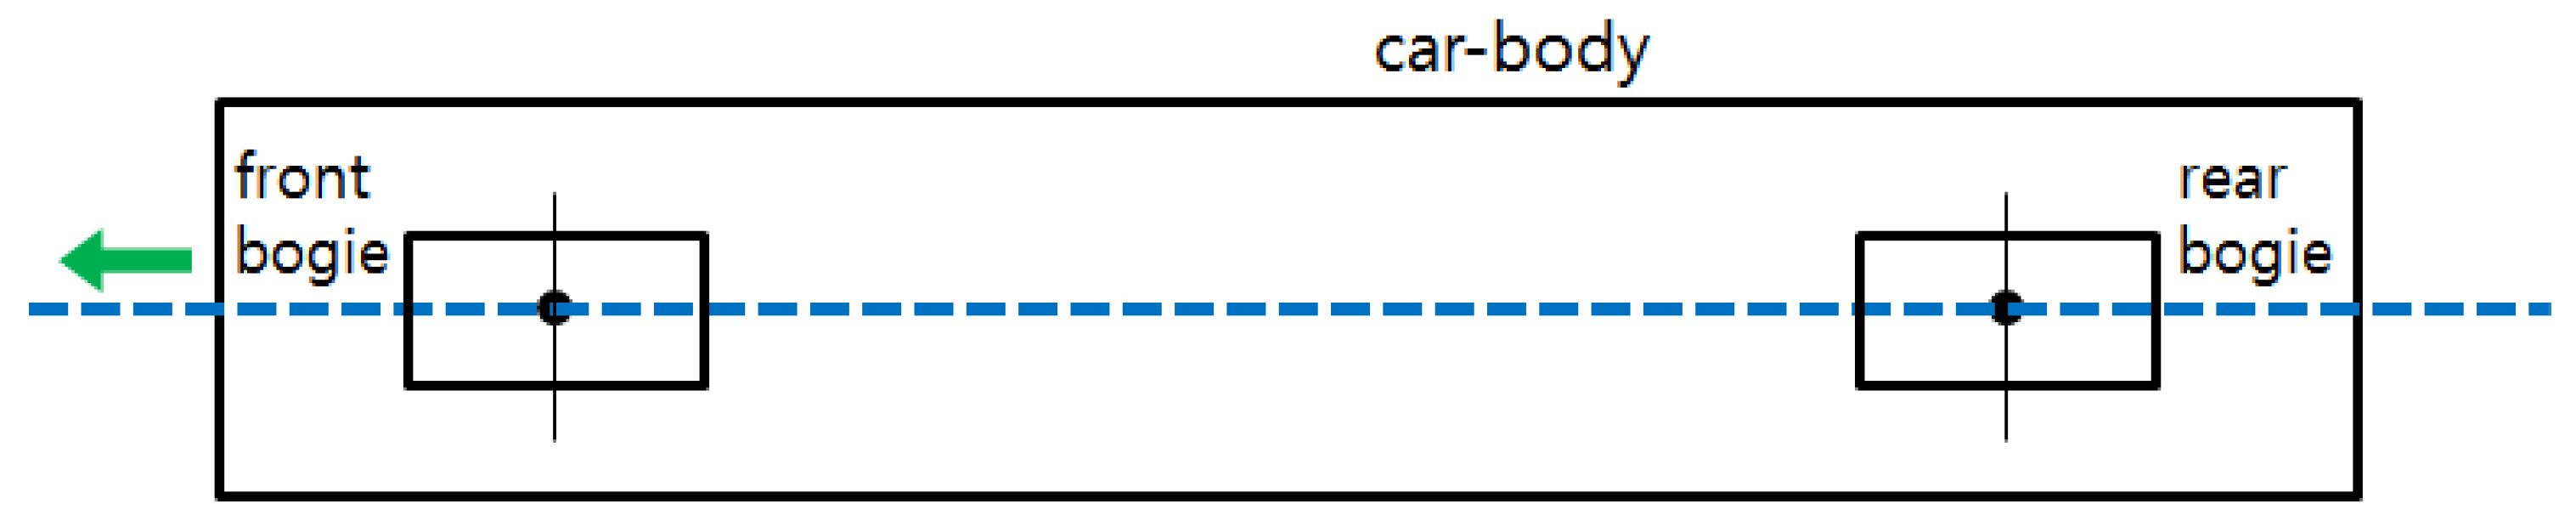
The algorithm for measuring the curvature for the curved section is derived from the geometric relationship located on the curve of the vehicle car body and the bogie when running in the curved section of the railway vehicle. In the case of running on a straight track, as shown in
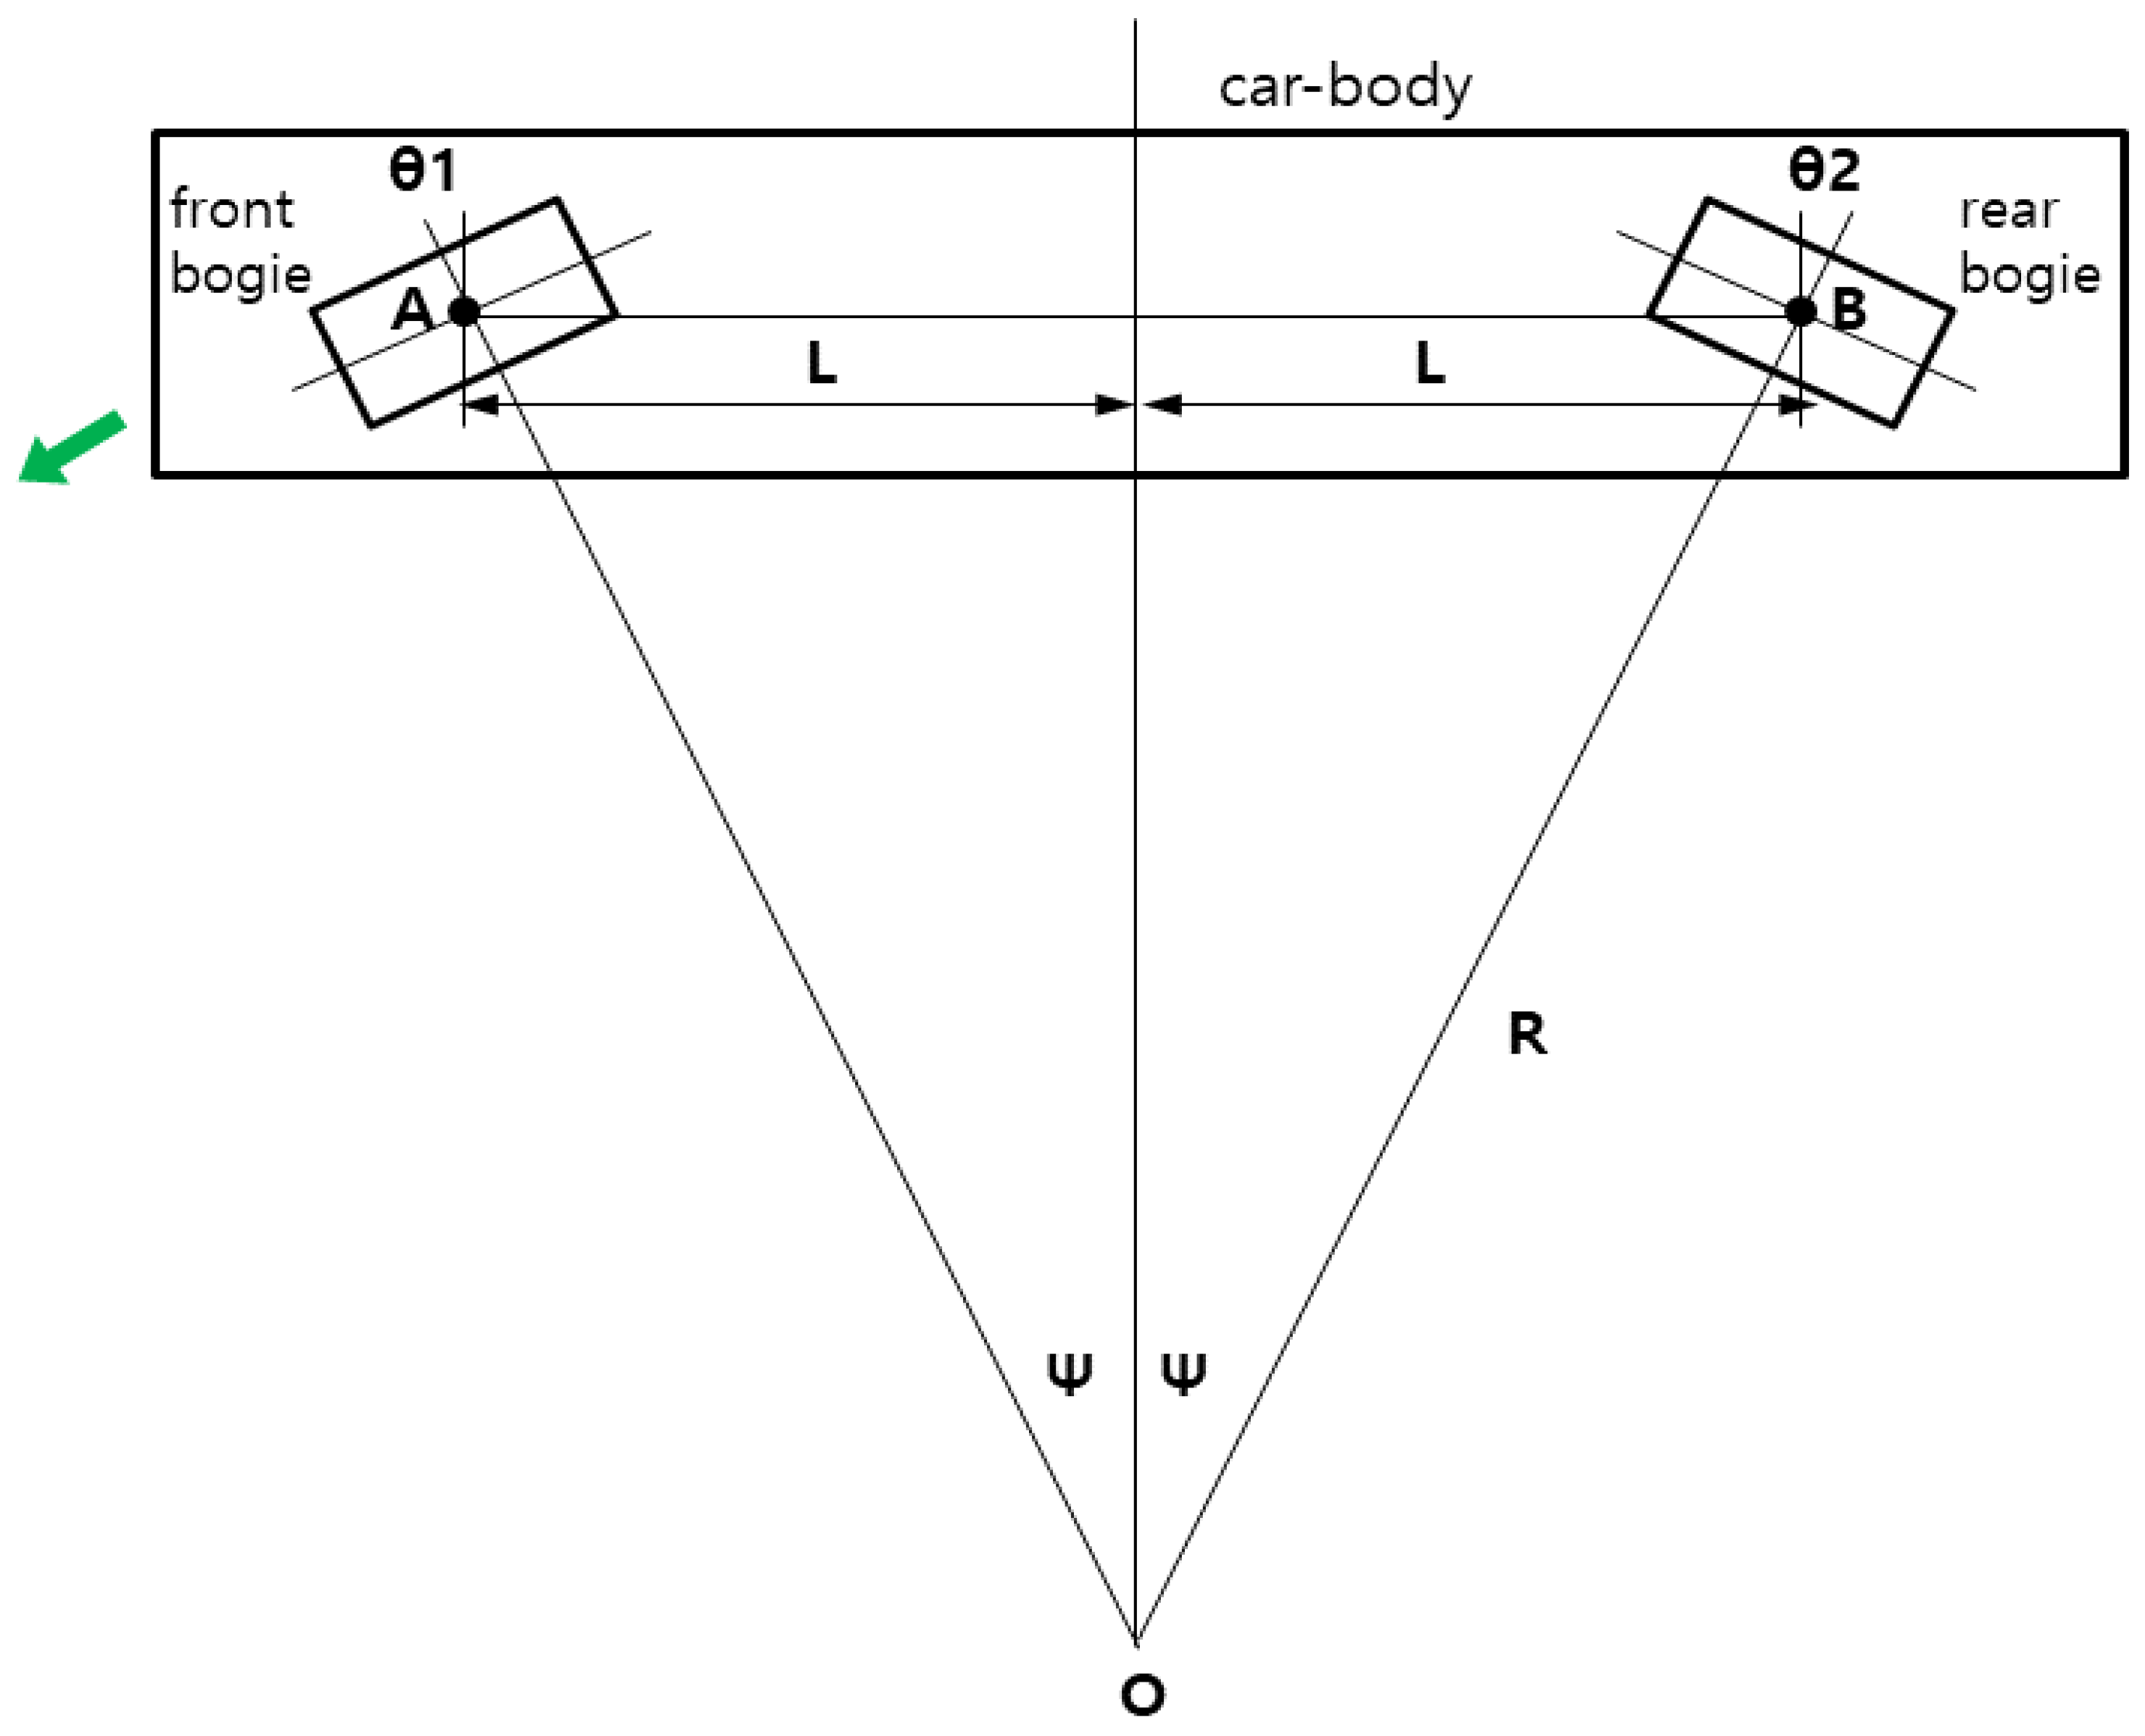
Figure 1, the bogies are arranged in line with the vehicle car body, and the bogie angle, which is the rotating angle of the bogie with respect to the vehicle car body, does not occur. However, when running on a curved track, as shown in
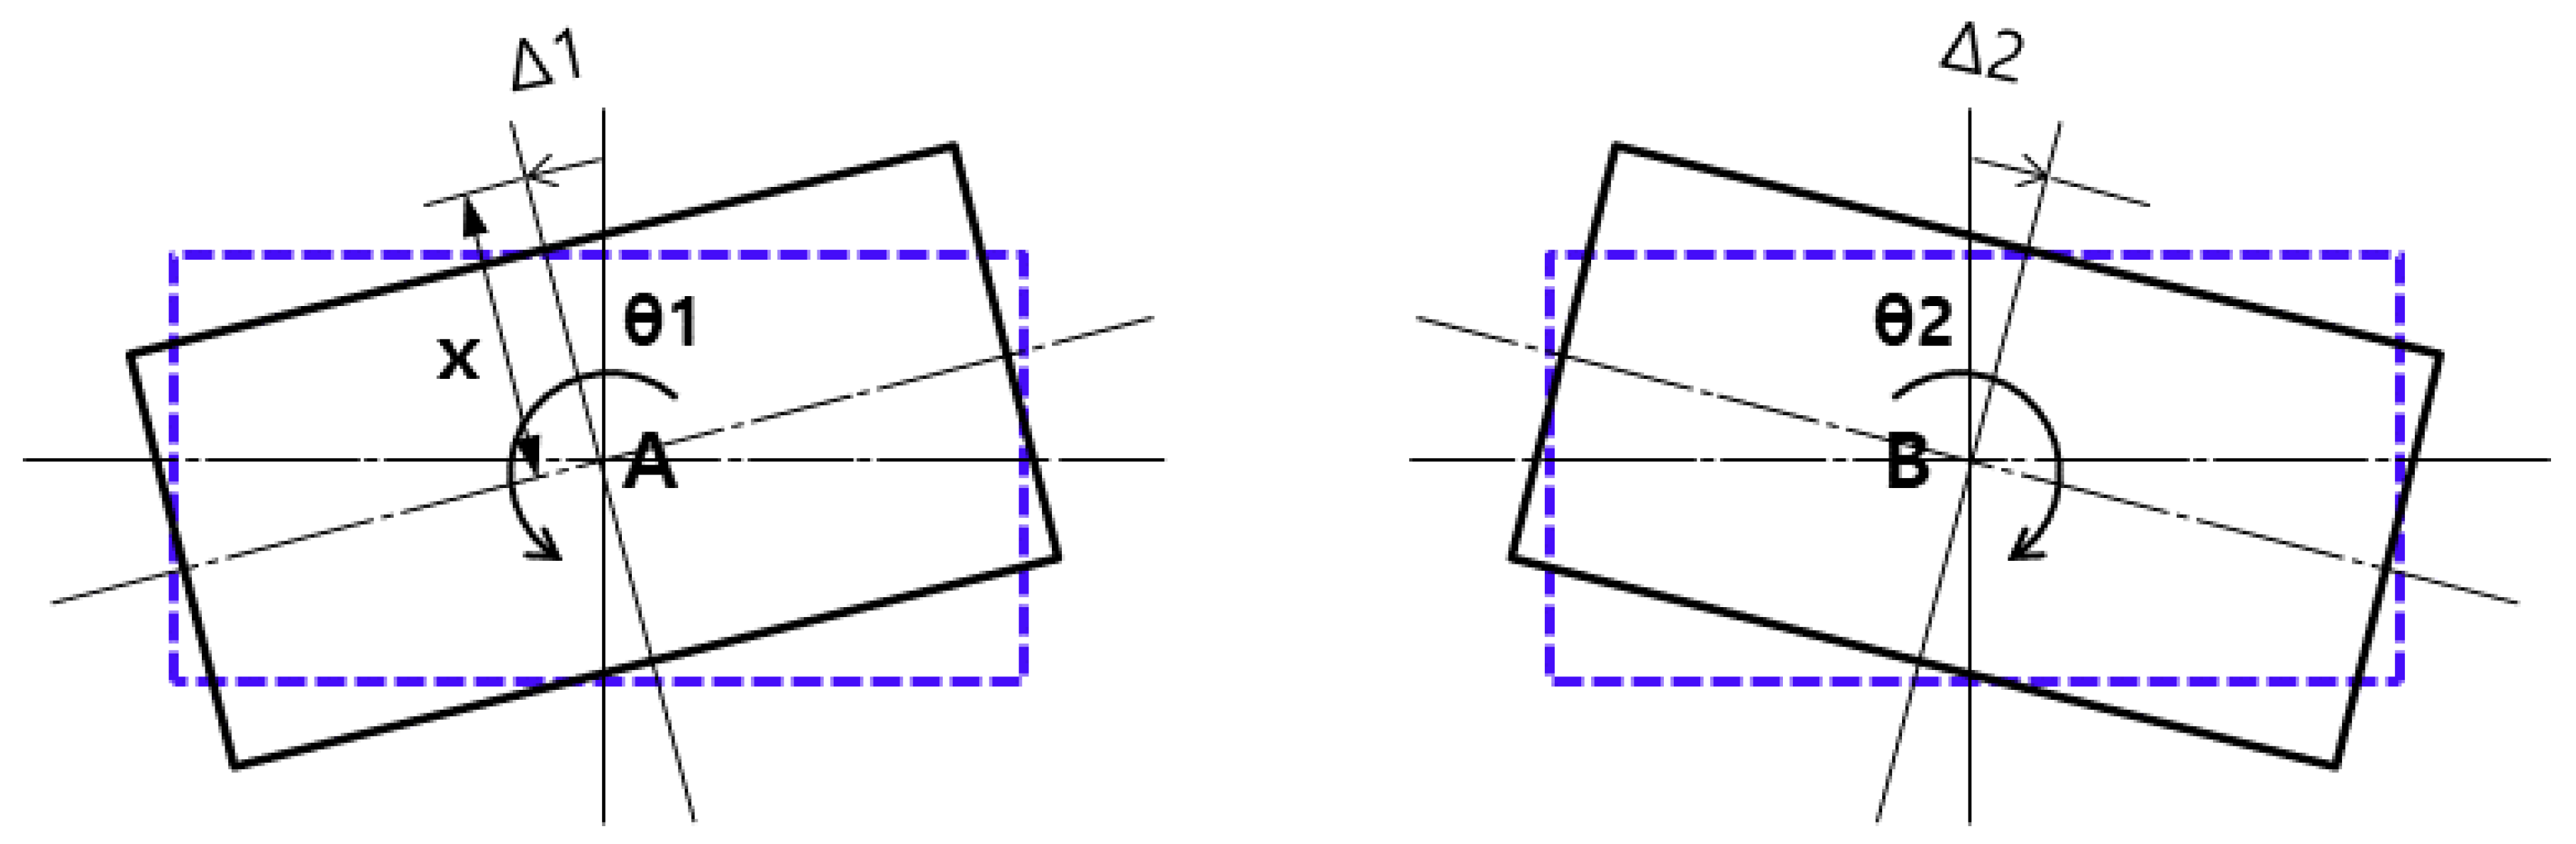
Figure 2, the bogie located on the curved line rotates according to the curvature of the curve and a bogie angle (
θ1 and
θ2) is generated between the vehicle car body and the bogie, and relative displacement (Δ
1 and Δ
2) occurs between the vehicle car body and the bogie in the running direction, as shown in
Figure 3.
From the geometric relationship formed between the car body and the front bogie and the rear bogie on the curved track above, the following approximate relationship can be established to derive the radius of the curve (
R).
Therefore, the curvature
C, which is the reciprocal of the curve radius, is expressed as follows:
where one-half of the distance between the center of the front bogie and the rear bogie (
L), and lateral spacing between the curvature sensor and the bogie center (
x) are a constant value. Therefore, the curvature of the curve can be estimated by measuring the relative displacement (∆
1) between the car body and the front bogie, and the relative displacement (Δ
2) between the car body and the rear bogie in real time.
2.2. Curvature Measurement Simulation
In order to confirm the validity of the curvature measurement method described in the previous section, a multi-body dynamic analysis simulating running on a real track was performed. For the multi-body dynamic analysis of railway vehicles, VAMPIRE (Vehicle dynAmics Modelling Package In a Railway Environment), a program for analyzing the dynamics of railway vehicles, was used.
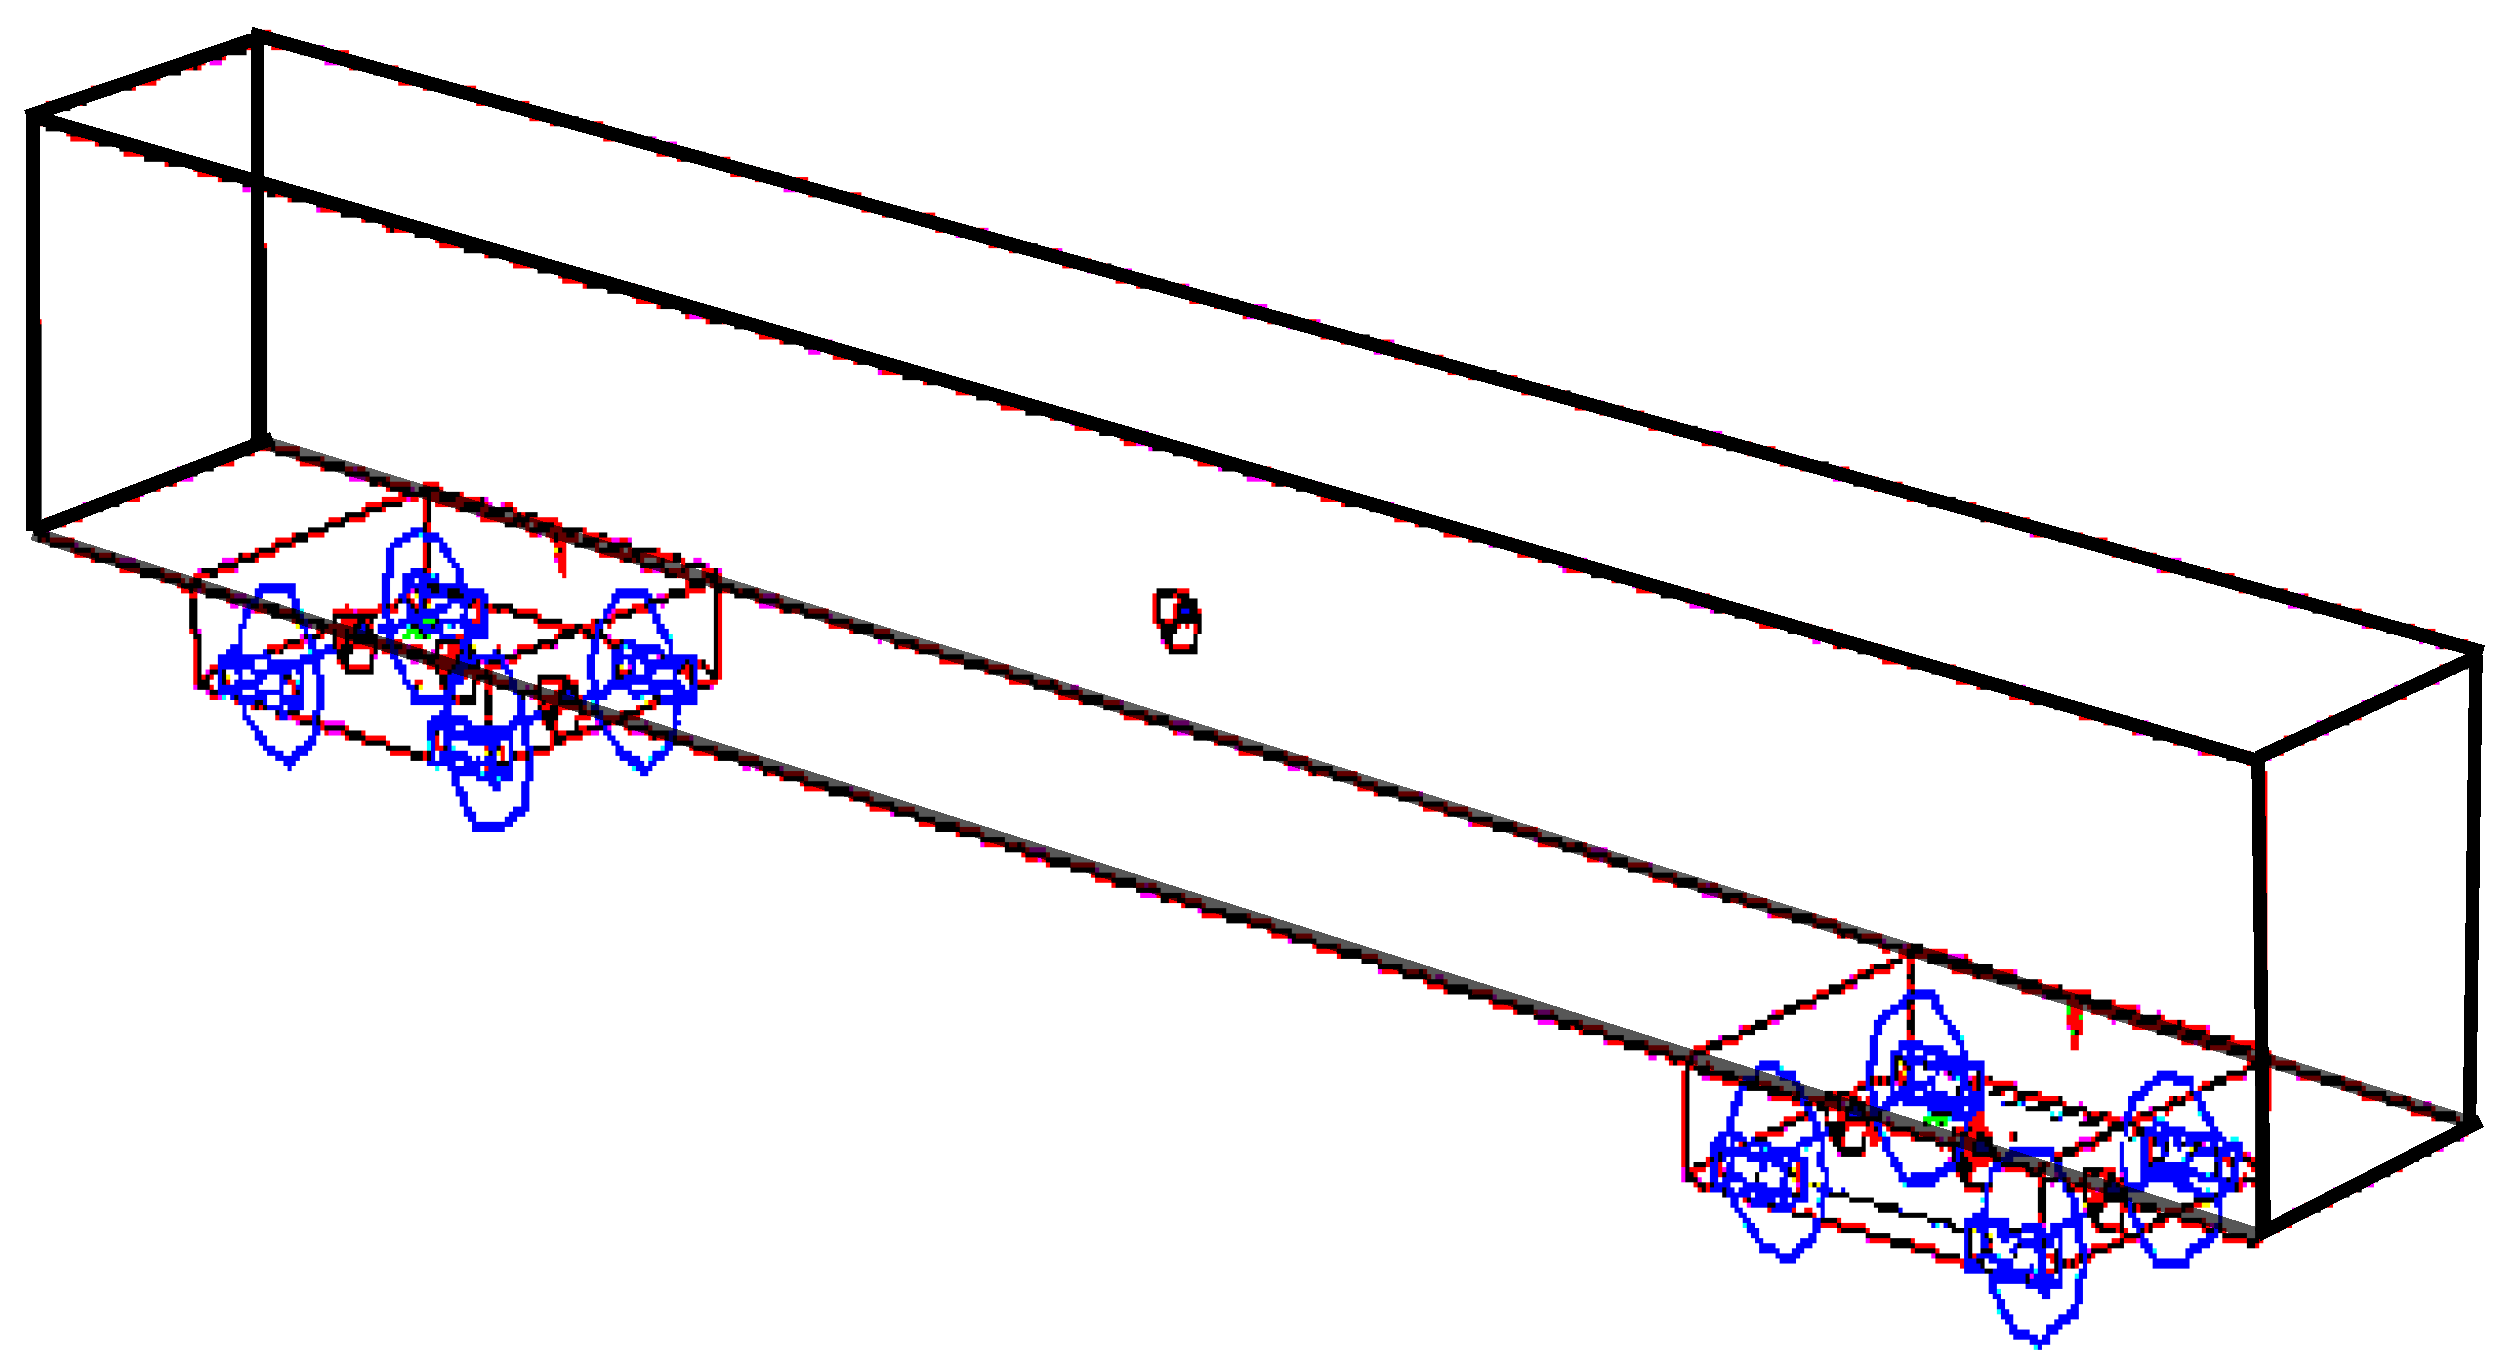
The vehicle model is as shown in
Figure 4. An electric railway vehicle with a high frequency of operation of the curved section was modeled. The vehicle model consists of a body, a front and bogies, and wheelsets and a suspension system.
One-half of the distance between the center of the front bogie and the rear bogie (
L) is 6.9 m, and lateral spacing between the curvature sensor and the bogie center (
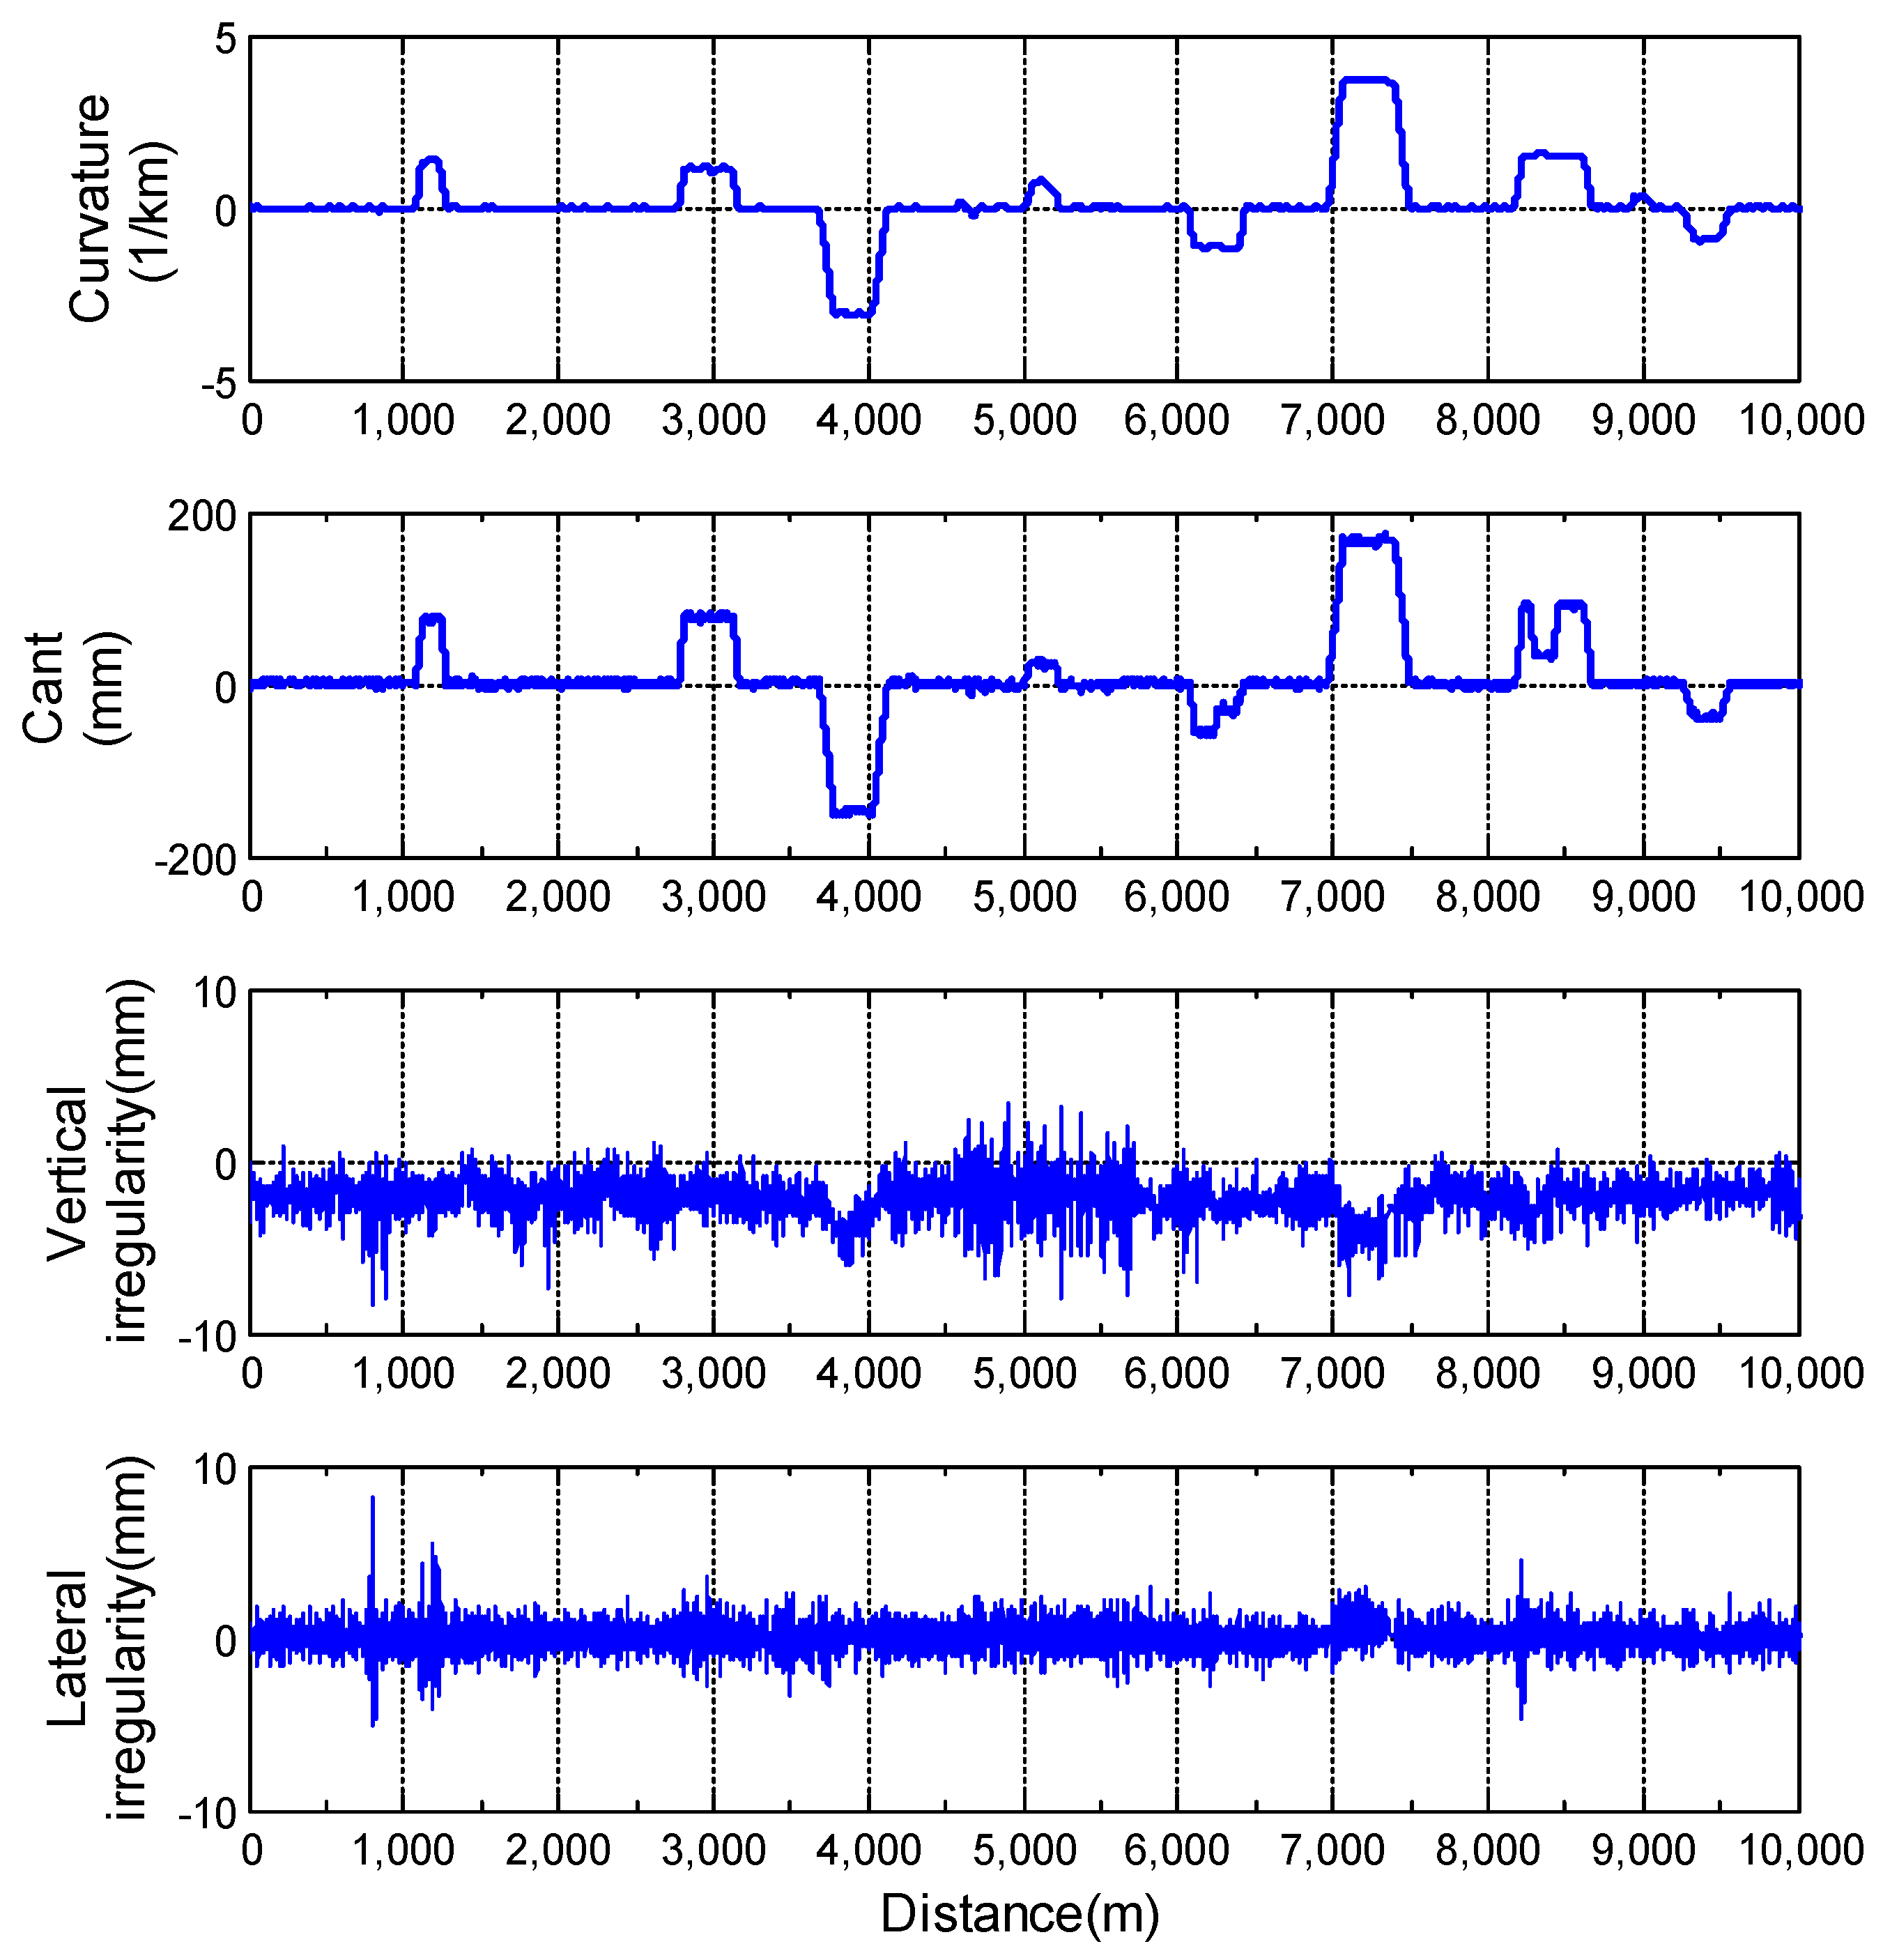
x) is 1050 mm. The track model for the vehicle running simulation was modeled as a 10 km section, which is a part of the operation section of a train.
Figure 5 shows the curvature, cant, and the vertical and lateral irregularity of the track model. During analysis, the running speed of the vehicle model was set at the commercial operating speed condition (Case-1) passing through the track model section. In addition, in order to analyze the effect of driving speed on curvature measurement, the simulation was conducted by including the condition that decreased to 50% of the operating speed (Case-1) and the condition that increased by 50% of the operating speed (Case-3).
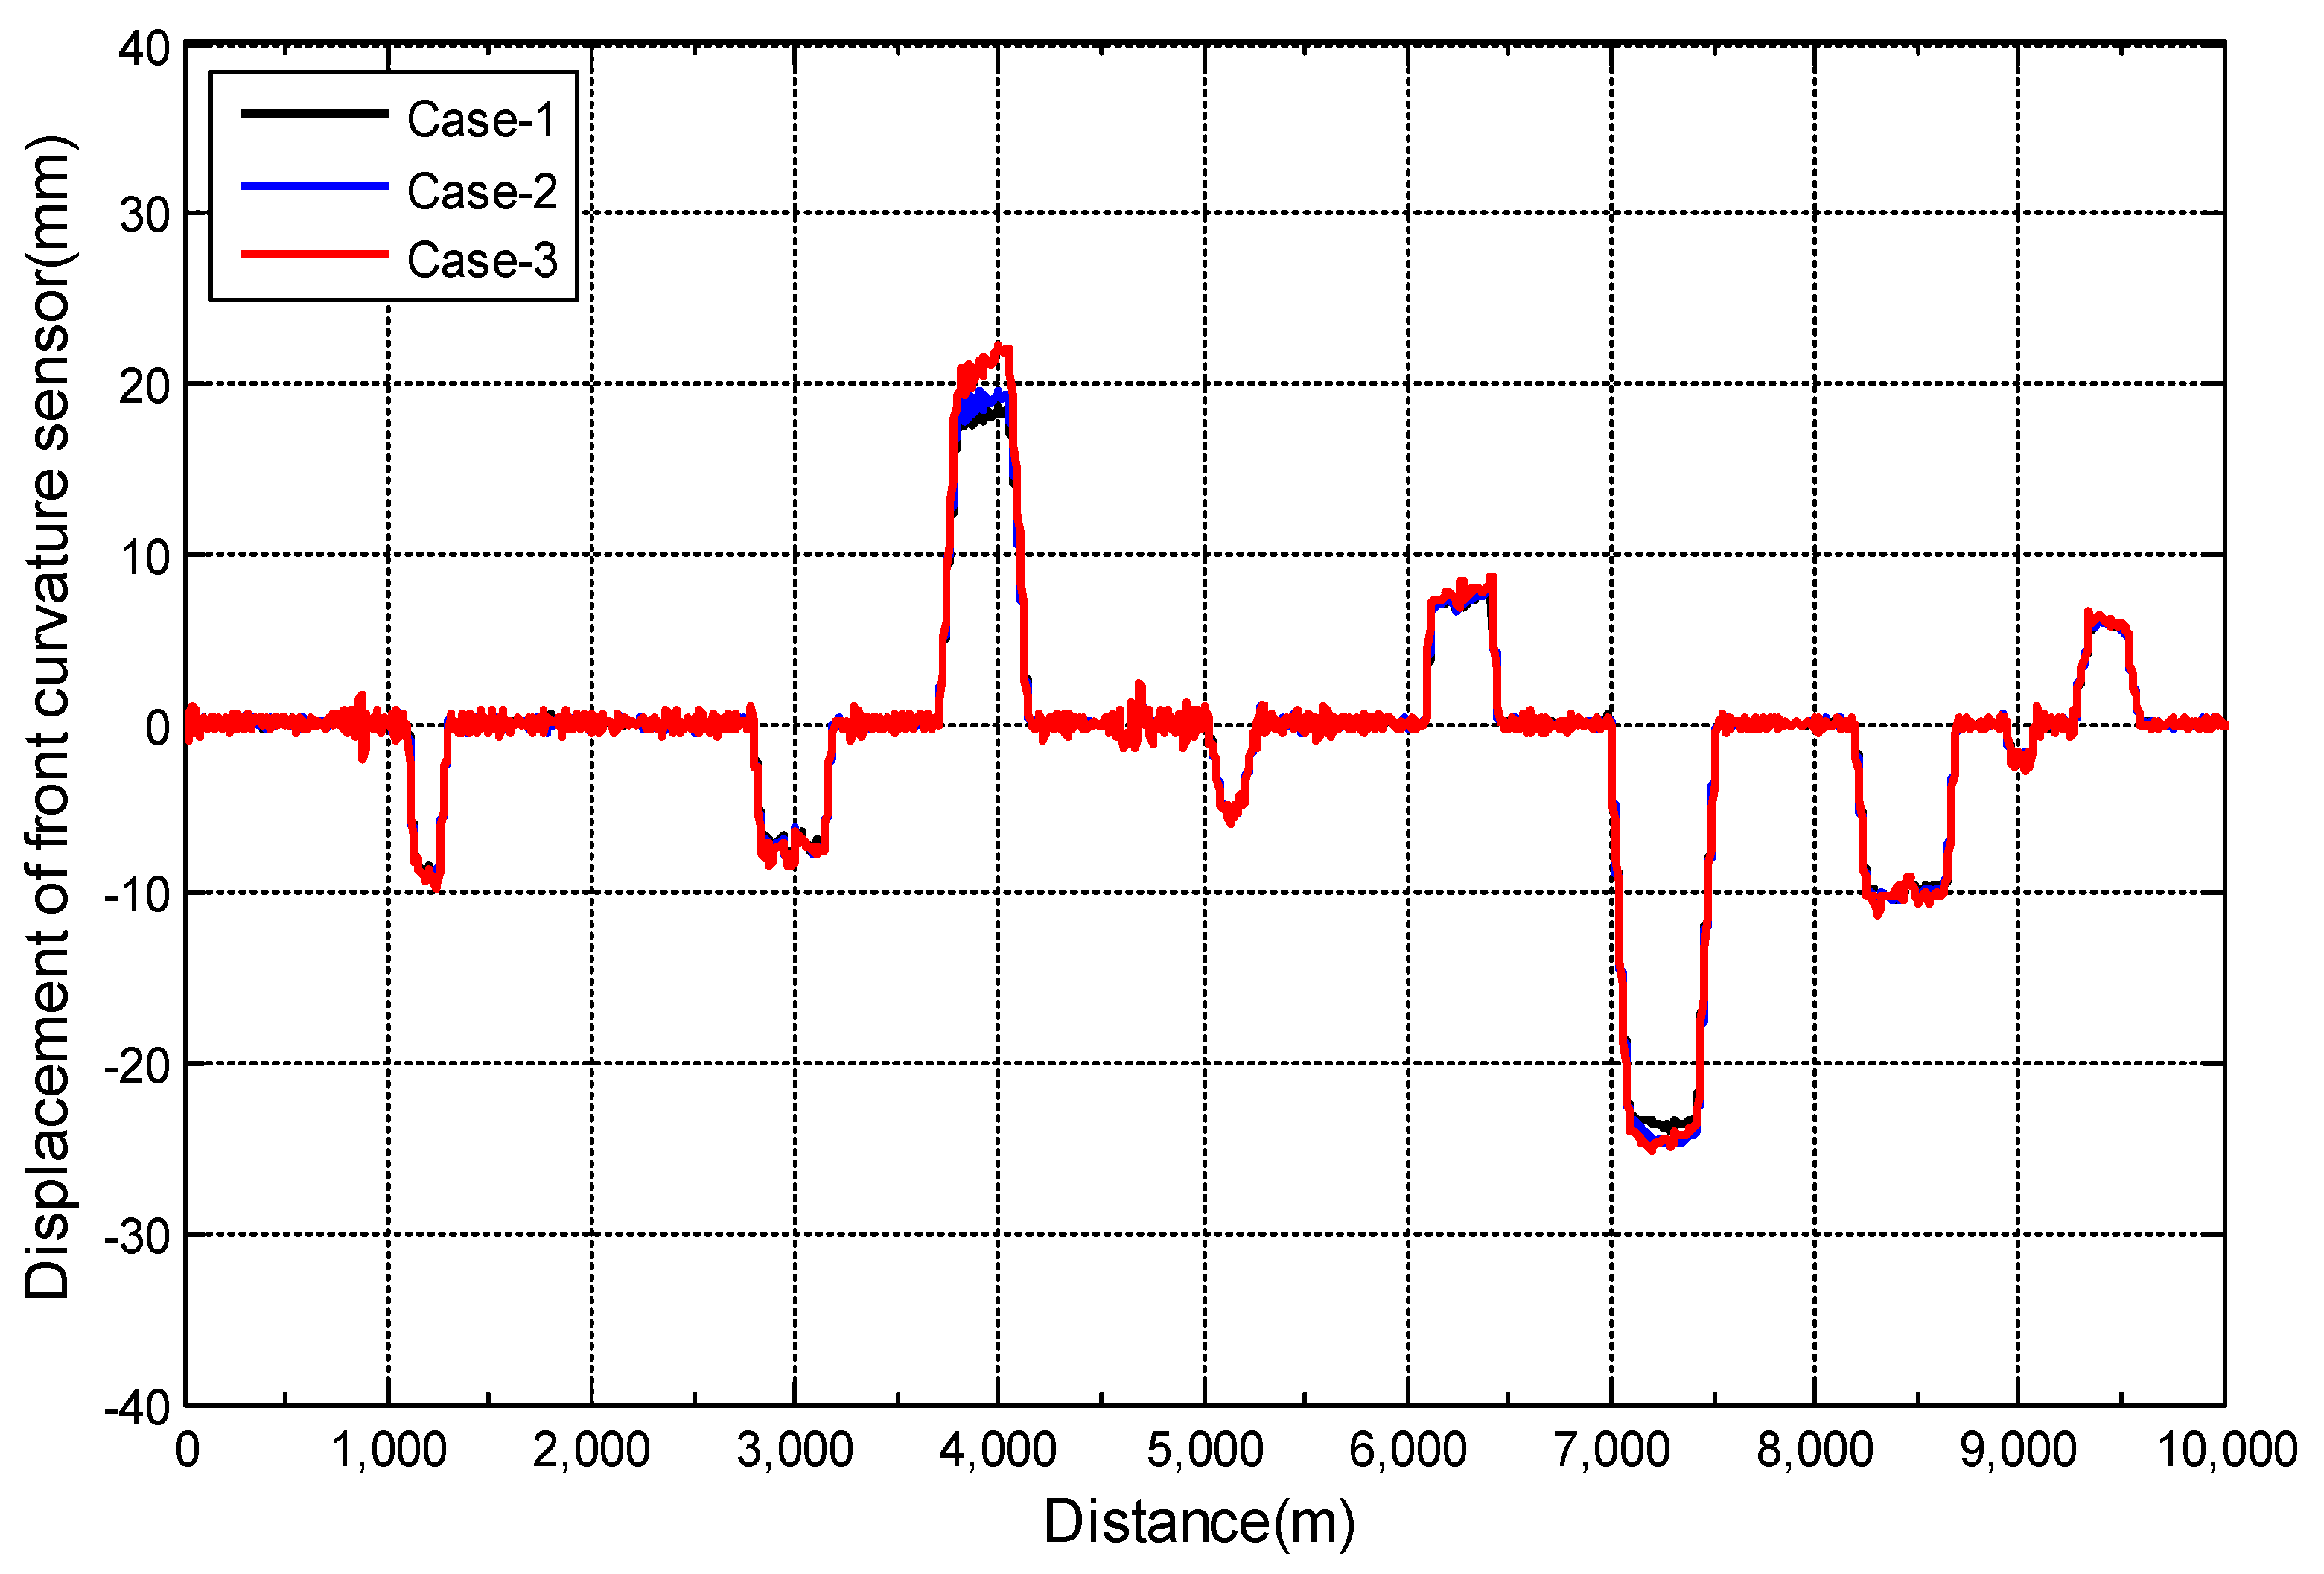
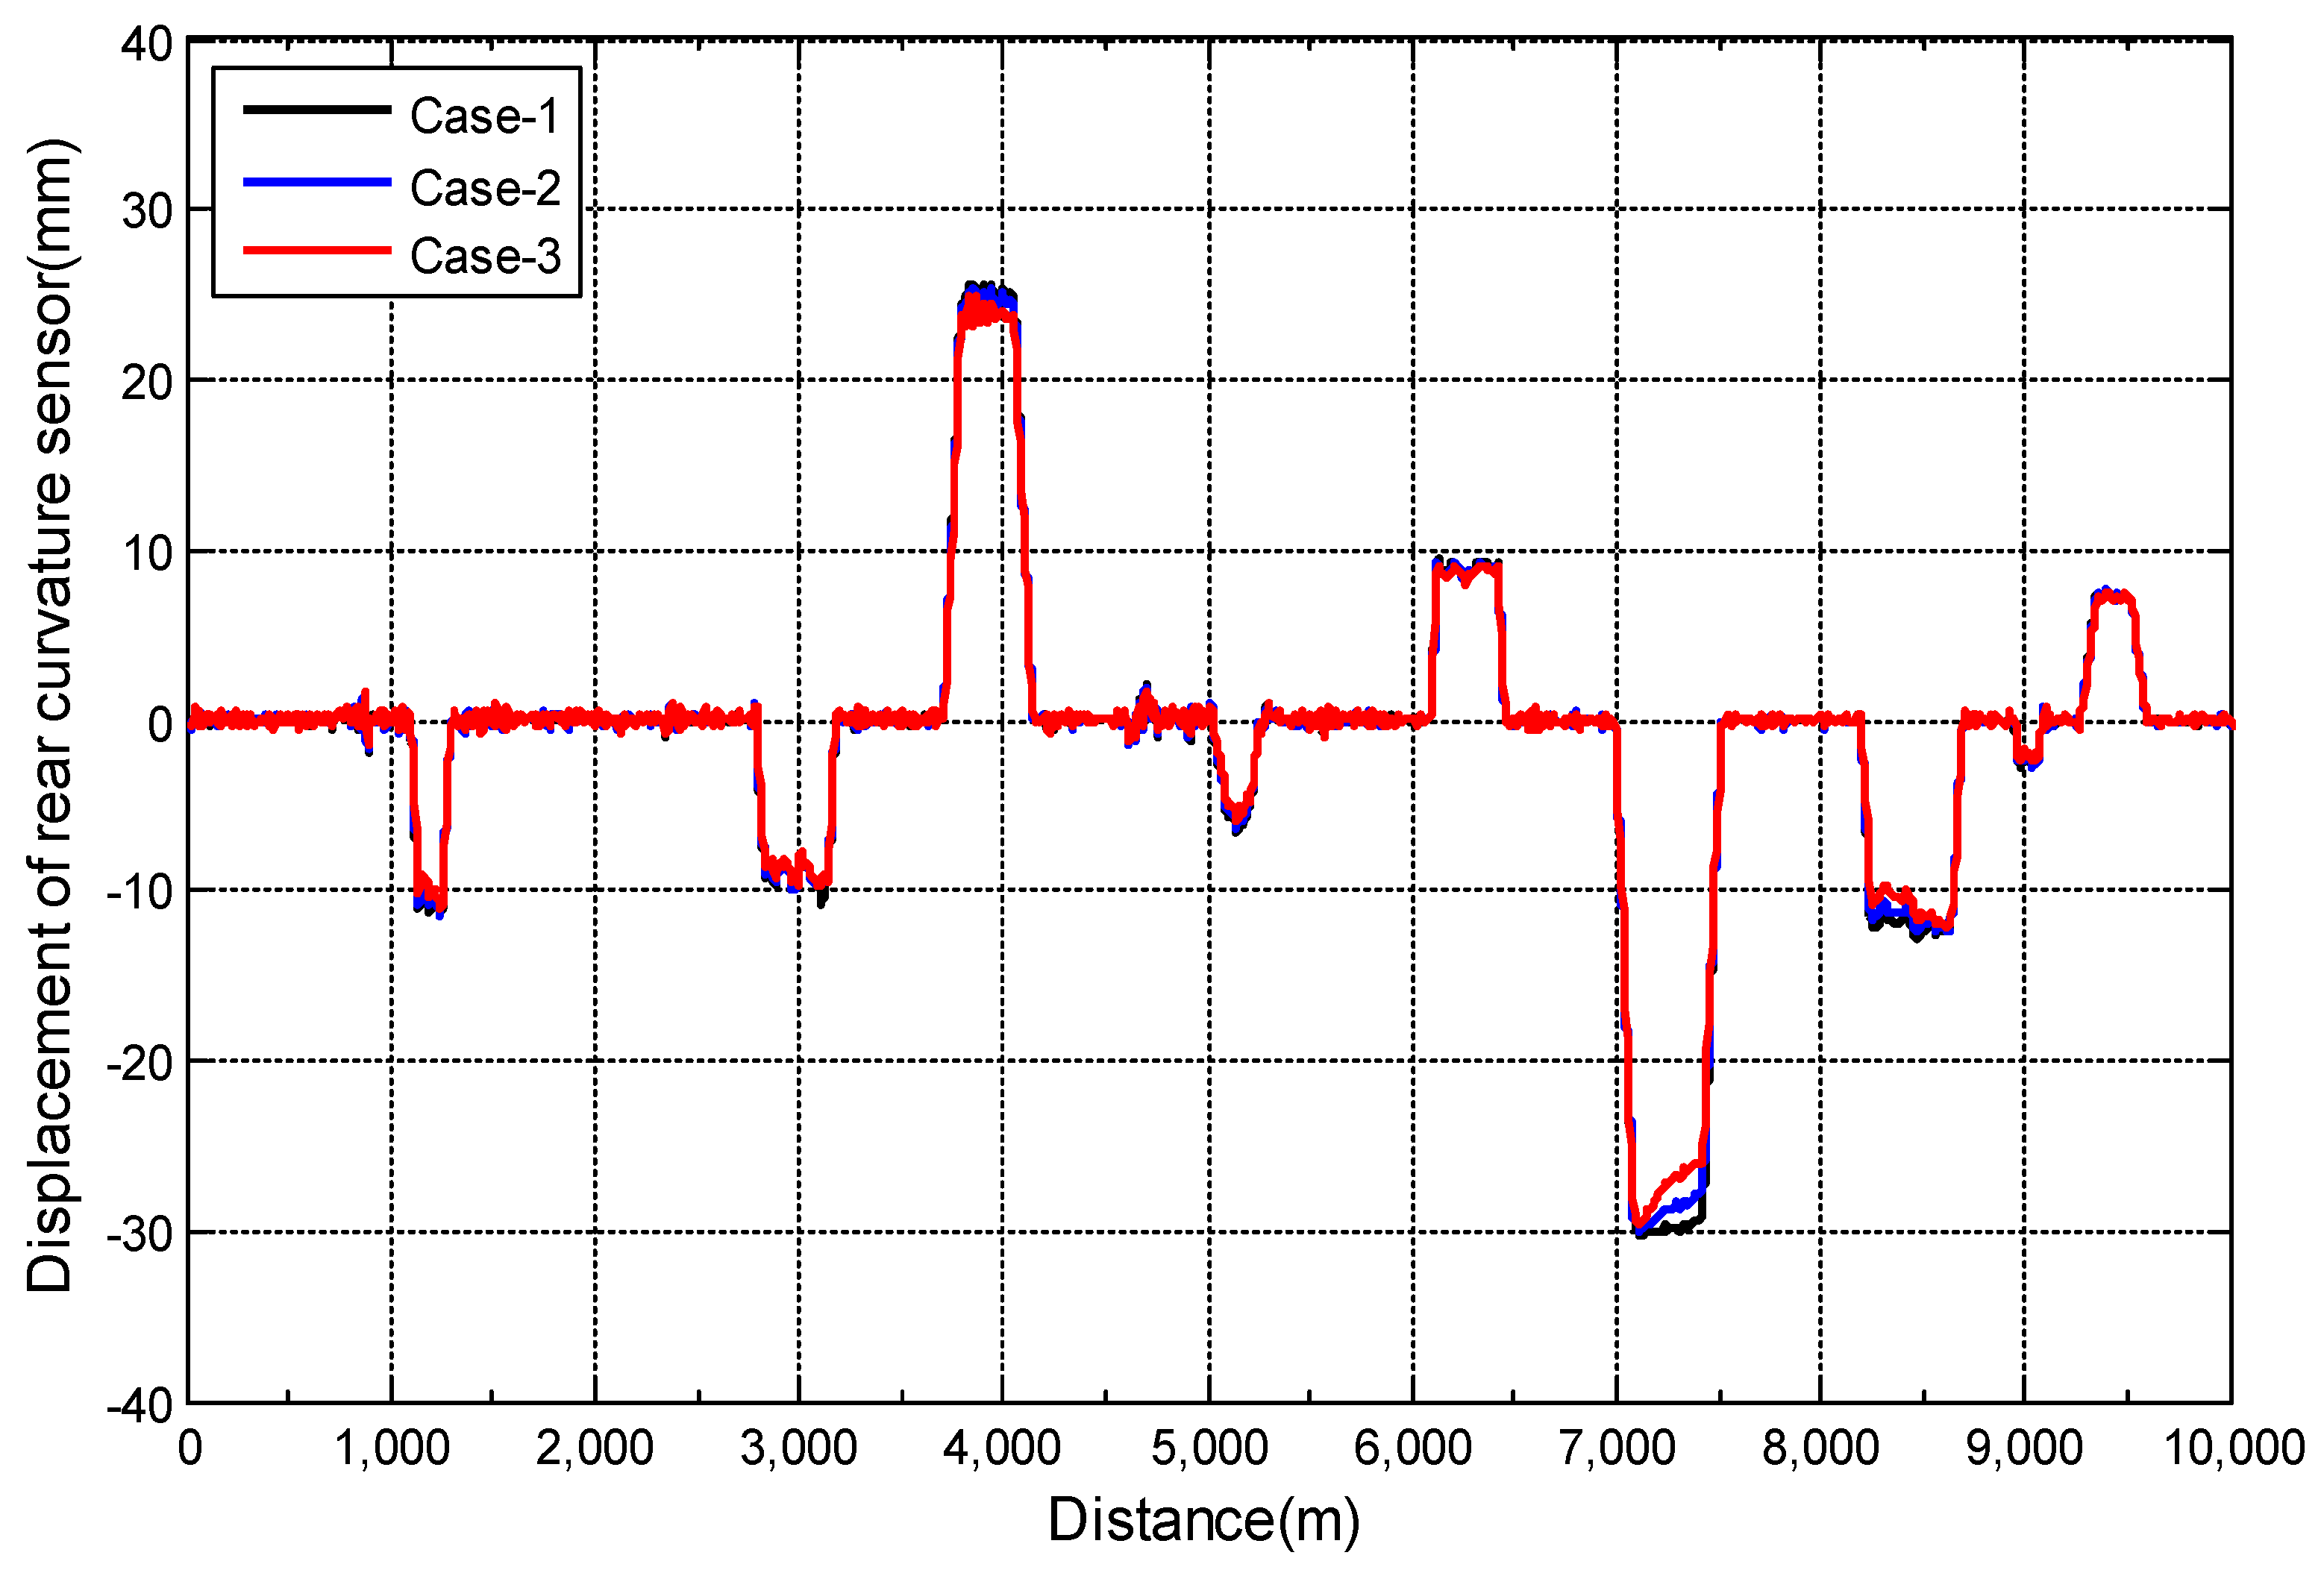
Figure 6 and
Figure 7 show the results of the displacements of the curvature sensor of the front and rear bogie obtained through dynamic simulation. When running on a straight section, the displacement of the curvature sensor hardly appears, but when passing through the curved section, the bogie rotates with respect to the vehicle car body to adapt to the curve and the displacement of the curvature sensor is significantly detected. In general, when running on a curved track, the rotational resistance of the front bogie in the running direction is relatively increased compared to the rear bogie, and thus the bogie angle of the front bogie is relatively smaller than that of the rear bogie. Therefore, it is confirmed that the displacement of the front bogie’s curvature sensor, which is the relative displacement between the vehicle car body and the front bogie, is relatively small compared to the displacement of the rear bogie’s curvature sensor. When analyzing the displacement of the curvature sensor according to the running speed, it can be seen that the analysis result of Case-1, which is the operating speed condition, or the analysis result of Case-2 and Case-3, which change the speed, show almost similar results.
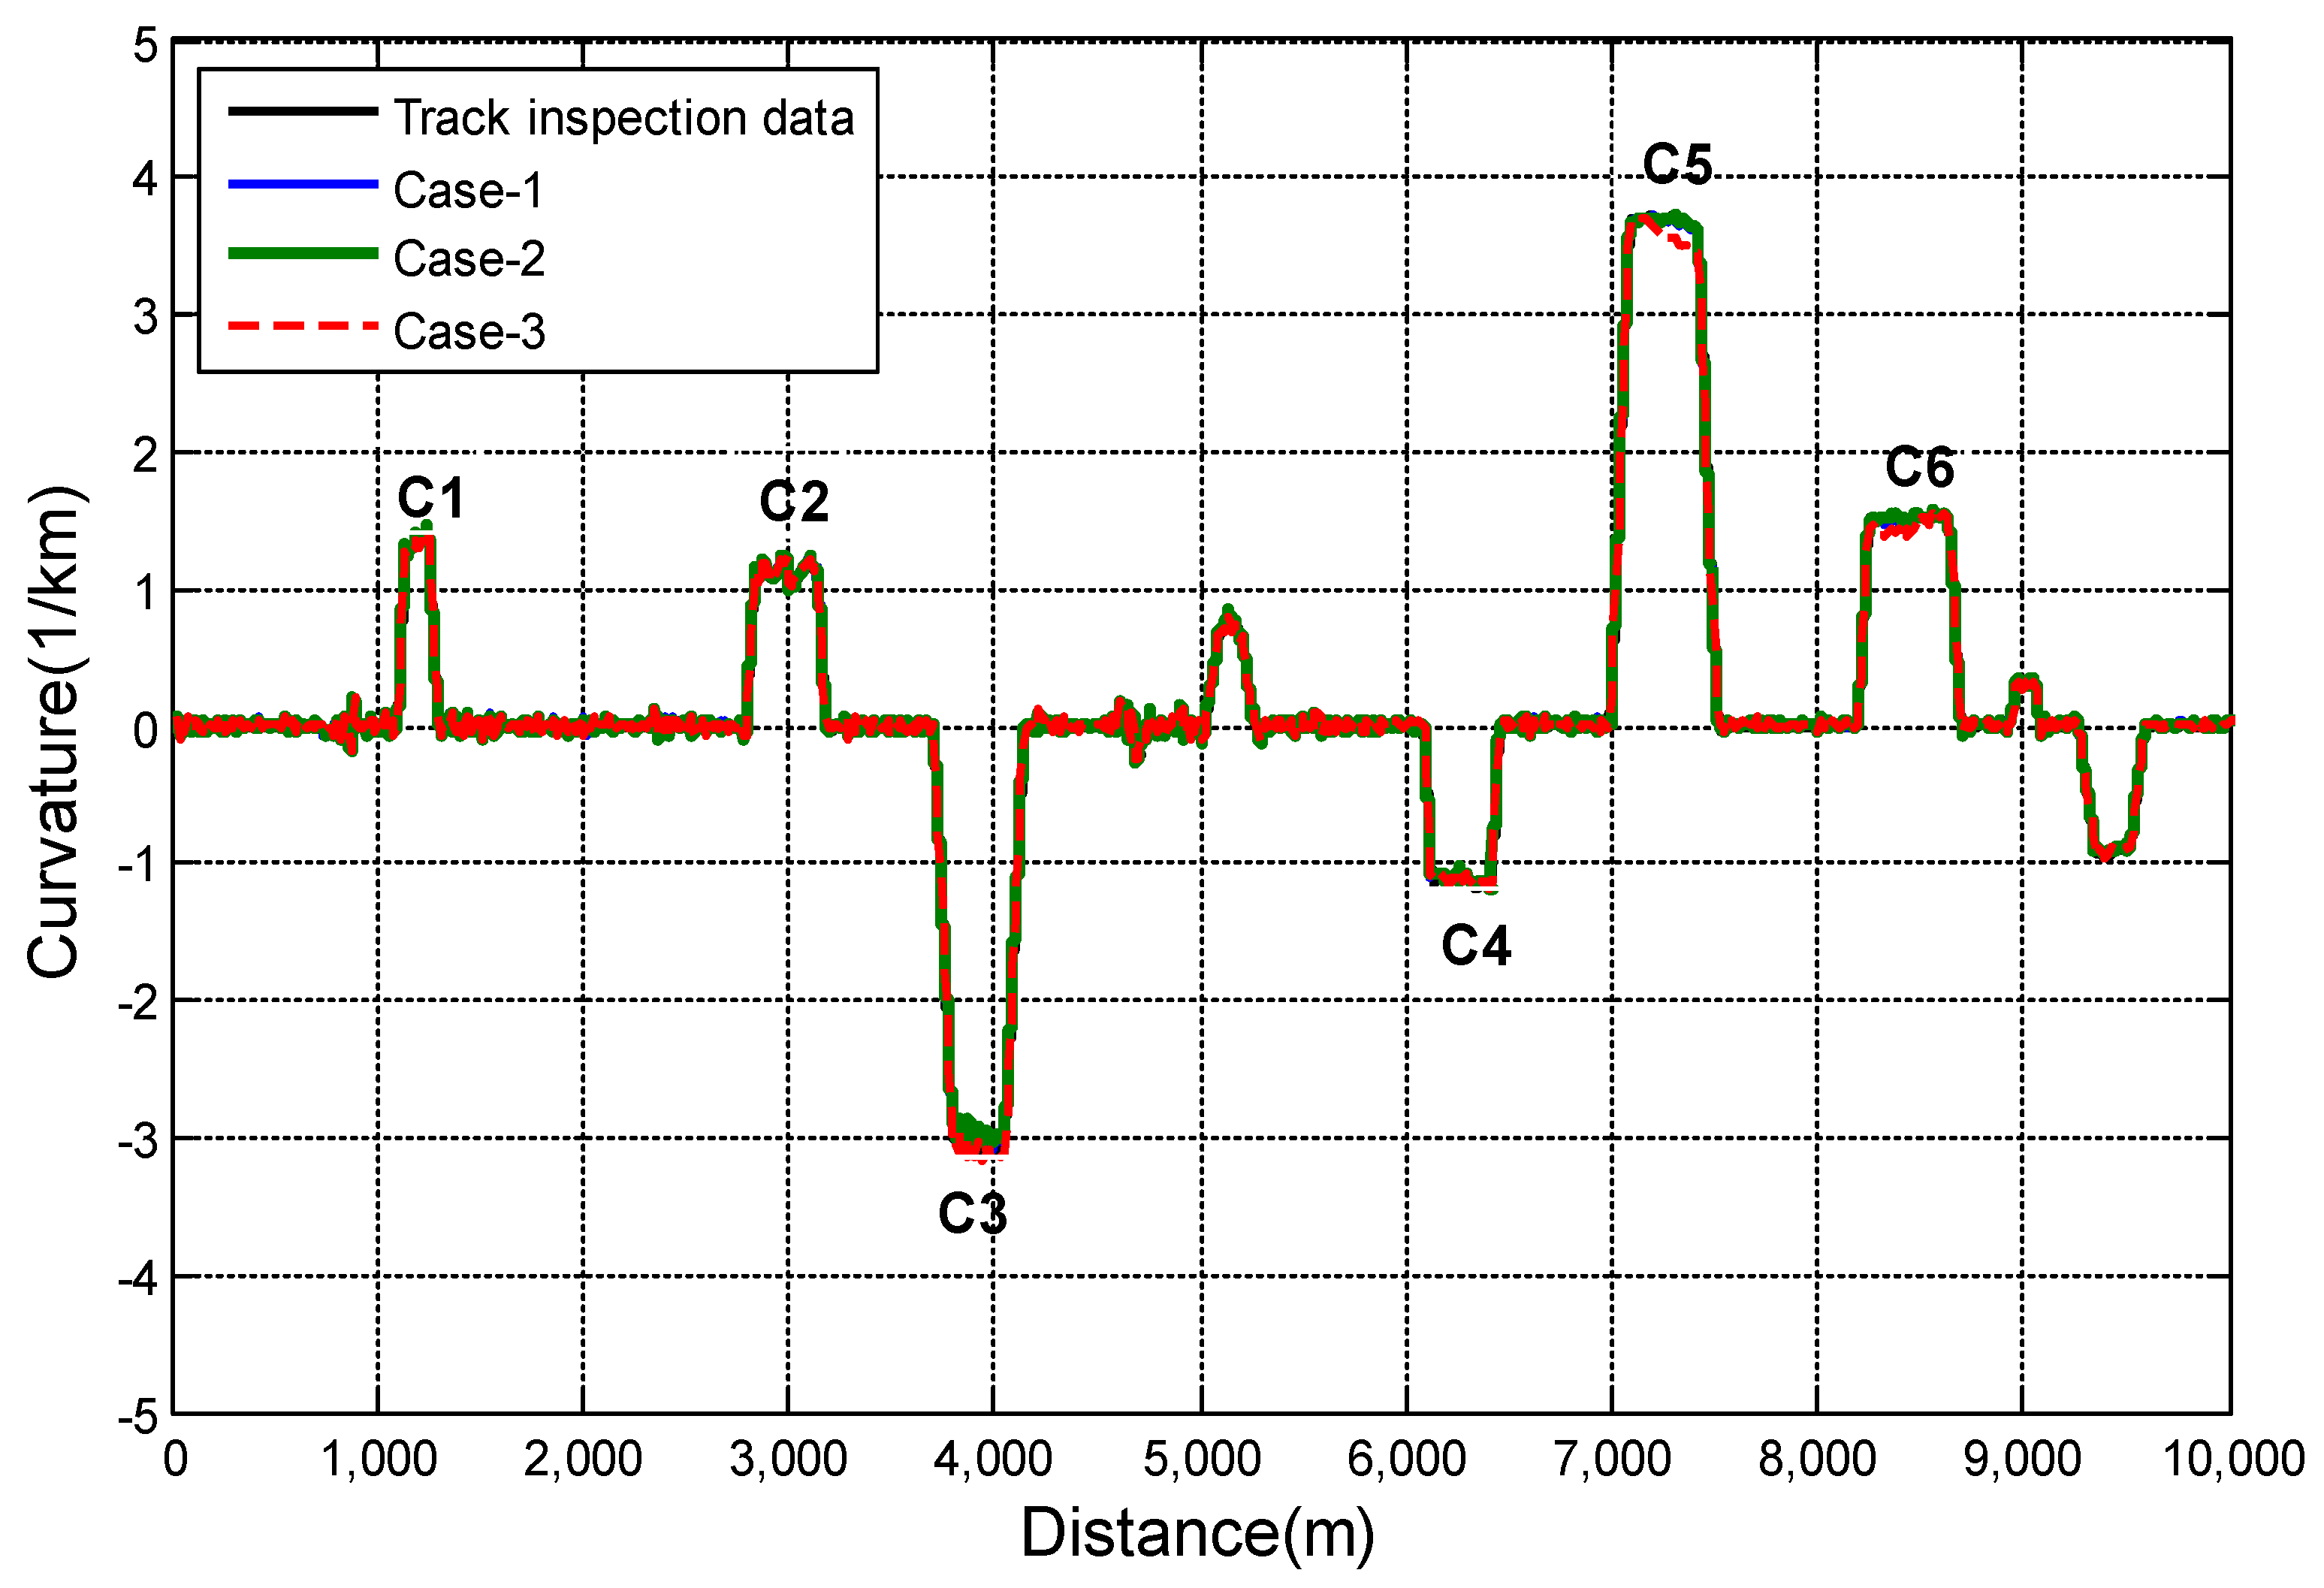
The curvature result obtained by substituting this curvature sensor displacement into the curvature calculation equation is shown in
Figure 8. In order to verify the validity of the curvature analysis result, the analysis result was compared with the curvature data measured by the track inspection vehicle that measures the curvature and irregularity state of the track for maintenance. The curvature measured by the track inspection vehicle and the curvature obtained through the dynamic simulation in the entire analysis section match very well. Among them, the results of a more detailed analysis for six curved sections with a curve radius of 1000 m or less are shown in
Table 1 and
Figure 9.
Table 1 is the result of analyzing the mean curvature for the section corresponding to the circular curve among the curve sections and the absolute value of the deviation compared to the track inspection data. The deviation of the curvature simulation result of the commercial operating speed condition (Case-1) is only at minimum 0.5%, at maximum 2.4% and on average 1.7%, so the performance of the proposed curvature measurement method is expected to be good. In addition, to analyze the effect of speed, the analysis results of speed with a 50% reduction (Case-2) and speed with a 50% increase (Case-3) show that the average deviation is 1.8% and 1.9%, respectively, which tends to increase very slightly compared to the average deviation of 1.7% of the normal operating speed (Case-1).
Therefore, it is expected that the curvature measurement method derived in consideration of the kinetic motion relationship between the vehicle car body and the bogie running in the curved section will hardly be affected by the running speed.
2.3. Curvature Sensor Prototype
A curvature sensor was designed based on the curvature measurement method discussed in the previous section and a prototype was manufactured.
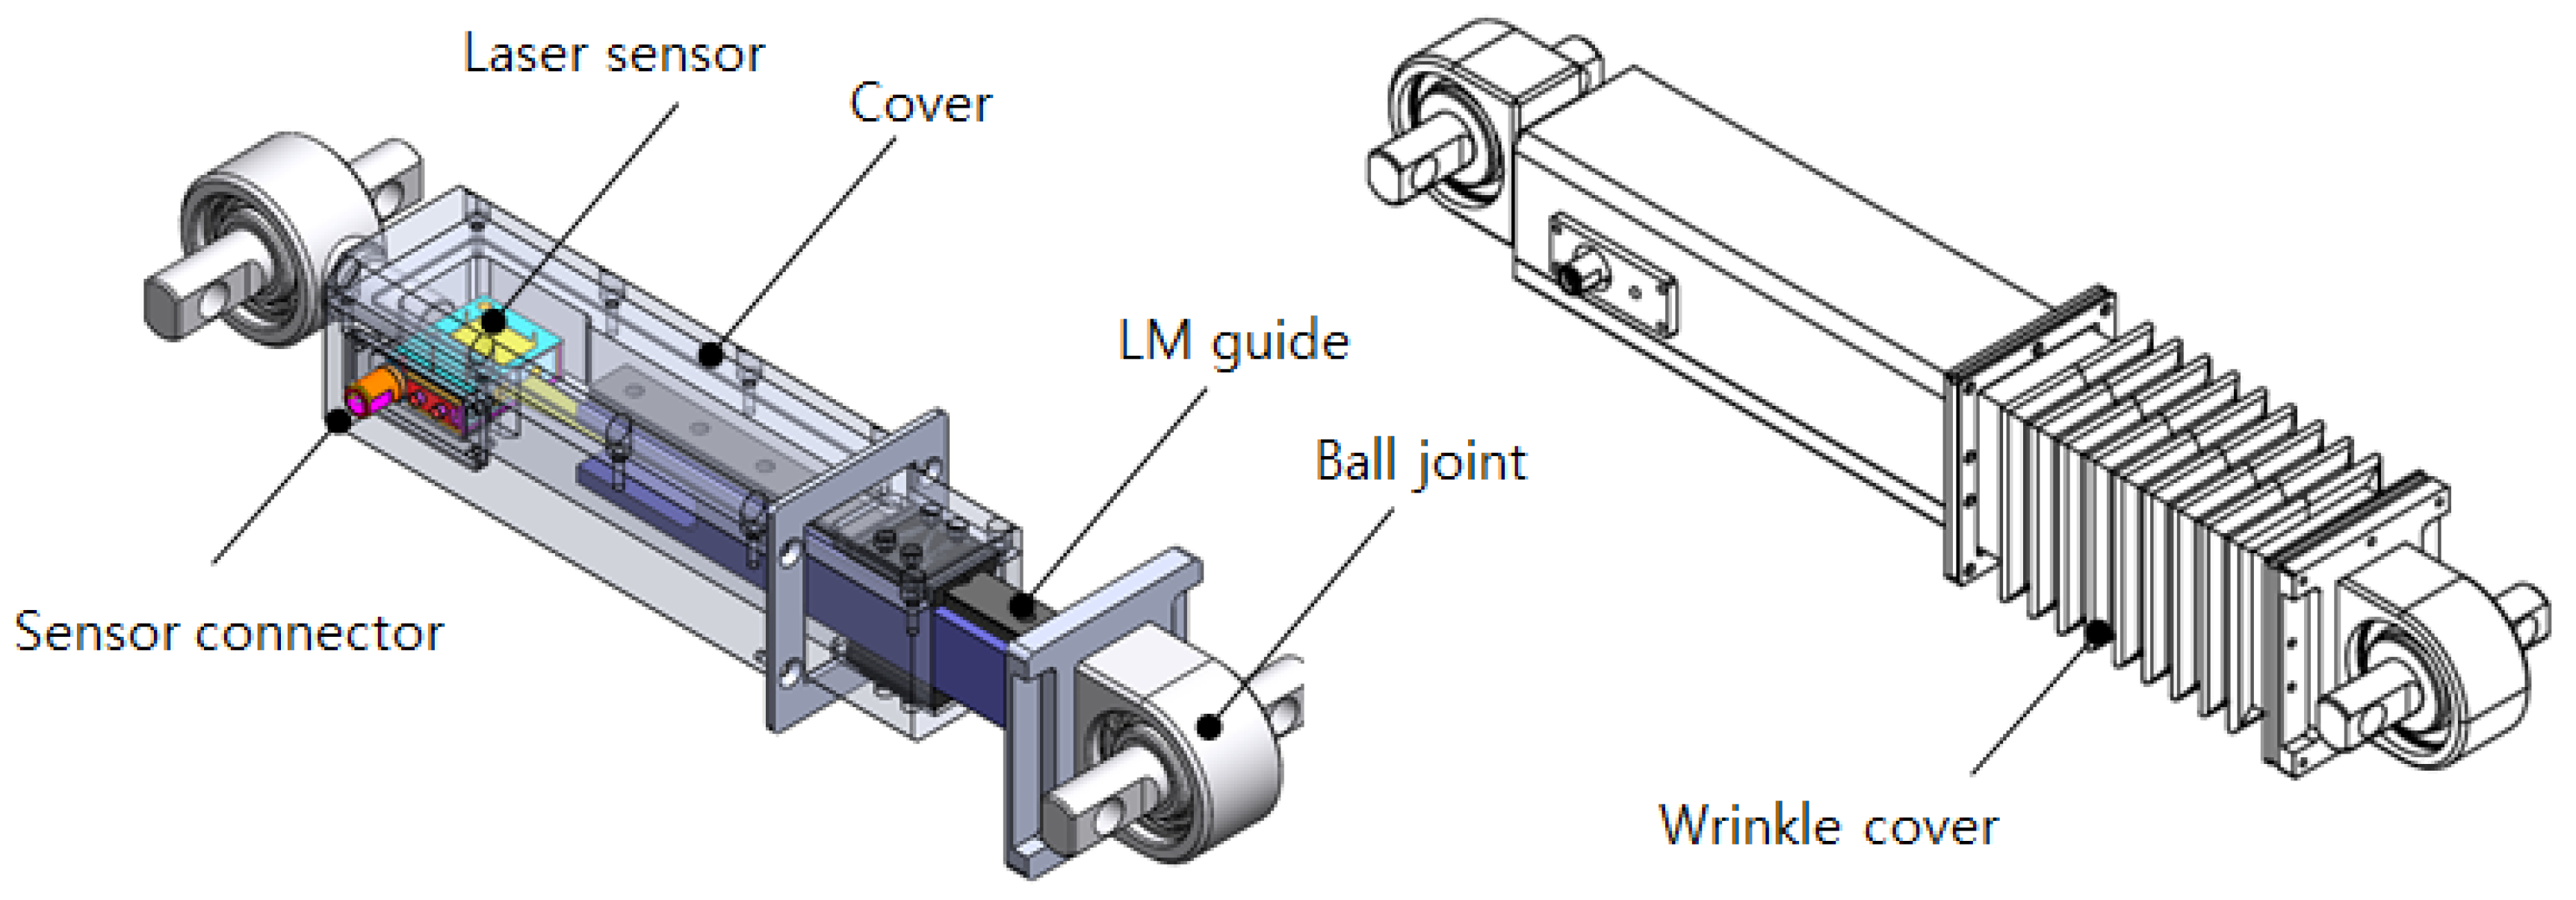
Figure 10 shows the shape and structure of the curvature sensor.
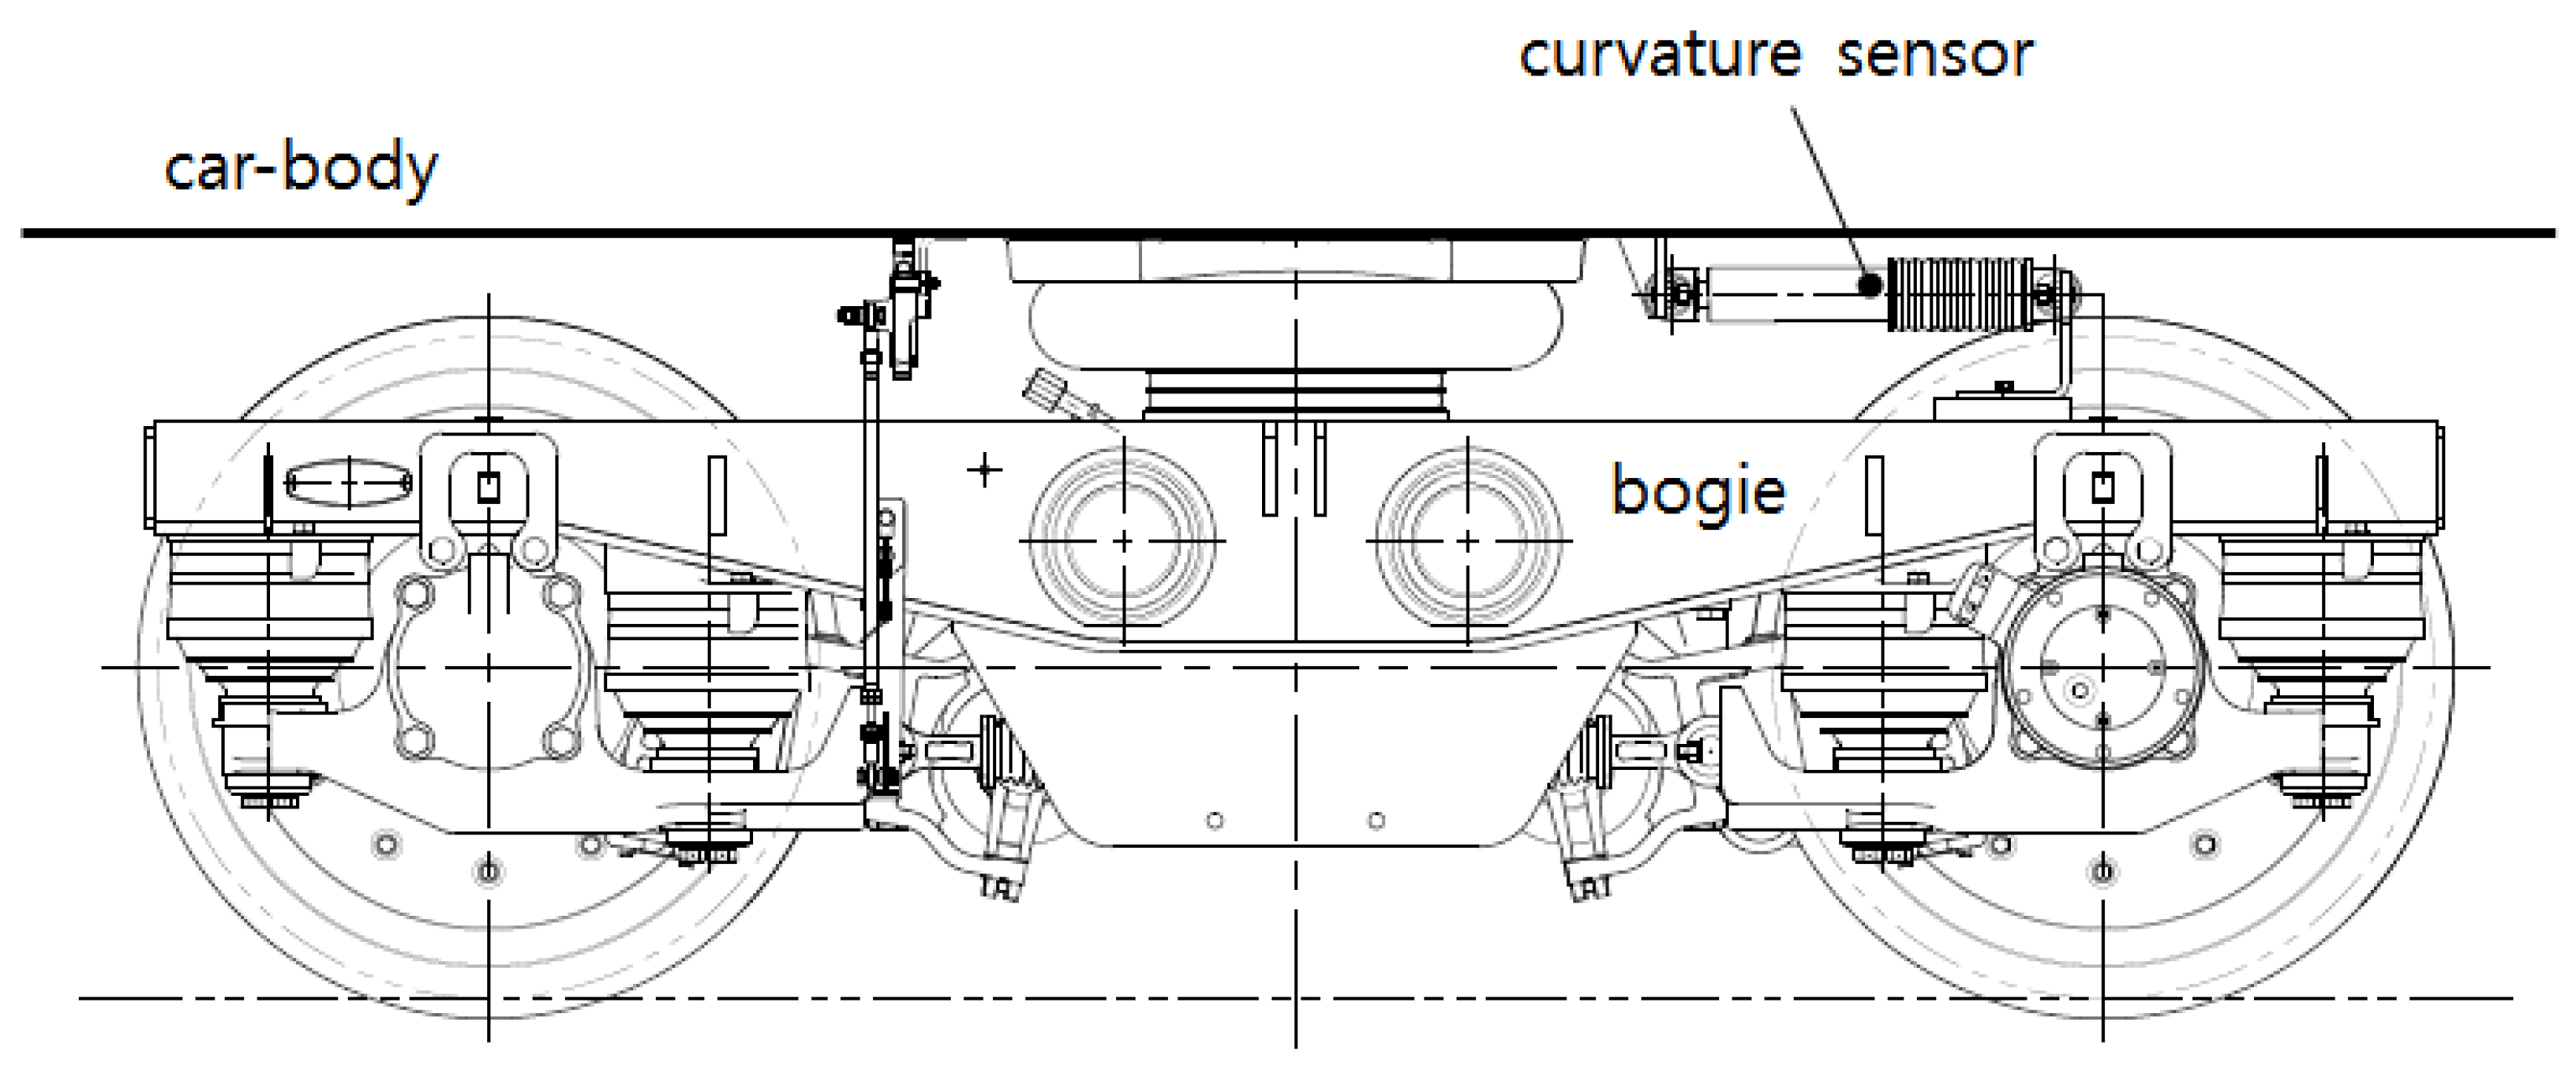
Figure 11 is the installation position of the curvature sensor installed in a running direction between the vehicle car body and bogies. One set of curvature sensors is installed in the front bogie and the rear bogie, respectively, and a total of two sets are installed per vehicle.
The curvature sensor has a rectangular cylinder shape structure equipped with a non-contact laser sensor to measure the relative displacement that occurs between the vehicle car body and the bogie when a railway vehicle runs. It was designed to protect the non-contact displacement sensor installed inside the curvature sensor from external alien substances when installed in a railway vehicle. The outer cylinder and the inner cylinder are structured to be guided and moved by an LM guide installed therein. A wrinkled rubber cover is mounted between the inner tube and the LM guide part to prevent wear and the inflow of external alien substances. In addition, ball joints are mounted on both ends of the curvature sensor to minimize rotational resistance caused by the roll, pitch and yaw movement of the vehicle when installed in the vehicle.
Table 2 shows the specifications of the curvature sensor and
Figure 12 represents the shape of the manufactured curvature sensor prototype.
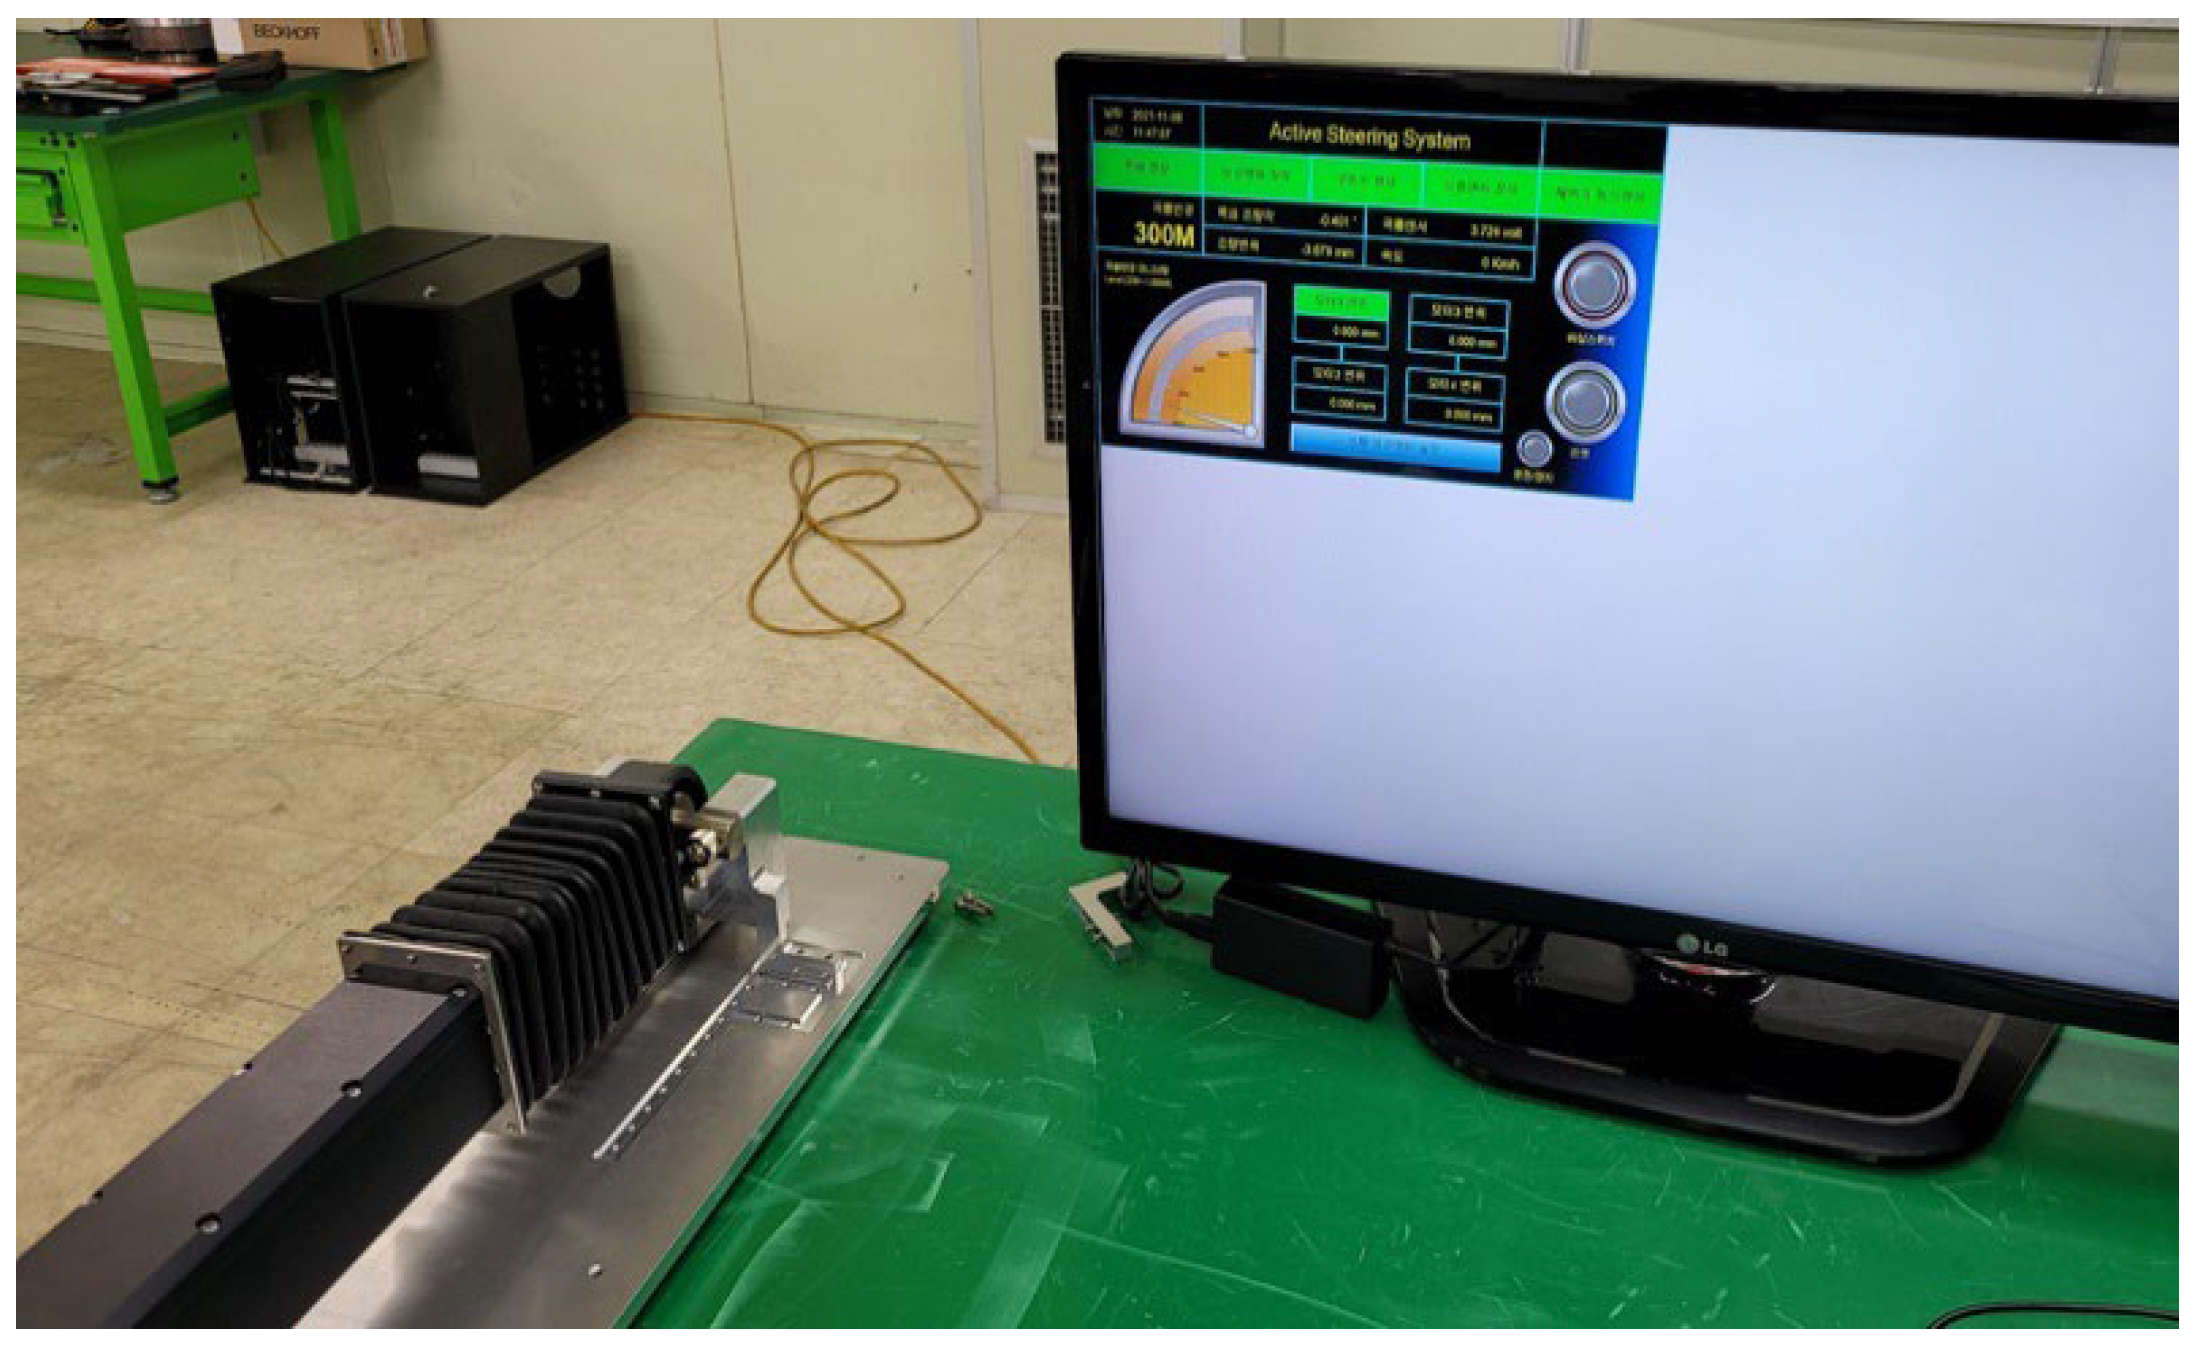
A functional test was performed to confirm the curvature measurement function according to the relative displacement stroke of the manufactured curvature sensor prototype. As shown in
Figure 13, the test was performed by setting a stroke according to the curve radius in the curvature sensor and recording the result of the curve radius measured at that time. At this time, one-half of the distance between the center of the front bogie and the rear bogie (
L), and lateral spacing between the curvature sensor and the bogie center (
x), which have a fixed value according to the curve radius calculation formula, were input as 6.9 m for
L and 1050 mm for
x. In addition, in the functional test, the curve radius test condition was set from R75 to R1000, which is the curve radius measurement range of the curvature sensor.
Table 3 shows the functional test results for the curvature sensor prototype. The error was confirmed to be between −1.26% and 1.36% and it is expected that the manufactured curvature sensor prototype will show good curvature measurement performance.
3. On-Track Performance Evaluation of the Curvature Sensor
A test run to evaluate the performance of the curvature sensor prototype while installed on the railway vehicle was conducted on a test track. As for the test vehicle, an urban electric railway train used to analyze the validity of the curvature measurement method in the previous section was used.
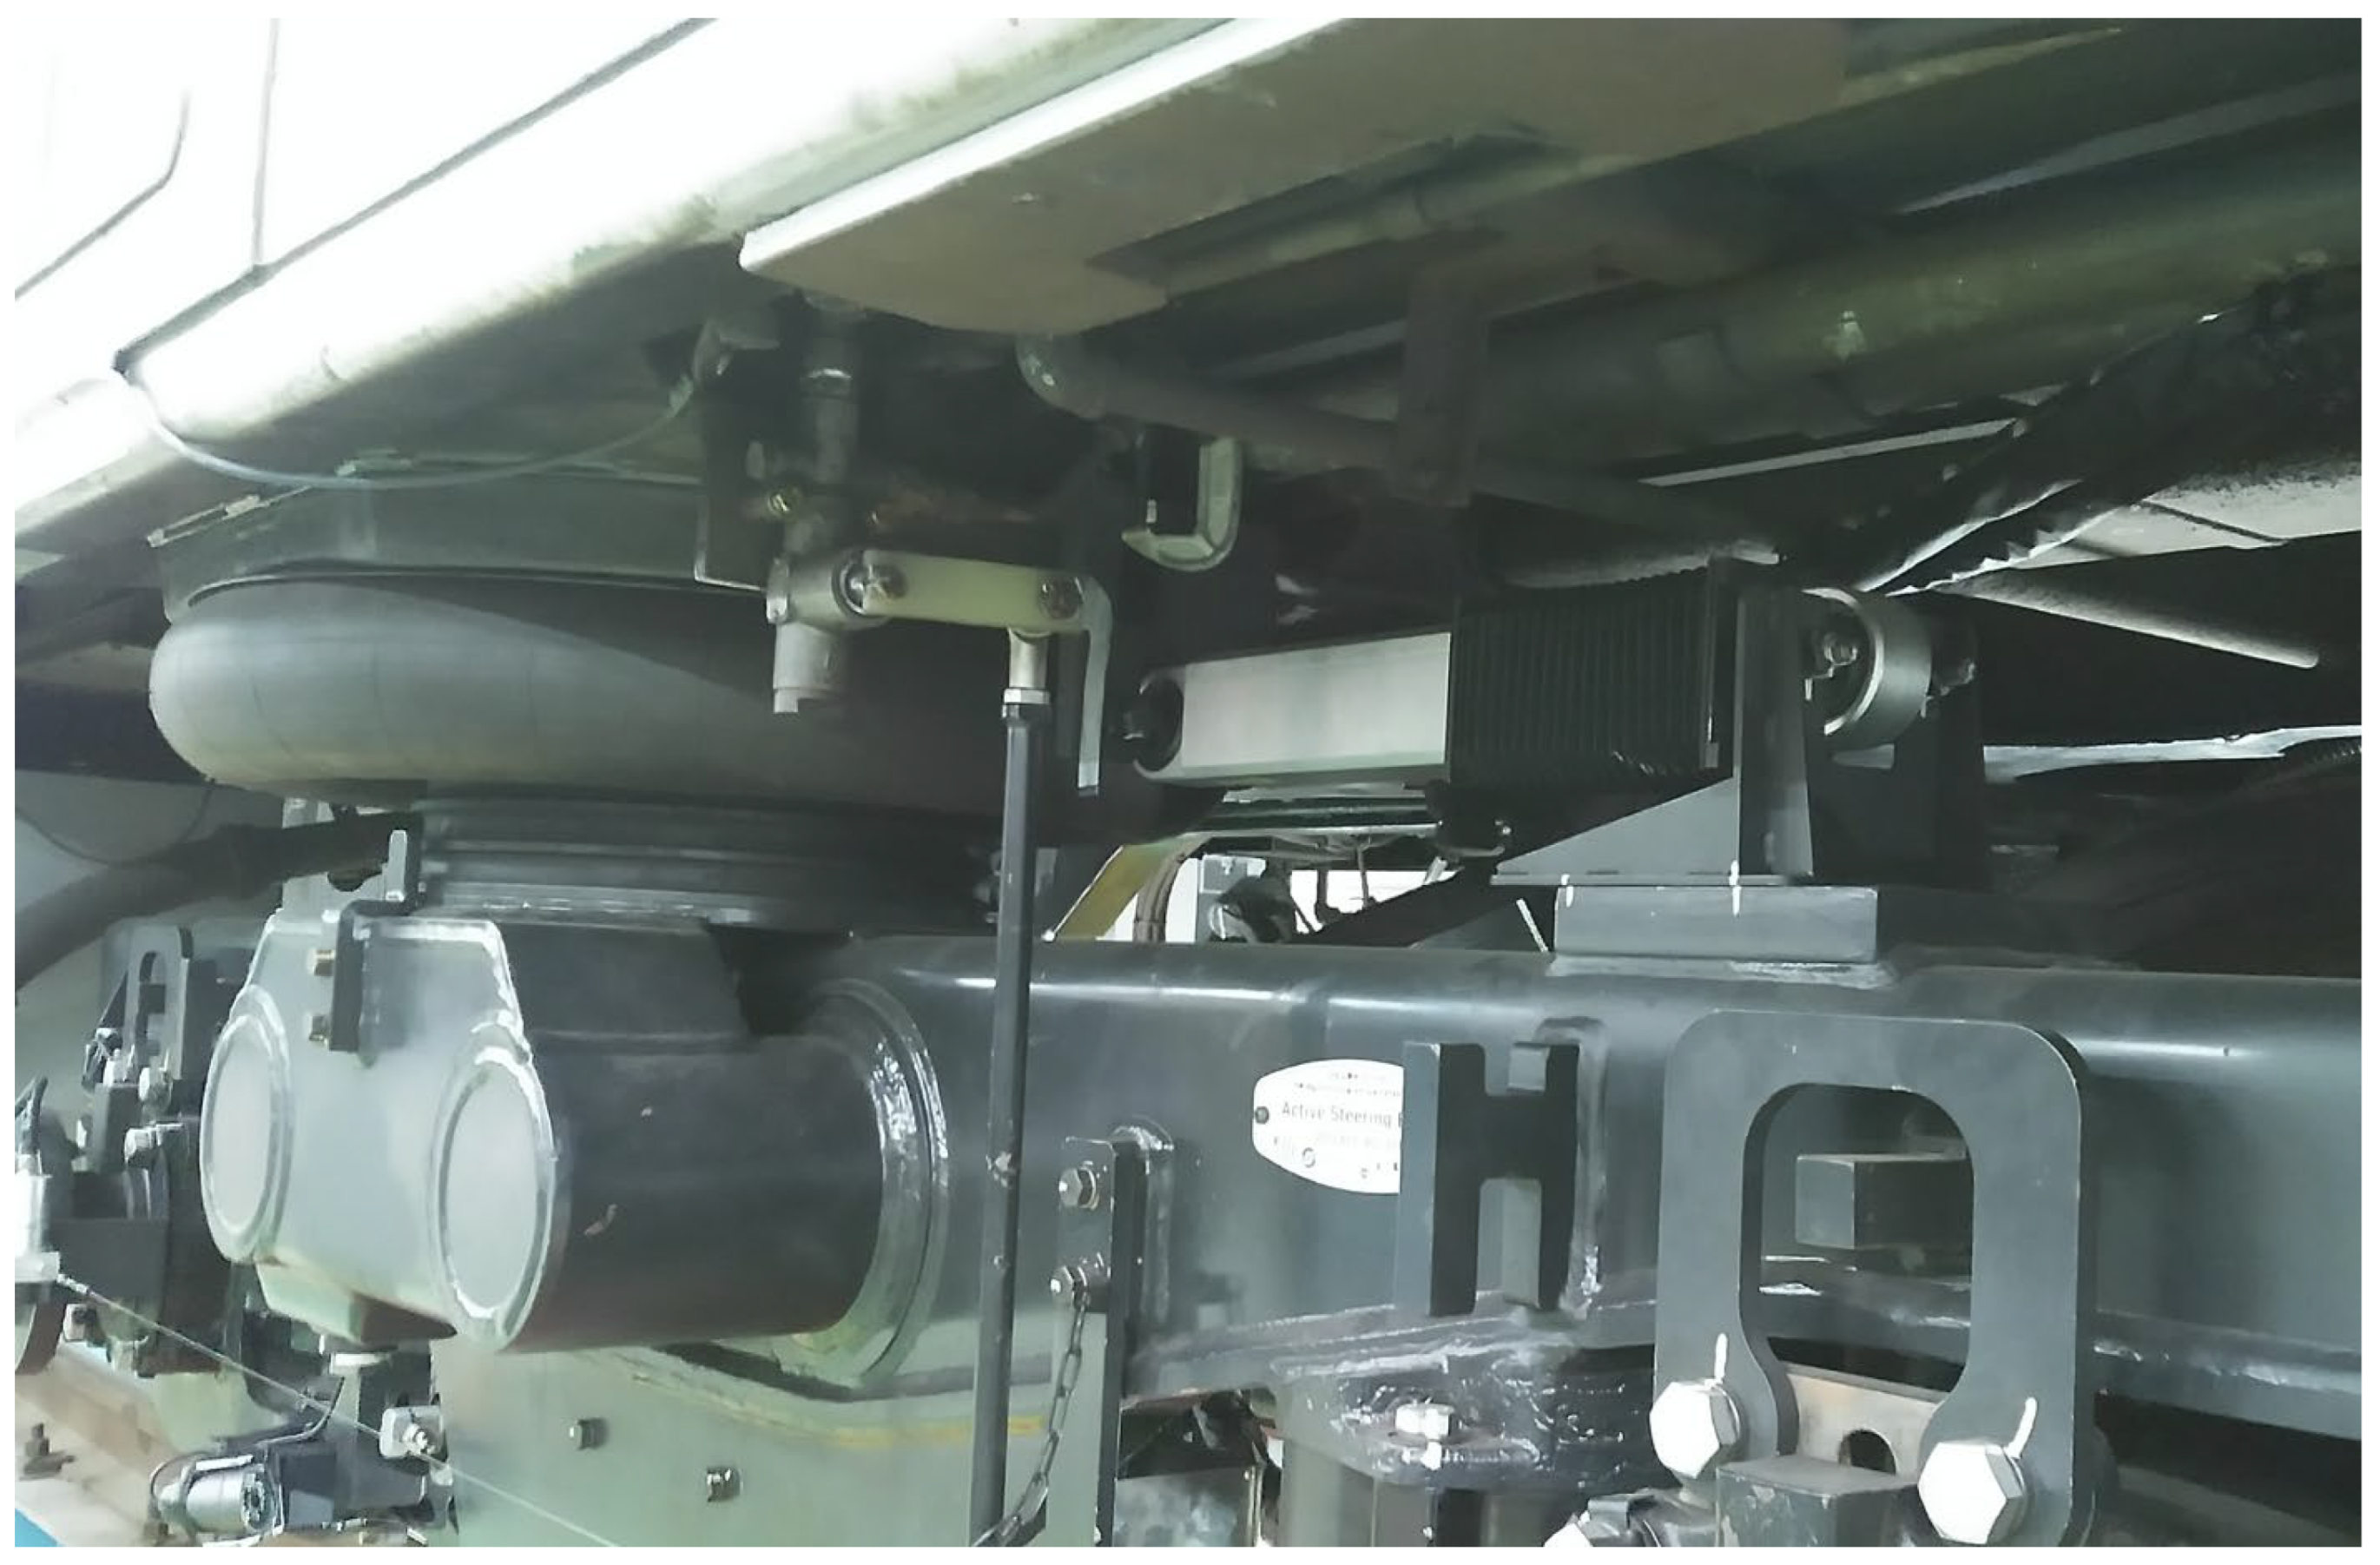
Figure 14 shows the shape of the curvature sensor installed on the test vehicle. The test track is the same as the test track section used as the track model for simulation in the previous section. The running speed of the test vehicle was performed three times at the commercial operating speed, as in Case-1 (Test-1, Test-2, Test-3), and once at a speed that decreased by 50%, as in Case-2 (Test-4).
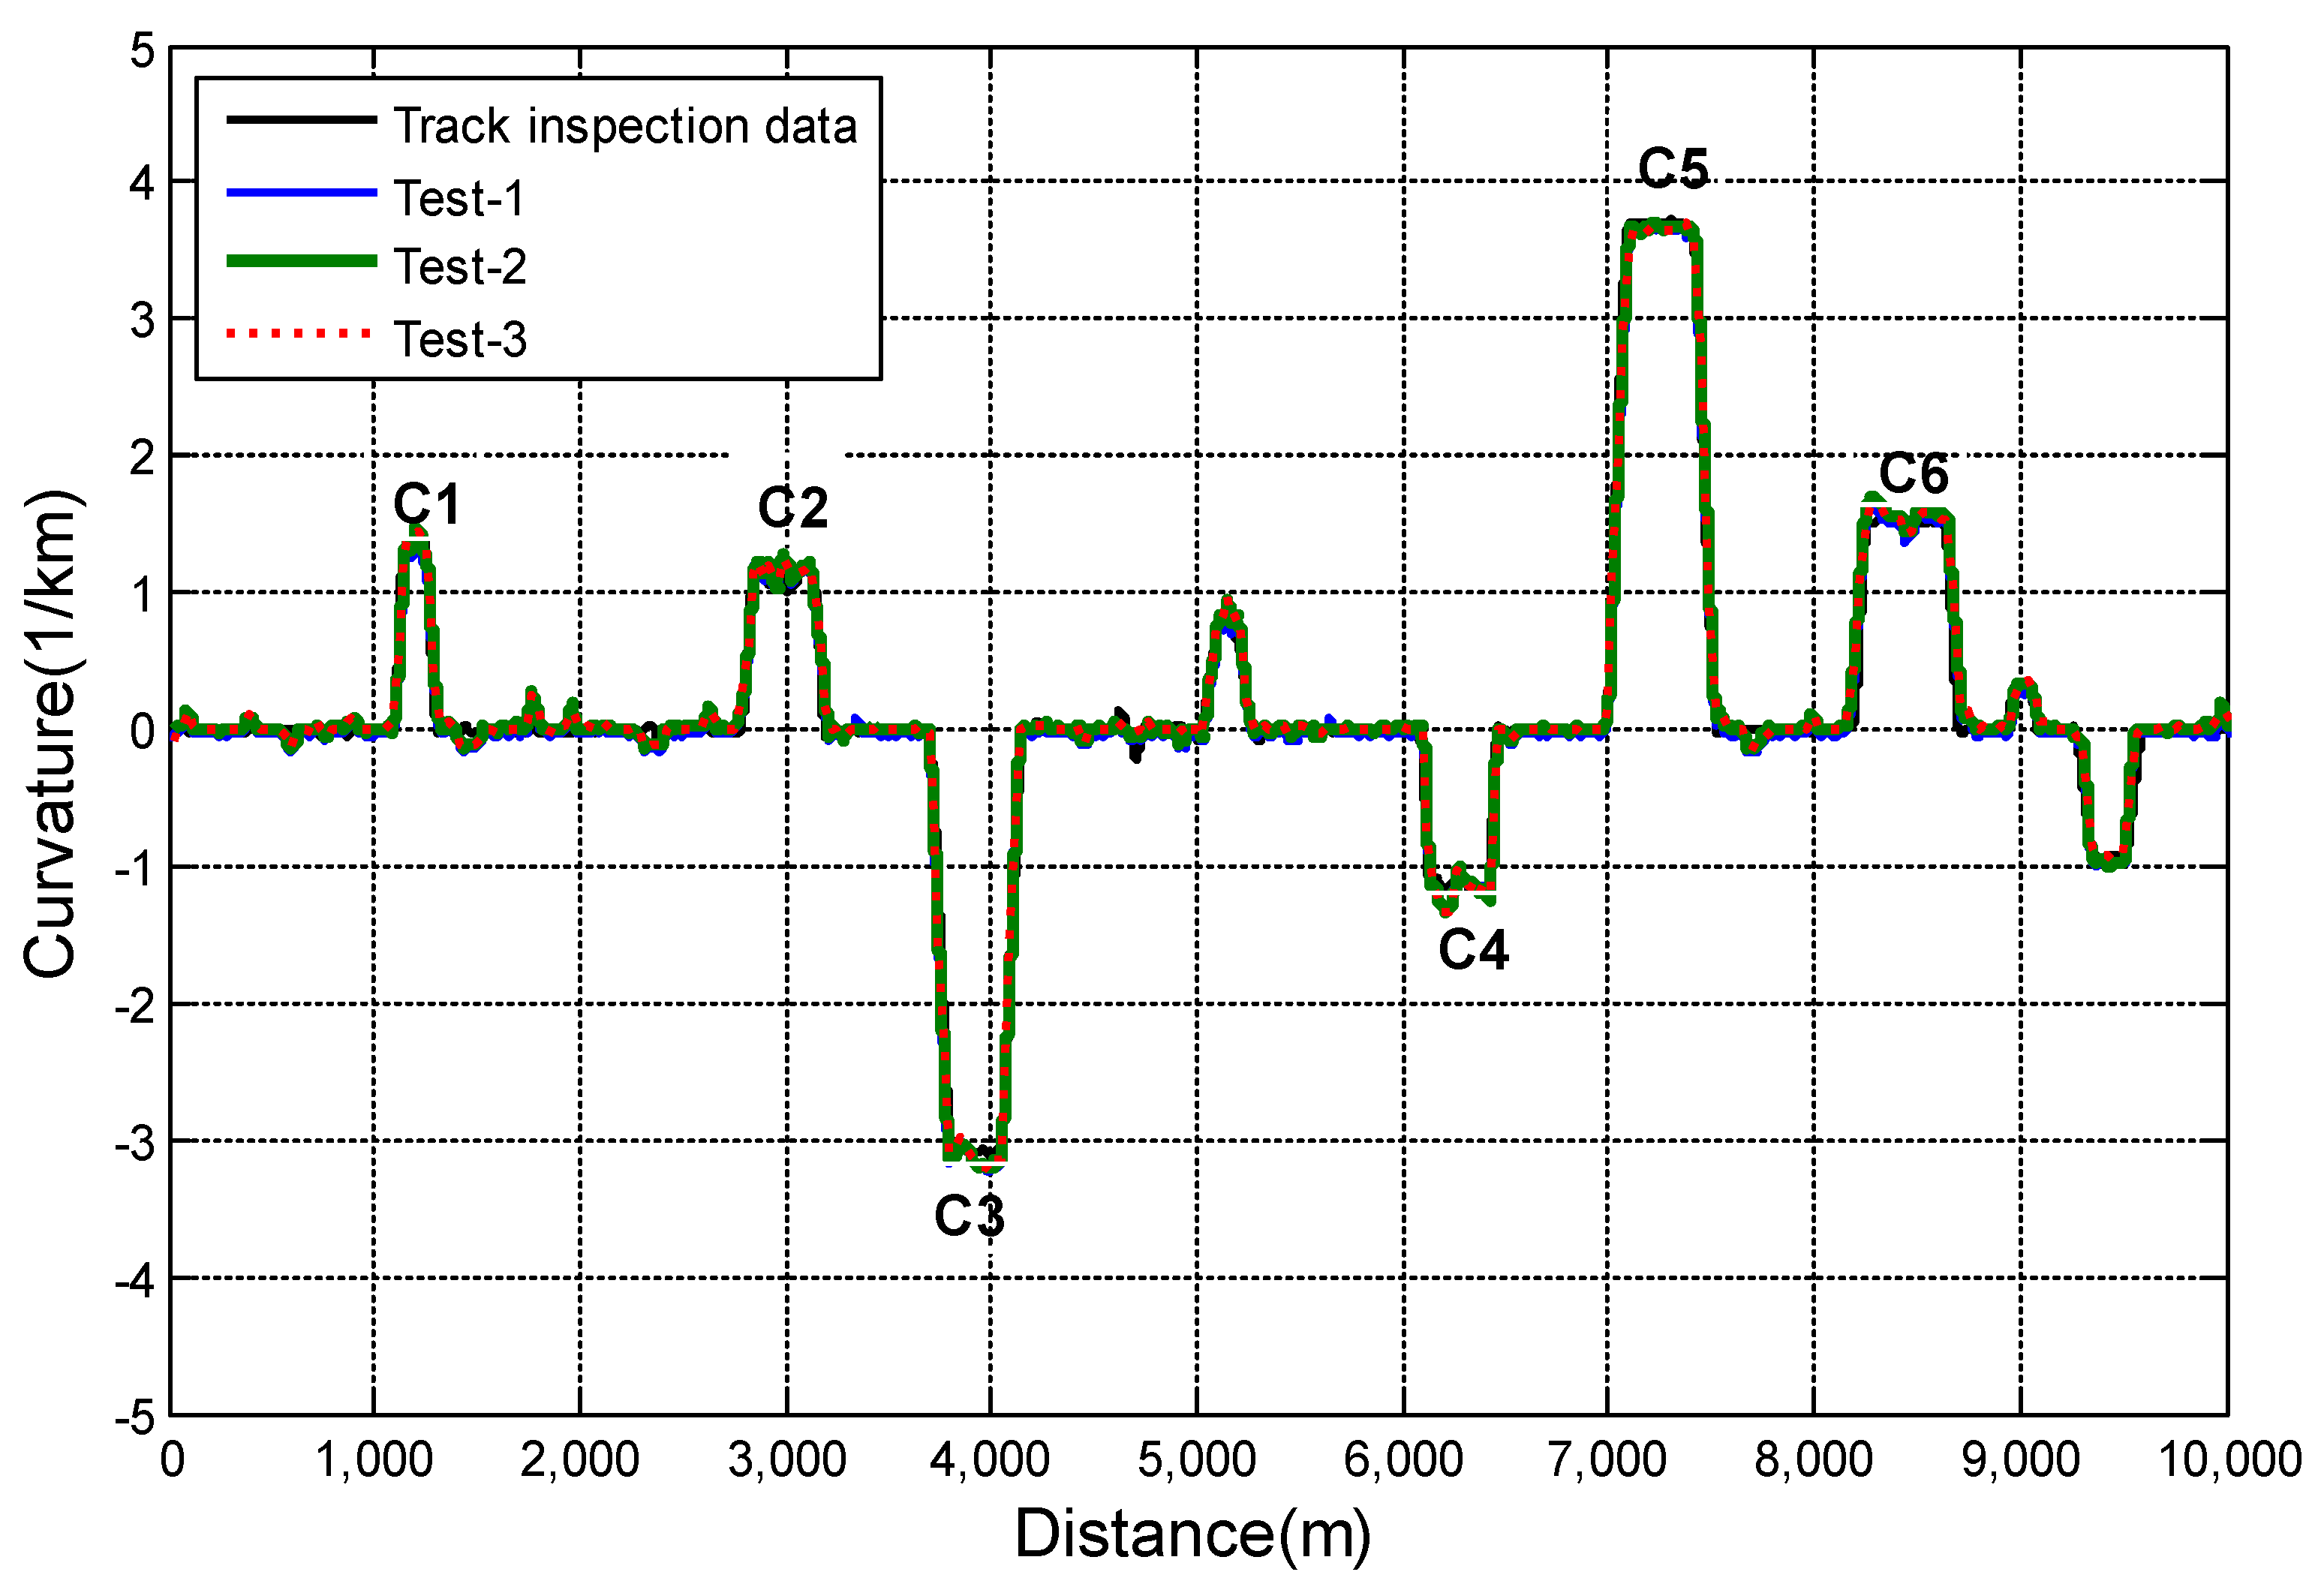
Figure 15 is the curvature measurement result (Test-1–Test-3) measured three times under the Case-1 speed condition and compared with the track inspection data.
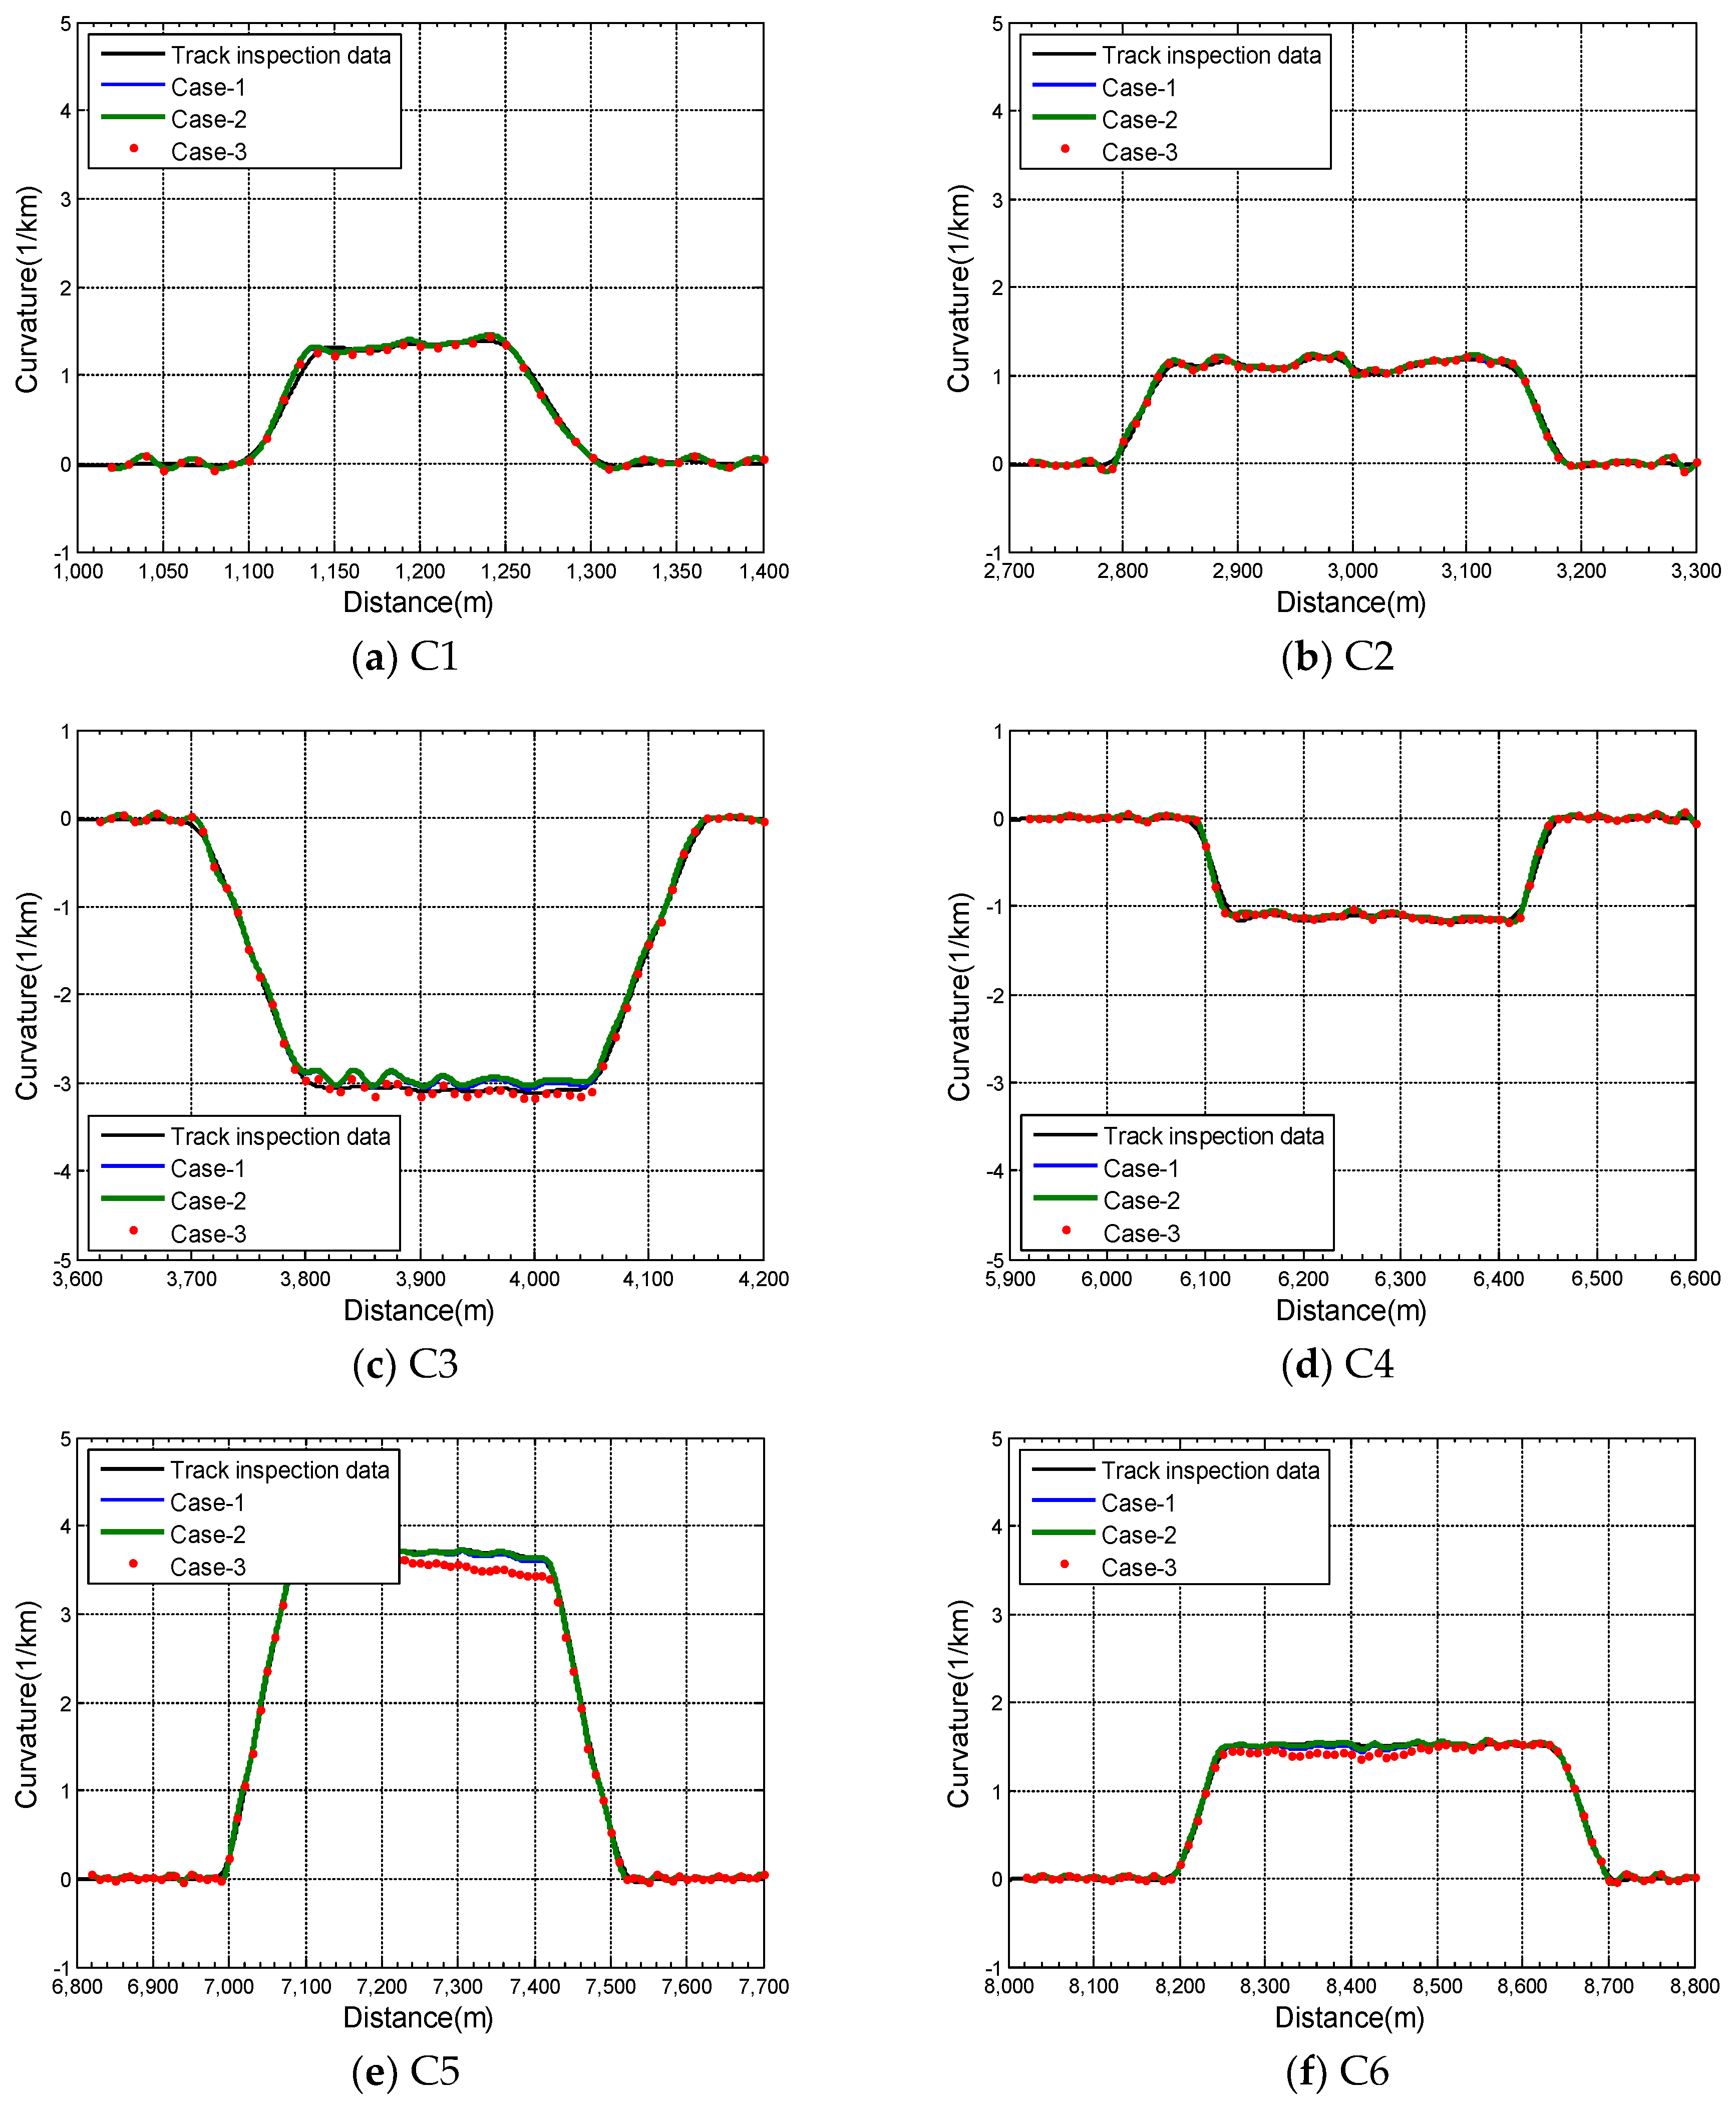
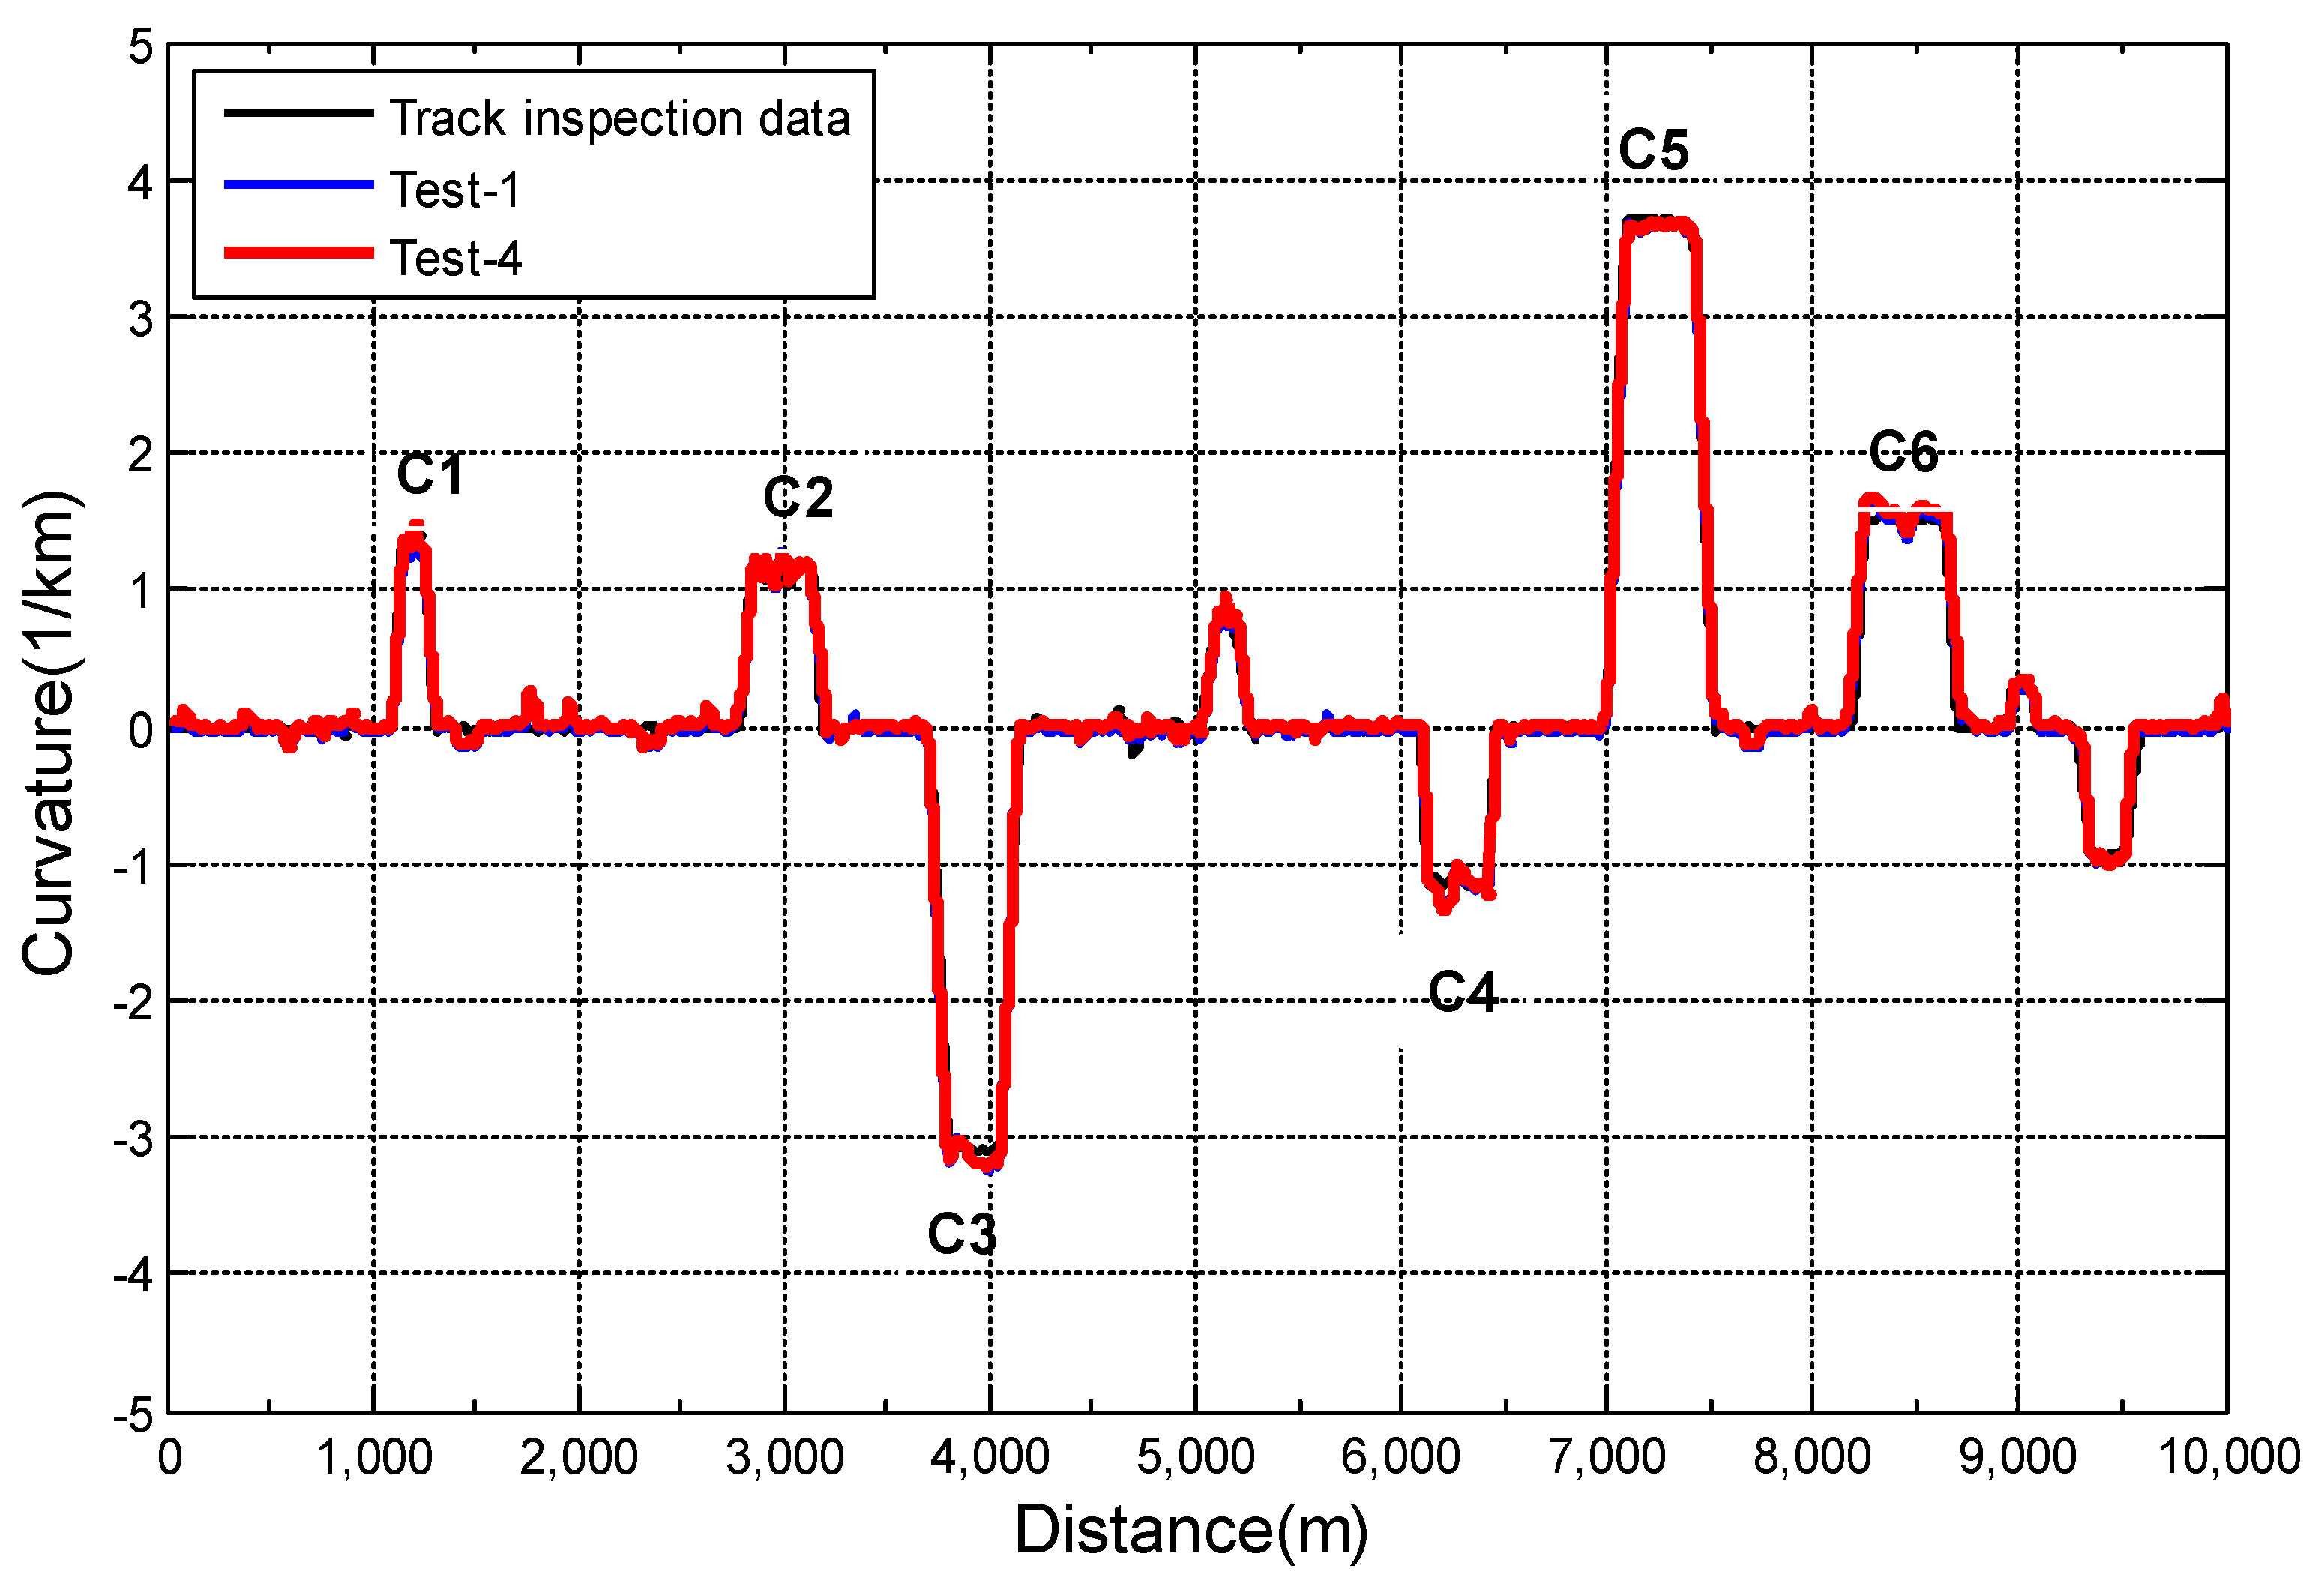
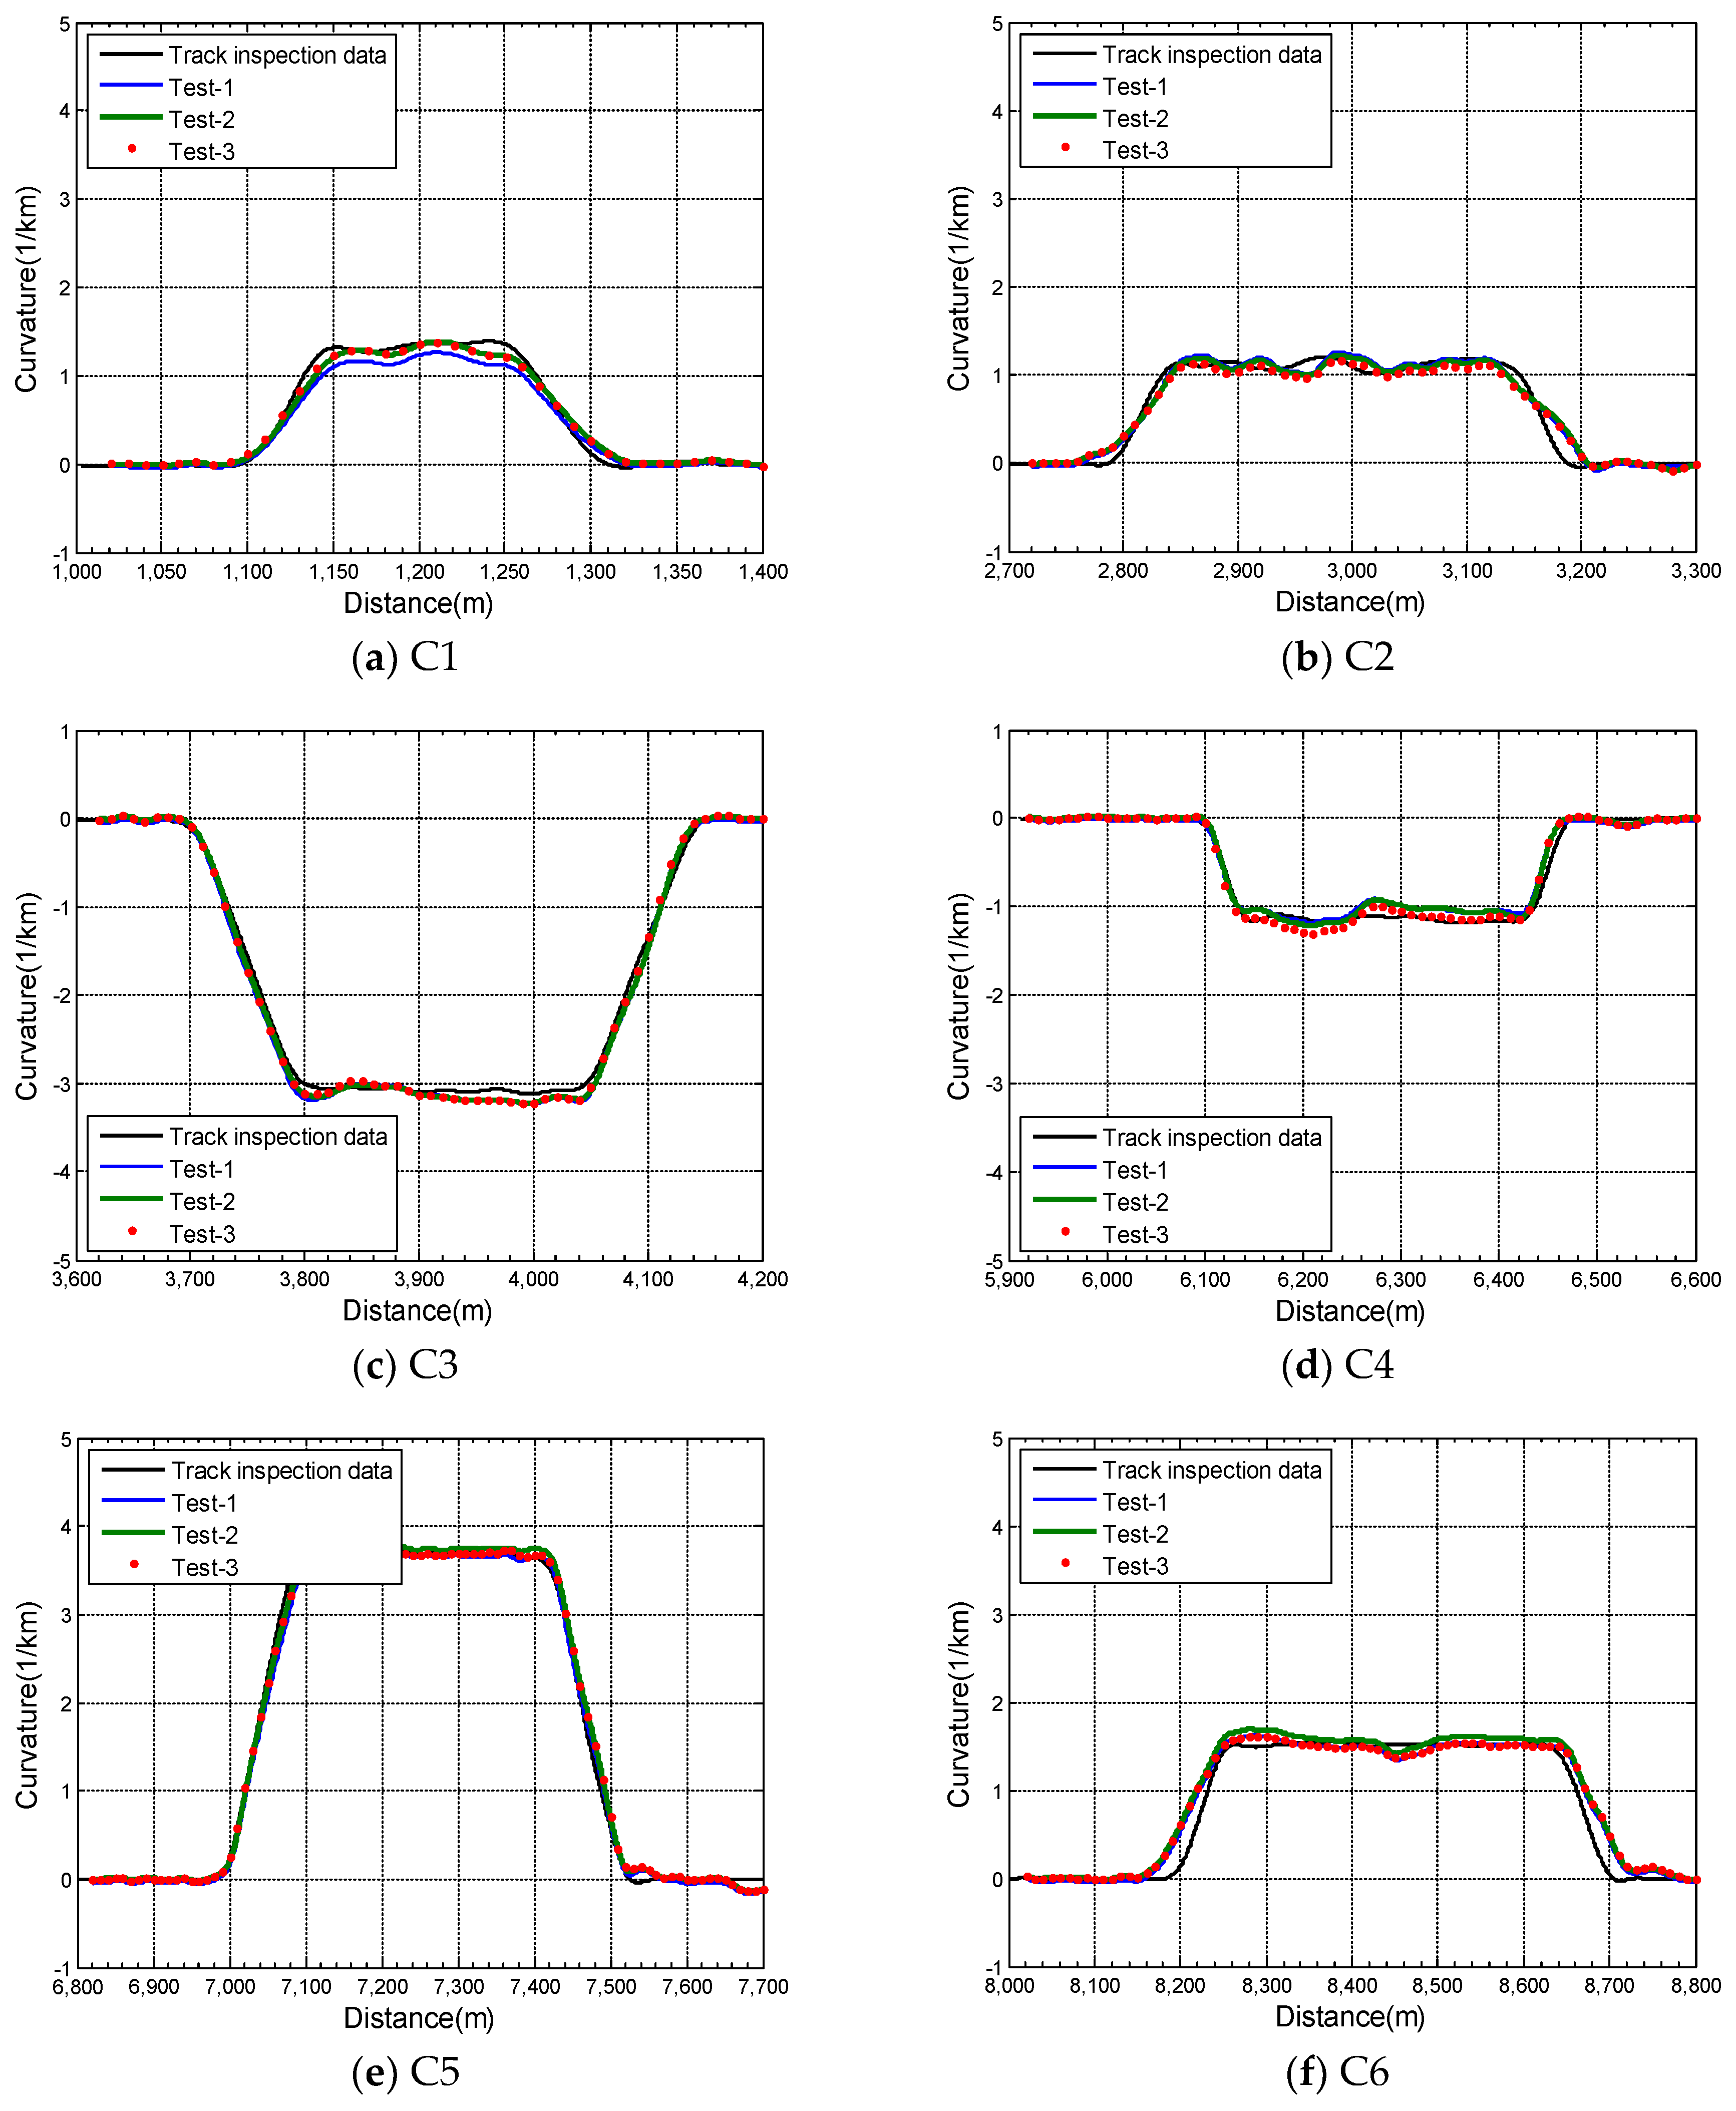
Figure 16 is a graph comparing track inspection data as a result of curvature measurement (Test-4) tested under a speed condition (Case-2) that was reduced by 50% of the operating speed to analyze the performance of the curvature sensor according to running speed variation. Throughout the entire test section, all curvature measurement test results are shown to be consistent with track inspection data. The detailed analysis results of the six curves with a curve radius of 1000 m or less, i.e., a curvature of 1 or more, for the Case-1 running speed conditions are shown in
Figure 17 and
Table 4. The curvature measurement results in
Table 4 are the average values for the circular curve section, and the deviation represents the absolute value of the difference between the track inspection data and the measured curvature results.
Among the curvature measurement results (Test-1–Test-3) and the trajectory measurement data under Case-1 speed conditions, the minimum was 0.8%, the maximum was 4.0% and the average was 2.8%. The deviation of the curvature measurement result (Test-4) measured under the Case-2 speed condition was 0.9 to 4.1%. This can be seen as a level almost similar to the deviation of the curvature measurement result under the Case-1 speed condition. This can be seen as a result consistent with the trend of the Case-2 analysis result of the curvature measurement simulation in the previous section. From this, it can be confirmed that the curvature measurement method has little effect on the running speed.
Therefore, the track inspection data also include a measurement error of the track measurement system, so it is not an accurate curvature for the test section curve, but even considering this, the curvature measurement result of
Table 4 is considered to be a relatively good result. In addition, examining the deviation according to the measurement curvature, as shown in
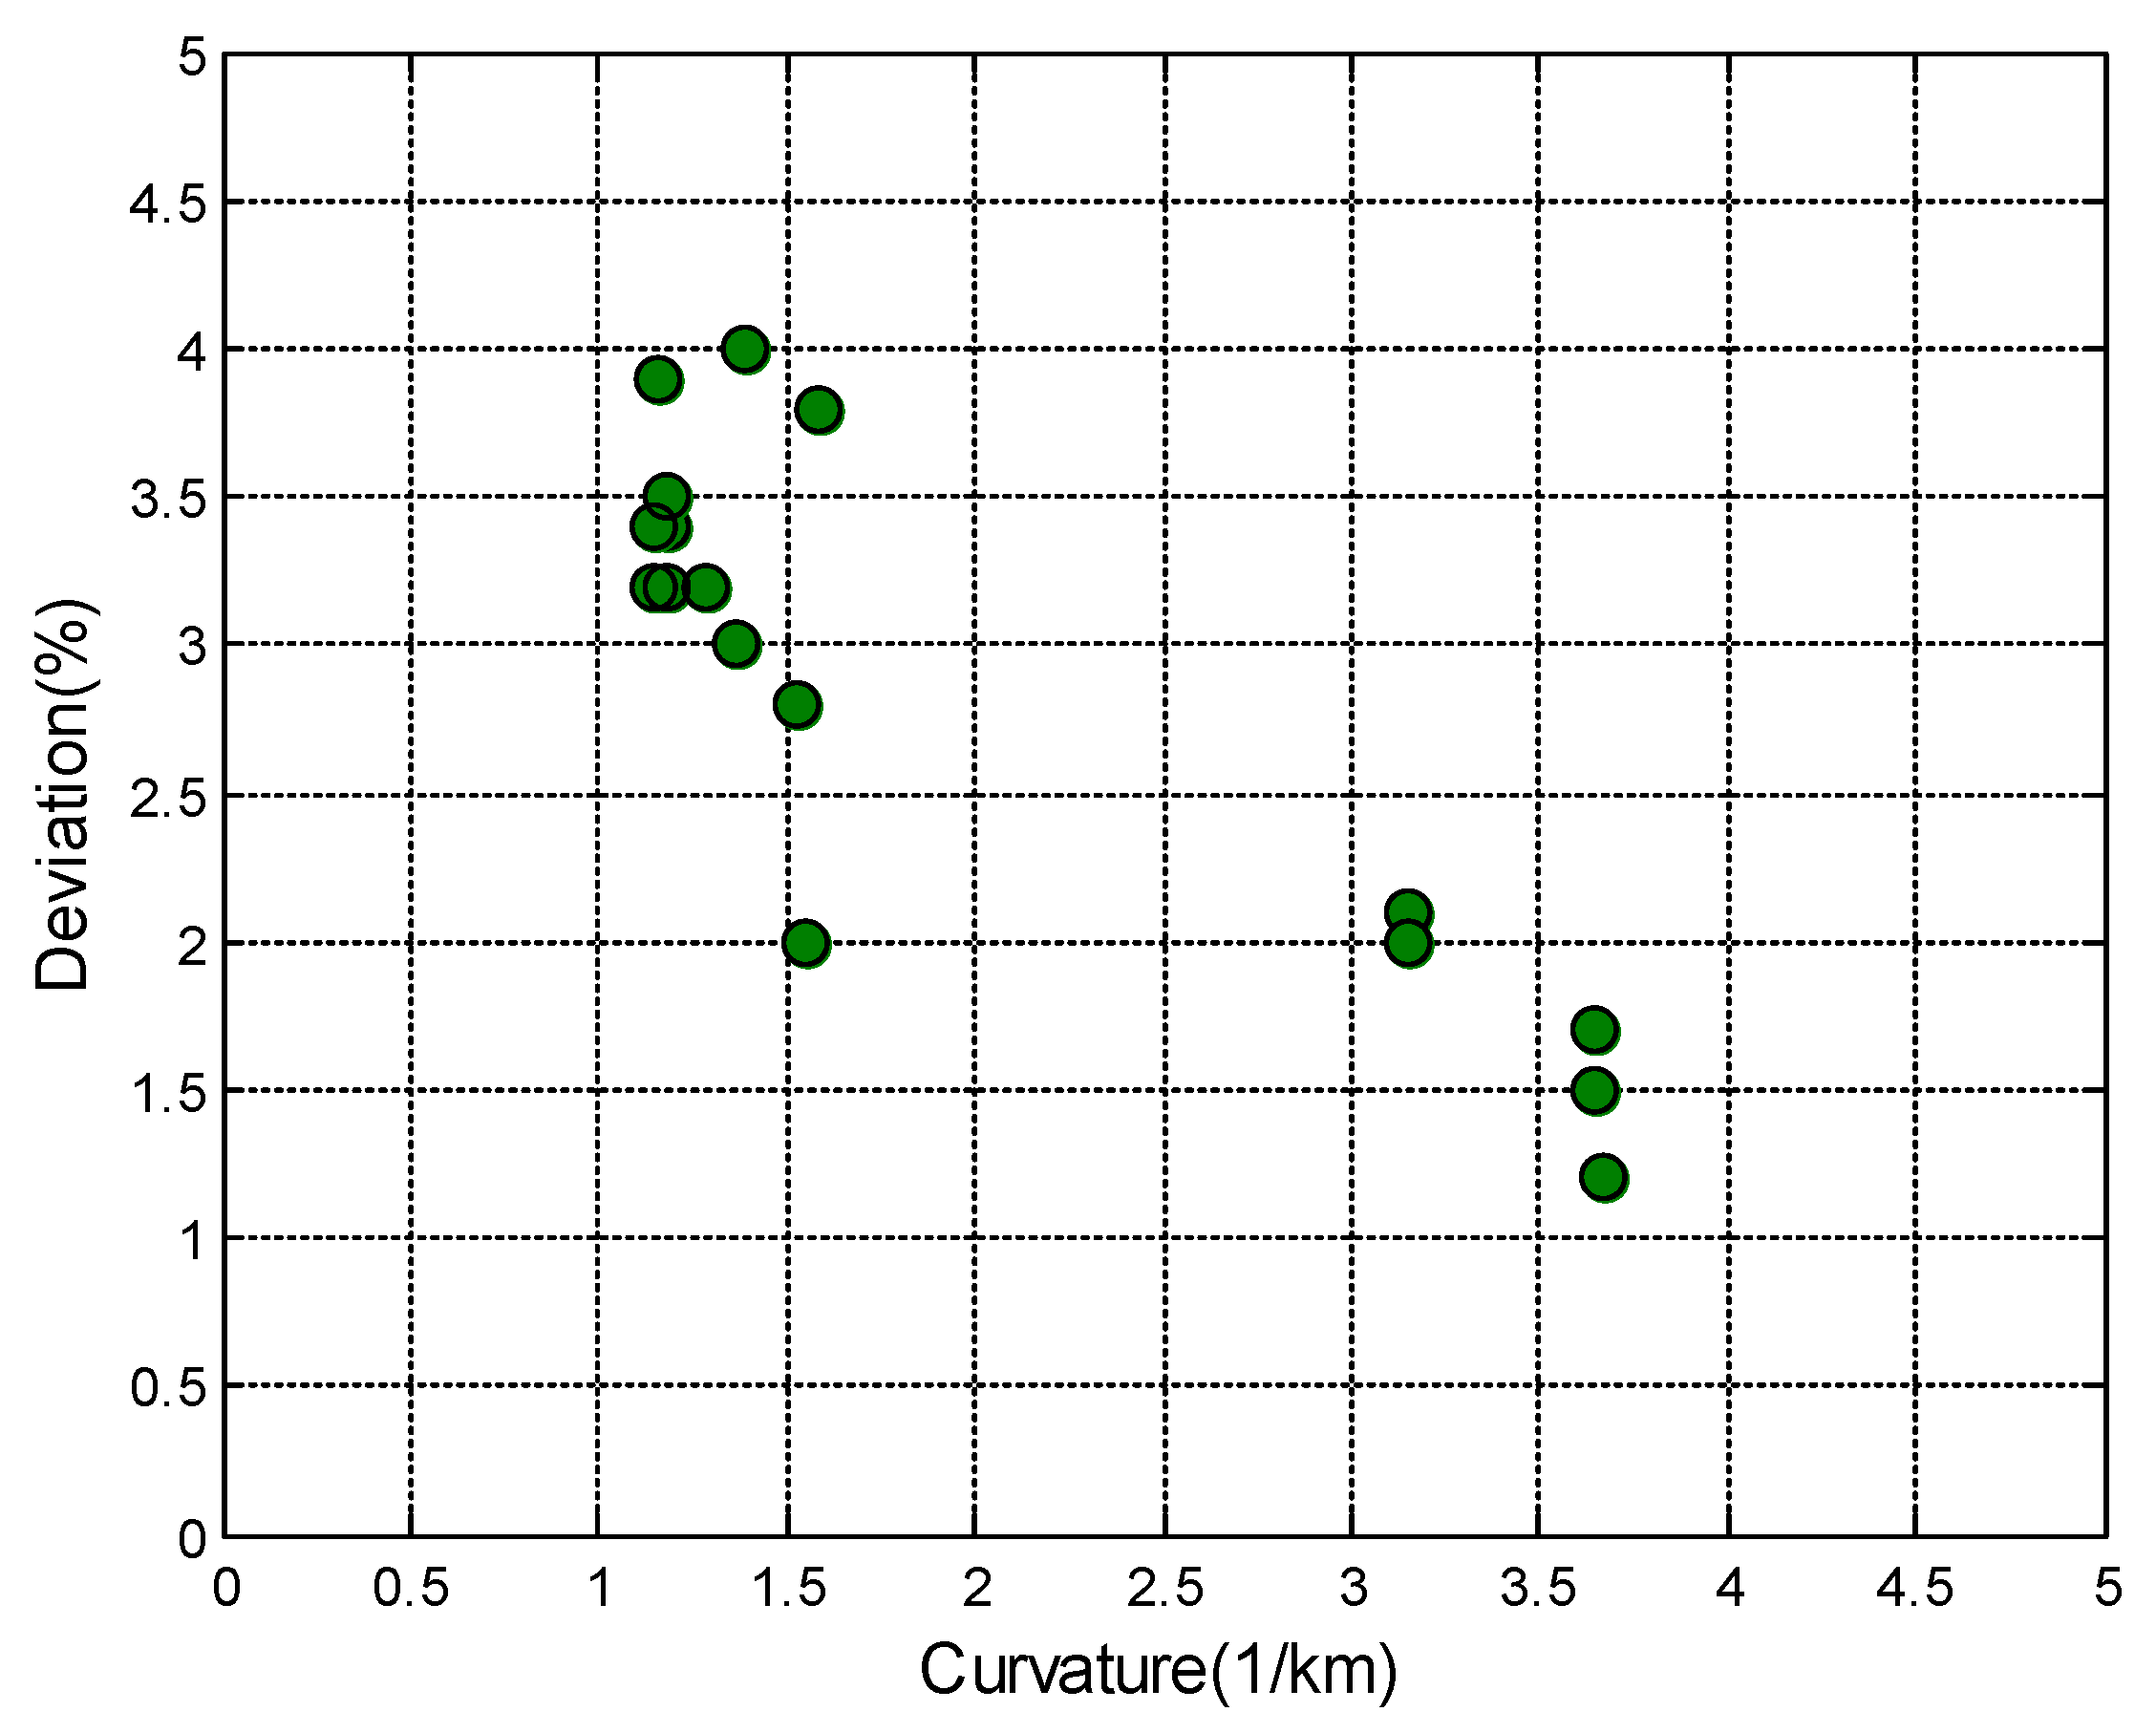
Figure 18, the larger the curvature, the smaller the deviation tends to be. If a certain measurement error exists, it has a relatively large effect on a large radius curve with a small curvature compared to a small radius curve with a large curvature. This means that in the case of a curve with a large curvature, the larger the curvature, the larger the displacement of the curvature sensor, and the larger the ratio of the measured values to the measurement system error, so the effect of the error becomes relatively small.
As described above, the curvatures of the test track were measured by installing the curvature sensor prototype on the test vehicle, and it was confirmed that the curvature measurement performance of the curvature sensor was evaluated at maximum 4.0% and on average 2.8%, and the speed had little effect on the curvature measurement. Therefore, the curvature measurement method derived from the proposed kinematic motion relationship is considered to exhibit very good curvature measurement performance.
4. Discussions and Conclusions
In this paper, a curvature sensor was designed and a prototype was manufactured to analyze the performance of a method of estimating curvature based on the kinematic motion of the car body and bogie of a railway vehicle when running in the curved section of a railway track. In order to confirm the curvature measurement performance of the prototype of the curvature sensor when running on the real track, a curvature sensor prototype was installed on a test vehicle and a test run was performed on a test track. To analyze the validity of the test results, test results were compared with the track inspection data and the test results were compared. The results are as follows.
The curvature measurement results (Test-1–Test-3) tested under the commercial operating speed condition (Case-1) on the test track show good curvature measurement performance, with a minimum deviation of 0.8%, a maximum deviation of 4.0% and an average deviation of 2.8%, compared with the track inspection data.
The deviation of the curvature measurement results (Test-4) measured under the speed condition (Case-2) in which the running speed of the test vehicle was reduced to 50% of the commercial operating speed was 0.9 to 4.1%. This can be seen as a level almost similar to the deviation of the curvature measurement results under commercial operating speed conditions. This is consistent with the trend and the Case-2 analysis results of the dynamic simulation, which means that the effect of the running speed is very insignificant in the case of the proposed curvature measurement method.
When examining the deviation of the curvature measurement result according to the curvature of the curve section, if the curvature is small, the deviation increases, and if the curvature increases, the deviation tends to decrease. This is consistent with the results of the functional test of the curvature sensor test and this method shows that the curvature measurement method has higher accuracy for a small radius curve with large curvature.
As described above, the curvature measurement performance test was conducted on the test track with a curvature sensor prototype installed in a test vehicle, and it is determined that the curvature measurement method derived from the proposed kinematic motion relationship shows excellent performance. In addition, the proposed method to implement a curvature measurement system is simple and inexpensive compared to any existing method, so it can be applied very practically to railway vehicle control.
In addition, another great advantage is that even if the operation line is changed, the curve can be efficiently detected without prior test runs. Therefore, the curvature measurement sensor is expected to be used practically in the field of curve detection and curvature extraction for controlling vehicles in the curve section. In the future, the developed curvature sensor will be used as a curvature sensor for curve detection when evaluating the performance of the commercial model of active steering bogies being developed.
Author Contributions
Conceptualization, H.M.H.; Methodology, H.M.H. and J.W.S.; Formal analysis, H.M.H., Y.J.S. and K.H.M.; Writing—original draft preparation, H.M.H.; Supervision, H.M.H. and Y.J.S.; Project administration, H.M.H.; Writing—review and editing, H.M.H., Y.J.S., J.W.S. and K.H.M. All authors have read and agreed to the published version of the manuscript.
Funding
This work was supported by a Korea Agency for Infrastructure Technology Advancement (KAIA) grant funded by the Ministry of Land, Infrastructure and Transport (project code: 22CACBC163504-02, Development of Technology for Commercialization of Active Steering Bogie for Electric Railway Vehicle in a Sharp Curve).
Institutional Review Board Statement
Not applicable.
Informed Consent Statement
Not applicable.
Conflicts of Interest
The authors declare no conflict of interest.
References
- Hur, H.M.; Lee, C.W.; Kwon, S.T.; Yun, C.H. Analysis on the Wear Patterns of Wheel Profiles for Conventional Line. Korean Soc. Railway. 2003, 5a, 651–655. [Google Scholar]
- You, W.H.; Hur, H.M.; Ko, H.I.; Park, H.H.; Choi, Y.W. A Study on Relationship between Curving Noise and Wheel Wear in Seoul Subway System. Trans. Korean Soc. Noise Vib. 2009, 19, 85–93. [Google Scholar]
- Kim, N.P.; Han, S.H.; Choe, K.Y.; Park, T.W. The Study on the Vibrational Characteristics of Korean Tilting Train, Hanvit200. Trans. Korean Soc. Noise Vib. Eng. 2008, 18, 509–514. [Google Scholar]
- Hur, H.M.; Park, J.H.; You, W.H. Trend of the Active Technology for Railway Rolling-stock. Korean Soc. Precis. Eng. 2011, 6a, 1559–1560. [Google Scholar]
- Mei, T.X.; Goodall, R.M. Recent Development in Active Steering of Railway. Veh. Syst. Dyn. 2003, 39, 415–436. [Google Scholar] [CrossRef]
- Shen, S.; Mei, R.X.; Goodall, R.M.; Pearson, J.; Himmelstein, G. A Study of Active Steering Strategies for Railway Bogie. Veh. Syst. Dyn. Suppl. 2004, 41, 282–291. [Google Scholar]
- Ko, T.W.; Lee, D.S. Study for Prediction of Ride Comfort on the Curve Track by Predictive Curve Detection. Korean Soc. Railw. 2011, 10a, 69–74. [Google Scholar]
- Heirich, O.; Lehner, A.; Robertson, P.; Strang, T. Measurement and Analysis of Train Motion and Railway Track Characteristics with Inertial Sensors. In Proceedings of the 2011 14th International IEEE Conference on Intelligent Transportation Systems (ITSC), Washington, DC, USA, 5–7 October 2011; pp. 1995–2000. [Google Scholar]
- Trehag, J.; Handel, P.; Ogren, M. Onboard Estimation and Classification of a Railroad Curvature. IEEE Trans. Instrum. Meas. 2010, 59, 653–660. [Google Scholar] [CrossRef]
- Farkas, A. Measurement of Railway Track Geometry: A State-of-the-Art Review. Period. Polytech. Transp. Eng. 2020, 48, 76–88. [Google Scholar] [CrossRef] [Green Version]
- Esveld, C. Modern Railway Track; MRT-Productions: Zaltbommel, The Netherlands, 2001; pp. 506–514. [Google Scholar]
- Zboinski, K.; Woznica, P. Optimum Railway Transition Curves—Method of the Assessment and Results. Energies 2021, 14, 3995. [Google Scholar] [CrossRef]
- Brustad, T.F.; Dalmo, R. Railway Transition Curves: A Review of the State-of-the-Art and Future Research. Infrastructures 2020, 5, 43. [Google Scholar] [CrossRef]
- Hur, H.M.; Park, J.H.; You, W.H. Curvature Estimation Method of Curve Section Using Relative Displacement between Body and Bogie of Rolling-stock. Trans. Korean Soc. Mech. Eng. A 2012, 36, 1479–1485. [Google Scholar] [CrossRef] [Green Version]
Figure 1.
Position of car body and bogies in a straight line.
Figure 1.
Position of car body and bogies in a straight line.
Figure 2.
Position of car body and bogies in a curved section.
Figure 2.
Position of car body and bogies in a curved section.
Figure 3.
Relative displacement between car body and bogie.
Figure 3.
Relative displacement between car body and bogie.
Figure 4.
Railway vehicle model.
Figure 4.
Railway vehicle model.
Figure 5.
Track model for multibody dynamic simulation.
Figure 5.
Track model for multibody dynamic simulation.
Figure 6.
Displacement of front curvature sensor from simulation.
Figure 6.
Displacement of front curvature sensor from simulation.
Figure 7.
Displacement of rear curvature sensor from simulation.
Figure 7.
Displacement of rear curvature sensor from simulation.
Figure 8.
Curvature simulation result.
Figure 8.
Curvature simulation result.
Figure 9.
Curvature simulation result for each curve.
Figure 9.
Curvature simulation result for each curve.
Figure 10.
Structure of the curvature sensor.
Figure 10.
Structure of the curvature sensor.
Figure 11.
Installation position of the curvature sensor.
Figure 11.
Installation position of the curvature sensor.
Figure 12.
Curvature sensor prototype.
Figure 12.
Curvature sensor prototype.
Figure 13.
Functional test for curvature sensor.
Figure 13.
Functional test for curvature sensor.
Figure 14.
Curvature sensor installed in the test vehicle.
Figure 14.
Curvature sensor installed in the test vehicle.
Figure 15.
Curvature test result.
Figure 15.
Curvature test result.
Figure 16.
Curvature test results based on running speed.
Figure 16.
Curvature test results based on running speed.
Figure 17.
Curvature test result for each curve.
Figure 17.
Curvature test result for each curve.
Figure 18.
Deviation based on the measured curvature.
Figure 18.
Deviation based on the measured curvature.
Table 1.
Curvature analysis results.
Table 1.
Curvature analysis results.
| Curve | Curvature (1/km) | Deviation (%) |
|---|
Track
Data | Case-1 | Case-2 | Case-3 | Case-1 | Case-2 | Case-3 |
|---|
| C1 | 1.33 | 1.36 | 1.36 | 1.34 | 2.1 | 2.3 | 0.3 |
| C2 | 1.11 | 1.14 | 1.14 | 1.13 | 1.9 | 2.0 | 1.6 |
| C3 | −3.08 | −3.01 | −2.98 | −3.11 | 2.4 | 3.5 | 0.9 |
| C4 | −1.14 | −1.12 | −1.11 | −1.12 | 2.2 | 2.3 | 1.4 |
| C5 | 3.71 | 3.69 | 3.70 | 3.59 | 0.5 | 0.3 | 3.1 |
| C6 | 1.52 | 1.51 | 1.52 | 1.46 | 0.8 | 0.1 | 3.8 |
| min. | 0.5 | 0.1 | 0.3 |
| max. | 2.4 | 3.5 | 3.8 |
| average | 1.7 | 1.8 | 1.9 |
Table 2.
Specifications of the curvature sensor.
Table 2.
Specifications of the curvature sensor.
| Item | Specifications |
|---|
| curve-sensing range | R75 to R1000 |
| stroke | 500 ± 120 mm |
| laser sensor resolution | 0.1 mm |
| sensor supply power | +18 to +30 V |
| sensor output | 0 to +10 V |
| ball joint rotation angle | ±10° |
| temperature environment | −25 °C to +40 °C |
Table 3.
Functional test result for the curvature sensor.
Table 3.
Functional test result for the curvature sensor.
| Radius (m) | Curvature (1/km) | Stroke (mm) | Test Result (m) | Error (%) |
|---|
| 75 | 13.33 | 96.6 | 74.92 | 0.10 |
| 100 | 10.00 | 72.5 | 99.86 | 0.14 |
| 200 | 5.00 | 36.2 | 200.55 | −0.28 |
| 300 | 3.33 | 24.2 | 298.76 | 0.41 |
| 400 | 2.50 | 18.1 | 402.22 | −0.56 |
| 500 | 2.00 | 14.5 | 503.47 | −0.69 |
| 600 | 1.67 | 12.1 | 595.07 | 0.82 |
| 700 | 1.43 | 10.4 | 693.30 | 0.96 |
| 800 | 1.25 | 9.1 | 808.93 | −1.12 |
| 900 | 1.11 | 8.1 | 911.32 | −1.26 |
| 1000 | 1.00 | 7.2 | 986.39 | 1.36 |
Table 4.
Curvature measurement results.
Table 4.
Curvature measurement results.
| Curve | Curvature (1/km) | Deviation (%) |
|---|
Track
Data | Test-1 | Test-2 | Test-3 | Test-4 | Test-1 | Test-2 | Test-3 | Test-4 |
|---|
| C1 | 1.33 | 1.29 | 1.37 | 1.39 | 1.39 | 3.2 | 3.0 | 4.0 | 4.1 |
| C2 | 1.11 | 1.15 | 1.16 | 1.15 | 1.14 | 3.2 | 3.9 | 3.4 | 2.7 |
| C3 | −3.08 | −3.15 | −3.15 | −3.15 | −3.06 | 2.1 | 2.1 | 2.0 | 0.9 |
| C4 | −1.14 | −1.18 | −1.18 | −1.18 | −1.17 | 3.2 | 3.4 | 3.5 | 2.2 |
| C5 | 3.71 | 3.65 | 3.67 | 3.65 | 3.75 | 1.5 | 1.2 | 1.7 | 1.0 |
| C6 | 1.52 | 1.53 | 1.58 | 1.55 | 1.55 | 2.8 | 3.8 | 2.0 | 1.9 |
| min. | 0.8 | 0.9 |
| max. | 4.0 | 4.1 |
| average | 2.8 | 2.1 |
| Publisher’s Note: MDPI stays neutral with regard to jurisdictional claims in published maps and institutional affiliations. |
© 2022 by the authors. Licensee MDPI, Basel, Switzerland. This article is an open access article distributed under the terms and conditions of the Creative Commons Attribution (CC BY) license (https://creativecommons.org/licenses/by/4.0/).


