Article

Digital Droplet-PCR for Quantification of Viable Campylobacter jejuni and Campylobacter coli in Chicken Meat Rinses

1
Bavarian Health and Food Safety Authority (LGL), 85764 Oberschleissheim, Germany
2
QuoData GmbH, Quality & Statistics, 01309 Dresden, Germany
*
Author to whom correspondence should be addressed.
These authors contributed equally to this work.
Appl. Sci. 2022, 12(11), 5315; https://doi.org/10.3390/app12115315
Submission received: 19 April 2022 / Revised: 12 May 2022 / Accepted: 17 May 2022 / Published: 24 May 2022
(This article belongs to the Special Issue New Challenges in Improving the Quality and Safety of Meat Products)

Abstract

:

Featured Application

Droplet digital PCR (ddPCR) in combination with propidium monoazide (PMA) treatment provides a method that is accurate, efficient, and reliable and that can be easily and quickly applied in routine use to quantify Campylobacter jejuni and coli in chicken meat rinses from slaughterhouse and retail.

Abstract

The EU commission established Regulation (2017/1495) in 2017 to reduce Campylobacter on chicken skin and to decrease the number of human cases of campylobacteriosis attributable to the consumption of poultry meat. A Process Hygiene Criterion based on colony-forming unit data was set to a maximum of 1000 CFU Campylobacter spp. per gram chicken neck skin at slaughterhouses. Confronted with stressors, including cold, oxidative stress or antibiotic treatment, live cells may enter into a viable but non-cultivable state (VBNC) and lose the ability to grow, in reference to the plate count ISO 10272-2:2017 method, but still possess the potential to recover and cause infections under favorable conditions. In this study, a droplet digital PCR combined with the intercalating dye propidium monoazide (PMA) was established for quantification of C. coli and C. jejuni in chicken meat rinses. The PMA was used to inactivate DNA from dead cells in this technique. This method was successfully validated against the reference method according to ISO 16140-2:2016 for accuracy and relative trueness. Additionally, it presented a 100% selectivity for Campylobacter jejuni and C. coli. Moreover, the technical measurement uncertainty was determined according to ISO 19036:2019, and the applicability of ddPCR for quantifying C. coli and C. jejuni in chicken meat rinses was investigated on naturally contaminated samples from slaughterhouses and supermarkets. Results obtained from this study demonstrated a strong correlation to qPCR as well as the classical microbiological reference method.

1. Introduction

Human campylobacteriosis is the most reported foodborne illness in the European Union (EU) since 2005, which is commonly attributed to broiler meat contamination [1]. In 2018, campylobacteriosis was the most commonly reported zoonosis, per se representing almost 70% of all the reported cases [2]. Regarding foodborne diseases, campylobacteriosis has shown the highest hospitalization rate in the years between 2015 and 2019, with a stable count of approximately 20,000 cases per year [3]. C. jejuni, followed by C. coli are the predominant thermophilic Campylobacter species in poultry samples, which are mainly responsible for foodborne human infections [4,5]. A Process Hygiene Criterion (PHC) of a maximum of 1000 Colony Forming Units (CFU) thermophilic Campylobacter per gram of chicken skin came into effect in January 2018 (Commission Regulation (EU) 2017/1495 [6]), to reduce significantly the Campylobacter contamination of poultry at slaughterhouses. According to the estimation of EFSA [3], more than 50% of the public health risk due to Campylobacter could be reduced if none of the carcasses would exceed this PHC. The reference colony-enumeration method [7] for the quantification of Campylobacter is time-consuming, laborious, and it can underestimate viable and potentially infectious cells. Environmental conditions such as cold, oxidative stress [8,9], as well as antibiotic treatments [10,11] have been reported to completely stop the growth of Campylobacter on agar plates. This may be due to the fact that cells enter into a viable but non-cultivable state (VBNC) [12]. The VBNC state is a survival strategy for bacteria in order to overcome the above mentioned stressful external conditions [13]. Under favorable conditions, VBNC cells can revive and recover full infectious ability [14,15]. Both cultivable and VBNC cells represent a significant threat to public health. While cultivable Campylobacter can be quantified by plate counting, VBNC remains undetected, making the reference method unsuitable for a proper risk assessment for Campylobacter spp. in broiler meat. Molecular-based technology, like quantitative real-time PCR (qPCR) and digital PCR (dPCR) can overcome this limitation by detecting and quantifying Campylobacter DNA of VBNC cells. Furthermore, a sample treatment prior to DNA extraction analysis with DNA-intercalating dyes like propidium monoazide (PMA) enables differentiation between viable and dead cells via PCR. PMA passes through membrane-compromised dead cells, intercalates into cytoplasmic DNA, upon light exposure crosslinks to DNA, and inactivates it for PCR amplification [9,16,17]. Therefore, only intact and putatively infectious units (IPIU) comprising CFU and VBNC Campylobacter cells generate a signal in qPCR. A viability PMA-qPCR (v-qPCR) has been recently published [18] and it integrates a dead-cell standard to compensate for the variable residual PCR signal of dead cells [19,20]. As [21] reported in 2019, v-qPCR allows an efficient and a reliable quantification of viable thermophile Campylobacter.
Digital PCR (dPCR), as the third generation of PCR technology has been proven to offer a new approach for its absolute quantification of copies of target molecules [22,23]. It offers an alternative to qPCR to obtain precise quantification of nucleic acids without a standard curve, and it is not dependent on the number of amplification cycles to determine the initial amount of nucleic acids in the sample [24,25]. Chamber-based dPCR (cdPCR) and droplet-based dPCR (ddPCR) are presently two basic approaches for conducting dPCR. In ddPCR, the compartmentalization of the reaction mix is achieved by using plastic-consumables (generator cartridges) with ultra-thin capillaries (microfluidics) in order to prepare a water-in-oil emulsion prior to the PCR; heat stable droplets are formed [26]. Microfluidics, i.e., miniaturization of fluid-handling, has enabled the massively-parallel sample partitioning and the advent of dPCR platforms [27]. In ddPCR, the sample is partitioned into approximately 20,000 droplets before the PCR cycles, subsequently, each droplet consists of ideally single (or few) copies of the target molecules and some others contain no copy of target molecules [28]. The absolute number of target nucleic acid molecules contained in the original sample before partitioning can be calculated from the ratio of positive events to total partitions, using binomial Poisson statistics [24]. Partitioning the sample into droplets before PCR holds the potential to overcome the inhibitory effects present in the sample matrix [28]. Finally, ddPCR enables the detection and the quantification of even low copy numbers due to the independent end-point PCR reaction occurring on every droplet from the sample [29].
In the current study, the combination of the sample pre-treatment with PMA dye was explored prior to DNA extraction and quantification of viable C. jejuni and C. coli in a viability ddPCR (v-ddPCR). The v-ddPCR method was optimized successfully in-house, validated according to ISO 16140-2:2016 [30], and evaluated on naturally contaminated chicken samples. The results showed a significant correlation between the v-ddPCR, the reference microbiological ISO [7], and the recently published v-qPCR methods [18]. Furthermore, the technical measurement uncertainty was assessed based on ISO 19036:2019 [31], using QuoData statistical analysis. Finally, v-ddPCR may be used as an additional technique for rapid and easy monitoring in routine applications.

2. Materials and Methods

2.1. Strains and Growth Conditions

C. jejuni NCTC 11168 (National Collection of Type Cultures, Salisbury, UK) and C. coli ATCC 43478 (American Type Culture Collection) were used as reference strains for method validation concerning LOD95%, precision, and LOQ.
For the inclusivity study, C. jejuni and C. coli isolates were collected from Bavarian slaughterhouses and supermarket samples, which were considered for routine analysis at the LGL (Bavarian Health and Food Safety Authority). In the scope of cooperation projects, additional isolates were provided to the LGL by BfR (German Federal Institute for Risk Assessment). The identity of all isolates was verified at the species level prior to DNA extraction using a MALDI Biotyper (Bruker Daltonics, Bremen, Germany) according to the study from Huber et al. [32]. Moreover, all isolates were sequenced using a next-generation sequencing platform at LGL (data not shown). All Campylobacter isolates or strains were cultivated on Tryptone Soy Agar with Sheep Blood (Thermo Fisher Scientific Inc., Waltham, MA, USA) and then incubated for 44 h ± 4 h at 42 °C under microaerobic conditions. The cultivation of non-C. jejuni and non-C. coli strains were carried out according to the growth conditions specified by the culture collections DSMZ (German Collection of Microorganisms and Cell Cultures) and ATCC (American Type Culture Collection) or according to BfR recommendations.
The IDs of the individual isolates and strains used for inclusivity and exclusivity determinations are listed in Supplementary Materials List S1.

2.2. Live and Dead Cell Standards

Live and dead cell standards consist of live or dead Campylobacter cells (C. coli or C. jejuni) in a specific concentration, and they were used to spike the samples. These cell standards were essential for the in-house validation (accuracy, trueness, and measurement uncertainty). Three standards that were provided by BfR were: C. jejuni live-cell standard (NCTC 11168, 4.6 × 10⁶ CFU/mL), C. jejuni dead-cell standard (DSM 4688, 1 × 10⁹ bacterial counts/mL), and C. coli live-cell standard (WDCM 00004, 7 × 10⁵ CFU/mL). The C. coli dead cell standard (ATCC 43478, 1 × 10⁹ bacterial counts/mL) was prepared at LGL according to the BfR protocol [33]. Live- and dead-cell standards were stored at −80 °C, thawed at room temperature for 15 min, and kept on ice for 30 min prior to the artificial spiking.

2.3. Raw Meat Samples and Rinses

For each sample, 10 g of raw meat were collected randomly and weighed in a BagPage + filter bag with a pore size of 280 µm (Interscience Lab Inc., Woburn, MA, USA). The 10 g samples were diluted (1:10) in 1% buffered peptone water (Merck KGaA, Darmstadt, Germany). An additional 10 g sample was weighed and diluted (1:2) in buffered peptone water. After homogenization in a stomacher for 2 min, the meat rinse was carefully transferred to a 50 mL falcon tube. Two kinds of rinses were prepared:
(A)
Campylobacter-free rinses were spiked with live and dead cell standards, and they were used for method comparison study (accuracy and relative trueness), as well as technical measurement uncertainty study. The absence of live and dead Campylobacter cells was confirmed previously in-house based on the three methods described in Section 2.7, Section 2.8 and Section 2.10. Each of the spiked meat rinses was divided into three aliquots, 1 mL for ddPCR with PMA, 1 mL for ddPCR without PMA, and 1 mL for the microbial reference method. The v-ddPCR results were compared to the results of the reference method [7];
(B)
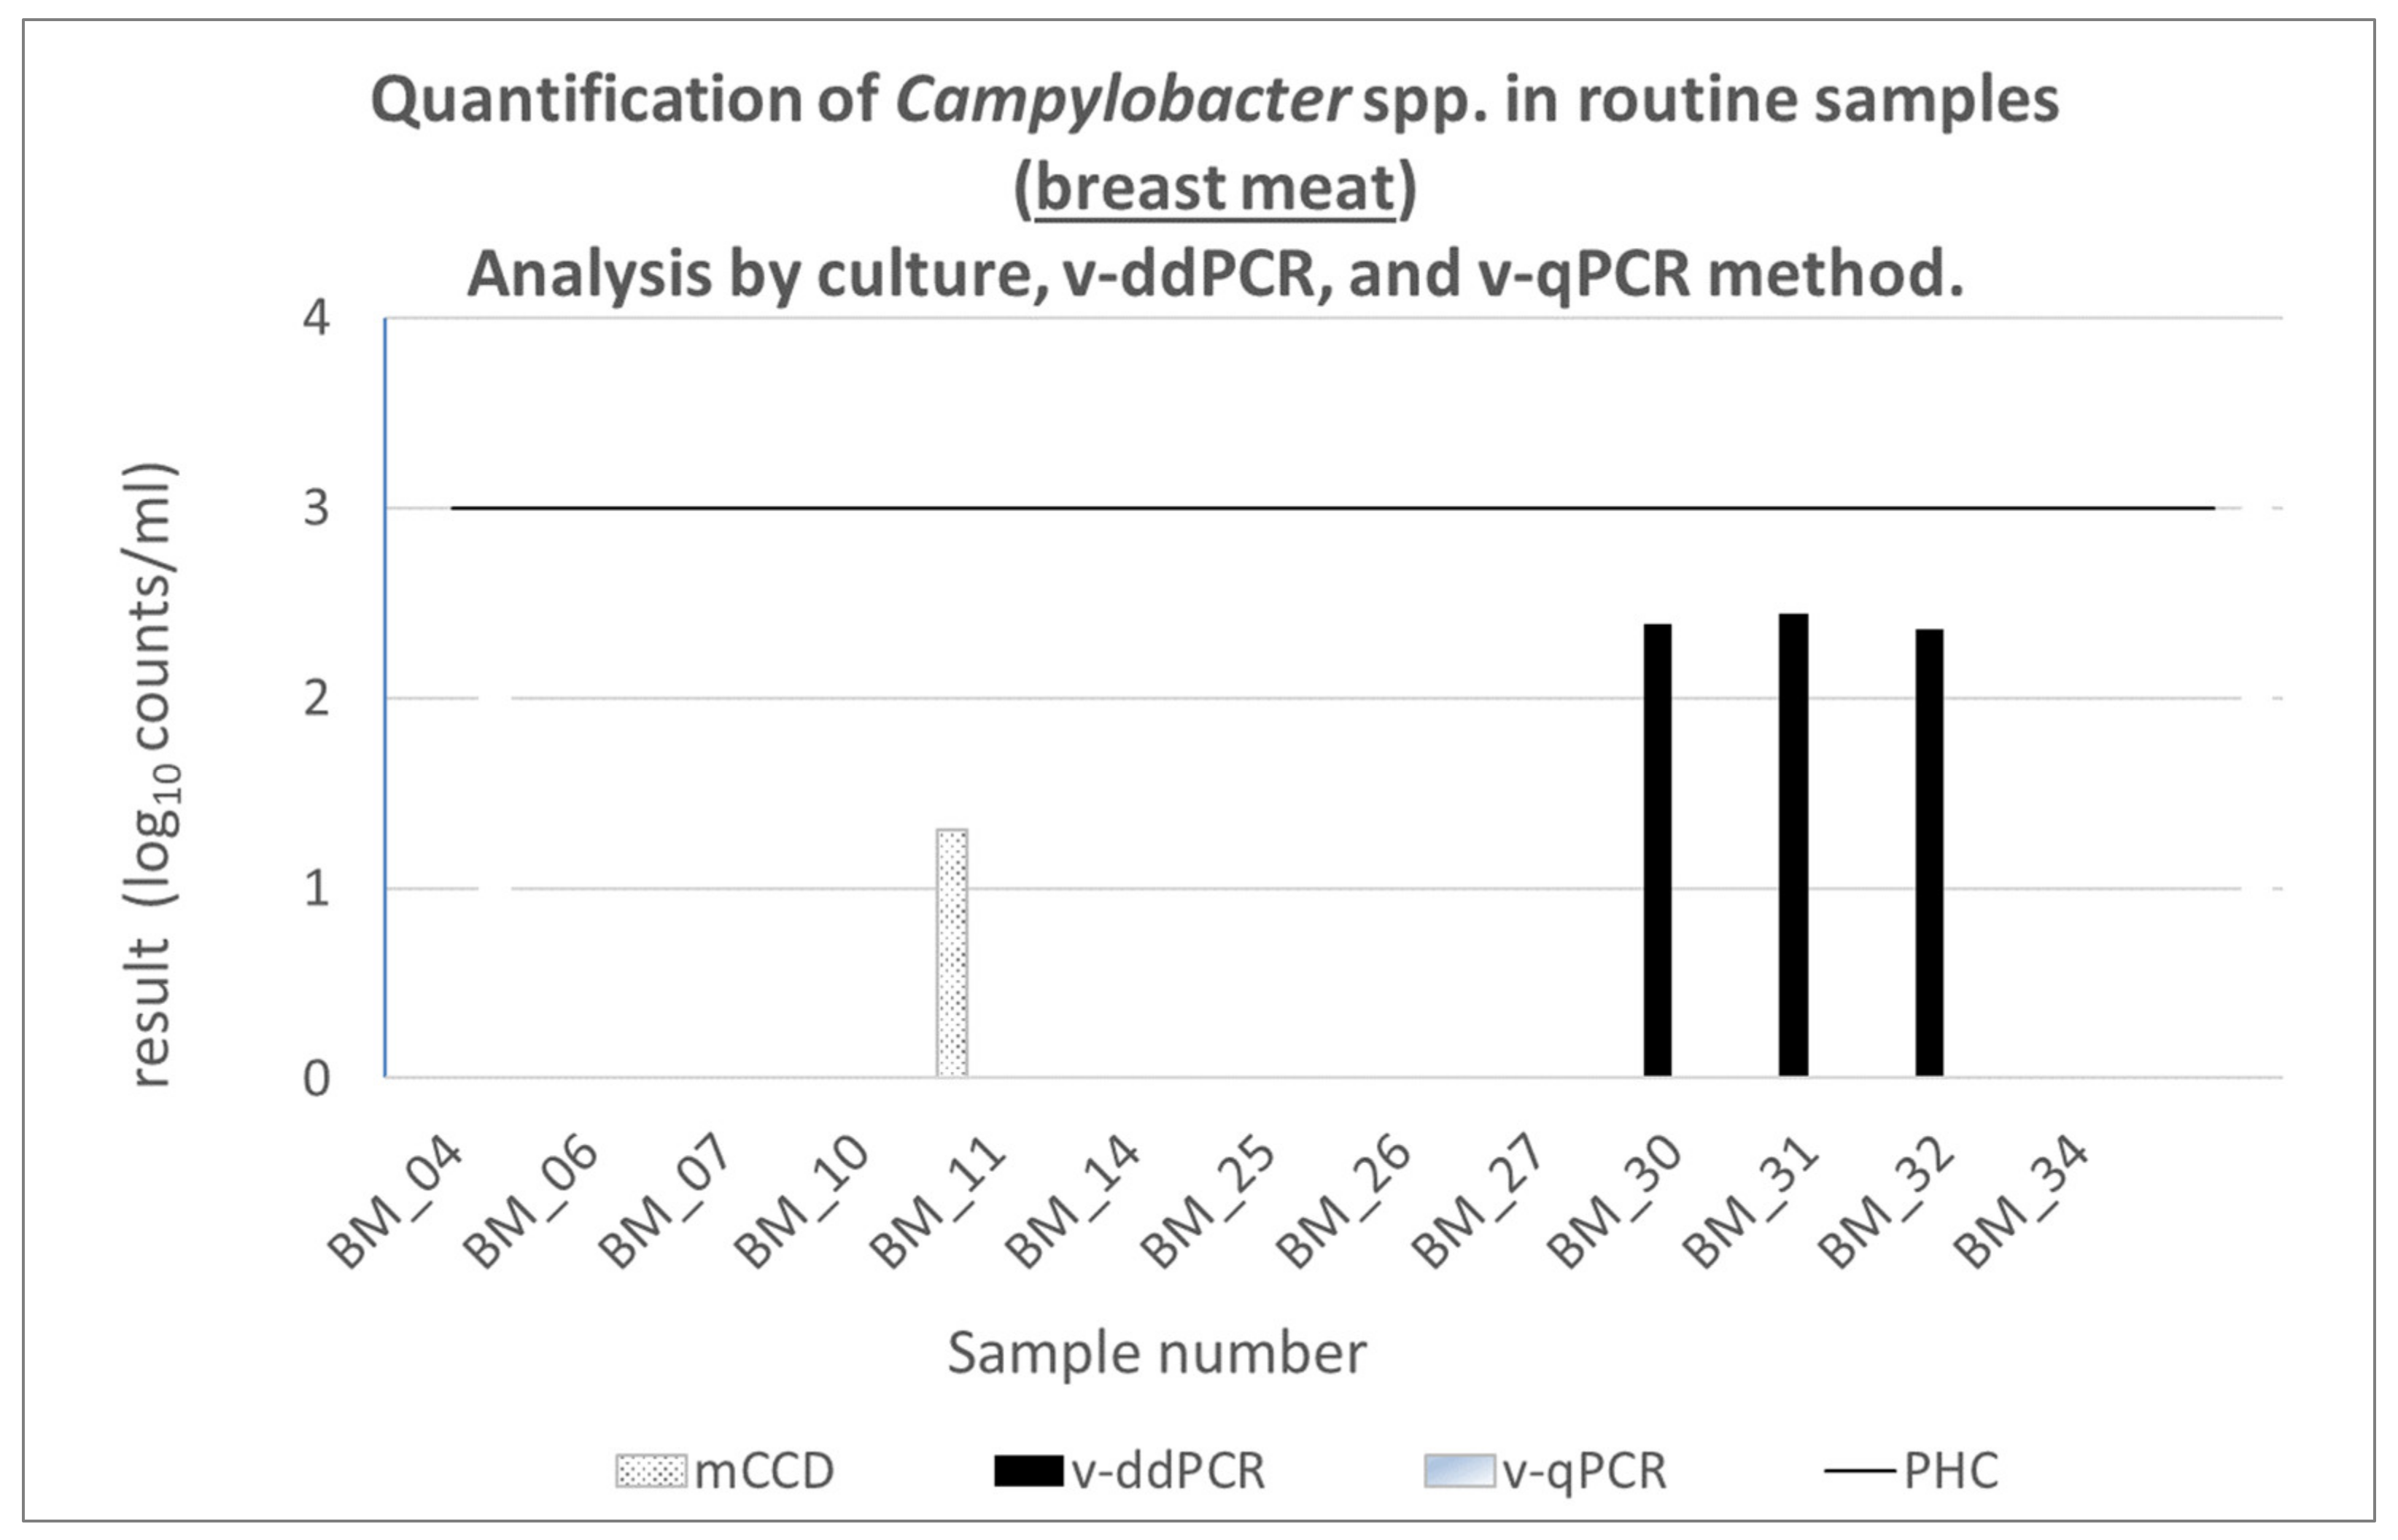
Rinses prepared with naturally contaminated routine samples from LGL (2020) and retail samples (2019 to 2021) were used to investigate the applicability of v-ddPCR for quantifying Campylobacter in chicken rinses. The LGL routine samples consist of 19 chicken neck skin (NS) from Bavarian slaughterhouses and 13 chicken breast meat (BM, within the scope of zoonosis monitoring) from Bavarian retail. Additionally, 25 chicken meat retail samples (RS) like chicken neck skin, chicken breast meat, chicken thighs, chicken wings, and chicken drumstick were bought in supermarkets between October 2019 and March 2021 in the region of Munich. Five 1 mL aliquots were needed for each rinse: 1 mL was used for the quantification of Campylobacter with the microbiological reference assay, two times 1 mL for qPCR (with and without PMA treatment), and two times 1 mL for ddPCR (with and without PMA treatment). The v-ddPCR results were compared to the results of the reference method [7] and the v-qPCR [18].
All meat rinse IDs are listed in Supplementary Materials List S2.

2.4. DNA Extraction

DNA from Campylobacter isolates and meat rinses was extracted using the GeneJET Genomic DNA Purification Kit (Thermo Fisher Scientific Inc., Waltham, MA, USA) according to the manufacturer’s protocol. Finally, DNA was eluted in 75 µL elution buffer for ddPCR and 100 µL elution buffer for the qPCR assay, respectively. Alternatively, a PureLink Genomic DNA Mini Kit (Thermo Fisher Scientific Inc.) or a High Pure PCR Template Kit (Merck KGaA, Darmstadt, Germany) were applied according to the manufacturer’s instructions for the extraction of DNA from non-Campylobacter strains in the context of exclusivity determination.

2.5. DNA Quantification

DNA from pure bacterial cultures that was used for the exclusivity and the inclusivity studies was quantified using a Qubit Fluorometer and the Qubit dsDNA BR Assay Kit (Thermo Fisher Scientific Inc.) according to the manufacturer’s instructions. The DNA concentration was adjusted to the concentration of 10 pg/µL for ddPCR analysis by using sonicated salmon sperm DNA (10 ng/µL) (Thermo Fisher Scientific Inc.).

2.6. Oligonucleotides for ddPCR and qPCR

The duplex v-ddPCR method, including two detection systems in the FAM channel based on specific single-copy genes for C. jejuni and C. coli, was combined with an internal amplification control (IAC) in the HEX channel. The species-specific target genes were selected based on the studies of He et al. [34] for hipO (C. jejuni) and LaGier et al. [35] for glyA (C. coli). The ntb2 gene fragment from Nicotiana tabacum (Anderson et al. [36]) was integrated as IAC. Primers and probes for ddPCR are characterized in Table 1.
The published triplex v-qPCR method [18], which is combining the 16S rRNA-based quantification of thermophilic Campylobacter with an Internal Standard Process Control (ISPC), as well as an IAC, was compared to our v-ddPCR.

2.7. Optimization of ddPCR

Absolute quantification using ddPCR was done using QX100TM Droplet Digital PCR System (Bio-Rad Laboratories, Hercules, CA, USA). The multiplex ddPCR validated here consisted of two detection systems in the FAM channel for C. jejuni and C. coli, and the ntb2 assay as an inhibition control in the HEX channel. The ddPCR reaction mix consisted of 1× ddPCR Supermix for Probes (with dUTP) (Bio-Rad Laboratories).
The primer and the probe concentrations were optimized to achieve an optimal fluorescence signal for all three primer–probe systems. The primer–probe systems met the quality criteria of the MIQE guidelines [37] with 100% efficiency and a coefficient of determination of r2 ≥ 0.98 (data not shown). Final concentrations of primers (TIB MOLBIOL, Berlin, Germany) and probes (IDT, Coralville, IA, USA) are outlined in Table 1. As an internal amplification control, 50 copies of ntb2 target were added. The reaction mix was filled with PCR-grade water to 15 µL. A 5 µL sample DNA was added and mixed thoroughly.
For droplet generation, the whole reaction volume (20 µL), as well as 70 µL droplet generation oil were transferred into a DG8TM droplet generator cartridge (Bio-Rad Laboratories) according to the manufacturer’s instructions. Droplets were produced using a QX100TM Droplet Generator (Bio-Rad Laboratories). A total of 40 µL of the generated droplets (Water-oil emulsion) were subsequently transferred into a 96-well plate, closed with a pierceable foil heat seal (Bio-Rad Laboratories), and sealed using a PX1TM plate sealer (Bio-Rad Laboratories) at 180 °C for 5 s. An endpoint PCR was performed on a T1000 Touch Thermal Cycler (Bio-Rad Laboratories), using the following cycling protocol: enzyme activation at 95 °C for 10 min, followed by 45 cycles of 94 °C for 30 s and 56 °C for 1 min, followed by a droplet stabilization step at 98 °C for 10 min and a final hold step at 4 °C. The optimal annealing temperature of 56 °C was determined by a gradient PCR experiment in which an annealing temperature gradient between 55 °C and 60 °C was applied.
Droplet measurement was performed on a QX100TM Droplet Reader (Bio-Rad Laboratories). The QuantaSoftTM Software Version 1.7.4.0917 (Bio-Rad Laboratories) was used for data analysis.

2.8. qPCR

The qPCR method using the 16S rRNA gene for quantification of living thermophilic Campylobacter spp., including C. sputorum as ISPC and ntb2 gene as IAC as well as the data analysis, was performed according to Stingl et al. [18].

2.9. Live/Dead Differentiation of Campylobacter in Meat Rinse Samples

For live/dead differentiation of Campylobacter using ddPCR or qPCR, meat rinses were divided into two aliquots, each with a volume of 1 mL. One of these aliquots was treated with PMA dye (Biotium, Fremont, CA, USA) at a final concentration of 50 µM. This aliquot was incubated for 15 min at 700 rpm at 30 °C in the dark by covering the incubator with aluminum foil. Subsequently, it was transferred to phAST Blue equipment (genIUL instruments, Terrassa, Spain) for 15 min light exposure. This procedure was performed to cross-link PMA to DNA in dead bacteria at room temperature. Following that, both the PMA treated and the untreated aliquots were centrifuged at 16.000× g for 5 min at 4 °C. The supernatant was discarded and the cell pellet was either directly subjected to DNA extraction or frozen at −20 °C until DNA extraction.
The total amount of Campylobacter, including live- and dead-cells, was determined from the aliquot without PMA treatment, and it served as control for the PMA efficiency in reducing the dead cell signal. Only the results from PMA treatment were directly comparable to the results from the classical microbiological method. This enabled the quantification of the number of viable Campylobacter cells. For every sample, the dilution with the highest viable Campylobacter count was considered as the final result, considering different factors, including initial dilution of the sample in peptone water, elution volume for DNA extraction, total reaction volume, and the DNA volume used in ddPCR. All results were converted into log10. Campylobacter positive results were interpreted in two different categories: above the limit of PHC (log10 3.0 live counts/mL) and below the limit of PHC.

2.10. Microbiological Reference Method

The classical microbiological method was carried out according to ISO 10272-2:2017 [7]. A 1 mL meat rinse was spread onto 3 mCCD agar plates (modified Charcoal-Cefoperazone-Deoxycholate Agar) (Merck KGaA, Darmstadt, Germany), and incubated at 42 °C for 44 h ± 4 h under microaerobic conditions. All typical Campylobacter colonies were counted and MALDI Biotyper (Bruker Daltonics, Bremen, Germany) was used according to Huber et al. [32] to identify and to exclude doubtful colonies.

2.11. Determination of LOD95%

To determine the lowest copy number, still detectable with a 95% confidence interval (LOD95%) in the duplex v-ddPCR method, two distinct serial dilutions of the target DNA from C. jejuni and C. coli were prepared at 6 low copy number levels (4, 2, 1, 0.4, 0.2 and 0.02 copies/μL). Sonicated salmon sperm DNA solution (10 ng/µL) (Thermo Fisher Scientific Inc.) was used for dilution of both species to maintain the stability of genomic DNA. Each dilution level was measured using a duplex v-ddPCR in 12 independent technical replicates. The probability of detection (POD curve) and LOD95% was computed via a web service provided by QuoData (QuoData Web Service [38]) according to BVL guidelines [39].

2.12. Precision—Relative Repeatability Standard Deviation (RSDr)

The relative standard deviation of repeatability (RSDr) was calculated over the whole dynamic range of the v-ddPCR assay and under repeatability conditions, according to the JRC Technical Report [40]. A total of 5 technical replicates of the target DNA of C. jejuni and C. coli were measured at 4 different concentrations (5, 50, 500, and 2000 cp/µL) over 5 days. The Excel statistical technique One-way ANOVA (Analysis of Variance, Single-factor) was used to calculate the RSDr for each dataset of 25 test results. These analyses estimate the significant differences between group means.

2.13. Determination of LOQ

The limit of quantification (LOQ) is the lowest copy number concentration in a sample that can be reliably quantified with an uncertainty considered acceptable for the intended use of the method (JRC Technical Report [40]). The LOQ was assessed by applying a linear model to RSDr results (refer to Section 2.12).

2.14. Selectivity

The hipO and glyA primer sets were evaluated with pure cultures of reference strains and well-characterized isolates (refer to Section 2.1) for their exclusivity and inclusivity. As stated in Section 6.1.5 of ISO 16140-2:2016 [30], at least 50 pure target strains and 30 pure non-target strains should be included in the testing procedure. In our study, all DNA concentrations were adjusted to 10 pg/µL. Inclusivity testing was performed on the DNA isolates of 50 C. jejuni and 41 C. coli in a duplex v-ddPCR. For exclusivity testing, 31 non-target DNAs, consisting of 5 reference strains from the family Campylobacteraceae (2 C. upsaliensis, 1 C. lari, 1 C. lari concheus, and 1 C. perloridis), and 26 reference strains from the non-Campylobacteraceae family were tested in a duplex v-ddPCR.

2.15. Method Comparison Study According to ISO 16140-2:2016

The accuracy and relative trueness studies were performed independently for C. jejuni and C. coli according to ISO 16140-2:2016 [30] by comparing the ddPCR against the microbiological reference method.
Live and dead cell standards of C. jejuni and C. coli (refer to Section 2.2) were spiked to 3 mL Campylobacter free meat rinse (refer to Section 2.3). Following a ddPCR data analysis, statistical calculations were performed according to the principles explained in ISO 16140-2:2016 [30], Section 6.1.2. for the relative trueness and Section 6.1.3. for the accuracy.

2.15.1. Accuracy

To cover the whole range of contamination, six chicken neck skin rinses were artificially spiked with C. jejuni or C. coli live/dead cell standards at three different levels (low A1, A2; medium A3, A4; and high A5, A6, see Table 2). For all six samples of C. jejuni and C. coli, five biological replicates (e.g., for low-level A1–1, A1–2, A1–3, A1–4, and A1–5) were prepared and analyzed in a duplex v-ddPCR against the classical microbiological method.

2.15.2. Relative Trueness

To monitor the robustness against matrix variation, the trueness study was conducted on three different raw meat matrices, including chicken neck skin from the slaughterhouse, chicken breast, and turkey skin from retail shops. For this purpose, all three meat matrices containing low organic matrix (LM) were artificially spiked with five levels of C. jejuni and C. coli live/dead cell standards (T1-LM to T5-LM). Furthermore, all three meat items containing a medium organic matrix (MM) were artificially spiked with two bacterial levels (T2-MM and T5-MM) for comparison between two different matrix effects (Table 3). All samples were tested in a ddPCR against the classical microbiological method.

2.16. Technical Measurement Uncertainty

The technical measurement uncertainty for the ddPCR method was determined according to the global approach (top-down approach) described in ISO 19036:2019 [31]. In order to ensure an efficient and a reliable estimation of in-house reproducibility, a factorial design was implemented. Seven factors were chosen to represent the range of conditions during routine testing (Table 4). In this design, measurements were performed in eight different runs, with each run corresponding to a combination of factor levels. Depending on the spiking level of the chicken neck skin with C. jejuni or C. coli live/dead cell standards, a total of five artificially contaminated samples (TU1 to TU5, Table 5) were analyzed for every run.
The low bacterial contamination samples (TU1 and TU2) were analyzed in three biological replicates for each of eight runs: 26 mL of chicken neck skin rinse were spiked (24 mL for ddPCR with PMA and 2 mL for the reference method). The medium (TU3) and high bacterial contamination (TU4 and TU5) were analyzed in two biological replicates for each of eight runs: 18 mL of chicken neck skin rinse were spiked (16 mL for ddPCR with PMA and 2 mL for the reference method). For the reference method, two biological replicates were analyzed immediately after spiking.

3. Results

3.1. Determination of LOD95%

The LOD95% was determined with 0.837 cp/µL with a 95% confidence interval of [0.535, 1.309] for C. jejuni and 1.140 cp/µL and with a 95% confidence interval of [0.540, 2.000] for C. coli, which corresponds to 4.2 cp/reaction (0.6 log10 cp/reaction) for C. jejuni and 5.7 cp/reaction (0.8 log10 cp/reaction) chicken rinse for C. coli.

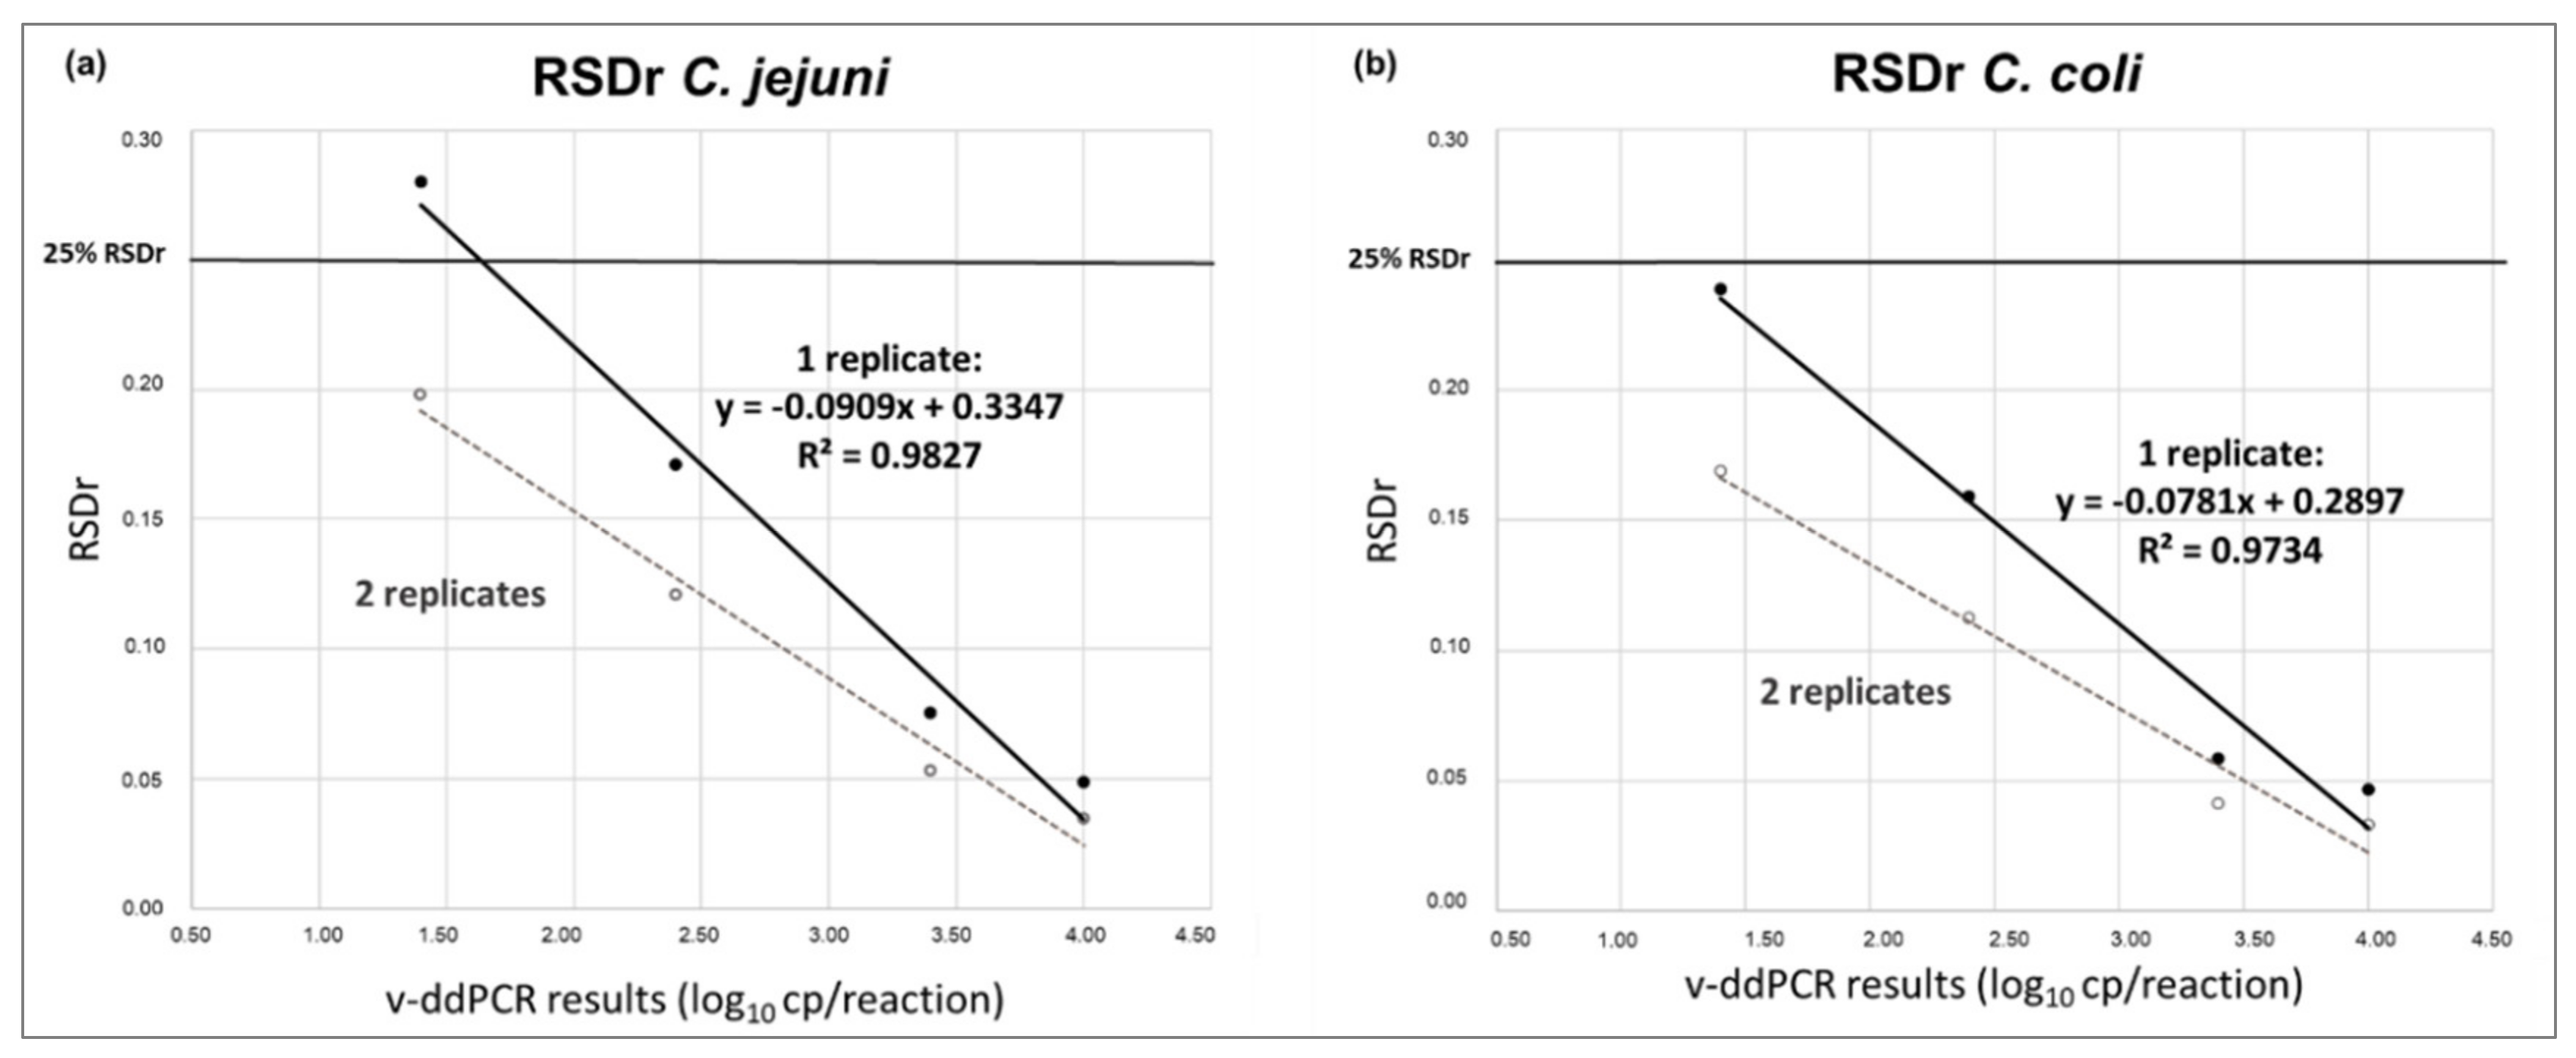
3.2. Precision and RSDr

The calculated RSDr decreased by increasing the copy number concentration and amounts to 28.1%, 17.1%, 7.5%, 4.9% (C. jejuni) and to 23.9%, 15.9%, 5.9%, 4.7% (C. coli) for 5, 50, 500, 2000 cp/µL, respectively. The RDSr values of each dataset were plotted against the copy number concentrations (log10) measured in a v-ddPCR. Figure 1a,b (solid-filled line, for one technical replicate) demonstrated a linear correlation y = ax + b with a coefficient of determination R2 between 0.97 and 0.98. This linear regression model fits well with the observed data over the measured range of the v-ddPCR assay for both species.

3.3. Determination of LOQ

The linear regression (Figure 1a,b, solid-filled line for one replicate) was used to determine the LOQ at an RSDr of 25%. The LOQ value equals to 42 cp/reaction (1.6 log10 cp/reaction) for C. jejuni and 16 cp/reaction (1.2 log10 cp/reaction) for C. coli at RSDr of 25%. The addition of a second replicate in the ddPCR analysis reduced the RSDr, allowing a better detection of PHC (Figure 1a,b, dashed line).

3.4. Inclusivity and Exclusivity Study

All 50 C. jejuni and 41 C. coli DNAs were quantified between 3800 and 15,000 copies/µL, while no signal—except in IAC—was detected for the 31 non-target DNAs. Thus, the inclusivity and the exclusivity for hipO and glyA primer sets in duplex v-ddPCR successfully passed with 100%.

3.5. Method Comparison Study According to ISO 16140-2:2016

Accuracy and relative trueness studies were conducted on raw meat matrices, artificially spiked with different live and dead Campylobacter levels (1:10 ratio) and tested in duplex v-ddPCR with and without prior PMA treatment. The design used for the comparison studies and the subsequent evaluation was performed according to ISO 16140-2:2016(E) [30].

3.5.1. Accuracy Profile Study

Based on the central values (medians) of the ISO reference method X i , and the v-ddPCR alternative method Y i , the deviation of the alternative method from the reference method (absolute bias B i ) was calculated for all samples. No systematic bias was observed for C. coli samples, only a slight bias was noticed for C. jejuni samples, especially for A2 (+0.20 log10 counts/mL) and A3 (+0.27 log10 counts/mL). Additionally, the standard deviation of the alternative method s a l t was determined across all samples (0.083 log10 counts/mL for C. jejuni and 0.112 log10 counts/mL for C. coli). The standard deviation of the reference method s r e f equals to 0.068 log10 counts/mL. Taking into account the number of biological replicates ( n = 5), the upper and the lower β-expectation tolerance interval β-ETI ( U i and L i ) were calculated for each sample, and they lie within the acceptability limits ( A L and + A L ) of ± 0.50 log10 counts/mL. All relevant statistical results are provided in Table 6 and Table 7. In accordance with ISO 16140-2:2016(E) [30], the alternative method is accepted as being equivalent to the reference method regarding the used raw chicken neck skin.

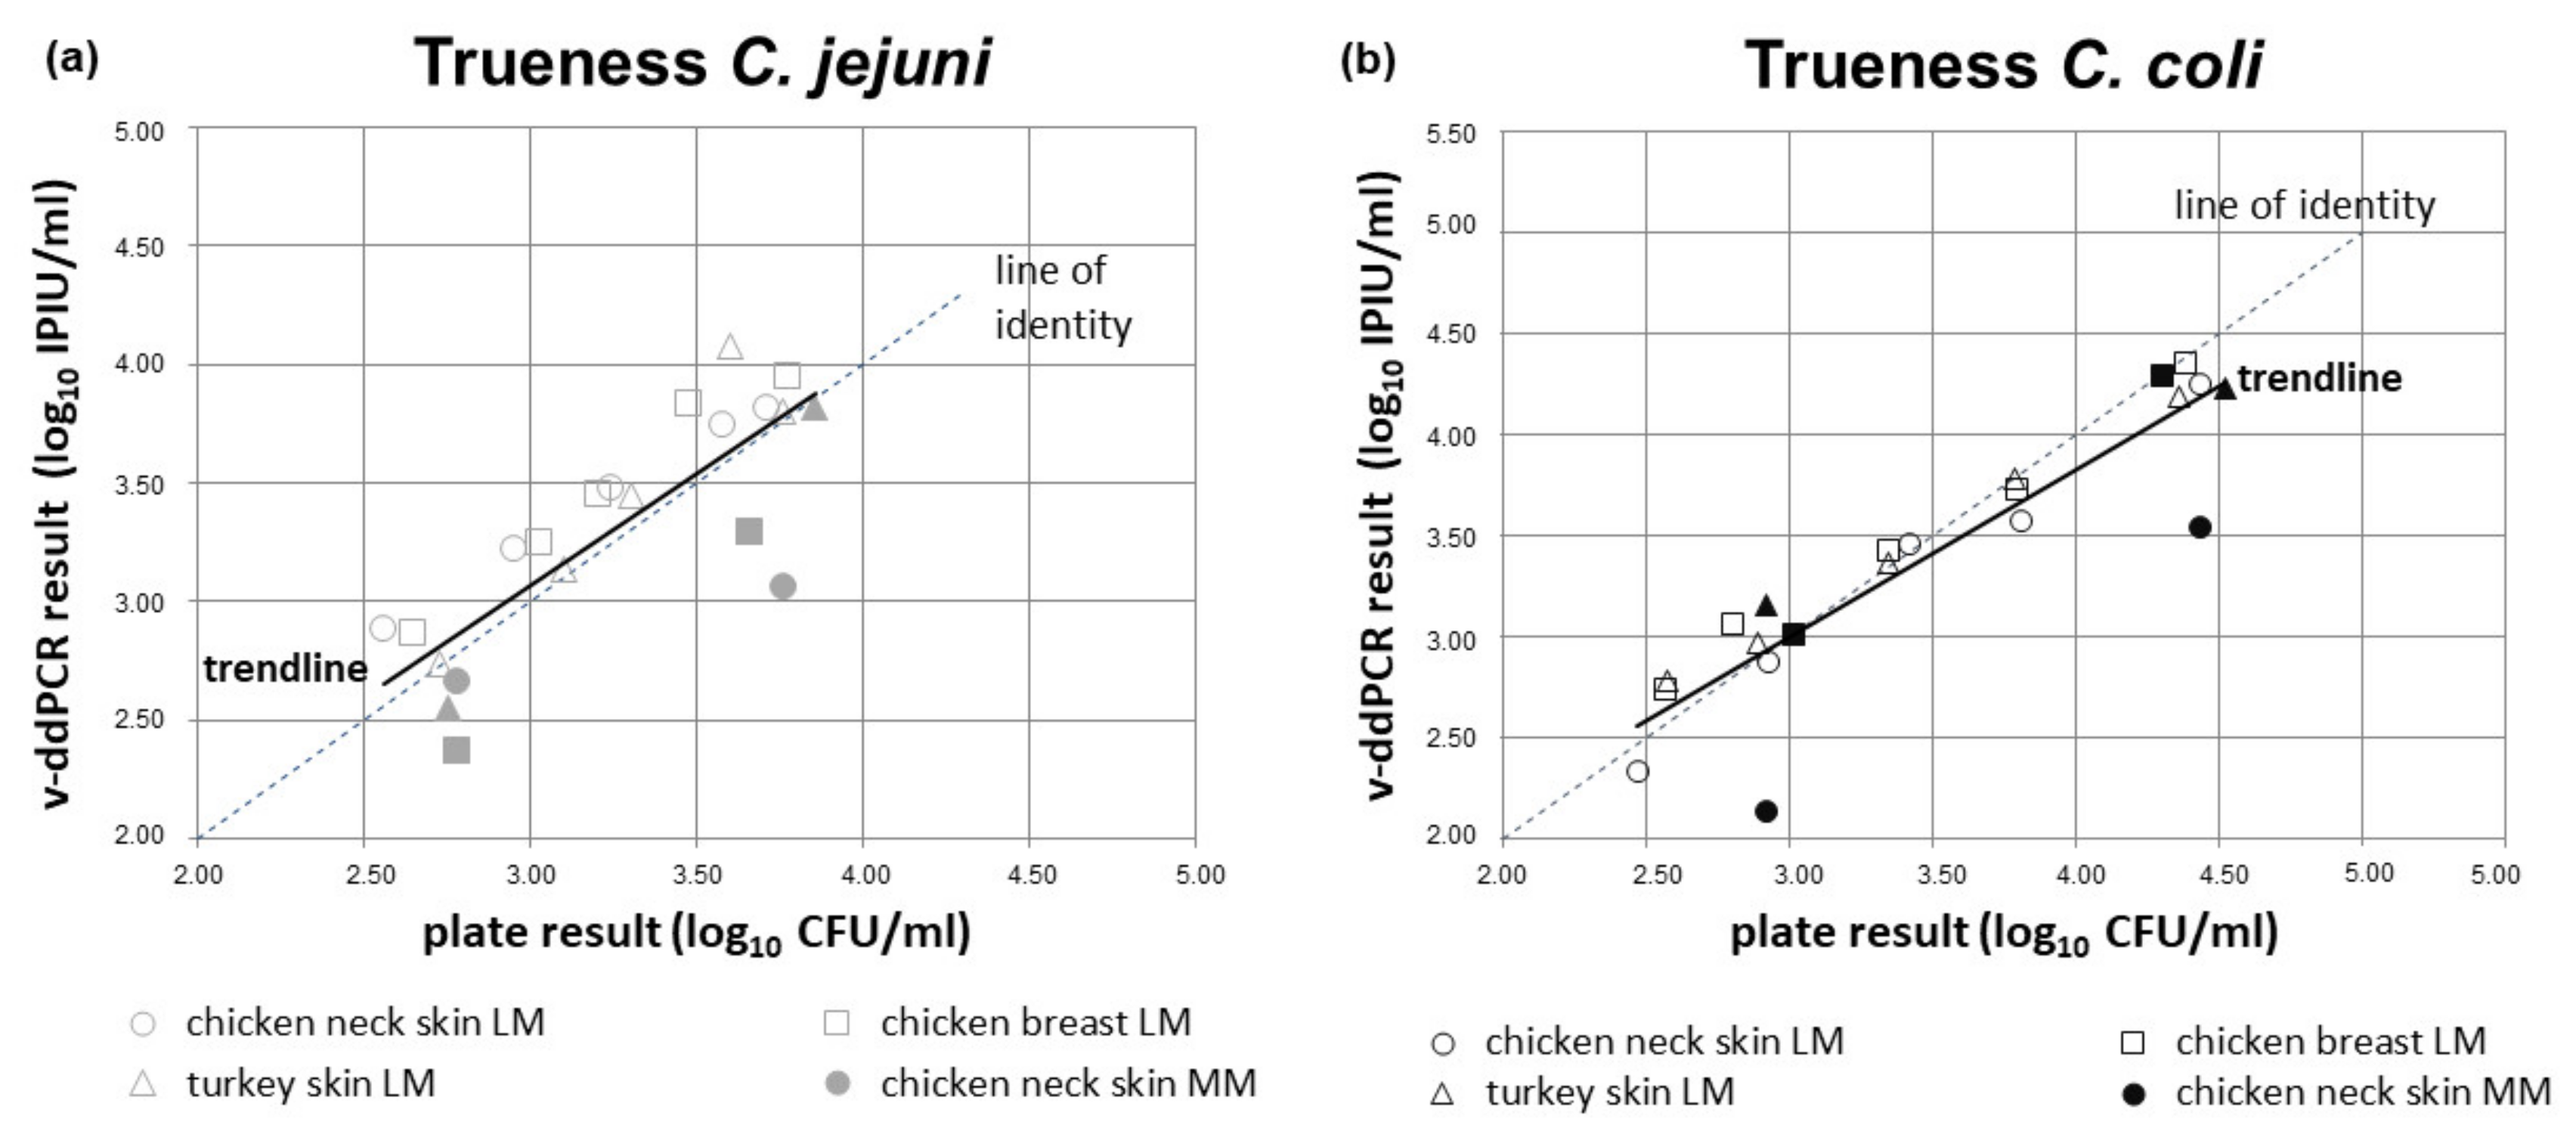
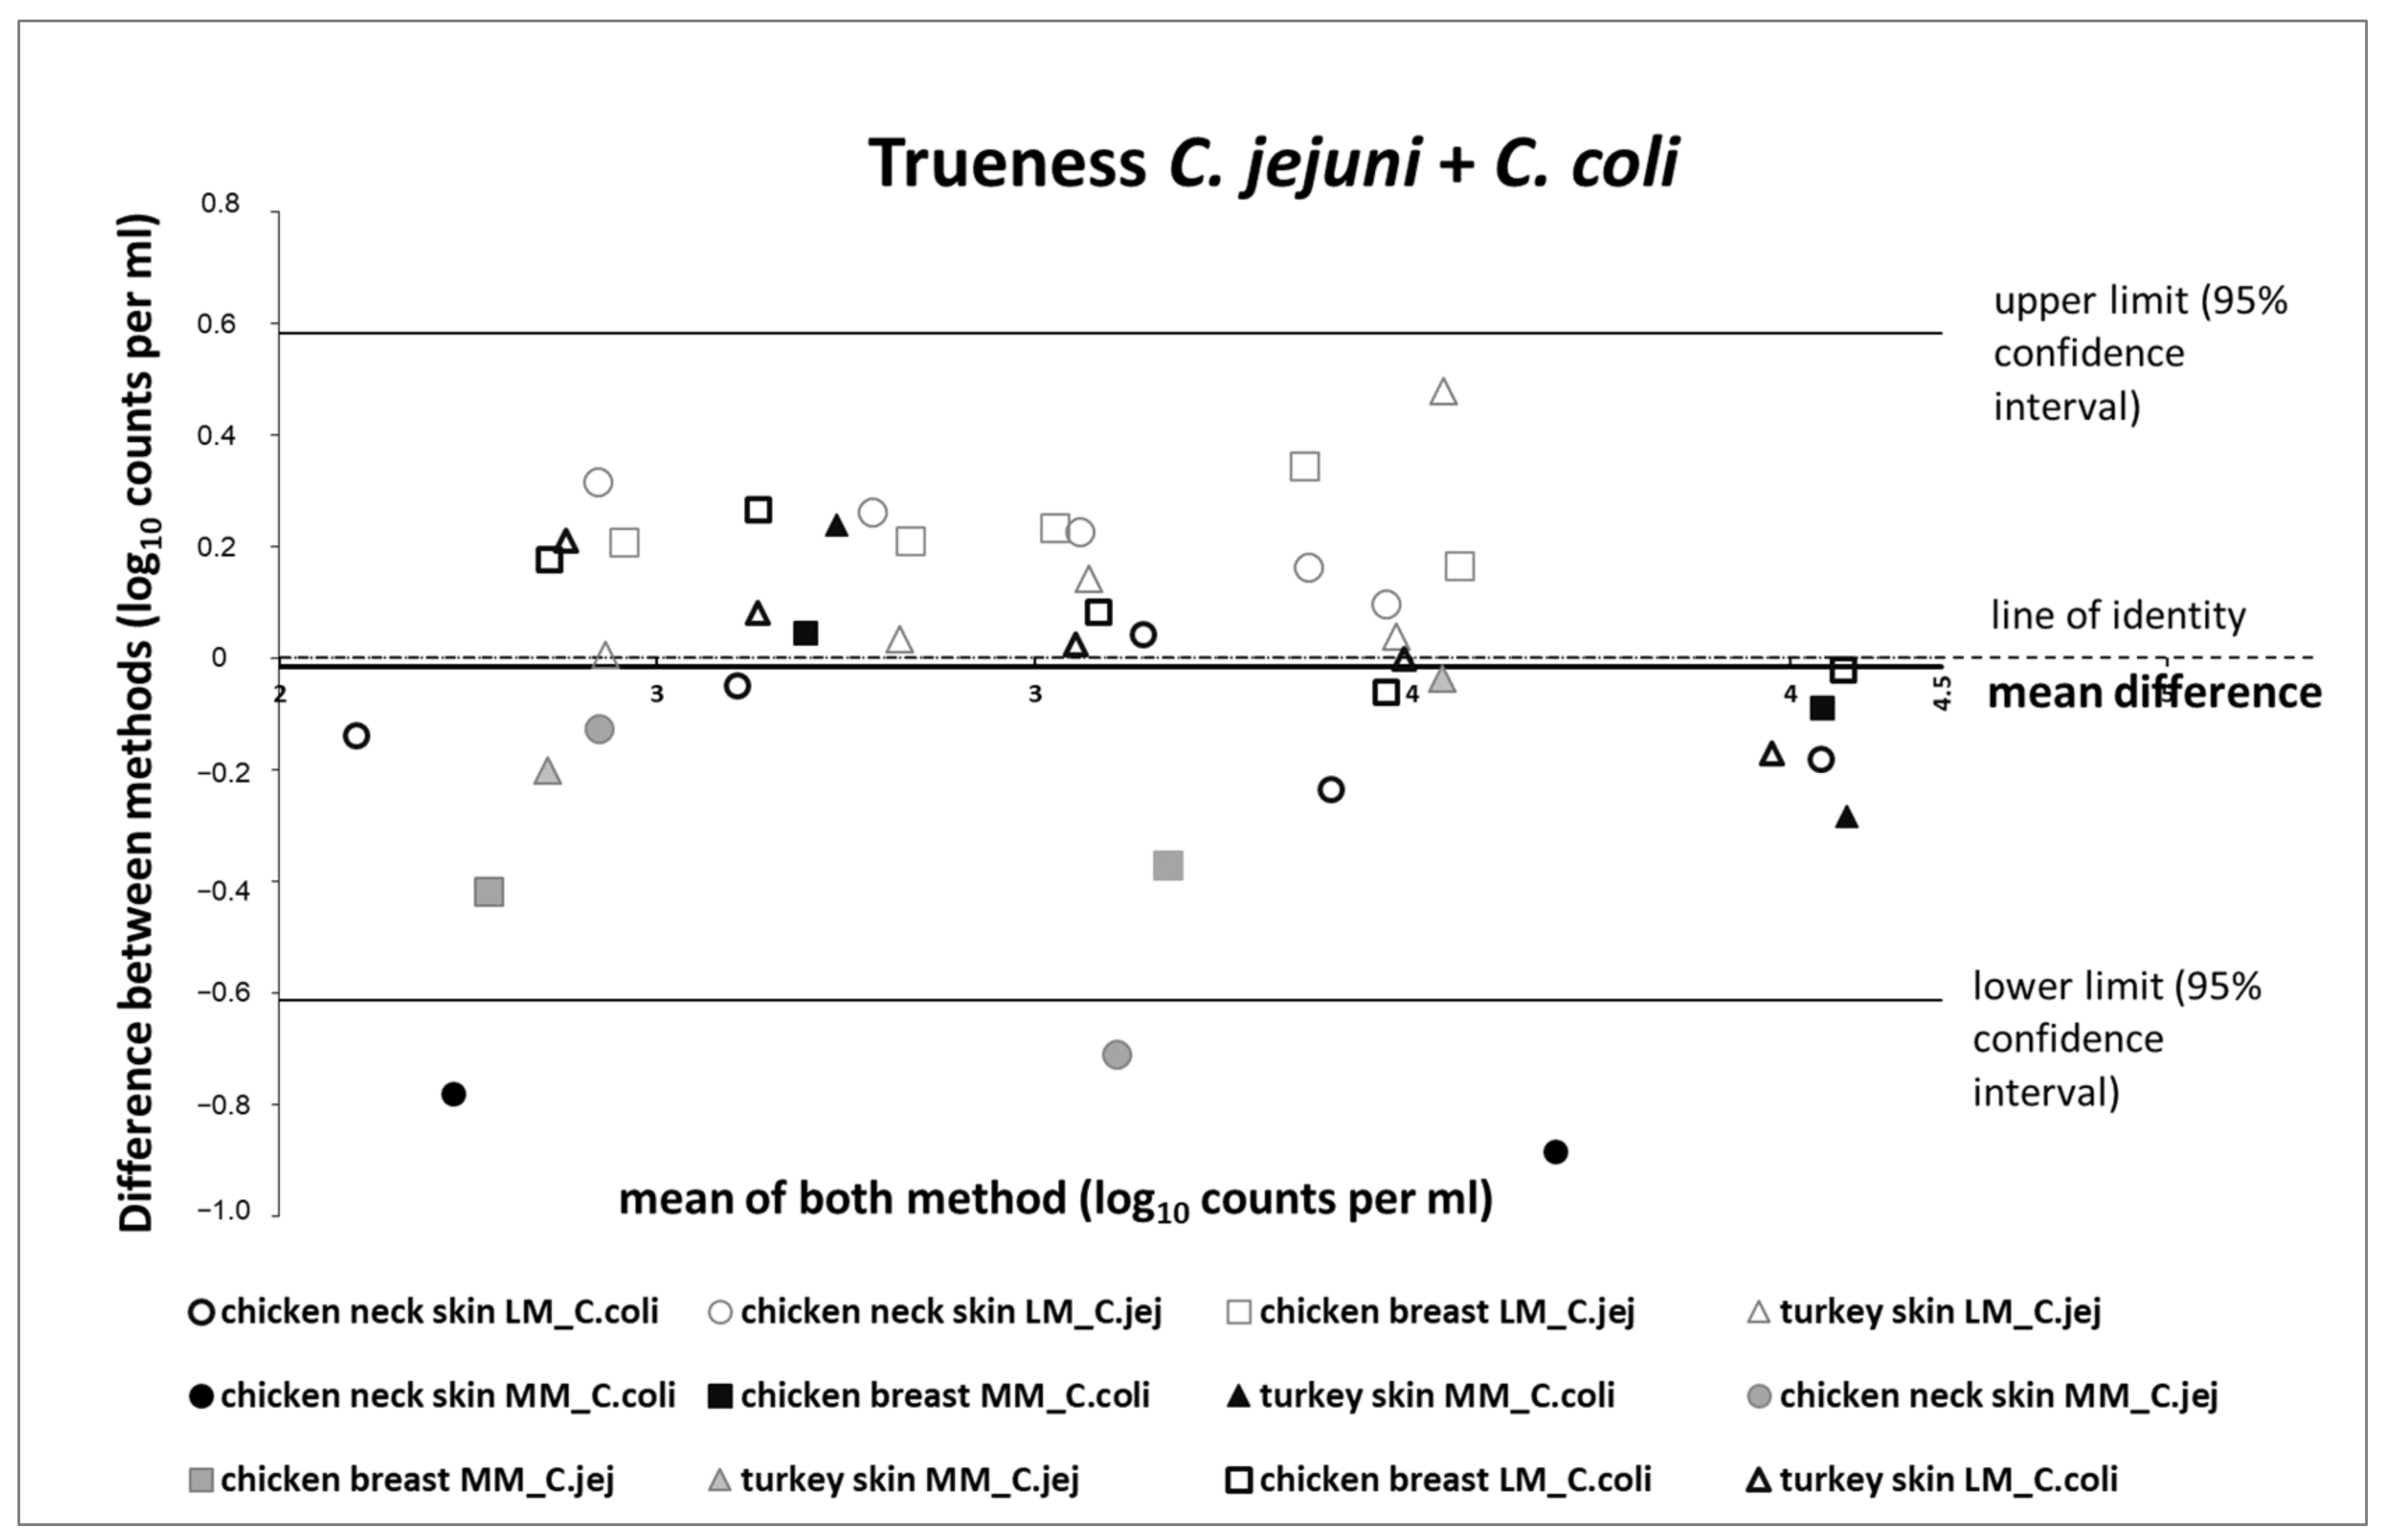
3.5.2. Relative Trueness Study

The scatter plot in Figure 2a for C. jejuni illustrates slightly higher log10 IPIU/mL values of the duplex v-ddPCR method for a low organic matrix ( ) and slightly lower values for a medium organic matrix ( ) compared to the log10 CFU/mL values of the colony–count method. The scatter plot for C. coli (Figure 2b) revealed no significant difference between the microbiological reference method and the ddPCR alternative method since all data points except for two medium organic matrices of chicken neck skin ( ) lie on the line of identity.
The Bland–Altman difference plot is a graphical method, describing agreements between two quantitative measurements. Figure 3 illustrates differences between two methods that are plotted against the means for each sample. The line of identity (difference of 0), the line of systematic deviation between both methods, as well as a 95% confidence interval for the upper and the lower limits of agreement [41] are additionally presented in the plot. All 42 spiked samples (low and medium organic matrix, 3 types of raw meat, 2 organisms C. coli and C. jejuni) are scattered all over the place, above and below the line of identity. The mean difference D ¯ between the alternative and the reference method is −0.02 log10 counts/mL close to zero. Based on this mean difference D ¯ , the standard deviation of the differences ( s D = 0.29 log10 counts/mL) as well as the number of samples ( n = 42), the limits of agreement were calculated according to ISO 16140-2:2016(E) [30] with a lower limit of −0.61 log10 counts per mL and an upper limit of 0.58 log10 counts/mL.
According to ISO 16140-2:2016(E) [30], it is expected that no more than 1 in 20 (5%) data values lie outside the upper and lower limits of agreement. For the data number between 41 and 60, not more than 3 data values are allowed to lie outside the limits. Our data show 3 outliers out of 42 samples falling beyond the limit of agreement. This suggests that there is no consistent bias between both methods. The ddPCR provides equivalent results to the ISO standard method.

3.6. Technical Measurement Uncertainty

For the random effects, repeatability and run standard deviations were estimated (Table 8). The random variation between runs was negligible, i.e., total observed variation is explained by the factors and the repeatability component. For the factorial effects, the mean difference in log copies per droplet across the two factor levels was calculated (Table 8). For the two random components (run and repeatability), and for each factor both a constant and a proportional term were estimated.
As shown in Table 8, for all factors except two (cartridge and time interval: droplet-PCR), at least one of the two terms (constant or proportional) is statistically significant. In particular, the two factors—Technician and Supermix—display a considerable effect. Due to the magnitude of the effect of the factor Supermix, the in-house reproducibility precision was estimated separately for the two Supermixes. As a result, it was no longer possible to obtain estimates for all seven factors on the basis of the two separate (smaller) data sets (corresponding to the two Supermixes). Accordingly, in each of the two evaluations, only three factorial effects were estimated: day, cartridge, and time interval: extraction-droplet.
At all five contamination levels, very similar relative standard deviation (i.e., the ratio between standard deviation and the mean value, abbreviated as RSD) values were obtained for both random and factorial effects for both Supermixes. As illustrated in Table 9 and Table 10, random variability shows a reverse pattern with the contamination level. Increasing the contamination level from 200 to 10,000 cells/mL was followed by a reduction in variability (78.5% to 23.3%) for the Supermix without dUTP. Similarly, for the Supermix with dUTP, the variability was reduced from 75.4% to 22.1%. The binomial (Poisson) component corresponds to the distributional uncertainty, and it is very large at low contamination levels (200 cells/mL: 58% for Supermix without dUTP and 55.1% for Supermix with dUTP). The recovery correction term corresponds to the statistical uncertainty of the estimation of the mean copy numbers at each contamination level. For further details regarding the statistical model and the meaning of the different components, the reader is referred to Uhlig et al. ([42], preprint]).
The total technical uncertainty for both supermixes provided in Table 9 and Table 10 correspond to ddPCR analysis with one technical replicate. Due to the large technical uncertainty, it was agreed that two technical replicates (duplicate determination in ddPCR) should be performed in routine testing. The corresponding uncertainties are provided in Table 11 for the Supermix with dUTP. For target copy numbers between 200 and 10,000 cells/mL, the technical uncertainty ranges between 0.26 to 0.08 log10 copies.

3.7. Performance of v-ddPCR on Routine and Retail Samples

The quantification of target DNA in ddPCR (copy number concentration) is based on an absolute count of PCR positive droplets (with PCR amplification of the target gene) and PCR negative droplets (without PCR amplification of the target gene). As advised in Huggett [43] and the Digital MIQE Guidelines [37,44], quality controls were integrated in each ddPCR run and checked before subsequent analysis of samples results. A no template control (NTC) serves as a control for extraneous nucleic acid contamination of this PCR, and it monitor false-positive reactions; the extraction control (EC) excludes contamination during DNA extraction; and internal amplification control (IAC with 50 copies/µL) helps to detect PCR inhibitors co-isolated from the matrix, and it confirms the negative results of the sample. Moreover, positive controls with specific target DNA of reference strains C. jejuni and C. coli (10 pg/µL ≙ 9000–13,000 cp/µL) allow for checking if the ddPCR worked correctly. Finally, a low number of droplets measured (<10,000 cp per 20 μL PCR) as well as the lack of negative droplets are also criteria to exclude subsequent analysis of samples results.

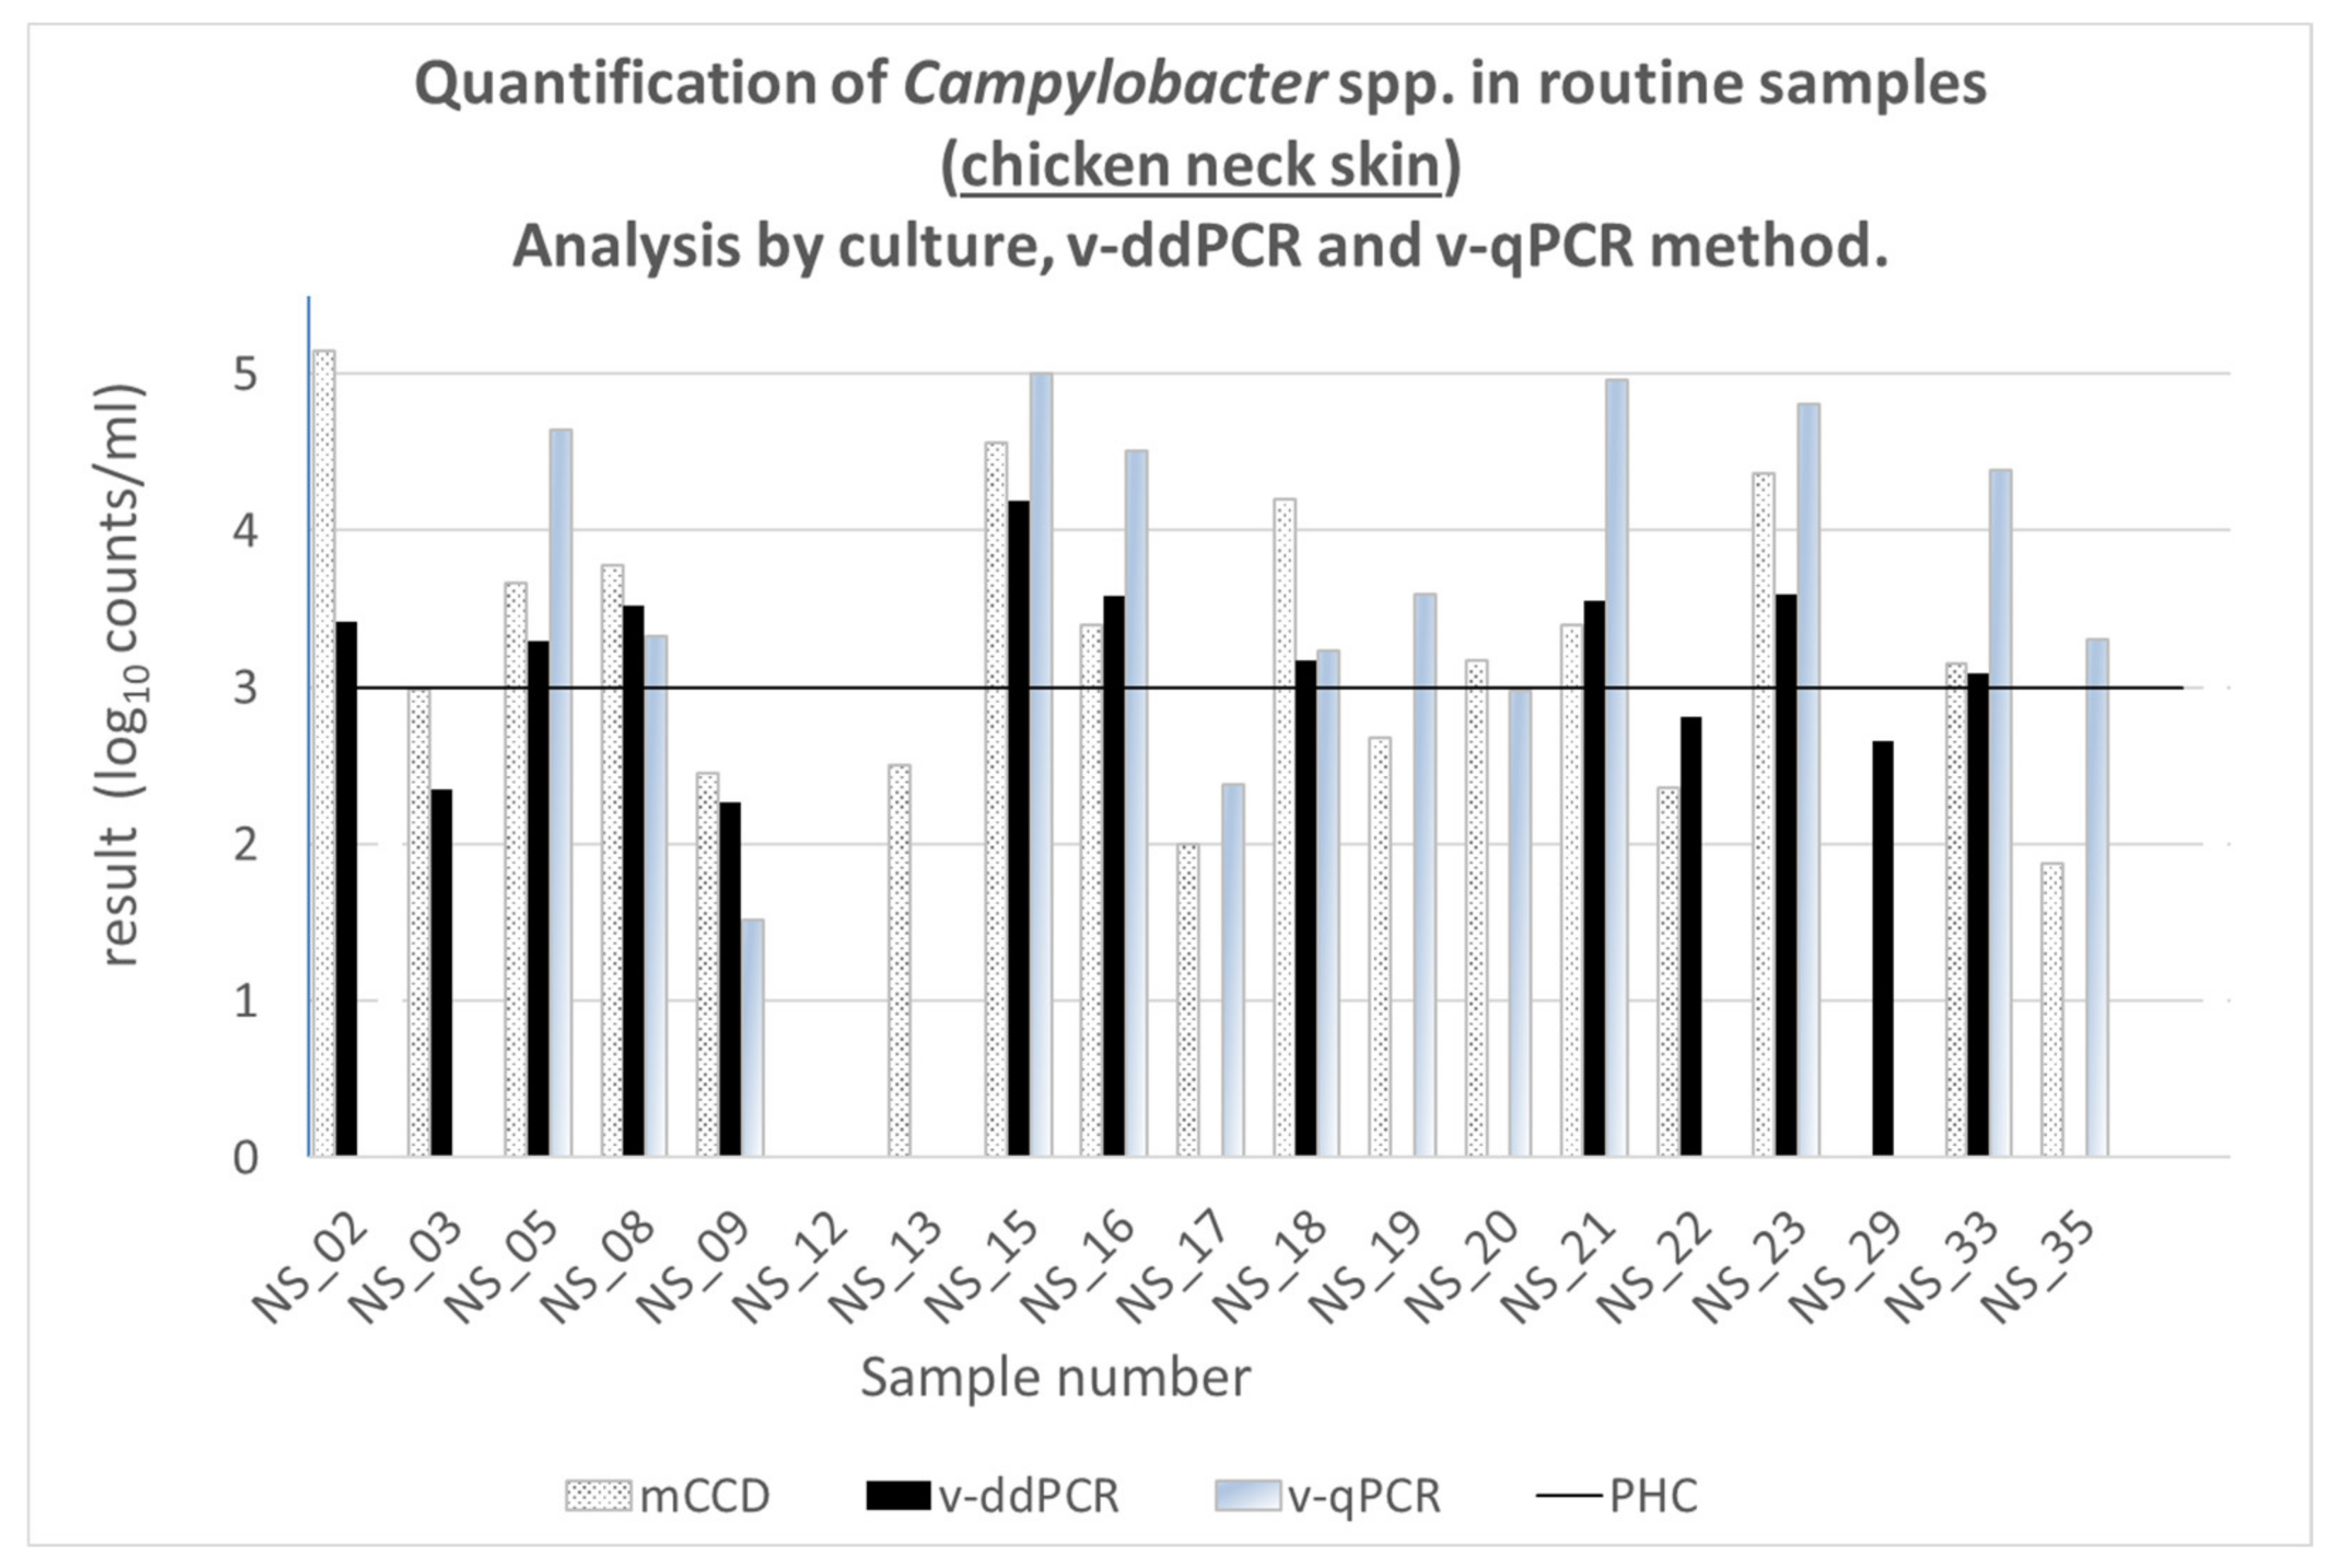
3.7.1. Routine Samples

A total of 19 chicken neck skins (NS) from Bavarian slaughterhouses (1:10 and 1:2 diluted), as well as 13 chicken breast meat (BM) from Bavarian supermarkets (1:10 diluted) were investigated for routine analysis. All samples were analyzed by three methods, with the exception of three samples (NS_02, 03 & 04) which were not examined by qPCR analysis.
Out of nineteen slaughterhouse chicken neck skin samples (Figure 4), solely one sample (NS-12) was analyzed negative with all methods, nine crossed the PHC limit with all methods, and three were detected below the PHC limit with all methods. An inconsistency was observed for the remaining six chicken NS. For three of them, at least one method detected Campylobacter above the PHC limit: NS_19 and NS_35 were above PHC only in v-qPCR, NS_20 was above PHC only on agar plates, no positive droplet was detected in v-ddPCR for these three samples. Finally, at least one of method out of three detected Campylobacter below PHC for the last three chicken neck skins NS_13, NS_22, and NS_29.
Out of 13 breast meat samples (Figure 5), nine were negative with all three methods, and the other four did not reach the PHC limit. BM-30, BM-31, BM-32 were detected exclusively in the v-ddPCR method, whereas BM-11 was detected only on plates. No signal was detected in a v-qPCR analysis of all four samples.
Two routine samples (BM_27 and BM_34), as well as two retail samples (RS_21 and RS_24) were prone to matrix inhibition, as the IAC was not amplified in v-qPCR. The extracted DNA was further diluted to resolve the mentioned complication, and it was analyzed again in a v-qPCR. The absence of Campylobacter was confirmed in three samples (BM_27, BM_34, and RS_24) but RS_21 was Campylobacter positive in the v-qPCR. A signal in the IAC detection system showed that the ddPCR was not affected from this inhibition.

3.7.2. Retail Samples

Twenty-five raw chicken samples (RS) were collected from retail shops. As illustrated in Figure 6, 14 out of 25 RS, which build up 50% of the entire samples, were detected positive for Campylobacter with at least one method. Three of them were quantified above PHC (RS_03 and RS_15 in both PCR methods, RS_04 in a solely v-ddPCR method), indicating that the ISO standard method failed in the quantification of samples above PHC. The other 11 RS were detected below PHC limit based on at least one of the three methods.

4. Discussion

C. jejuni and C. coli are the predominant Campylobacter species in poultry causing the most foodborne zoonosis and leading to a real impact on public health care. A review based on novel microbial risk assessment studies [5] like QMRA (Quantitative Microbial Risk Assessments) and based on CFU data shows the relationship between the prevalence of Campylobacter spp. in the poultry meat chain (broiler flocks, slaughterhouses, and consumers of poultry meat), and public health infection risk. The official ISO 10272-2:2017 method [7] used for the enumeration of Campylobacter spp. in poultry meat is unable to cultivate all infectious bacteria (IPIU), including CFU and VBNC, and it requires a long (2 days) and laborious (microaerobic atmosphere) incubation. Moreover, we observed the overgrowth of accompanying bacterial flora during the analysis of slaughterhouse samples, even on Campylobacter-selective mCCD agar plates, as well as samples with high levels of Campylobacter contamination make the microbiological enumeration of Campylobacter spp. unreliable for its use in routine analysis. A viability PMA-qPCR (v-qPCR) has been recently published [18], which overcomes these limitations, and it can be successfully applied for specific and sensitive quantification of Campylobater spp. in poultry. Digital PCR, the third generation of PCR technology, offers further advantages, such as an absolute quantification without an external calibration curve. Therefore, the final result is not influenced by the standard setting. In addition, due to the enrichment effect of the target of interest in the interfering background, ddPCR is highly tolerant to PCR inhibitors [28,45,46].
Applying a method comparison study according to ISO 16140-2:2016 [30], we internally validated a PMA-based duplex ddPCR method (v-ddPCR) against the official ISO 10272-2:2017 method [7] in order to quantify viable C. jejuni and C. coli in poultry meat of slaughterhouse and retail samples. The method was supposed to be practicable and cost-effective for routine analysis. On average, no consistent bias was observed between both methods during the whole trueness study. Likewise, no detectable systematic bias was observed during the accuracy study for C. coli, in contrast, a slight positive bias (v-ddPCR against reference method) was noticed for C. jejuni. Finally, all criteria from ISO 16140-2:2016(E) [30] were fulfilled for both accuracy and relative trueness validation.
The Process Hygiene Criterion of maximum 1000 CFU Campylobacter/g chicken skin (1:10 dilution corresponds to 6.7 cp/reaction (0.8 log10 cp/reaction) and 1:2 dilution corresponds to 33 cp/reaction (1.5 log10 cp/reaction)) can be reliably detected with ddPCR, as the limit of detection is 4.2 cp/reaction (0.6 log10 cp/reaction) for C. jejuni and 5.7 cp/reaction (0.8 log10 cp/reaction) for C. coli. The evaluation of the limit of quantification (LOQ) was based on a precision experiment, and it reached 42 cp/reaction (1.6 log10 (cp/reaction) for C. jejuni and 16 cp/reaction (1.2 log10 (cp/reaction) for C. coli at RSDr 25%. We recommend, as reported by Strain [22], to increase the number of technical replicates analyzed in ddPCR so that the LOQ can be significantly decreased and the PHC can be reliably quantified (see Figure 1a,b). Likewise, the range of the technical uncertainty reaches a better performance if two technical replicates are included in the analyses (see Table 11). Furthermore, based on the uncertainty data we believe that a higher repeatability and reproducibility (in particular: lower factorial effects) can be achieved by better standardization of the method. Additionally, Kosir et al. [46] showed the critical impact of droplet volume variability in ddPCR on the accuracy of the absolute quantification.
The applicability of our v-ddPCR to quantify Campylobacter was investigated on natural contaminated routine samples from LGL, comprising chicken neck skin from slaughterhouses as well as breast meat and naturally contaminated retail samples, purchased in Bavarian supermarkets. The samples were analyzed in parallel with the reference method ISO 10272-2:2017 [7] and v-qPCR [18]. Huggett et al. [43] pointed out the characteristic and the unique potential of ddPCR technology to provide an absolute quantitative value of a specific target, but meanwhile there was a difficulty in verifying against other molecular methods. The used v-qPCR method relies on a calibration curve, delivering a quantitative value and thus confirming the accuracy of our ddPCR results when analyzing naturally contaminated samples. Solely, chicken neck skin samples from slaughterhouses (around 50% of analyzed samples) were quantified above PHC (3.0 log10 CFU/g chicken meat) on the reference plate count method; all breast meat and retail samples were detected under PHC on mCCD plates. The EU Regulation No 2017/1495 [6] already highlighted the existence of different significant contamination levels between neck skin and breast skin samples. Chicken neck skin samples from slaughterhouses have been shown to be much more contaminated than breast meat samples (skin-free) or retail samples from the supermarkets that are usually exposed to a long and stressful cooling of the refrigerated counter [19]. Except for NS-20, the plate results of chicken neck skin were confirmed with both alternative PCR methods, which revealed a good correlation of both PCR methods with the official plate count method for the slaughterhouse samples. For two neck skin samples, NS-19 and NS-35, Campylobacter could be quantified above the PHC only in a v-qPCR, and it remained undetected by the plate count method, as well as in the v-ddPCR. It cannot be excluded that another thermophilic Campylobacter spp. (e.g., C. lari) is involved, which could not be detected in a v-ddPCR method, which used other detection systems as v-qPCR and only detects C. jejuni and C. coli. This may also be related to the sensitivity of the different detection systems. While v-ddPCR is based on specific single-copy genes for C. jejuni and C. coli, three target copies of the 16S rRNA gene per chromosomal copy in Campylobacter spp. may be detected in v-qPCR [18].
Out of twenty-five retail samples, two samples—RS-03 and RS-15—were quantified above the PHC limit for both molecular methods; one additional sample, RS-04, was quantified above PHC only in v-ddPCR. The ISO standard method failed to quantify these three samples above PHC. Campylobacter may have lost its cultivability due to oxygen or cold stress during the 4 °C storage in supermarkets. These potentially infectious Campylobacter cells in the VBNC stage could not be microbiologically detected as CFU, so the level of contamination of poultry meat is clearly underestimated [47], and it represents a significant threat to human health. Hence, the current duplex v-ddPCR assay can be helpful for risk assessment of Campylobacter in broiler meat, especially for the previously cooled retail samples.
Finally, although we observed an acceptable correlation for quantifying Campylobacter between the three applied methods, none of the tested methods was successful in detecting all the Campylobacter positive samples beyond the PHC. Independent of the PHC, v-ddPCR could detect more Campylobacter positive samples (49%) than the other methods (v-qPCR 33%, plate count 40%) among the total number of samples. Worldwide, scientists have reported a higher sensitivity of ddPCR compared to qPCR [29,45]. The ddPCR partitions every sample into thousands of droplets, and it performs independent end-point PCR amplification on each droplet. Therefore, it enables the detection and the quantification of very low amounts of DNA copies. Additionally, based on the micro-dilutions that are carried out within each droplet, ddPCR is less affected by the interference of PCR-inhibitors from food matrices [28,48]. In our study, four routine samples were prone to the inhibition of IAC in qPCR but the PCR-inhibitors did not affect ddPCR. Thus, we were able to confirm Huggett’s statement (dMIQE Group [37,43]), stating that dPCRs are less prone to inhibition compared to qPCRs. However, internal positive controls are strongly recommended to be integrated into the ddPCR runs [43].
Compared to the official plate counting ISO method, the recently published v-qPCR [18] and the ddPCR allow an efficient and reliable quantification of viable Campylobacter in poultry samples. Despite different methodologies (absolute quantification in ddPCR, standard-setting in qPCR) and different Campylobacter detection systems (specific single-copy genes in ddPCR, three target copies of the 16S rRNA gene in v-qPCR), both molecular methods deliver comparable results. Detection systems with single-copy genes provide the advantage that one gene copy corresponds to one CFU. A V-qPCR [18] was combined with an ISPC (Internal Sample Process Control) to monitor the PMA efficiency for reducing dead cells and to correct the DNA loss happening during sample processing. In our method comparison study (accuracy and trueness), PMA efficiency was monitored on 102 artificially spiked samples (ratio of 1 live: 10 dead bacteria). As expected, the sample portion with a PMA treatment analysis was comparable with the ISO standard plate count method. The results that were obtained from the sample portion without PMA treatment represented number of Campylobacter spp. that was approximately 5 to 10 times higher when compared to the sample with PMA, which proves the efficiency of PMA in reducing the dead cell signal.
A limitation of ddPCR regarding the dynamic range is the loss of linearity for samples with a high level of contamination [22,28]. The calculation of the absolute quantities in ddPCR is based on the number of positive vs. negative partitions in a sample, using Poisson statistics [45]. Samples with abundant contamination (Bio-Rad 20,000-droplet system achieves approximately a 4 log10 range) have to be preliminarily diluted so that the number of targets per partition is within a range suitable for Poisson quantification, minimizing the partitioning error in ddPCR [48]. However, we did not encounter this problem during the analysis of our natural contaminated samples from the slaughterhouse or from the Bavarian supermarket, where the maximum contamination was approximately 4 log10. Thus, v-ddPCR is well suited to a reliable, accurate, and sensitive quantification of Campylobacter in poultry, and it offers a practicable, rapid, and cost-effective alternative method for routine analysis.

Supplementary Materials

The following supporting information can be downloaded at: https://www.mdpi.com/article/10.3390/app12115315/s1, List S1. Strains or isolates used in this study; List S2. Artificially contaminated and naturally contaminated rinses.

Author Contributions

Conceptualization, I.H., S.U. and M.P.; methodology, J.G., V.Z.-P., D.W., L.M. and D.T.; validation, J.G. and V.Z.-P.; formal analysis, V.Z.-P., B.C. and S.U.; resources, I.H. and U.B.; data curation, V.Z.-P. and M.P.; writing—original draft preparation, J.G., V.Z.-P., M.P., I.H. and B.C.; writing—review and editing, V.Z.-P., M.P., B.C. and I.H.; visualization, V.Z.-P. and B.C.; supervision, M.P. and I.H.; project administration, I.H.; funding acquisition, U.B. and I.H. All authors have read and agreed to the published version of the manuscript.

Funding

This study was funded by the Bavarian State Ministry of the Environment and Consumer Protection (StMUV), project number 73903.

Informed Consent Statement

Not applicable.

Acknowledgments

We thank Kerstin Stingl, head of the National Reference Laboratory for Campylobacter at the German Federal Institute for Risk Assessment (BfR) for the provision of live and dead Campylobacter standards and Campylobacter isolates for selectivity testing. We would like to extend our thanks to Patrick Gürtler at the Bavarian Health and Food Safety Authority (LGL) for his excellent introduction to the droplet digital PCR as well as his support in the evaluation of the data. Additionally, we thank Sevana Khaloian (LGL) for critically reading our manuscript.

Conflicts of Interest

The authors declare no conflict of interest.

References

  1. EFSA BIOHAZ Panel (EFSA Panel on Biological Hazards). Scientific Opinion on quantification of the risk posed by broiler meat to human Campylobacteriosis in the EU. EFSA J. 2010, 8, 1437. [Google Scholar] [CrossRef]
  2. EFSA and ECDC (European Food Safety Authority and European Centre for Disease Prevention and Control). The European Union One Health 2018 Zoonoses Report. EFSA J. 2019, 17, 5926. [Google Scholar] [CrossRef] [Green Version]
  3. EFSA and ECDC (European Food Safety Authority and European Centre for Disease Prevention and Control). The European Union One Health 2019 Zoonoses Report. EFSA J. 2021, 19, 6406. [Google Scholar] [CrossRef]
  4. EFSA and ECDC (European Food Safety Authority and European Centre for Disease Prevention and Control). The European Union summary report on trends and sources of zoonoses, zoonotic agents and food-borne outbreaks in 2017. EFSA J. 2018, 16, e05500. [Google Scholar] [CrossRef]
  5. Nastasijevic, I.; Proscia, F.; Boskovic, M.; Glisic, M.; Blagojevic, B.; Sorgentone, S.; Kirbis, A.; Ferri, M. The European Union control strategy for Campylobacter spp. in the broiler meat chain. J. Food Saf. 2020, 40, e12819. [Google Scholar] [CrossRef]
  6. Commission Regulation (EU) 2017/1495 of 23 August 2017, Amending Regulation (EC) No 2073/2005 as Regards Campylobacter in Broiler Carcases. Available online: http://eurlex.europa.eu/eli/reg/2017/1495/oj (accessed on 18 April 2022).
  7. ISO 10272-2:2017; Microbiology of the Food Chain—Horizontal Method for Detection and Enumeration of Campylobacter spp.—Part 2: Colony-Count Technique. International Organization for Standardization: Geneva, Switzerland, 2017.
  8. Kim, J.C.; Oh, E.; Kim, J.; Jeon, B. Regulation of oxidative stress resistance in Campylobacter jejuni; a microaerophilic foodborne pathogen. Front. Microbiol. 2015, 6, 751. [Google Scholar] [CrossRef] [Green Version]
  9. Lv, R.; Wang, K.; Feng, J.; Heeney, D.D.; Liu, D.; Lu, X. Detection and Quantification of Viable but Non-culturable Campylobacter jejuni. Front. Microbiol. 2020, 10, 2920. [Google Scholar] [CrossRef]
  10. Goode, O.; Smith, A.; Zarkan, A.; Cama, J.; Invergo, B.M.; Belgami, D.; Caño-Muñiz, S.; Metz, J.; O’Neill, P.; Jeffries, A.; et al. Persister Escherichia coli Cells Have a Lower Intracellular pH than Susceptible Cells but Maintain Their pH in Response to Antibiotic Treatment. mBio 2021, 12, e0090921. [Google Scholar] [CrossRef]
  11. Bamford, R.; Smith, A.; Metz, J.; Glover, G.; Titball, R.W.; Pagliara, R. Investigating the physiology of viable but non-culturable bacteria by microfluidics and time-lapse microscopy. BMC Biol. 2017, 15, 121. [Google Scholar] [CrossRef]
  12. Josefsen, M.H.; Löfström, C.; Hansen, T.B.; Christensen, L.S.; Olsen, J.E.; Hoorfar, J. Rapid quantification of viable Campylobacter bacteria on chicken carcasses, using real-time PCR and propidium monoazide treatment, as a tool for quantitative risk assessment. Appl. Environ. Microbiol. 2010, 76, 5097–5104. [Google Scholar] [CrossRef] [Green Version]
  13. Wagley, S.; Morcrette, H.; Kovacs-Simon, A.; Yang, Z.R.; Power, A.; Tennant, R.K.; Love, J.; Murray, N.; Titball, R.W.; Butler, C.S. Bacterial dormancy: A subpopulation of viable but non-culturable cells demonstrates better fitness for revival. PLoS Pathog. 2021, 17, e1009194. [Google Scholar] [CrossRef] [PubMed]
  14. Baffone, W.; Casaroli, A.; Citterio, B.; Pierfelici, L.; Campana, R.; Vittoria, E.; Guaglianone, E.; Donelli, G. Campylobacter jejuni loss of culturability in aqueous microcosms and ability to resuscitate in a mouse model. Int. J. Food Microbiol. 2006, 107, 83–91. [Google Scholar] [CrossRef] [PubMed]
  15. Wideman, N.E.; Oliver, J.D.; Crandall, P.G.; Jarvis, N.A. Detection and Potential Virulence of Viable but Non-Culturable (VBNC) Listeria monocytogenes: A Review. Microorganisms 2021, 9, 194. [Google Scholar] [CrossRef] [PubMed]
  16. Gin, K.Y.; Goh, S.G. Modeling the effect of light and salinity on viable but non-culturable (VBNC) Enterococcus. Water Res. 2013, 47, 3315–3328. [Google Scholar] [CrossRef]
  17. Castro, A.G.S.A.; Dorneles, E.M.S.; Santos, E.L.S.; Alves, T.M.; Silva, G.R.; Figueiredo, T.C.; Assis, D.C.S.; Lage, A.P.; Cançado, S.V. Viability of Campylobacter spp. in frozen and chilled broiler carcasses according to real-time PCR with propidium monoazide pretreatment. Poult. Sci. 2018, 97, 1706–1711. [Google Scholar] [CrossRef] [PubMed]
  18. Stingl, K.; Heise, J.; Thieck, M.; Wulsten, I.F.; Pacholewicz, E.; Iwobi, A.N.; Govindaswamy, J.; Zeller-Péronnet, V.; Scheuring, S.; Luu, H.Q.; et al. Challenging the “gold standard” of colony-forming units—Validation of a multiplex real-time PCR for quantification of viable Campylobacter spp. in meat rinses. Int. J. Food Microbiol. 2021, 359, 109417. [Google Scholar] [CrossRef]
  19. Pacholewicz, E.; Buhler, C.; Wulsten, I.F.; Kraushaar, B.; Luu, H.Q.; Iwobi, A.N.; Huber, I.; Stingl, K. Internal sample process control improves cultivation-independent quantification of thermotolerant Campylobacter. Food Microbiol. 2019, 78, 53–61. [Google Scholar] [CrossRef]
  20. Pacholewicz, E.; Swart, A.; Lipman, L.J.; Wagenaar, J.A.; Havelaar, A.H.; Duim, B. Propidium monoazide does not fully inhibit the detection of dead Campylobacter on broiler chicken carcasses by qPCR. J. Microbiol. Methods 2013, 95, 32–38. [Google Scholar] [CrossRef]
  21. Lazou, T.P.; Gelasakis, A.I.; Chaintoutis, S.C.; Iossifidou, E.G.; Dovas, C.I. Method-Dependent Implications in Foodborne Pathogen Quantification: The Case of Campylobacter coli Survival on Meat as Comparatively Assessed by Colony Count and Viability PCR. Front. Microbiol. 2021, 12, 604933. [Google Scholar] [CrossRef]
  22. Strain, M.C.; Lada, S.M.; Luong, T.; Rought, S.E.; Gianella, S.; Terry, V.H.; Spina, C.A.; Woelk, C.H.; Richman, D.D. Highly precise measurement of HIV DNA by droplet digital PCR. PLoS ONE 2013, 8, e55943. [Google Scholar] [CrossRef]
  23. Taylor, S.C.; Carbonneau, J.; Shelton, D.N.; Boivin, G. Optimization of droplet digital PCR from RNA and DNA extracts with direct comparison to RT-qPCR: Clinical implications for quantification of oseltamivir-resistant subpopulations. J. Virol. Methods 2015, 224, 58–66. [Google Scholar] [CrossRef] [PubMed] [Green Version]
  24. Yang, R.; Paparini, A.; Monis, P.; Ryan, U. Comparison of next-generation droplet digital PCR (ddPCR) with quantitative PCR (qPCR) for enumeration of Cryptosporidium oocysts in faecal samples. Int. J. Parasitol. 2014, 44, 1105–1113. [Google Scholar] [CrossRef] [PubMed] [Green Version]
  25. Demeke, T.; Gräfenhan, T.; Holigroski, M.; Fernando, U.; Bamforth, J.; Lee, S.J. Assessment of droplet digital PCR for absolute quantification of genetically engineered OXY235 canola and DP305423 soybean samples. Food Control 2014, 46, 470–474. [Google Scholar] [CrossRef]
  26. Pecoraro, S. Chapter 5: Digital Polymerase Chain Reaction (dPCR)—General Aspects and Applications. In DNA Techniques to Verify Food Authenticity: Applications in Food Fraud; Burns, M., Foster, L., Walker, M., Eds.; The Royal Society of Chemistry: London, UK, 2020; pp. 63–69. ISBN 978-1-78801-178-5. [Google Scholar]
  27. Quan, P.L.; Sauzade, M.; Brouzes, E. dPCR: A Technology Review. Sensors 2018, 18, 1271. [Google Scholar] [CrossRef] [Green Version]
  28. Singh, G.; Sithebe, A.; Enitan, A.M.; Kumari, S.; Bux, F.; Stenström, T.A. Comparison of droplet digital PCR and quantitative PCR for the detection of Salmonella and its application for river sediments. J. Water Health 2017, 15, 505–508. [Google Scholar] [CrossRef]
  29. Mauvisseau, Q.; Davy-Bowker, J.; Bulling, M.; Brys, R.; Neyrinck, S.; Troth, C.; Sweet, M. Combining ddPCR and environmental DNA to improve detection capabilities of a critically endangered freshwater invertebrate. Sci. Rep. 2019, 9, 14064. [Google Scholar] [CrossRef] [Green Version]
  30. ISO 16140-2:2016(E); Microbiology of the Food Chain—Method Validation—Part 2: Protocol for the Validation of Alternative (Proprietary) Methods against a Reference Method. International Organization for Standardization: Geneva, Switzerland, 2016.
  31. ISO 19036:2020; Microbiology of the Food Chain—Estimation of Measurement Uncertainty for Quantitative Determinations. International Organization for Standardization: Geneva, Switzerland, 2020.
  32. Huber, I.; Pavlovic, M.; Maggipinto, M.; Konrad, R.; Busch, U. Interlaboratory proficiency test using MALDI-TOF MS for identification of food-associated bacteria. Food Anal. Methods 2018, 11, 1068–1075. [Google Scholar] [CrossRef]
  33. German Federal Institute for Risk Assessment (BfR). Laboratory Protocol of the National Reference Laboratory for Campylobacter. 2021. Available online: https://www.bfr.bund.de/cm/349/preparation-of-quantitative-thermophilic-campylobacter-spp-reference-material.pdf (accessed on 18 April 2022).
  34. He, Y.; Yao, X.; Gunther, N.W.; Xie, Y.; Tu, S.I.; Shi, X. Simultaneous Detection and Differentiation of Campylobacter jejuni, C. coli, and C. lari in Chickens Using a Multiplex Real-Time PCR Assay. Food Anal. Methods 2010, 3, 321–329. [Google Scholar] [CrossRef]
  35. LaGier, M.J.; Joseph, L.A.; Passaretti, T.V.; Musser, K.A.; Cirino, N.M. A real-time multiplexed PCR assay for rapid detection and differentiation of Campylobacter jejuni and Campylobacter coli. Mol. Cell. Probes 2004, 18, 275–282. [Google Scholar] [CrossRef]
  36. Anderson, A.; Pietsch, K.; Zucker, R.; Mayr, A.; Müller-Hohe, E.; Messelhäusser, U.; Sing, A.; Busch, U.; Huber, I. Validation of a Duplex Real-Time PCR for the Detection of Salmonella spp. in Different Food Products. Food Anal. Methods 2011, 4, 259–267. [Google Scholar] [CrossRef]
  37. dMIQE Group; Huggett, J.F. The Digital MIQE Guidelines Update: Minimum Information for Publication of Quantitative Digital PCR Experiments for 2020. Clin. Chem. 2020, 66, 1012–1029. [Google Scholar] [CrossRef] [PubMed]
  38. Uhlig, S.; Frost, K.; Colson, B.; Simon, K.; Mäde, D.; Reiting, R.; Gowik, P.; Grohmann, L. QuoData Web Service ‘Validation of Qualitative PCR Methods within a Single Laboratory’. 2015. Available online: https://quodata.de/content/validation-qualitative-pcr-methods-single-laboratory (accessed on 18 April 2022).
  39. Bundesamts für Verbraucherschutz und Lebensmittelsicherheit (BVL). Guidelines for the Single-Laboratory Validation of Qualitative Real-Time PCR Methods; Bundesamt für Verbraucherschutz und Lebensmittelsicherheit, Federal Office of Consumer Protection and Food Safety: Braunschweig, Germany, 2016. Available online: https://www.bvl.bund.de/SharedDocs/Downloads/07_Untersuchungen/Guidelines%20for%20the%20single%20laboratory.pdf?__blob=publicationFile&v=3 (accessed on 18 April 2022).
  40. Pecoraro, S.; Berben, G.; Burns, M.; Corbisier, P.; De Giacomo, M.; De Loose, M.; Dagand, E.; Dobnik, D.; Eriksson, R.; Holst-Jensen, A.; et al. Overview and Recommendations for the Application of Digital PCR; JRC Technical Report, European Network of GMO Laboratories (ENGL); EUR 29673 EN; Publications Office of the European Union: Luxembourg, 2019; Available online: https://data.europa.eu/doi/10.2760/31034 (accessed on 18 April 2022)ISBN 978-92-76-00180-5.
  41. Bland, J.M.; Altman, D.G. Measuring agreement in method comparison studies. Stat. Methods Med. Res. 1999, 8, 135–160. [Google Scholar] [CrossRef] [PubMed]
  42. Uhlig, S.; Weidner, C.; Colson, B. Statistical Modelling and Experimental Design for the Validation of Droplet Digital PCR Methods. Preprints 2022, 2022040104. [Google Scholar] [CrossRef]
  43. Huggett, J.F.; Cowen, S.; Foy, C.A. Considerations for digital PCR as an accurate molecular diagnostic tool. Clin. Chem. 2015, 61, 79–88. [Google Scholar] [CrossRef] [Green Version]
  44. Huggett, J.F.; Foy, C.A.; Benes, V.; Emslie, K.; Garson, J.A.; Haynes, R.; Hellemans, J.; Kubista, M.; Mueller, R.D.; Nolan, T.; et al. The digital MIQE guidelines: Minimum Information for Publication of Quantitative Digital PCR Experiments. Clin. Chem. 2013, 59, 892–902. [Google Scholar] [CrossRef]
  45. Papić, B.; Pate, M.; Henigman, U.; Zajc, U.; Gruntar, I.; Biasizzo, M.; Ocepek, M.; Kušar, D. New Approaches on Quantification of Campylobacter jejuni in Poultry Samples: The Use of Digital PCR and Real-time PCR against the ISO Standard Plate Count Method. Front. Microbiol. 2017, 8, 331. [Google Scholar] [CrossRef] [Green Version]
  46. Basu, A.S. Digital Assays Part I: Partitioning Statistics and Digital PCR. SLAS TECHNOL. Transl. Life Sci. Innov. 2017, 22, 369–386. [Google Scholar] [CrossRef] [Green Version]
  47. Košir, A.B.; Divieto, C.; Pavšič, J.; Pavarelli, S.; Dobnik, D.; Dreo, T.; Bellotti, R.; Sassi, M.P.; Žel, J. Droplet volume variability as a critical factor for accuracy of absolute quantification using droplet digital PCR. Anal. Bioanal. Chem. 2017, 409, 6689–6697. [Google Scholar] [CrossRef] [Green Version]
  48. Stingl, K.; Knüver, M.T.; Vogt, P.; Buhler, C.; Krüger, N.J.; Alt, K.; Tenhagen, B.A.; Hartung, M.; Schroeter, A.; Ellerbroek, L.; et al. Quo vadis?—Monitoring Campylobacter in Germany. Eur. J. Microbiol. Immunol. 2012, 2, 88–96. [Google Scholar] [CrossRef] [Green Version]
Figure 1. Relative standard deviation of repeatability (RSDr) calculated under repeatability conditions for (a) C. jejuni and (b) C. coli. Estimation of LOQ (RSDr value of 25%) for one tested replicate (solid-filled points and line) and for two replicates (non-filled points and dashed line).
Applsci 12 05315 g001
Figure 2. Scatter plot of alternative v-ddPCR method versus the microbiological reference method for determination of the relative trueness on three different types of raw meat matrices for (a) C. jejuni and (b) C. coli. LM: Low organic Matrix (represented by non-filled measurement points); MM: Medium organic Matrix (represented by solid-filled measurement points).
Applsci 12 05315 g002
Figure 3. Bland–Altman difference plot for three different types of raw meat (C. jejuni and C. coli, low and medium organic matrix). LM: Low organic Matrix; MM: Medium organic Matrix, grey measurement points for C. jejuni, black measurement points for C. coli.
Applsci 12 05315 g003
Figure 4. Analysis of LGL routine samples: chicken neck skin (NS) from slaughterhouse. Analysis in culture, v-ddPCR, and v-qPCR. The Process Hygiene Criterion (PHC: log10 3.0) is marked with a black line.
Applsci 12 05315 g004
Figure 5. Analysis of LGL routine samples: chicken breast meat (BM) from retail. Analysis in culture, v-ddPCR and v-qPCR. The Process Hygiene Criterion (PHC: log10 3.0) is marked with a black line.
Applsci 12 05315 g005
Figure 6. Analysis of different raw chicken (RS) meat samples from retail supermarket on culture, v-ddPCR and v-qPCR method. The Process Hygiene Criterion (PHC: log10 3.0) is marked with a black line.
Applsci 12 05315 g006
Table 1. Nucleotide sequence of oligonucleotides used in ddPCR.
AssayPrimer/ProbeSequence 5′→3′Amplicon
Size [bp]
Final Concentration in ddPCR [nM]Reference
C. jejuni
(target gene hipO 1)
hipO-fwTGCACCAGTGACTATGAATAACGA124
(according to Acc. No. NC_002163.1)
350He et al. [34]
hipO-reTCCAAAATCCTCACTTGCCATT350
hipO-pFAM 4—TTGCAACCT*CACTAGCAAAATCCACAGCT—IABkFQ 6,7200
C. coli
(target gene glyA 2)
glyA-fwCATATTGTAAAACCAAAGCTTATCGTG133
(according to Acc. No. AF136494.1)
350LaGier et al. [35]
glyA-reAGTCCAGCAATGTGTGCAATG350
glyA-pFAM 4—TAAGCTCCA*ACTTCATCCGCAATCTCTCTAAATTT—IABkFQ 6,7200
Internal PCR control
(target gene ntb2 3)
IPC-ntb2-fwACCACAATGCCAGAGTGACAAC125350Anderson et al. [36]
IPC-ntb2-reTACCTGGTCTCCAGCTTTCAGTT350
IPC-ntb2 probeHEX 5—CACGCGCAT*GAAGTTAGGGGACCA—IABkFQ 6,7200
1 hippurate hydrolase gene; 2 serine hydroxymethyltransferase gene; 3 methyltransferase gene of Nicotiana tabacum; 4 FAM: 6-carboxyfluorescein, 5 HEX: hexachlorofluorescein; 6 IABkFQ: 3′ Iowa Black® FQ (quencher); 7 = ZENTM (internal quencher).
Table 2. Spiking plan for the accuracy study. For each sample (A1 to A6), 3 mL chicken neck skin rinse were spiked with live- and dead-cell standards of C. jejuni and C. coli, respectively, in five biological replicates.
SampleLevel and Organic Matter Content of Meat Rinse/mLBacterial Contamination LevelC. jejuni/C. coli
Live CFU/mL
C. jejuni/C. coli
Dead Cells/mL
Biological Replicates
A1Low/12 mglow20020005
A2Low/12 mglow50050005
A3Low/12 mgmedium100010,0005
A4Low/12 mgmedium200020,0005
A5Low/12 mghigh500050,0005
A6Low/12 mghigh10,000100,0005
Table 3. Spiking plan for the trueness study. For each sample, 3 mL each of chicken neck skin, chicken breast, and turkey skin meat rinse were artificially contaminated with live- and dead-cell standards of C. jejuni and C. coli, respectively.
SampleMatricesLevel and Organic Matter Content of Meat Rinse/mLBacterial Contamination LevelC. jejuni/C. coli Live CFU/mLC. jejuni/C. coli Dead Cells/mLBiological Replicate
T1-LMChicken neck skin/Chicken breast/Turkey skinLow/8 mglow50050001
T2-LMLow/8 mglow100010,0001
T2-MMmedium/37–48 mglow100010,0001
T3-LMLow/8 mgmedium200020,0001
T4-LMLow/8 mgmedium500050,0001
T5-LMLow/8 mghigh20,000200,0001
T5-MMmedium/37–48 mghigh20,000200,0001
Table 4. Factorial design for the evaluation of technical uncertainty (7 factors).
Factor 1Factor 2Factor 3Factor 4Factor 5Factor 6Factor 7
DayScientistMastermixTime interval: DNA Extraction to generation of dropletsTime interval: Generation of droplets to PCR reactionTime interval: PCR reaction to Droplet readingCartridge for generation of droplets
day 1 vs. day 22 different Scientistswith vs. without dUTPimmediately vs. 3 nights freezingimmediately vs. after 30 minimmediately vs. overnight 4 °Cbatch 1 (Lot. C000112961) vs. batch 2 (Lot. C000114859)
Run 1day 11withimmediatelyimmediatelyimmediatelybatch 1
Run 2day 11with3 nights30 minovernightbatch 2
Run 3day 12without3 nightsimmediatelyimmediatelybatch 2
Run 4day 12withoutimmediately30 minovernightbatch 1
Run 5day 22with3 nightsimmediatelyovernightbatch 1
Run 6day 22withimmediately30 minimmediatelybatch 2
Run 7day 21withoutimmediatelyimmediatelyovernightbatch 2
Run 8day 21without3 nights30 minimmediatelybatch 1
Table 5. Spiking plan for the technical measurement uncertainty study. For each sample, chicken neck skins (low organic matter content of meat rinse, 12 mg) were artificially contaminated with live and dead cell standards.
SampleBacterial Contamination LevelC. jejuni Live CFU/mLC. jejuni Dead Cells/mLC. coli Live CFU/mLC. coli Dead Cells/mLTotal Live Cells/mLTotal Dead Cells/mLTotal Number of Spike for Eight Runs
TU1low15075050250200100026
TU2low1256253751875500250026
TU3Medium250125075037501000500018
TU4High375018,75012506250500025,00018
TU5High750037,500250012,50010,00050,00018
Table 6. Results of the accuracy profile study on chicken neck skin for C. jejuni [log10 live counts/mL].
SampleCentral Value Ref. Method
X i
Central Value Alt. Method
Y i
Absolute Bias
B i
Upper β-ETI
U i
Lower β-ETI
L i
Upper AL
+ A L
Lower AL
A L
A12.252.340.090.21−0.03+0.50−0.50
A22.552.750.200.320.08
A32.833.090.270.390.15
A43.183.300.120.240.00
A53.663.710.050.17−0.07
A63.944.030.090.21−0.03
Standard deviation of the reference method s r e f 0.068 log10 live counts/mL. Standard deviation of the alternative method s a l t 0.083 log10 live counts/mL. β-ETI: β-expectation tolerance interval expected to cover 80% of the future measurements, AL: acceptability limit, given as a difference between reference and alternative methods and set at ±0.50 log10 live counts/mL (ISO 16140-2:2016(E) [30]).
Table 7. Results of the accuracy profile study on chicken neck skin for C. coli [log10 live counts/mL].
SampleCentral Value Ref. Method
X i
Central Value Alt. Method
Y i
Absolute Bias
B i
Upper β-ETI
U i
Lower β-ETI
L i
Upper AL
+ A L
Lower AL
A L
A12.232.300.070.23−0.09+0.50−0.50
A22.702.780.080.24−0.08
A33.033.040.020.18−0.14
A43.363.460.100.26−0.06
A53.763.770.000.16−0.16
A63.924.020.090.25−0.07
Standard deviation of the reference method s r e f 0.068 log10 live counts/mL. Standard deviation of the alternative method s a l t 0.112 log10 live counts/mL. β;-ETI: β-expectation tolerance interval expected to cover 80% of the future measurements, AL: acceptability limit, given as a difference between reference and alternative methods and set at ±0.50 log10 live counts/mL (ISO 16140-2:2016(E) [30]).
Table 8. Absolute value of parameter effects. Significant effects (5%) are highlighted.
TypeEffectEstimate
Constant TermProportional Term
RandomRepeatability1.039 × 10−15.699 × 10⁻²
Run4.560 × 10−52.301 × 10⁻⁵
FactorialDay0.0050.113
Technician0.2370.054
Supermix0.2700.055
Cartridge0.0510.025
Time interval: extraction-droplet0.0670.086
Time interval: droplet-PCR0.0370.008
Time interval: PCR-reading0.1600.087
Table 9. Calculated RSD value for the technical uncertainty components—Supermix without dUTP.
Living Cells/mL Nominal ValueDayCartridgeTime Interval: Extraction to Droplet GenerationFactorial EffectsRecovery CorrectionRepeat-AbilityRunBinomial (Poisson)TotalTotal Minus Binomial
20016.4%5.7%37.0%42.2%16.5%28.0%0.0%58.0%78.7%53.3%
50014.6%5.2%27.6%32.4%11.5%22.7%0.0%36.7%55.2%41.2%
100013.4%4.9%20.9%25.8%8.3%19.1%0.0%25.7%42.0%33.2%
500011.8%4.5%7.6%14.8%7.7%13.5%0.0%12.1%24.7%21.5%
10,00011.6%4.5%4.6%13.3%10.5%12.9%0.0%9.4%23.3%21.3%
Table 10. Calculated RSD value for the technical uncertainty components—Supermix with dUTP.
Living Cells/mL Nominal ValueDayCartridgeTime Interval: Extraction to Droplet GenerationFactorial EffectsRecovery CorrectionRepeat-AbilityRunBinomial (Poisson)TotalTotal Minus Binomial
20038.2%6.9%11.4%41.2%17.8%25.2%0.0%55.1%75.4%51.5%
50029.5%5.3%11.4%32.6%12.6%19.7%0.0%34.8%53.1%40.1%
100023.6%4.1%11.4%26.9%9.0%15.8%0.0%24.5%40.7%32.5%
500013.7%1.5%11.4%18.1%5.5%8.9%0.0%11.4%23.8%20.9%
10,00012.4%1.0%11.4%17.0%7.8%7.9%0.0%8.6%22.1%20.3%
Table 11. Obtained technical uncertainty for Supermix with dUTP.
Living Cells/mL
Nominal Value
Technical Uncertainty
(One Replicate) in %RSD
Technical Uncertainty
(One Replicate)
in log10
Technical Uncertainty
(Two Replicates) in %RSD
Technical Uncertainty
(Two Replicates)
in log10
20075.40.3260.80.26
50053.10.2344.10.19
100040.70.1734.50.15
500023.80.1021.10.09
10,00022.10.0919.70.08
Publisher’s Note: MDPI stays neutral with regard to jurisdictional claims in published maps and institutional affiliations.

