Technical Note

Seismic Response and Damage Analysis of an Isolated Bridge Subjected to Near-Fault Ground Motion

Department of Civil Engineering, North University of China, Taiyuan 030051, China
*
Authors to whom correspondence should be addressed.
Appl. Sci. 2022, 12(10), 4878; https://doi.org/10.3390/app12104878
Submission received: 18 April 2022 / Revised: 9 May 2022 / Accepted: 10 May 2022 / Published: 11 May 2022
(This article belongs to the Topic Advances in Dynamics of Building Structures)

Abstract

:
In this study, the seismic response and damage behavior of an isolated bridge under near-fault ground motion are studied and compared with the non-isolated bridge. To consider the local damage of the bridge pier and its evolution process, the nonlinear behavior of the bridge pier in the analysis is simulated by the fiber beam-column element model combined with the damage constitutive model of steel and concrete materials. The mechanical behavior of the isolation bearing is simulated by the three-dimensional isolation bearing model that can consider the instability and failure of the bearing. It is found that the isolation bearings do not work, and even amplify the seismic response of the bridge (pier displacement and pier shear) under the near-fault ground motion. This amplification also leads to more severe damage to the piers of the isolated bridge. In the case of the analyzed concrete bridge type and near-fault earthquake data, it can be concluded that the used isolating lead rubber bearings should not be recommended. In general, it can be stated that the selection of the types of bridge bearings in near-fault areas should always be analyzed in detail by designers in order to avoid unintentional amplifying of the bridge’s seismic response.

1. Introduction

The earthquake damage investigation found that reinforced concrete piers would suffer severe damage or even collapse under near-fault ground motions [1,2,3,4]. CAO [5] studied the damage to piers under near-fault ground motions and found that more than 91% of the 200 near-fault ground motions caused the piers to collapse, while far-fault motions rarely caused the piers to collapse. More severe damage often occurs in engineering structures in near-fault zones. Isolation bearings can effectively reduce the seismic response of structures, and have been used widely. However, In the 1999 Duzce earthquake in Turkey, the seismic isolation system of the Bolu Viaduct completely failed [6]. Then, under near-fault ground motions, the applicability of seismic isolation bearings has attracted more attention.
Under near-fault ground motions, the isolated bridges will be damaged due to the large displacement of the bearings [7]. Wang et al. [8] found that compared with far-fault motions, the displacement of the isolation bearings under near-fault motions will increase significantly. Similarly, Shen et al. [9] found that the isolation bearing has a more significant displacement requirement under near-fault motions. Karalar et al. [10] suggested that energy dissipation devices should be installed to reduce the displacement of the isolation device under near-fault motions. Dicleli [11] provided an elastic-gap device to decrease the isolator displacements under near-fault ground motions. Zheng et al. [12] found that a sliding-lead rubber bearing isolation system can reduce the base forces of the piers, and employing the shape memory alloy devices can reduce the peak displacement of the isolation system. Liao et al. [13] found that the PGV/PGA ratio of near-fault ground motions has a significant influence on bridge response. The effect of the isolation bearing to reduce the shear force of the pier is not evident under near-fault ground motions. Jalali et al. [14,15] analyzed the response of a three-span bridge with mid-span isolation under near-field pulse-like ground motion and studied the difference between parallel fault and vertical fault ground motions to the structural response. Ismail et al. [16] found that the roll-in-cage isolator had a good seismic isolation effect under near-field and pulse-like ground motions. Jiang et al. [17] studied the pulse effect on the isolator optimization of bridges in near-fault zones. Most current studies focus on the seismic response of isolated bridges under near-fault and far-fault ground motions. There are few studies on the local damage state, damage evolution process, and potential failure modes of the isolated and non-isolated bridges.
The main purpose of this paper is to study the seismic response and damage evolution process of the isolated and non-isolated bridges under near-fault ground motion and then to explore the failure modes of bridges. Based on the Refined Simulation and Analysis Platform for Structures (RSAPS) [18] developed previously, the fiber beam-column element model combined with the previously established damage constitutive model of steel and concrete materials [19] is used to simulate the nonlinear mechanical behavior and damage behavior of the piers. The isolation bearing model, with the horizontal bi-directional coupling effect and bearing instability failure considered, is used to simulate the nonlinear mechanical behavior and failure behavior of the isolation bearing. Then, the damage analysis model of the reinforced concrete bridge is established. The TCU068 ground motion of the Chi-Chi earthquake obtained from the Pacific Earthquake Engineering Research Center database [20] was selected as the input of the near-fault ground motion to study the seismic response and damage of non-isolated and isolated bridges. The present study can provide a theoretical basis for the seismic and isolation design of bridges in near-fault areas.

2. Finite Element Model of Bridge

In this paper, the simulation analysis platform RSAPS [18] was used to simulate the seismic response of bridges. The RSAPS platform was established based on the subroutine (UEL) interface of the general finite element software ABAQUS. It mainly includes the fiber beam-column element model, isolation element model, and various material constitutive models of concrete and steel. Good simulation results and computational efficiency have been achieved in the static and dynamic nonlinear behavior simulation of reinforced concrete members. The specific bridge model is established as follows.

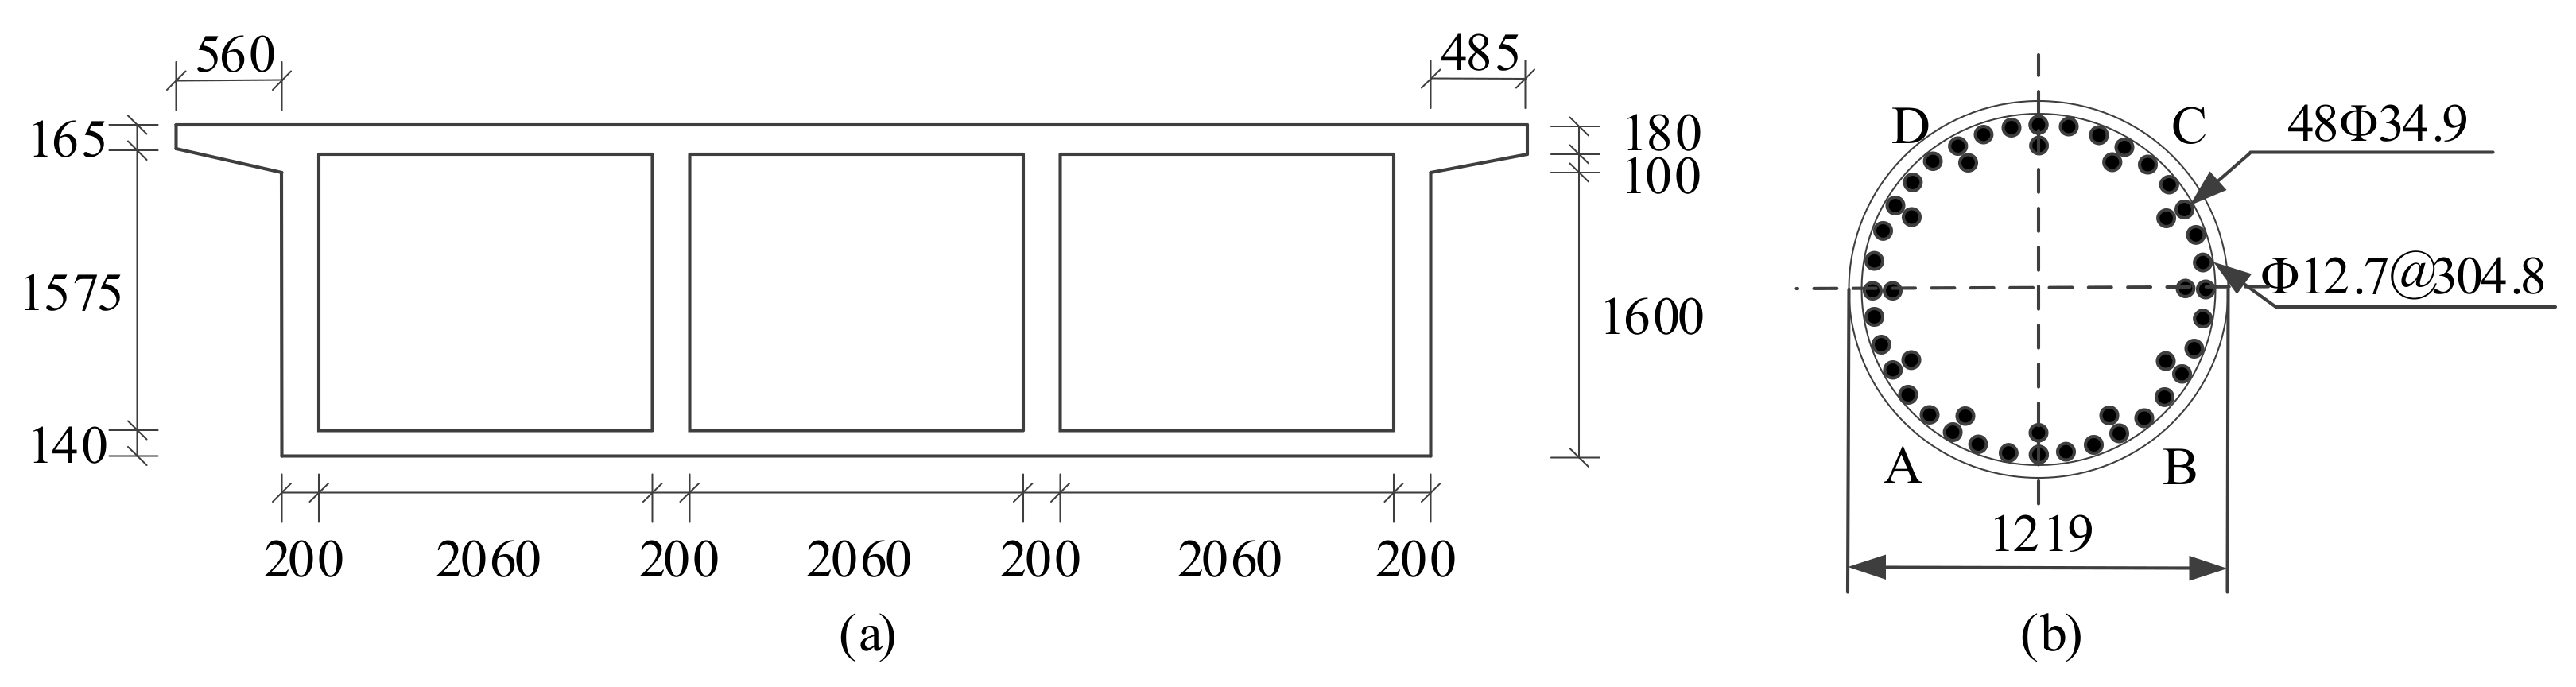
2.1. Analysis Model of the Bridge

The analysis model of the bridge [18] is shown in Figure 1. The bridge is a continuous girder bridge with a span of 30 m and 5 spans. The girder adopts a single box and three chambers section with a height of 1.88 m and a width of 8.025 m. The pier height is 6.6 m, and the diameter is 1.219 m. The section of the girder and the pier is shown in Figure 2.
The actual bridge girders are mostly prestressed reinforced concrete structures, and seldom undergo plastic deformation or damage behavior under earthquake ground motions. In the analysis, the linear elastic beam element is used to simulate the girders, and each span is divided into 15 elastic beam elements. The pier will show strong nonlinear behaviors, such as plasticity and damage under earthquake ground motions, and it is simulated using the fiber beam-column element.
LRB700-140 isolation bearings are selected in the isolated bridge [18]. The LRB bearing (shown in Figure 3a) diameter is 700 mm, the lead diameter is 140 mm, the total thickness of the rubber layer is 110 mm, and the total thickness of the steel plate layer is 75 mm. The pre-yield stiffness of the bearing is 17.771 kN/mm, the post-yield stiffness is 1.367 kN/mm, and the yield force is 94.2 kN. The design critical load is 4618 kN. The LRB bearings are simulated by the isolation elements. The laminated bearings (shown in Figure 3b) can be used in the non-isolated bridge. In the analysis, the laminated bearings are simulated by the linear spring elements [21,22]. The pre-yield stiffness of the LRB bearing is taken as the spring constant (the stiffness of the bearing) [18,22].

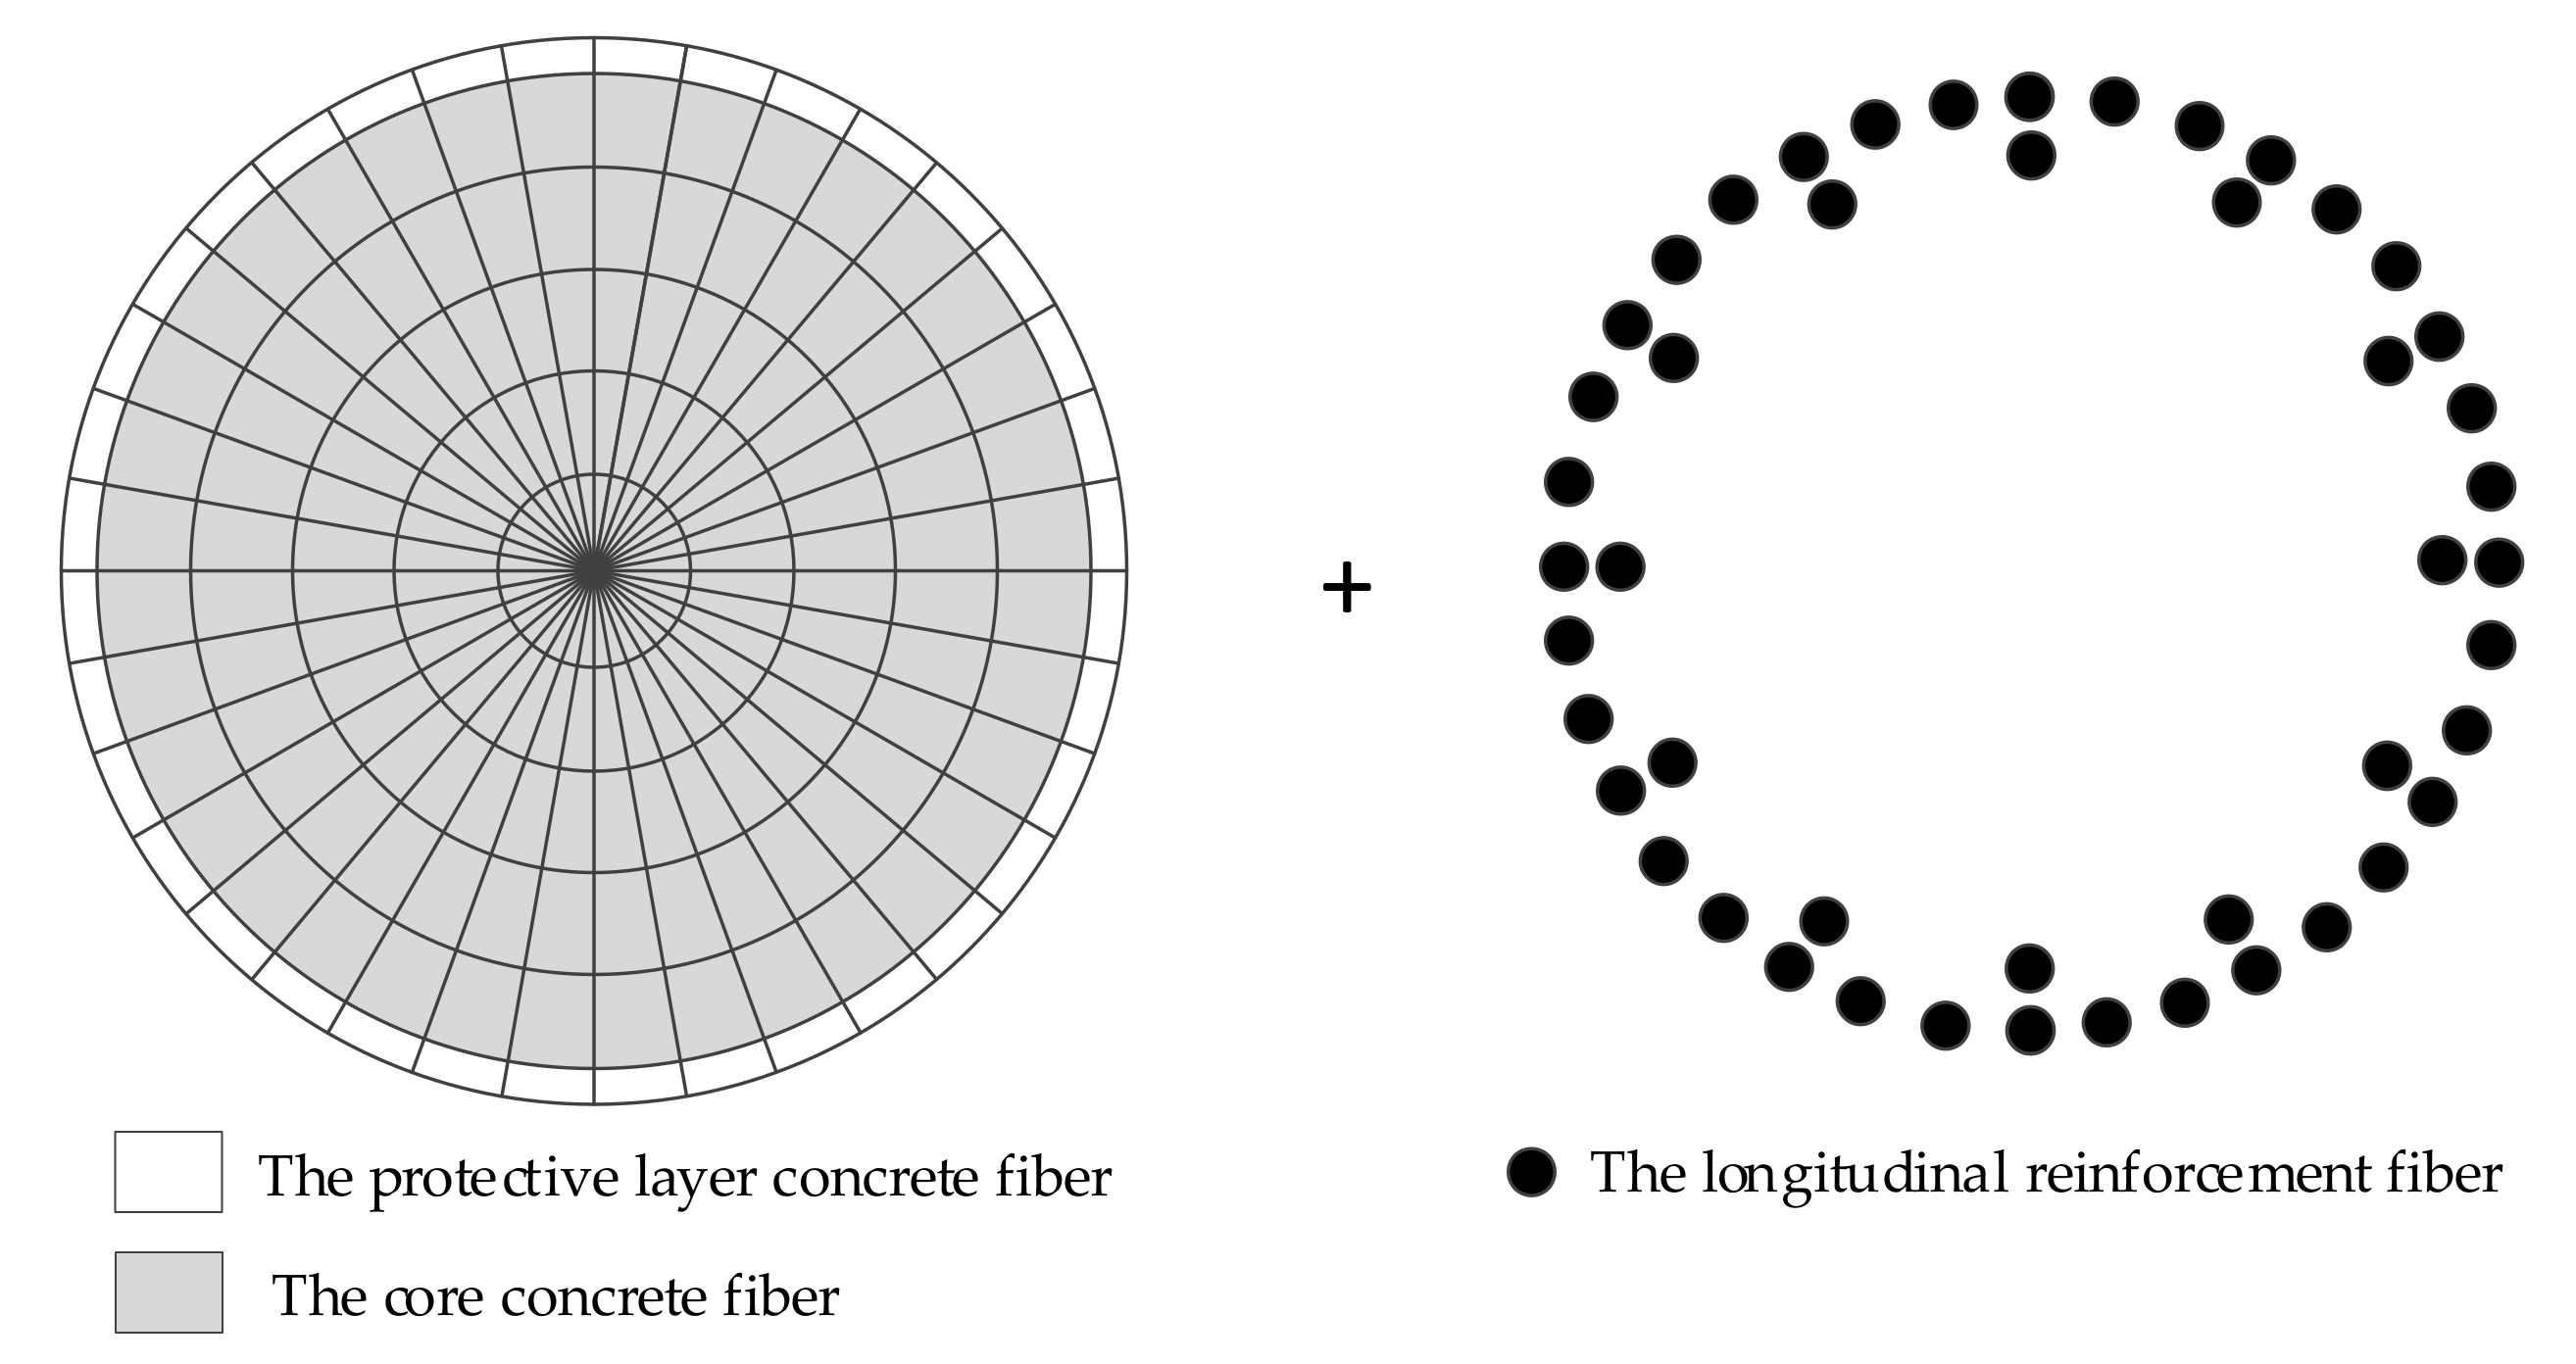
2.2. Pier Analysis Model

In the pier analysis model, each pier is divided into six fiber beam-column elements along with the height. Each element adopts 4 Gauss–Lobatto integral sections. Each section is divided into 48 longitudinal reinforcement fibers and 216 concrete fibers, including 180 core concrete fibers and 36 protective layer concrete fibers. The cross-section fiber discretization method is shown in Figure 4.

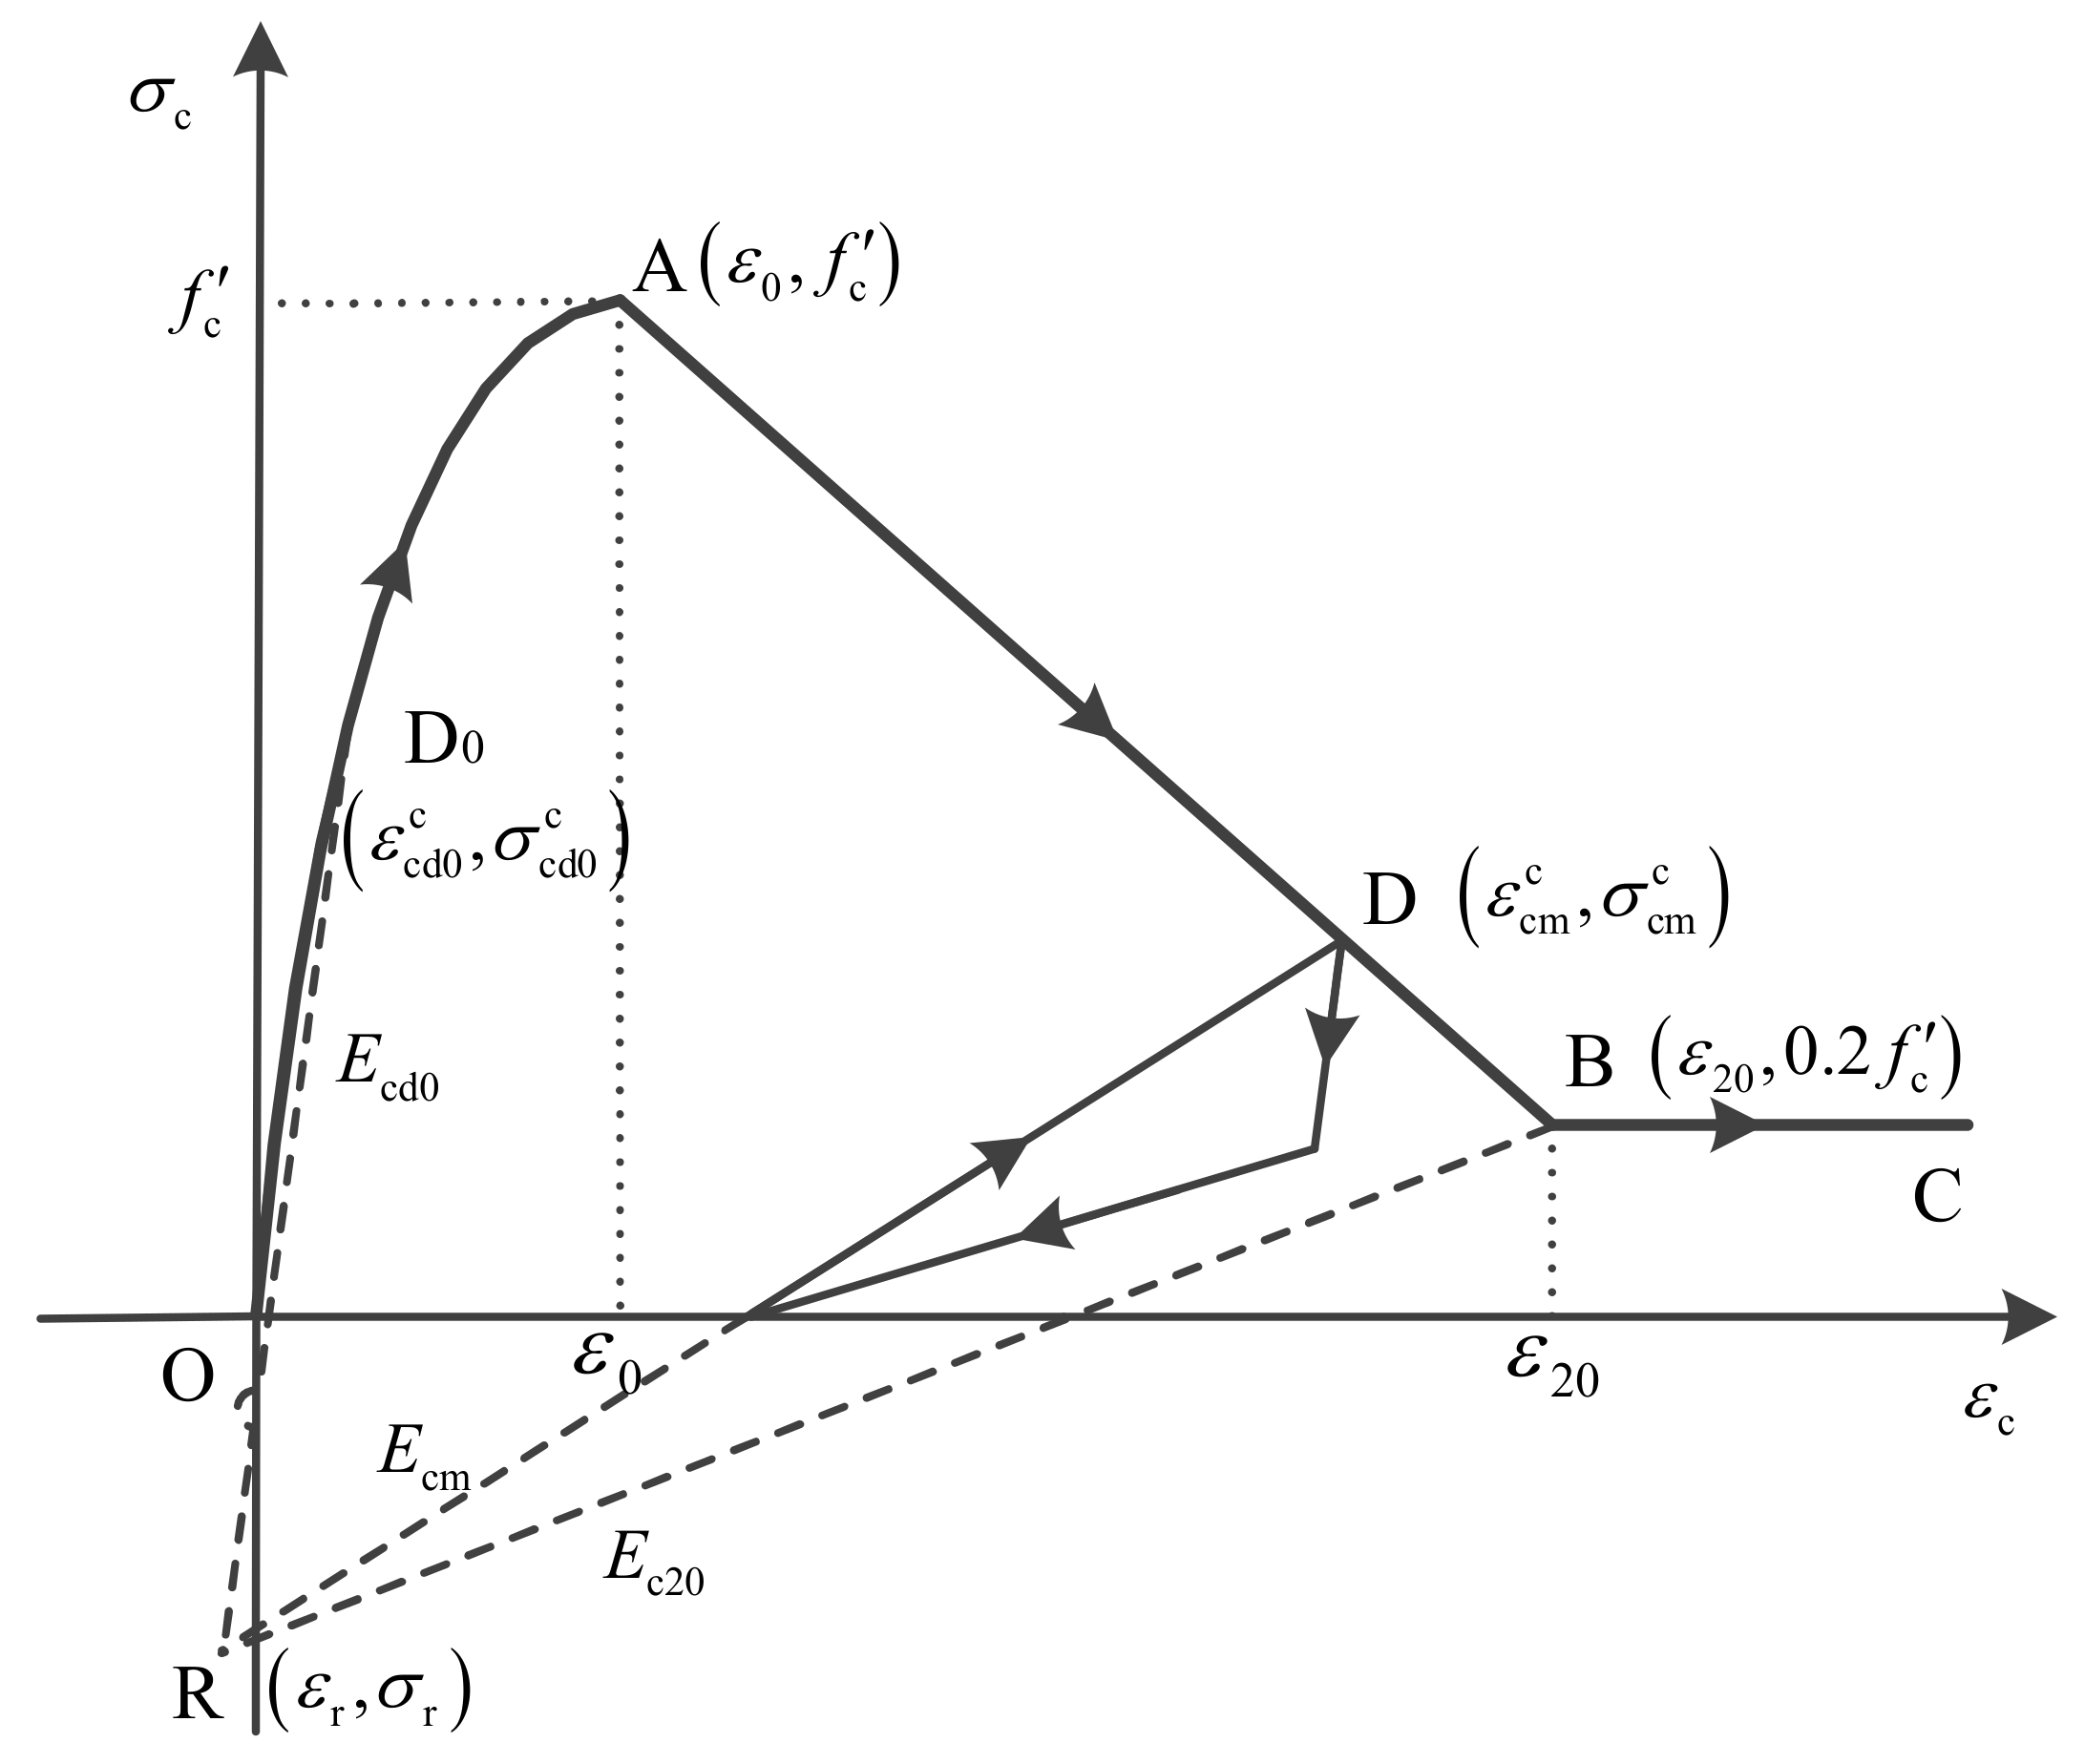
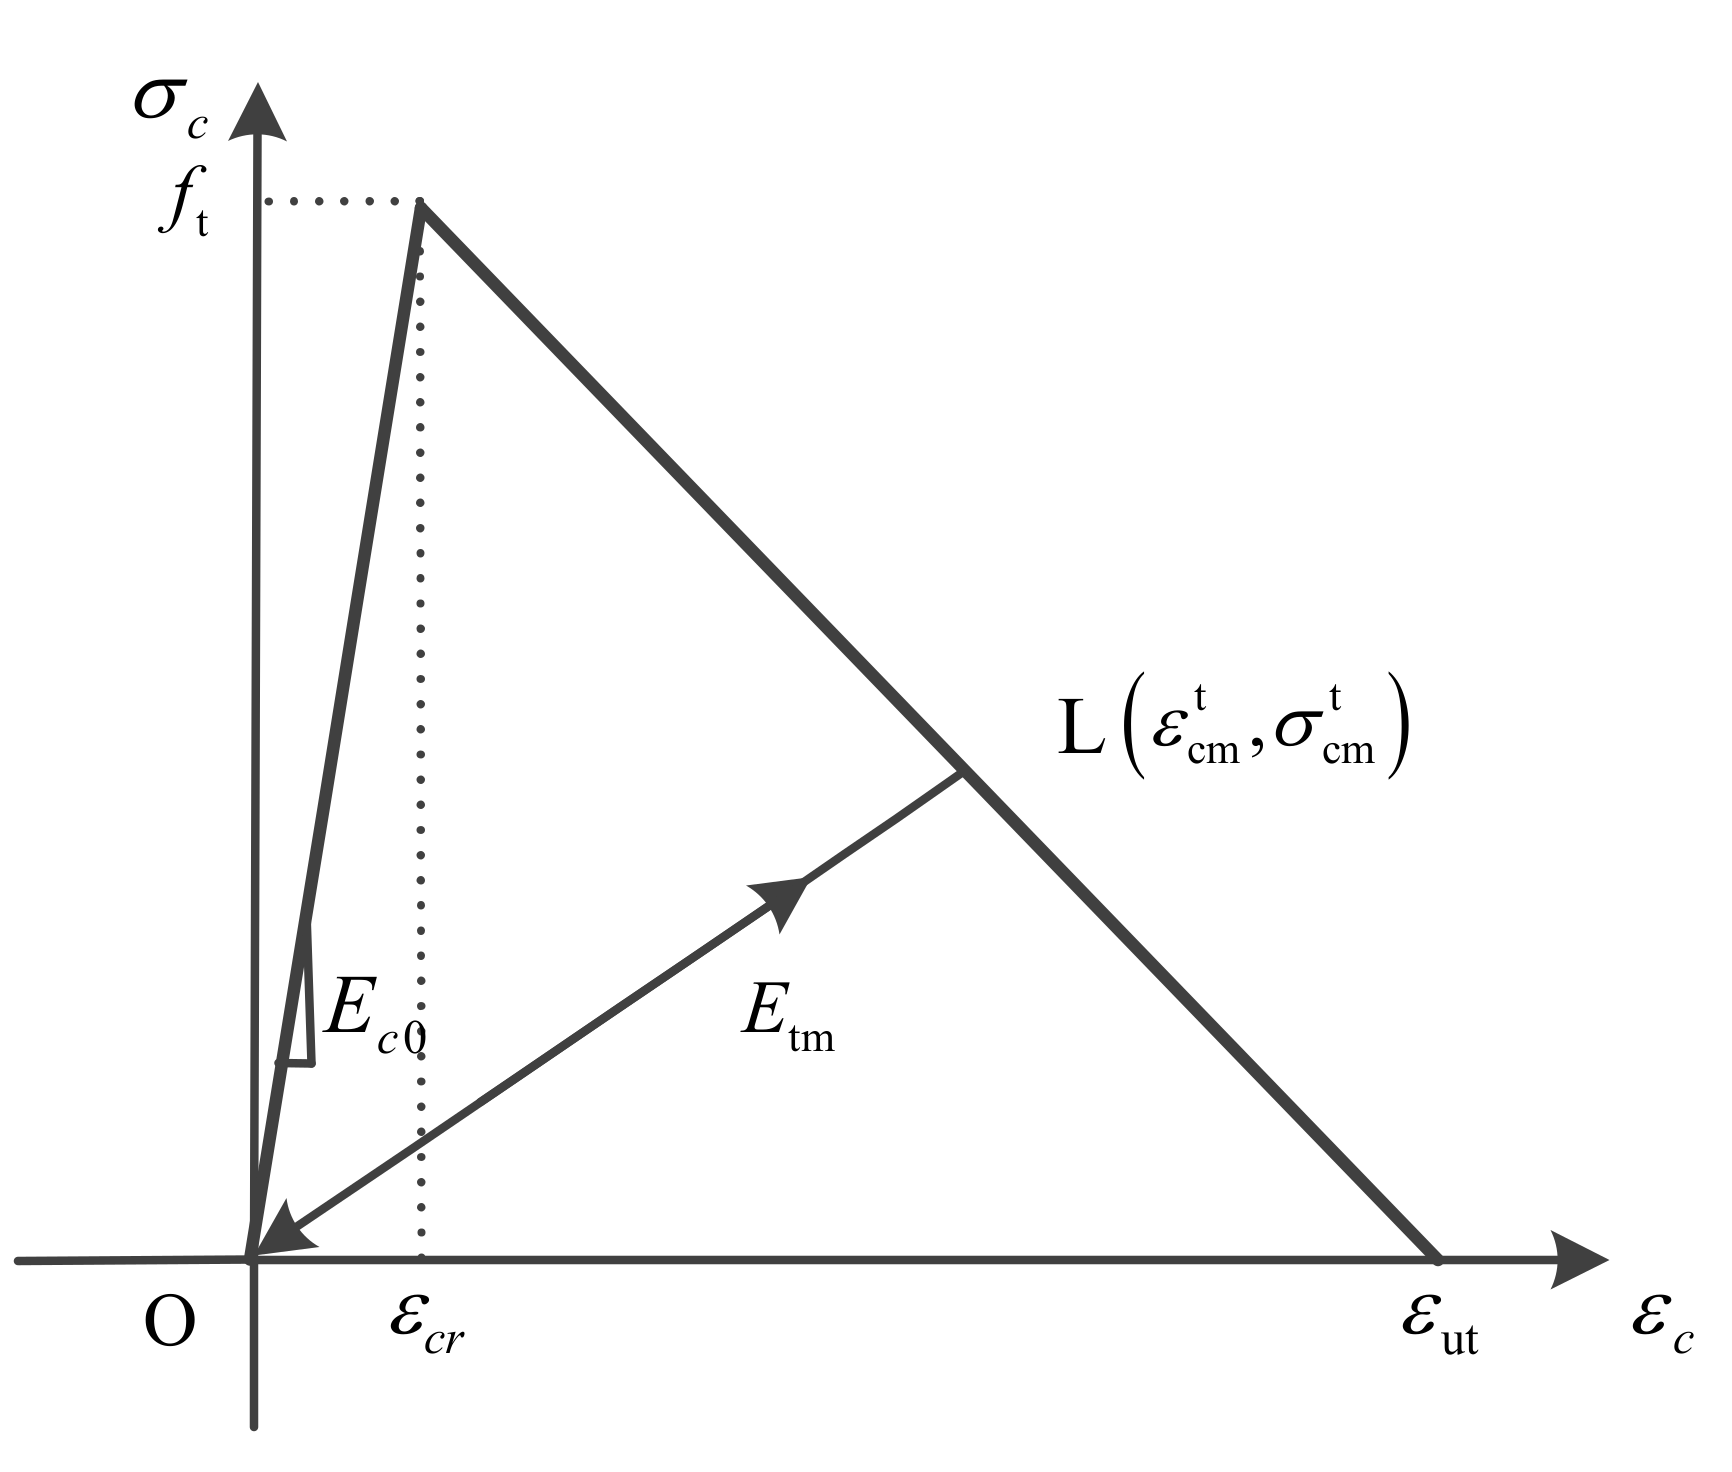
2.2.1. Constitutive Model for Concrete Material

Yassin’s uniaxial concrete model [23] is implemented in the analysis (Figure 5). The model has high simulation accuracy and computational efficiency. The stirrup constraint effect can be simulated by modifying the characteristic parameters of concrete materials.
To consider the damage behavior in the uniaxial constitutive model of concrete, Chen [19] used the tensile and compressive damage indices of concrete to describe the tensile and compressive damage of concrete, respectively.
The calculation method of compression damage index D c is as follows:
D c = 0 ε cm c < ε cd 0 c E cd 0 E cm E cd 0 E c 20 ε cd 0 c ε cm c 1 ε 20 < ε cm c . ε 20
where, E cd 0 = σ cd 0 c σ r / ε cd 0 c ε r is the initial compression damage modulus, determined according to the compression damage starting point D 0 ε cd 0 c , σ cd 0 c and the point R ε r , σ r ; E cm = σ cm c σ r / ε cm c ε r is the modulus of the current unloading point, determined according to the unloading point D ε cm c , σ cm c and the point R ε r , σ r .
The tensile damage index D t is calculated as follows:
D t = 0 ε cm t < ε cr E c 0 E tm E c 0 ε cr ε cm t 1 ε ut < ε cm t . ε ut
where, ε cm t is the strain at the current unloading point (shown in Figure 6); ε cr is the strain corresponding to the peak tensile stress; ε ut is the ultimate tensile strain; E c 0 is the initial tangent modulus; E tm is the secant modulus of the current unloading point.
The parameters of the concrete material are shown in Table 1.

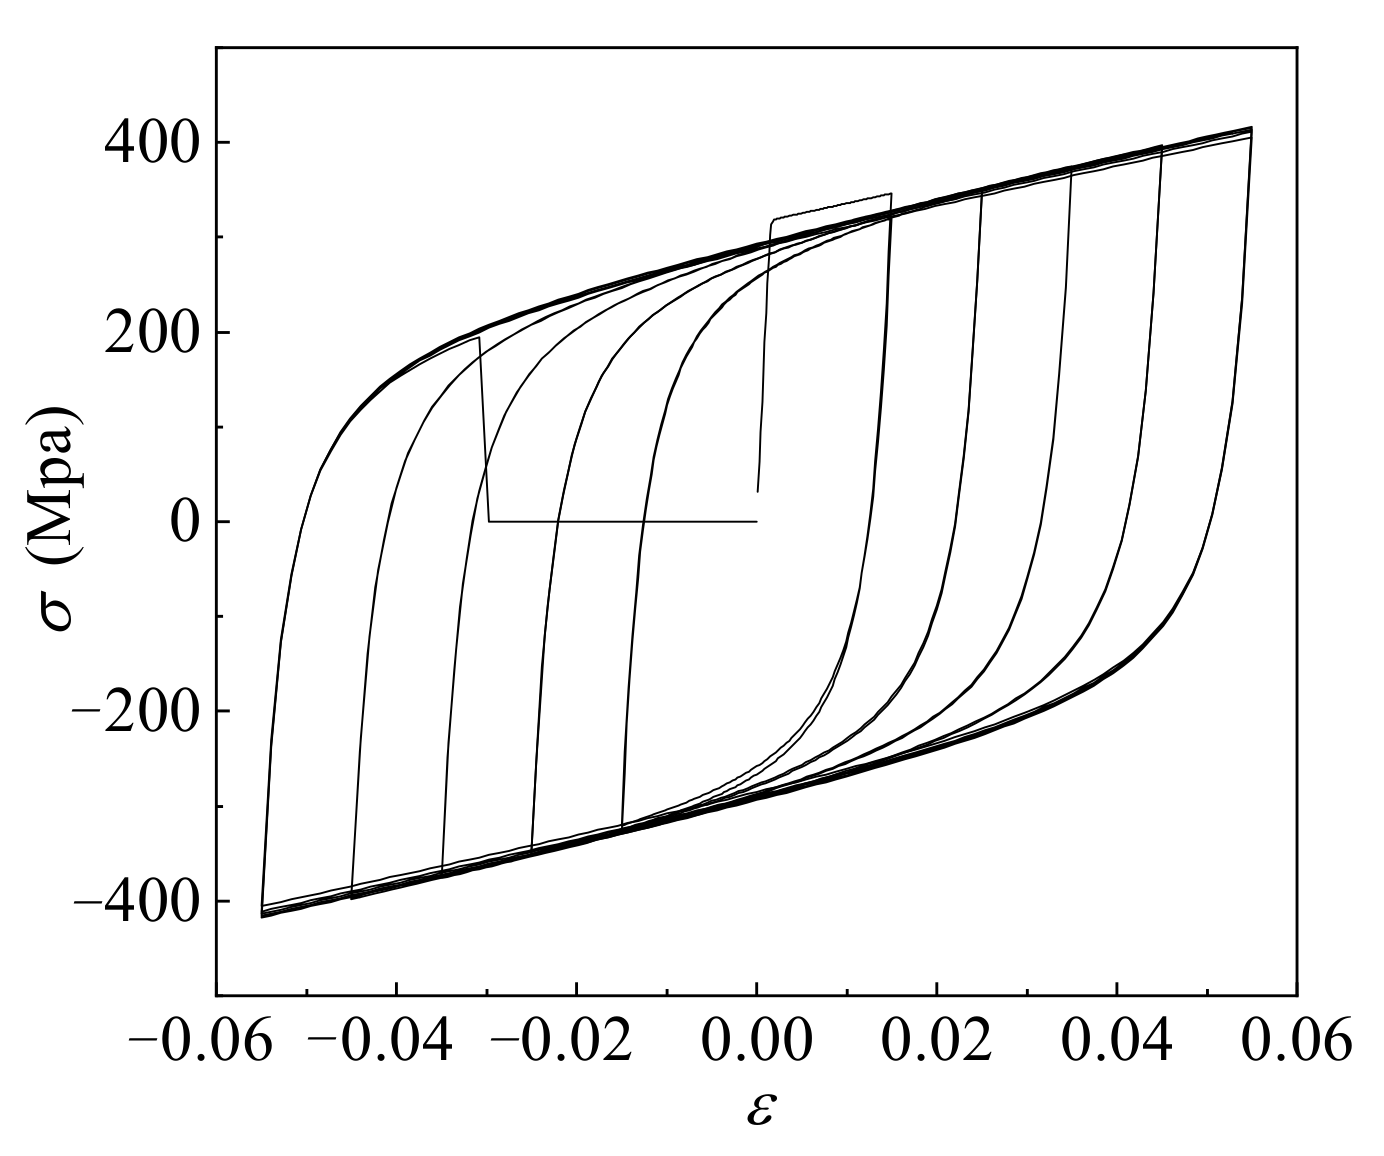
2.2.2. Constitutive Model for Steel Material

In the analysis, the modified Menegotto–Pinto constitutive model [24] was used for modeling the stress–strain relationship between steel bars. The model was proposed by Menegotto and Pinto and modified by Filippou et al. [25] to consider the isotropic strengthening effect. The Bauschinger effect, under cyclic loads, is considered in the model. The modified model is in good agreement with experimental results and has high solution efficiency, so it has been widely used.
Chen [19] introduced the Bonora damage model [26] modified by Pirondi and Bonora [27] into the modified Menegotto–Pinto constitutive model. The modified Bonora damage model can simulate the damage behavior of steel under cyclic loads and has a high simulation accuracy. The damage index in the Bonora damage model is calculated as follows:
D ˙ = α ( D cr D 0 ) 1 / α ln ε cr ln ε th f ( σ m σ eq ) ( D cr D ) α 1 / α d p p .
where, D ˙ is the damage increment; D is the cumulative damage value; D 0 is the initial damage value; D c r is the critical damage value; ε cr is the critical strain corresponding to the critical damage value; ε th is the threshold strain for the start of damage; d p is equivalent plastic strain increment; p is equivalent plastic strain; α is the damage parameter; f ( σ m σ eq ) is the influence factor in the triaxial stress state, and is taken as 1 for the uniaxial constitutive model. The parameters used in this study are selected according to reference [26].
The parameters of the steel material are shown in Table 2.
The stress–strain relationship of the steel material is shown in Figure 7.

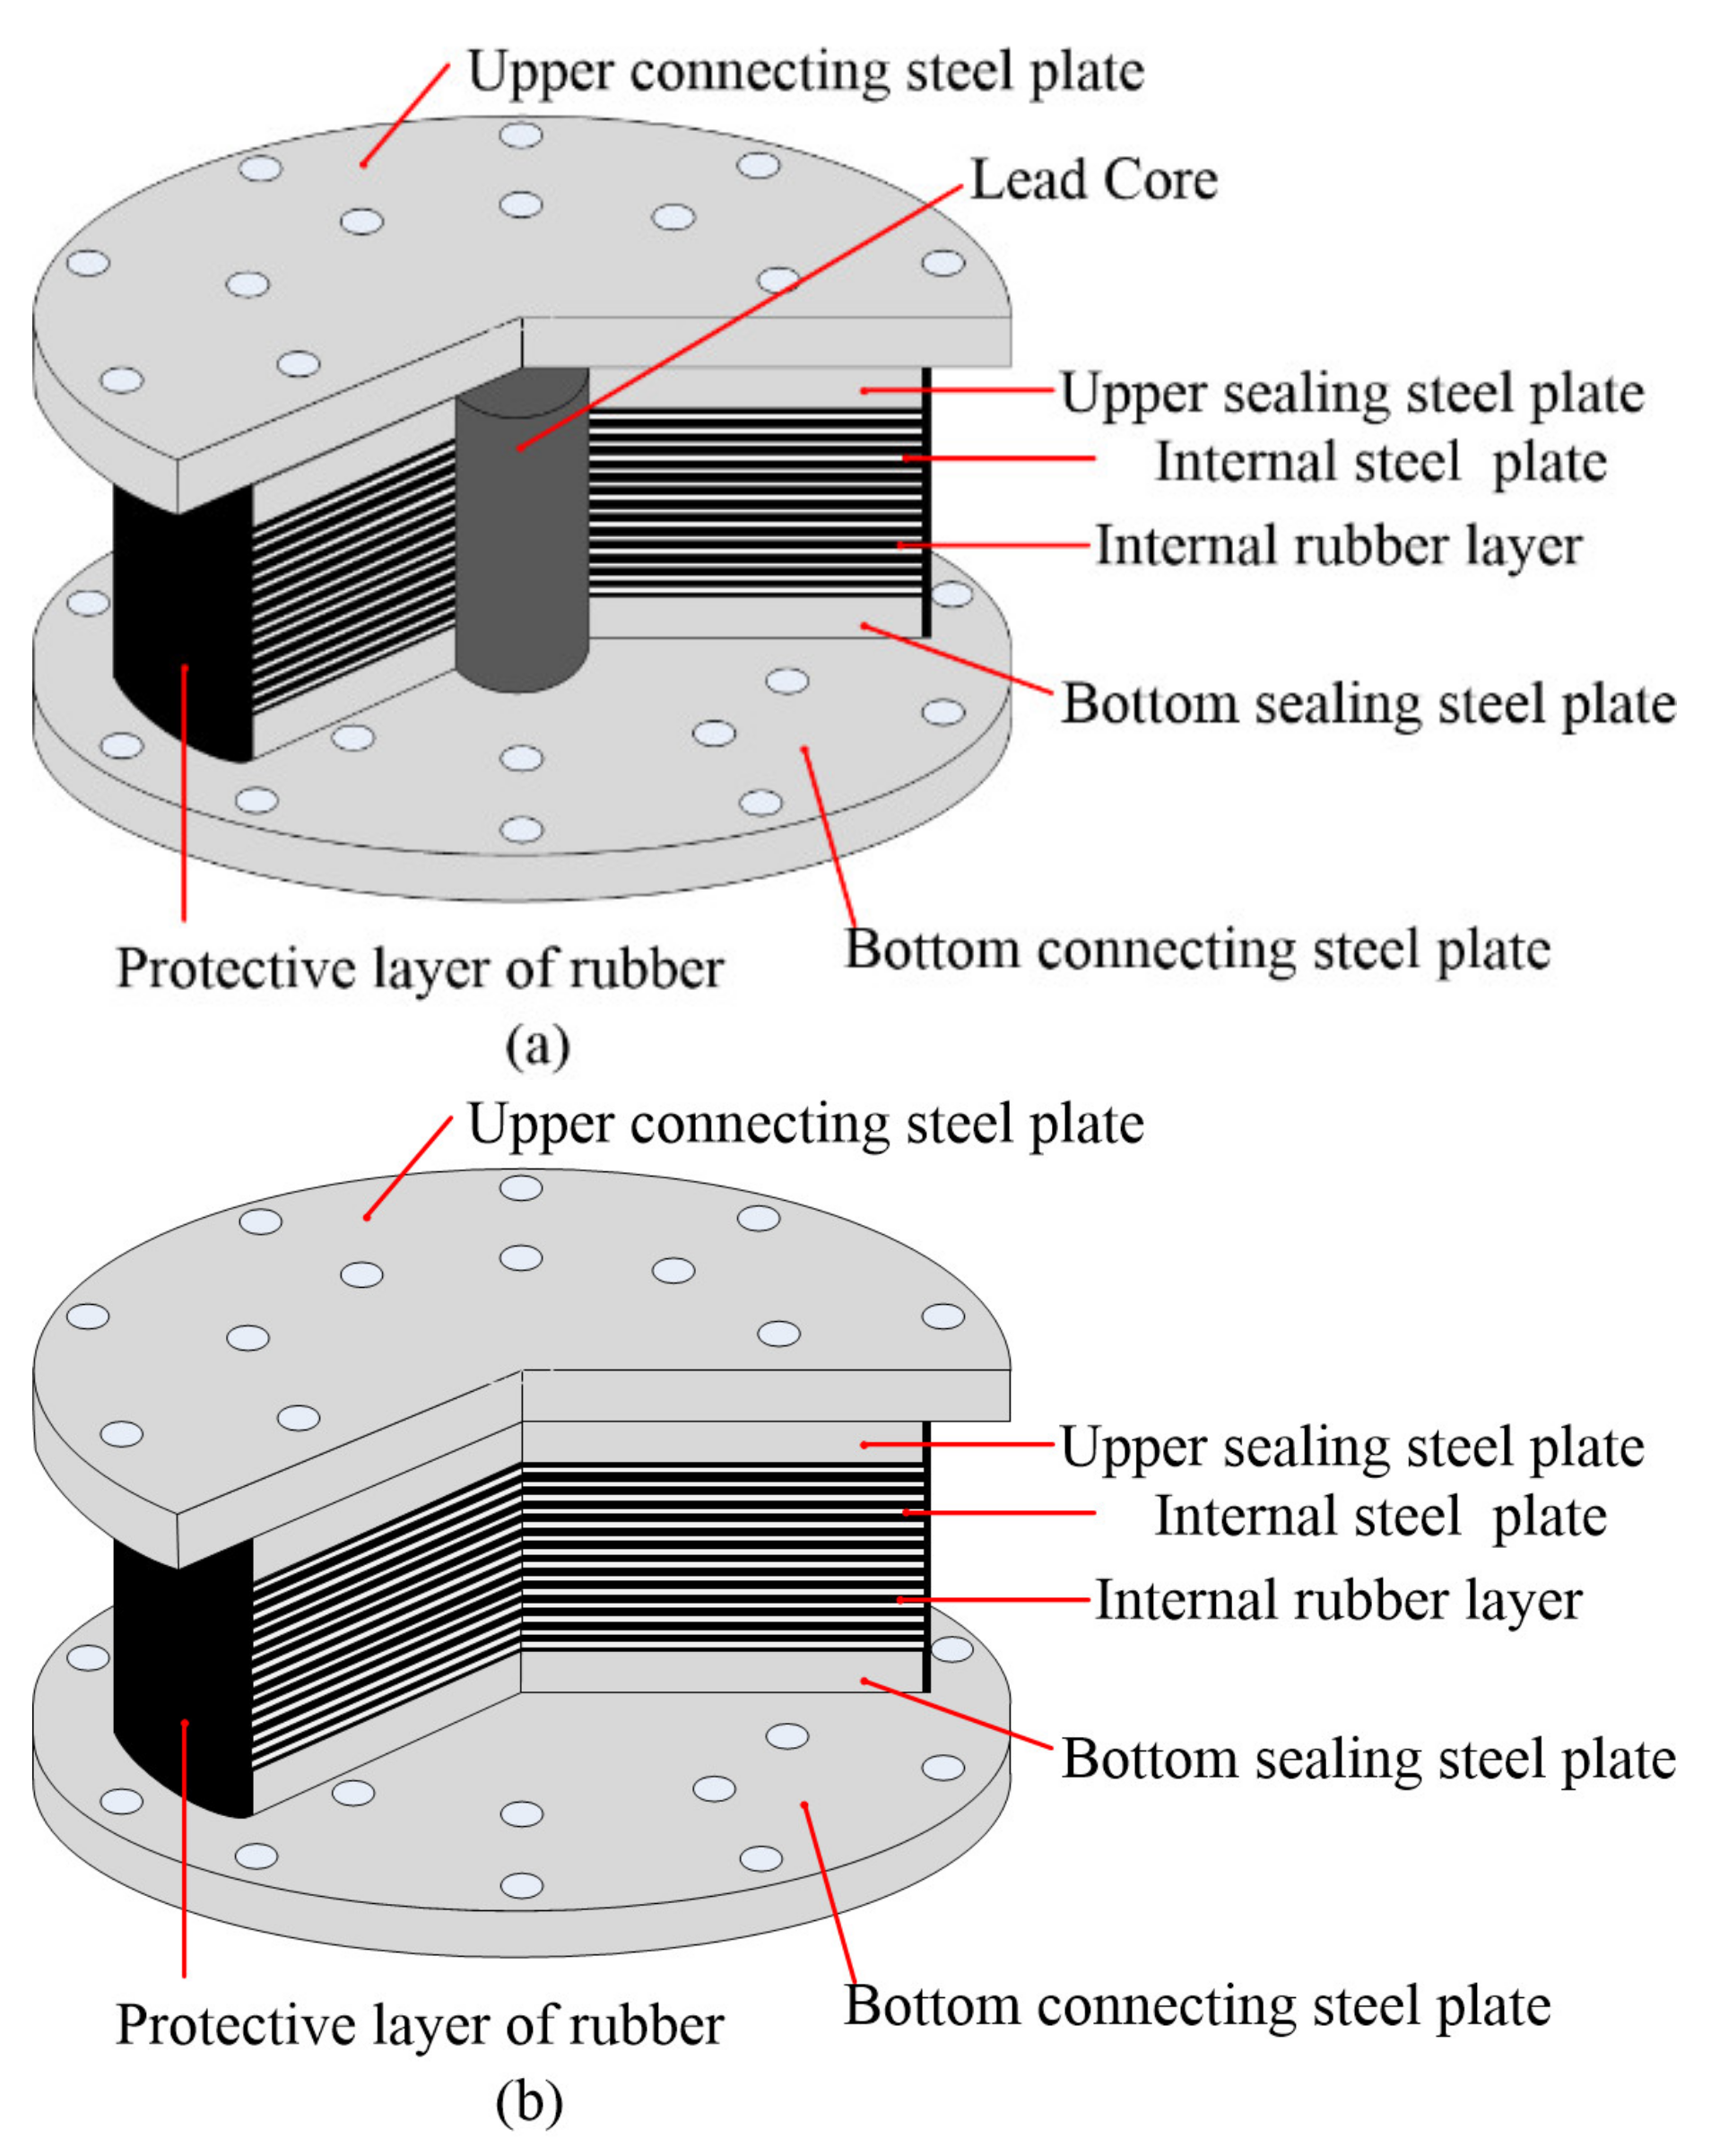
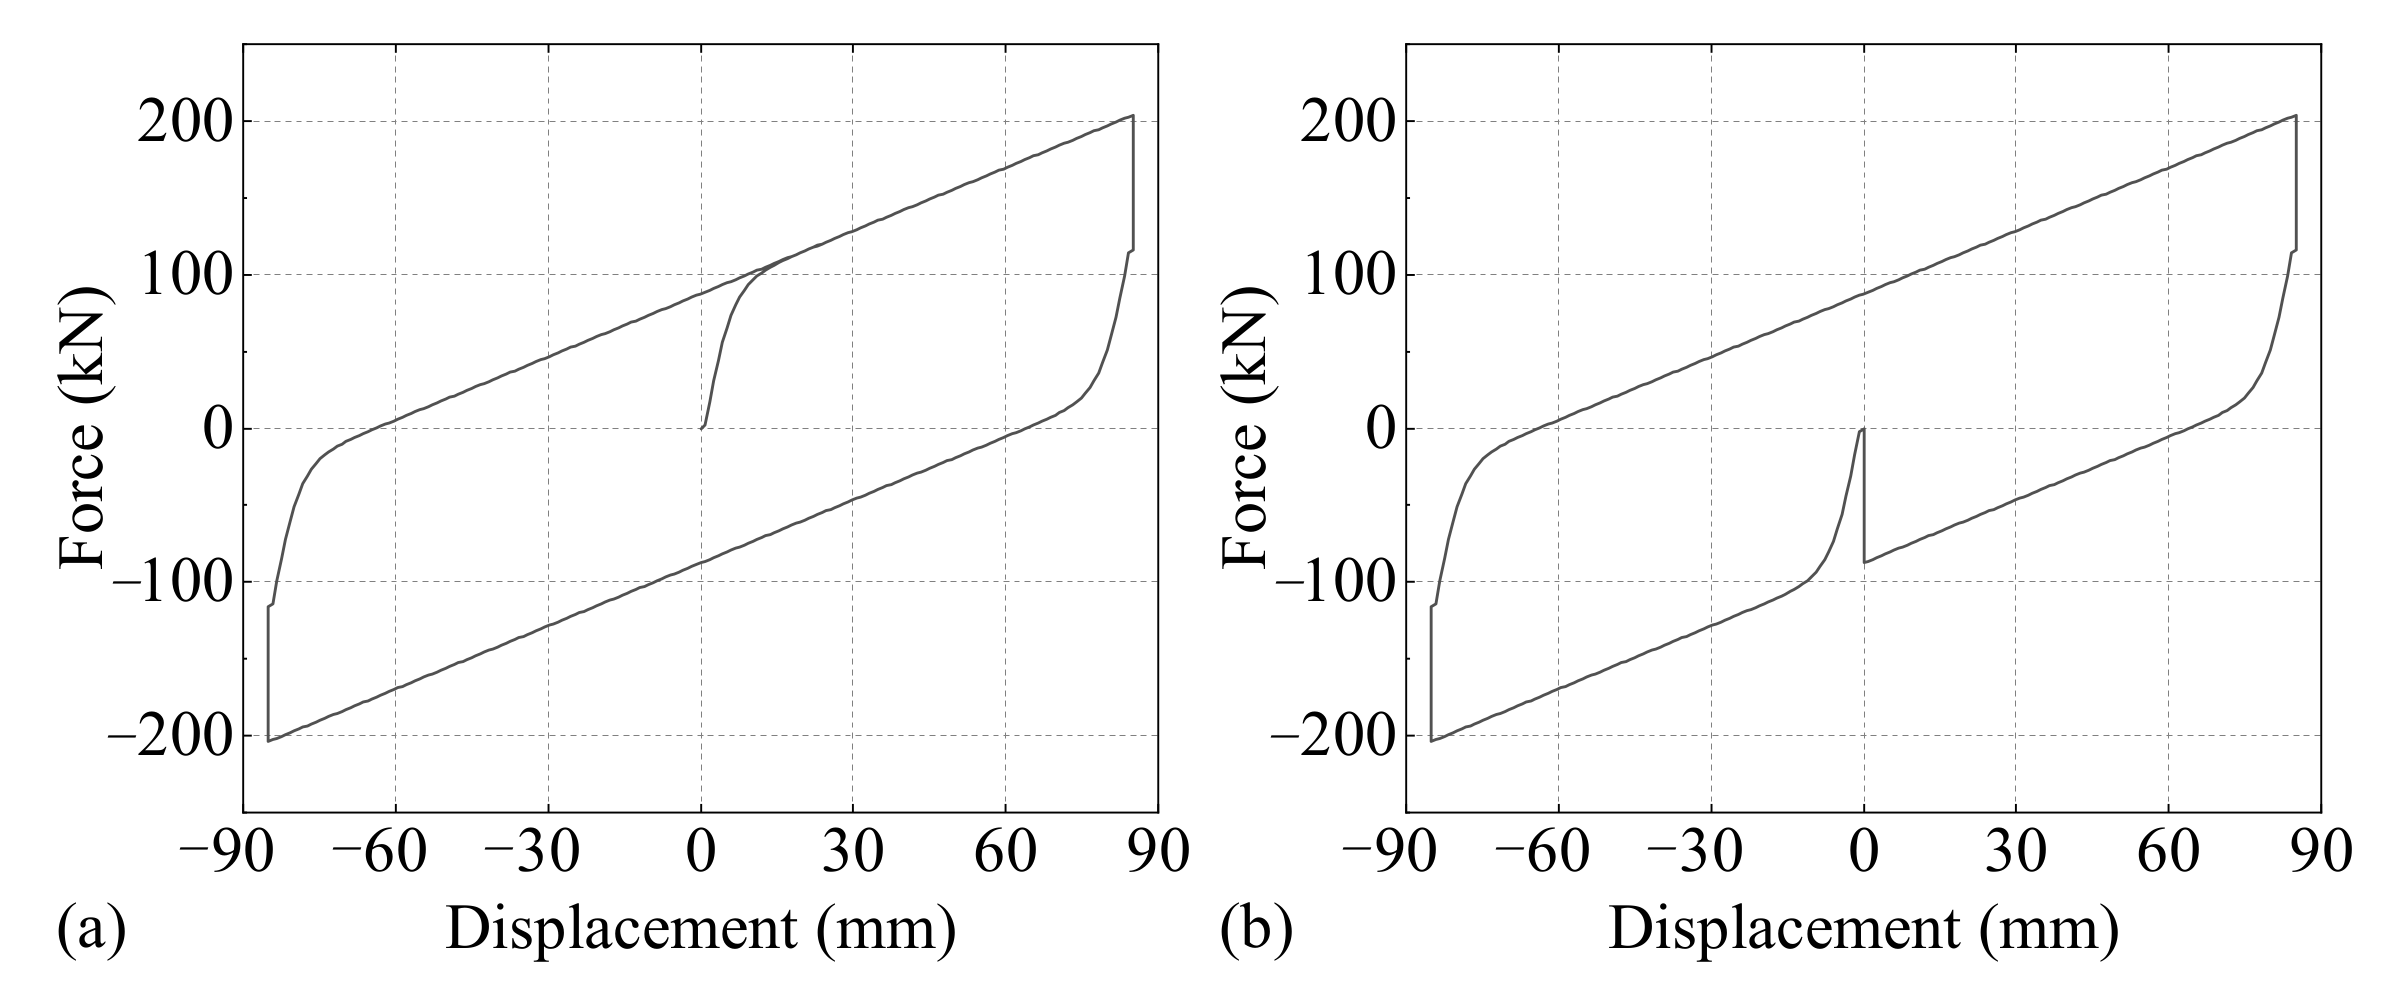
2.3. Bearing Analysis Model

The LRB isolation element model, developed by Li et al. [28], was used in this analysis. The horizontal bi-directional coupling effect can be considered using the Bouc–Wen model improved by Casciati [29]. The restoring force is calculated as follows:
F 1 F 2 = α k b U 1 U 2 + 1 α F y Z 1 Z 2 + c b U ˙ 1 U ˙ 2 .
where F 1 and F 2 are the restoring forces of lead rubber bearings in the X-direction and the Z-direction, respectively; U 1 and U 2 represent the relative displacement of the lead rubber bearing in the X-direction and the Z-direction, respectively; α is the ratio of post-yield stiffness to pre-yield stiffness; k b is the initial stiffness (pre-yield stiffness); c b is viscous damping of lead rubber bearings; Z 1 and Z 2 are hysteretic displacements in the X-direction and the Z-direction, respectively, satisfying the following relationship:
U y Z ˙ 1 Z ˙ 2 = G U ˙ 1 U ˙ 2 ,
G = A β sgn U ˙ 1 Z 1 + U ˙ 2 Z 2 Z 1 2 γ Z 1 2 β sgn U ˙ 1 Z 1 + U ˙ 2 Z 2 Z 1 Z 2 γ Z 1 Z 2                 β sgn U ˙ 1 Z 1 + U ˙ 2 Z 2 Z 1 Z 2 γ Z 1 Z 2 A β sgn U ˙ 1 Z 1 + U ˙ 2 Z 2 Z 2 2 γ Z 2 2 .
where: U y is the yield displacement of lead rubber bearing; A , γ , and β are parameters that control the shape and size of the restoring force–displacement hysteresis loop of the lead rubber bearing, generally taking 1, 0.5 and 0.5, respectively; sgn is a symbolic function.
The restoring force–displacement relationship of the isolation bearing model is shown in Figure 8.
The force of the LRB isolation element model in the vertical direction (Y-direction) is calculated as follows:
F v = K v · U v .
where: F v is the vertical force of the lead rubber bearing; K v is the vertical stiffness of the lead rubber bearing; U v is the vertical displacement of the lead rubber bearing.
The overlap area method [30] is used to determine the bearing capacity (critical load) of the bearing under a given lateral displacement:
P c r = A r A b P c r .
where: P c r is the bearing capacity (critical load) of lead rubber bearing considering the influence of lateral displacement; A r is the area of the overlapping part of the upper and lower sections of the bearing; A b is the cross-sectional area of lead rubber bearing; P c r is the bearing capacity (critical load) of lead rubber bearing without lateral displacement.

3. Results and Discussion

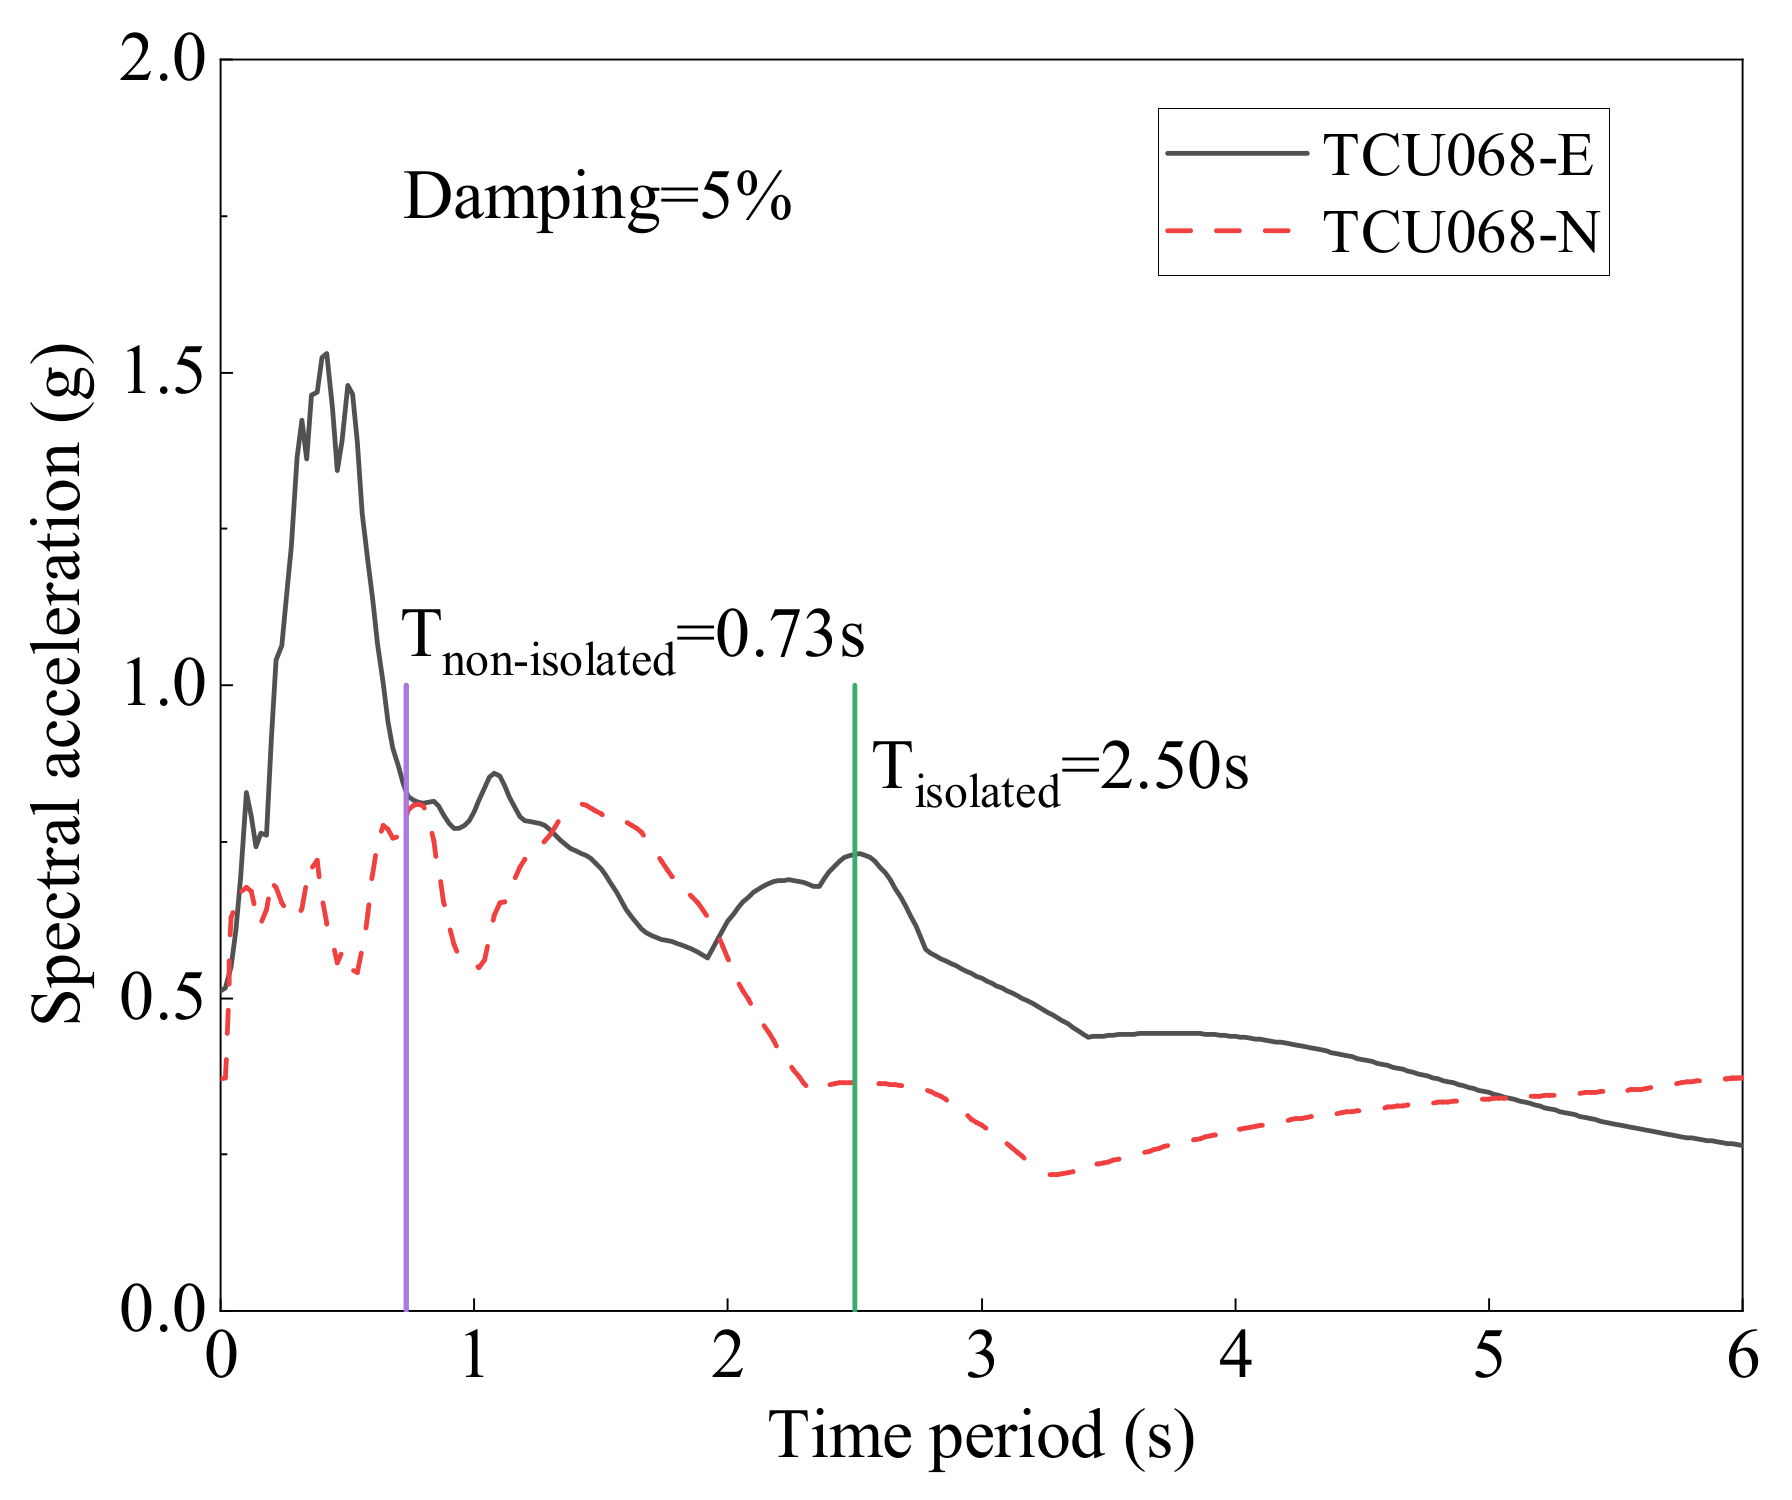
3.1. Seismic Response Analysis of Bridge

The seismic response of the isolated bridge and the non-isolated bridge under the near-fault ground motion was studied. Fourteen near-fault ground motions (from the Chi-Chi, Kocaeli, Northridge and Loma Prieta earthquakes) had been selected for analyzing the seismic response of the isolated and non-isolated bridges. Under the TCU102 ground motion, the piers of the isolated bridge and non-isolated bridge suffered the most severe damage. Then, the TCU068 ground motion in the Chi-Chi earthquake, which is the typical near-fault ground motion, is selected in the analysis. The spatial differential effect of ground motion is not considered, and the uniform excitation is used for the ground motion input. The acceleration amplitude of the ground motion in the E direction is larger than that in the N direction. Then, the E direction of the selected ground motion record is input in the longitudinal direction (X-direction) of the bridge, and the PGA is 0.51 g. The N direction of the ground motion record is input in the lateral direction (Z-direction) of the bridge, and the PGA is 0.37 g. The V direction is input in the vertical direction (Y-direction) of the bridge, and the PGA is 0.53 g.
The acceleration spectra of the TCU068 ground motion are shown in Figure 9. The natural periods of the non-isolated bridge and isolated bridge are 0.73 s and 2.50 s, respectively. Both in the X-direction (TCU068-E direction) and the Z-direction (TCU068-N direction), the spectral accelerations corresponding to the natural period of the non-isolated bridge are about 0.8 g. The spectral acceleration corresponding to the natural period of the isolated bridge in the X-direction is 0.75 g, while that in the Z-direction is about 0.35 g.
The isolation bearing model plays the role of isolation only in two horizontal directions (X-direction and Z-direction). Therefore, the analysis only focuses on the response of the bridge in two horizontal directions. It was found that the seismic response trend of each pier is basically consistent. Then, pier P2 and its corresponding bridge girder B2 point (shown in Figure 1) are selected for analysis.

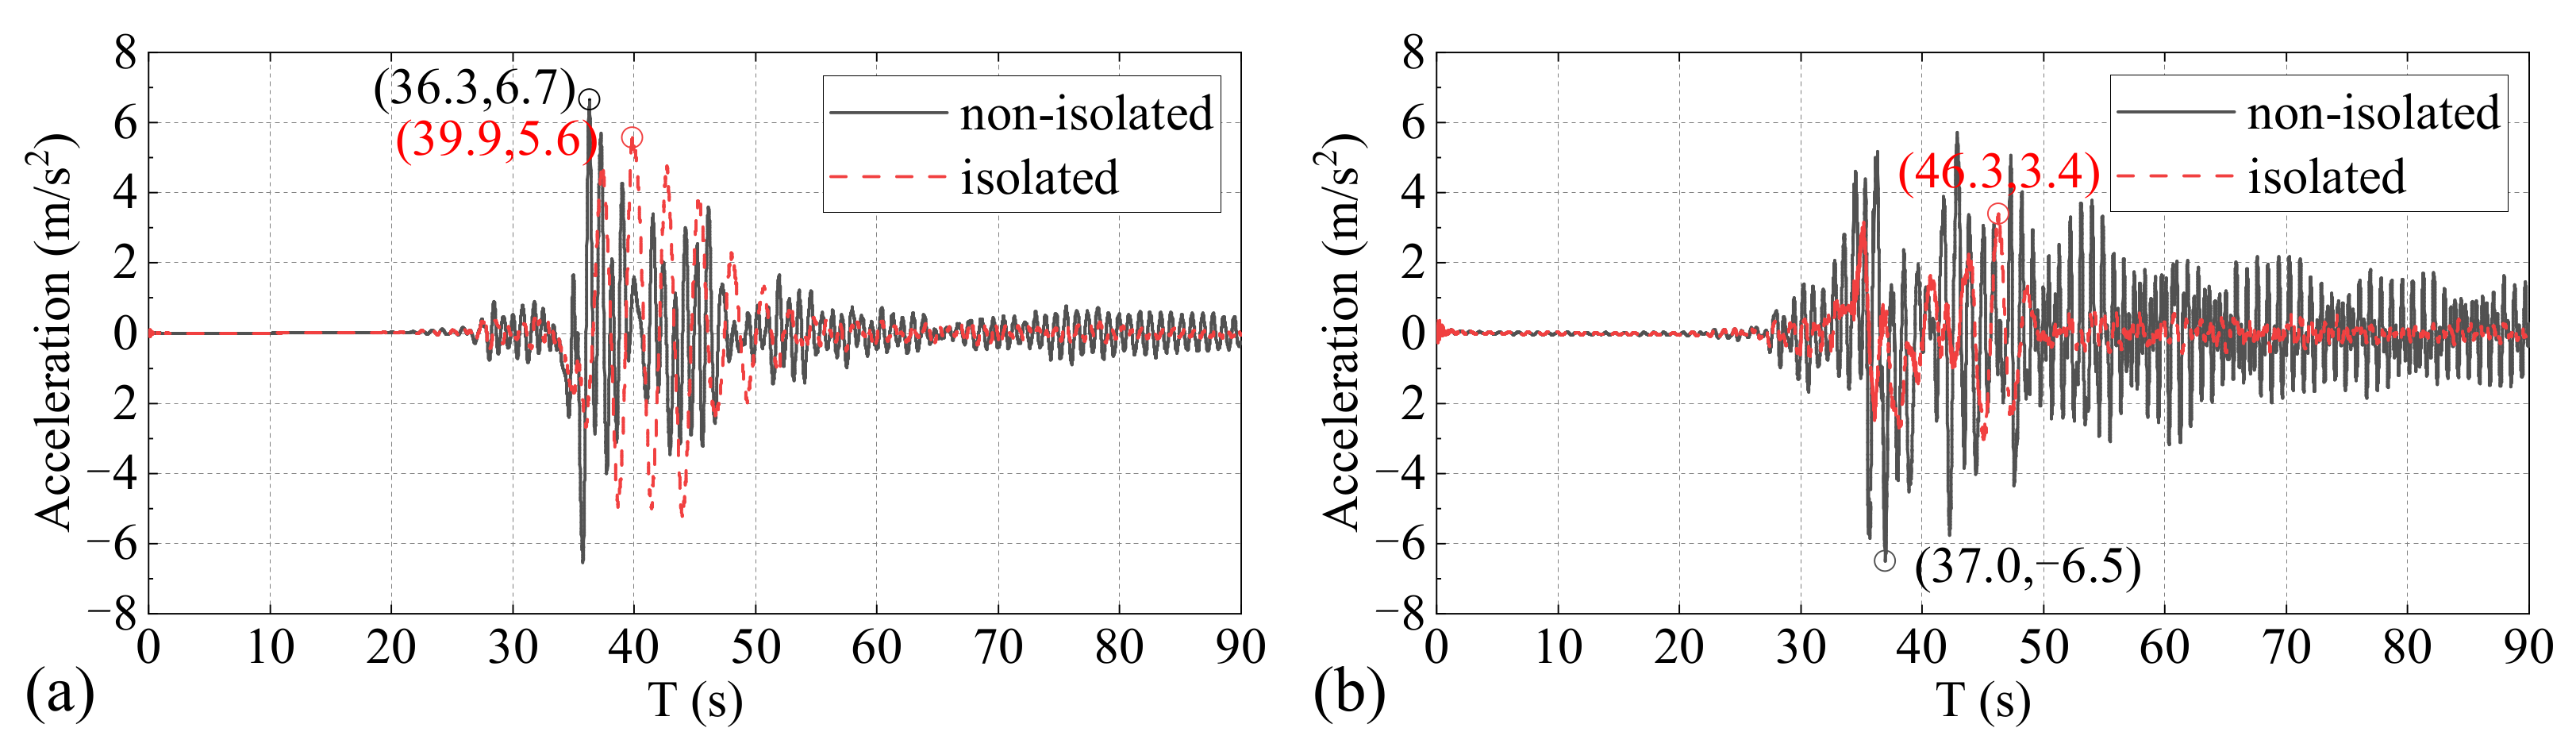
3.1.1. Girder Acceleration

The acceleration time histories of the girder B2 point are shown in Figure 10. In the X-direction, the isolation bearing decreases the acceleration peak value of the girder B2 point from 6.7 m/s2 to 5.6 m/s2. The decreasing percentage of the acceleration peak value is 16.4%. In the Z-direction, the isolation bearing decreases the acceleration peak value of the girder B2 point from 6.5 m/s2 to 3.4 m/s2. The decreasing percentage of the acceleration peak value is 47.7%. The isolation bearing plays a role in isolation, and the isolation effect in the Z-direction is better.

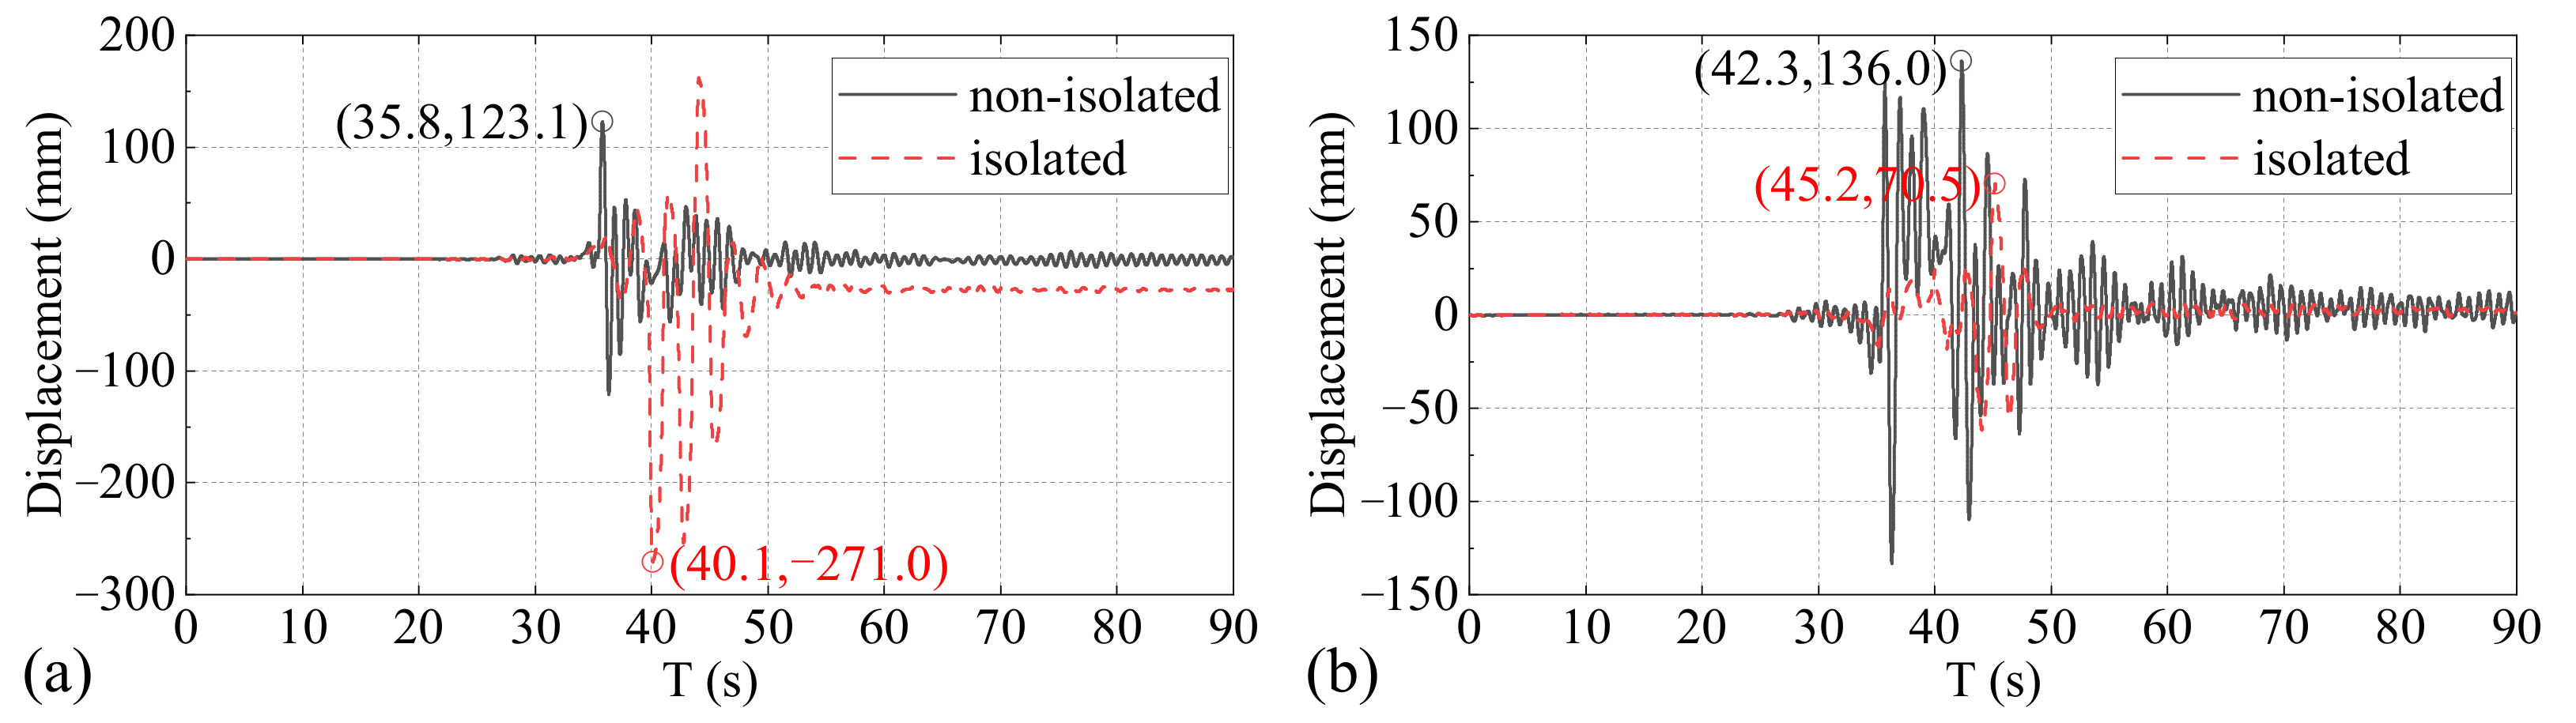
3.1.2. Pier Displacement

The displacement (at the top of the pier) time histories of pier P2 are shown in Figure 11. The peak displacements of pier P2 of the non-isolated bridge and the isolated bridge in the X-direction are 123.1 mm and 271.0 mm, respectively. The isolation bearing did not decrease the displacement of the pier but increased the peak displacement of pier P2 by 1.2 times. It is shown that the isolation bearing may not be suitable for the near-fault ground motion. In addition, pier P2 of the isolated bridge produces a residual displacement of 27.3 mm in the X-direction. In the Z-direction, the isolation bearing decreases the peak displacement of pier P2 from 136 mm to 70.5 mm. The decreasing percentage of the acceleration peak value is 48.2%.

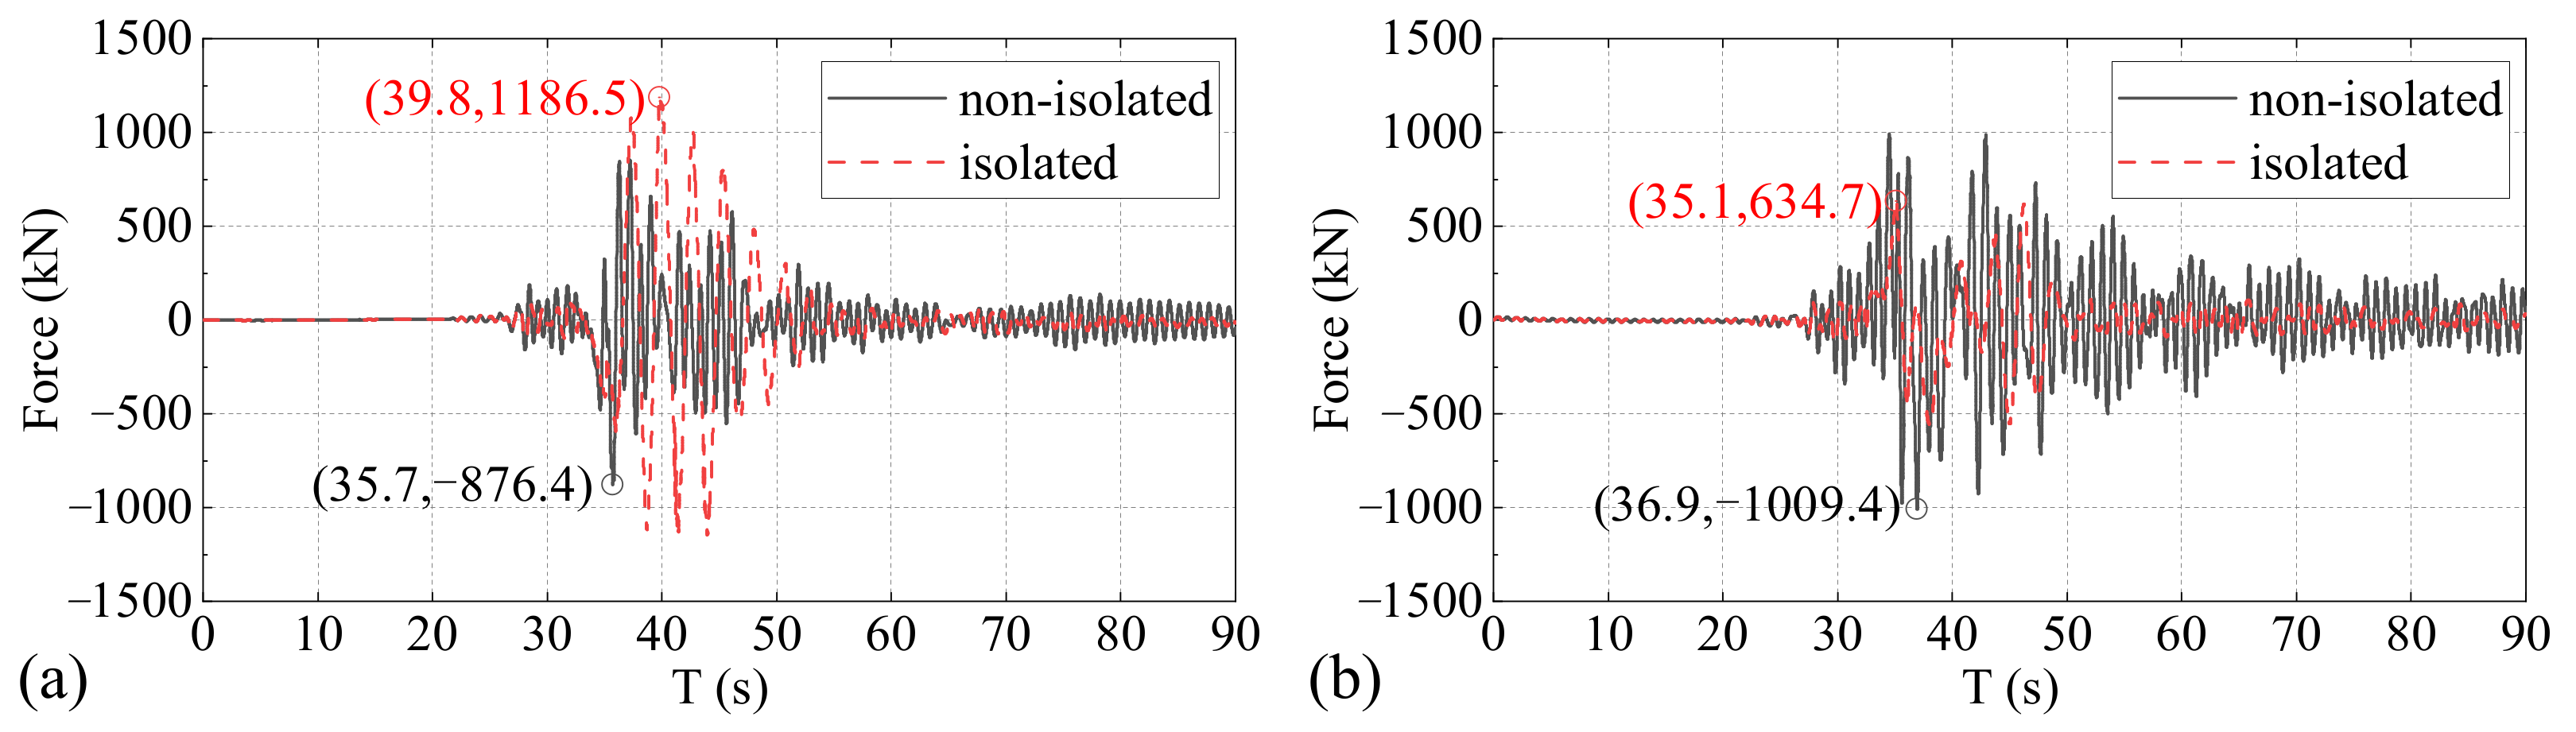
3.1.3. Pier Shear Force

The shear force-time histories of pier P2 are shown in Figure 12. The peak shear forces of pier P2 of the non-isolated bridge and the isolated bridge in the X-direction are 876.4 kN and 1186.5 kN, respectively. The isolation bearing did not decrease the shear force of the pier but increased the peak shear force of pier P2. The increasing percentage of the peak shear force is 35.4%. It is shown that the isolation bearing may not be suitable for the near-fault ground motion. In the Z-direction, the isolation bearing decreases the peak shear force of pier P2 from 1009.4 kN to 634.7 kN. The decreasing percentage of the peak shear force is 37.1%.

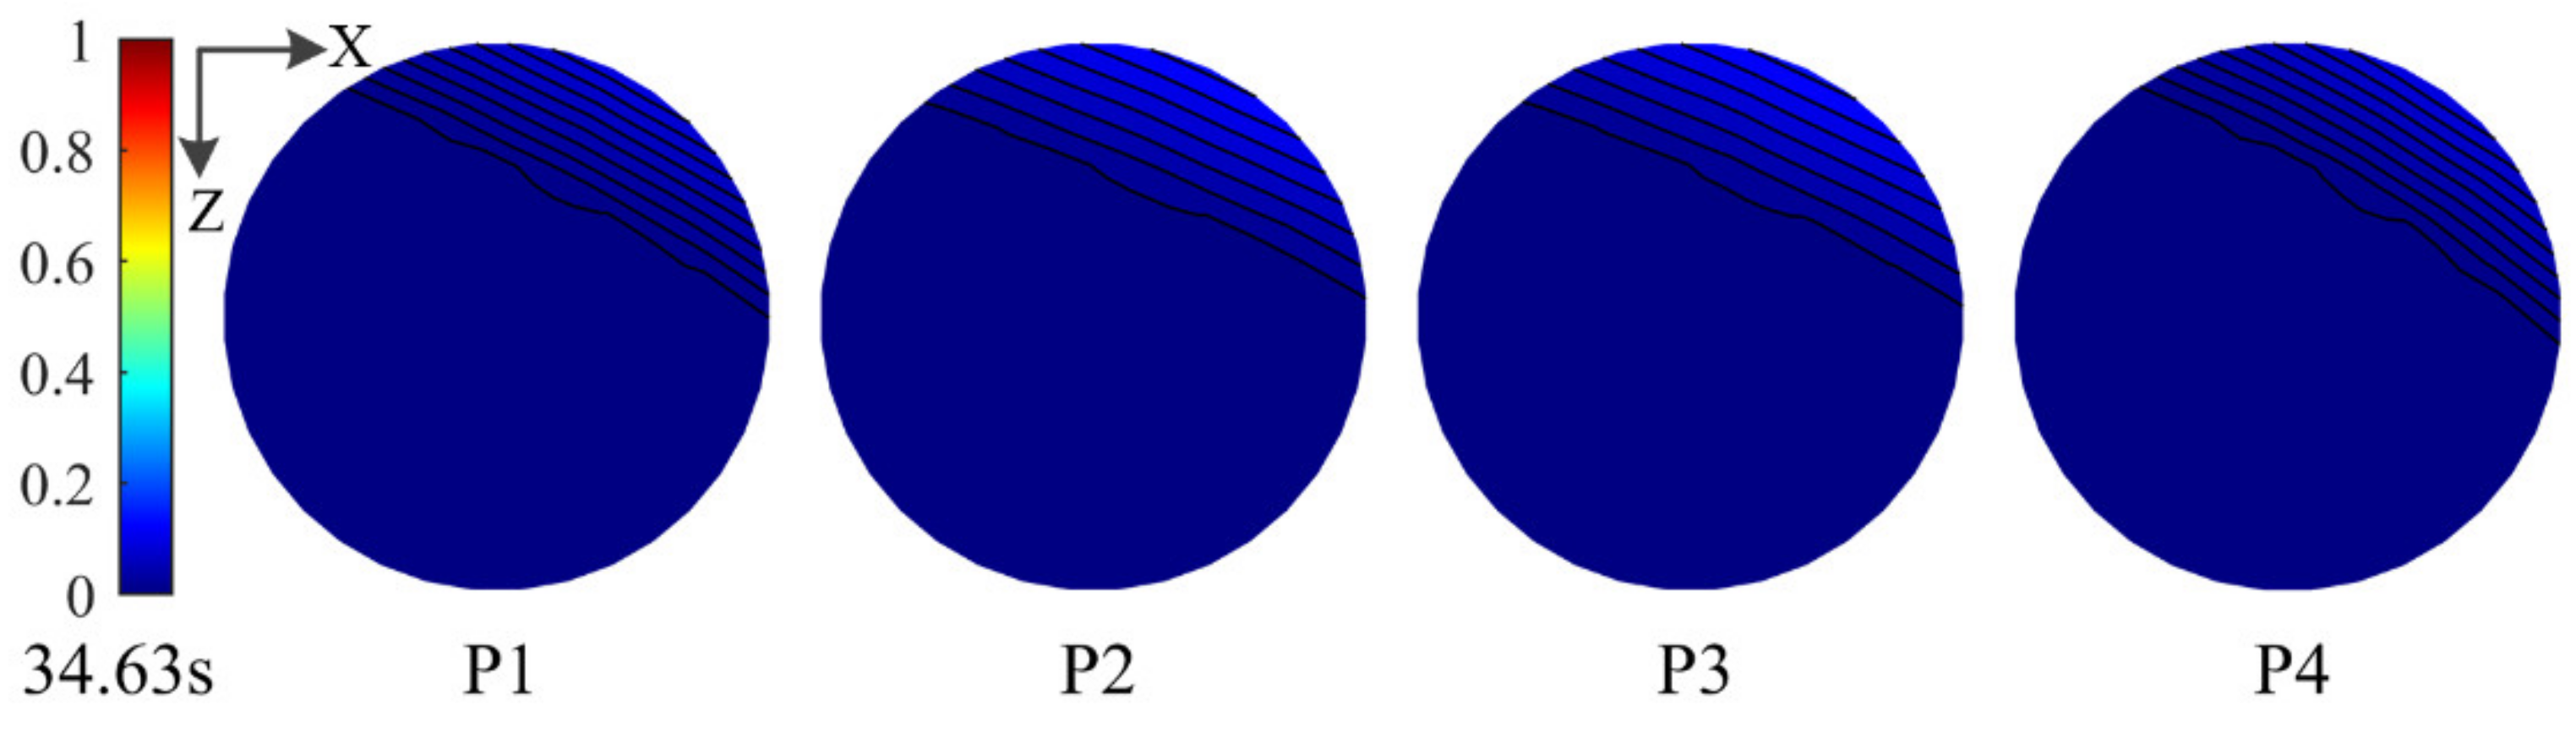
3.2. Pier Damage Analysis

In the analysis, it is found that the damage to the steel bars of each pier is relatively small, and the tensile damage index of concrete can easily reach 1. Therefore, only the compression damage of the concrete in the core area is analyzed. The pier bottom section with the most significant damage is selected for analysis.

3.2.1. Non-Isolated Bridge

Figure 13, Figure 14, Figure 15, Figure 16, Figure 17 and Figure 18 show the compression damage of concrete in the core area of each pier at different times. At 34.63 s, slight damage occurred on the right upper part of each pier, and the damage of piers P2 and P3 was slightly more significant than that of piers P1 and P4. At 35.81 s, the damage on the right upper part of each pier did not develop to the interior. The damage on the right lower part of each pier occurred and developed rapidly into the interior. The maximum damage index of piers P2 and P3 reached 1, which indicated that the concrete in this part was completely crushed. At 36.33 s, great damage occurred on the left upper part of each pier. At this time, the damage to each pier was symmetrical, and the damage at the edge was more significant. At 37.31 s, new damage occurred on the left lower part of each pier, and the damage of piers P2 and P3 was more significant than that of piers P1 and P4. At 42.96 s, the damage on the left lower part of each pier increased. The damage on the right upper part of the pier, where the damage first appeared, increased and developed into the interior. The damage at the edge of piers P2 and P3 was more significant. At 47.74 s, only the internal damage of piers P2 and P3 increased slightly. The edges of piers P2 and P3 were significantly damaged, while the damage to piers P1 and P4 was mainly concentrated on the left upper and right lower of the pier. Piers P2 and P3 were more severely damaged than piers P1 and P4. At this moment, the damage to each pier has reached its final state. Although the earthquake ground motion continued, the damage did not continue to develop.

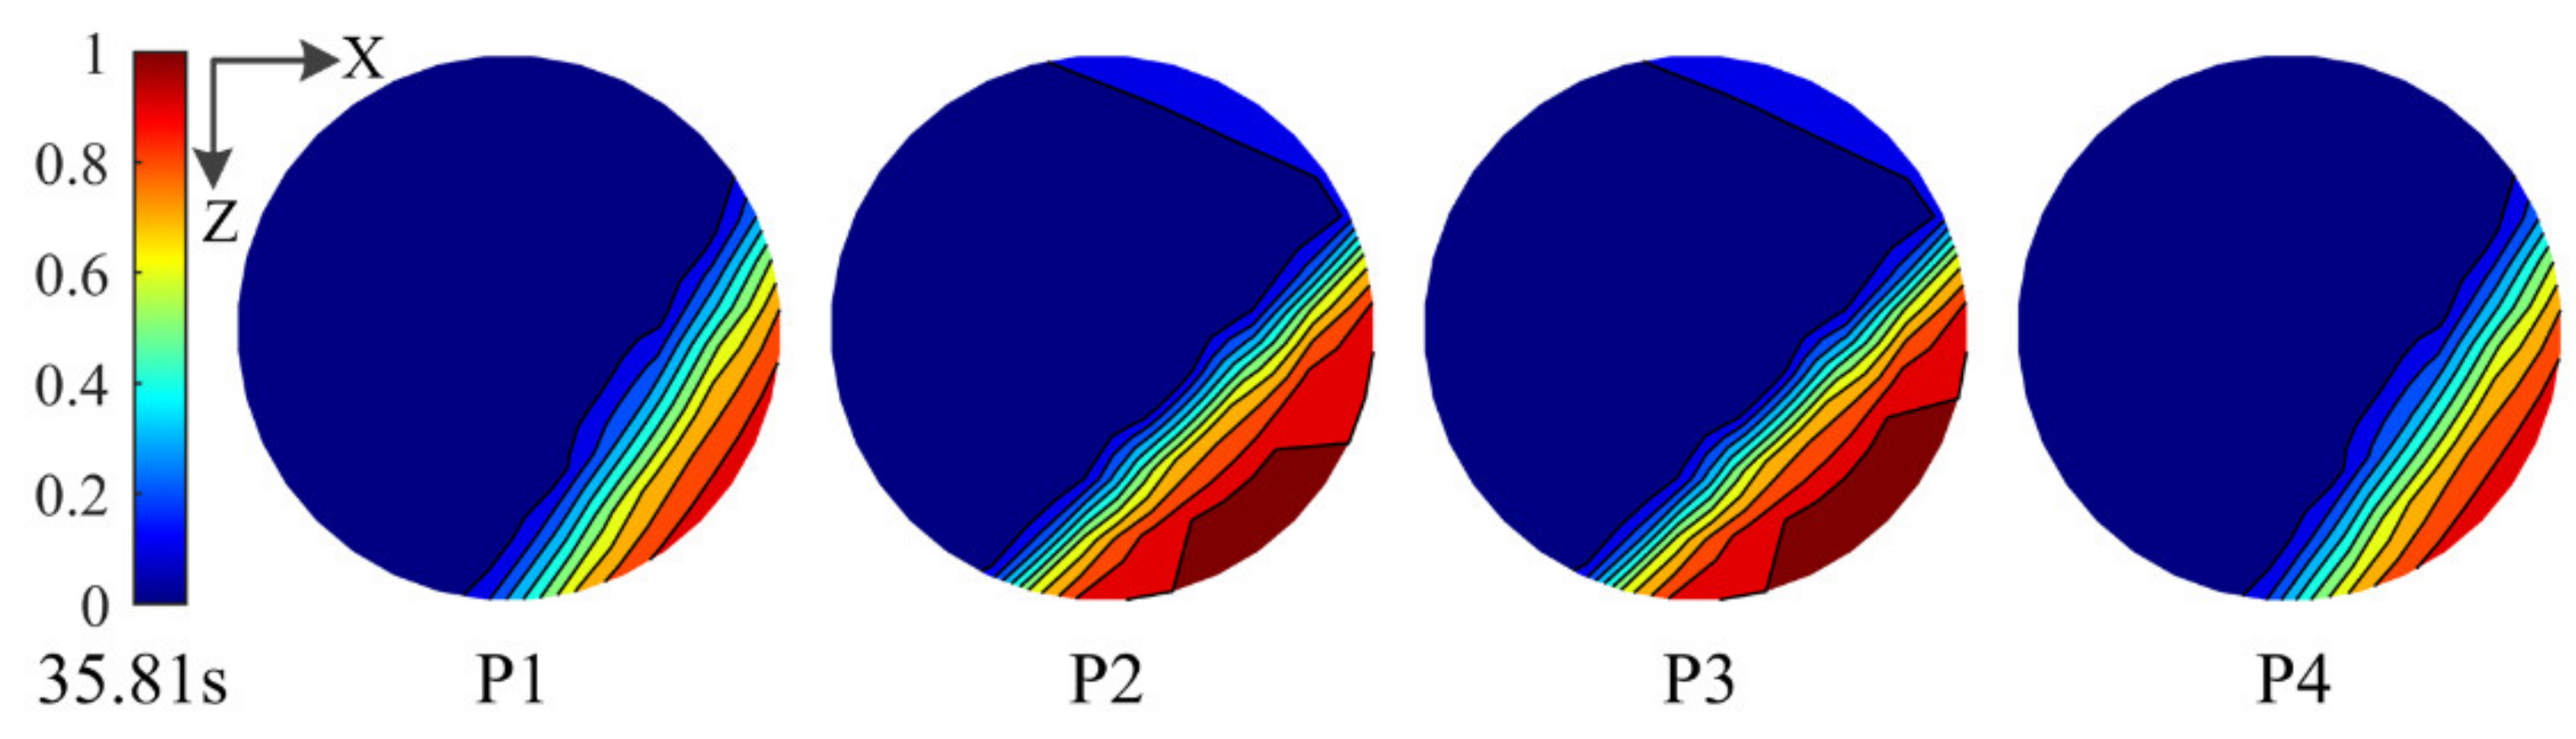
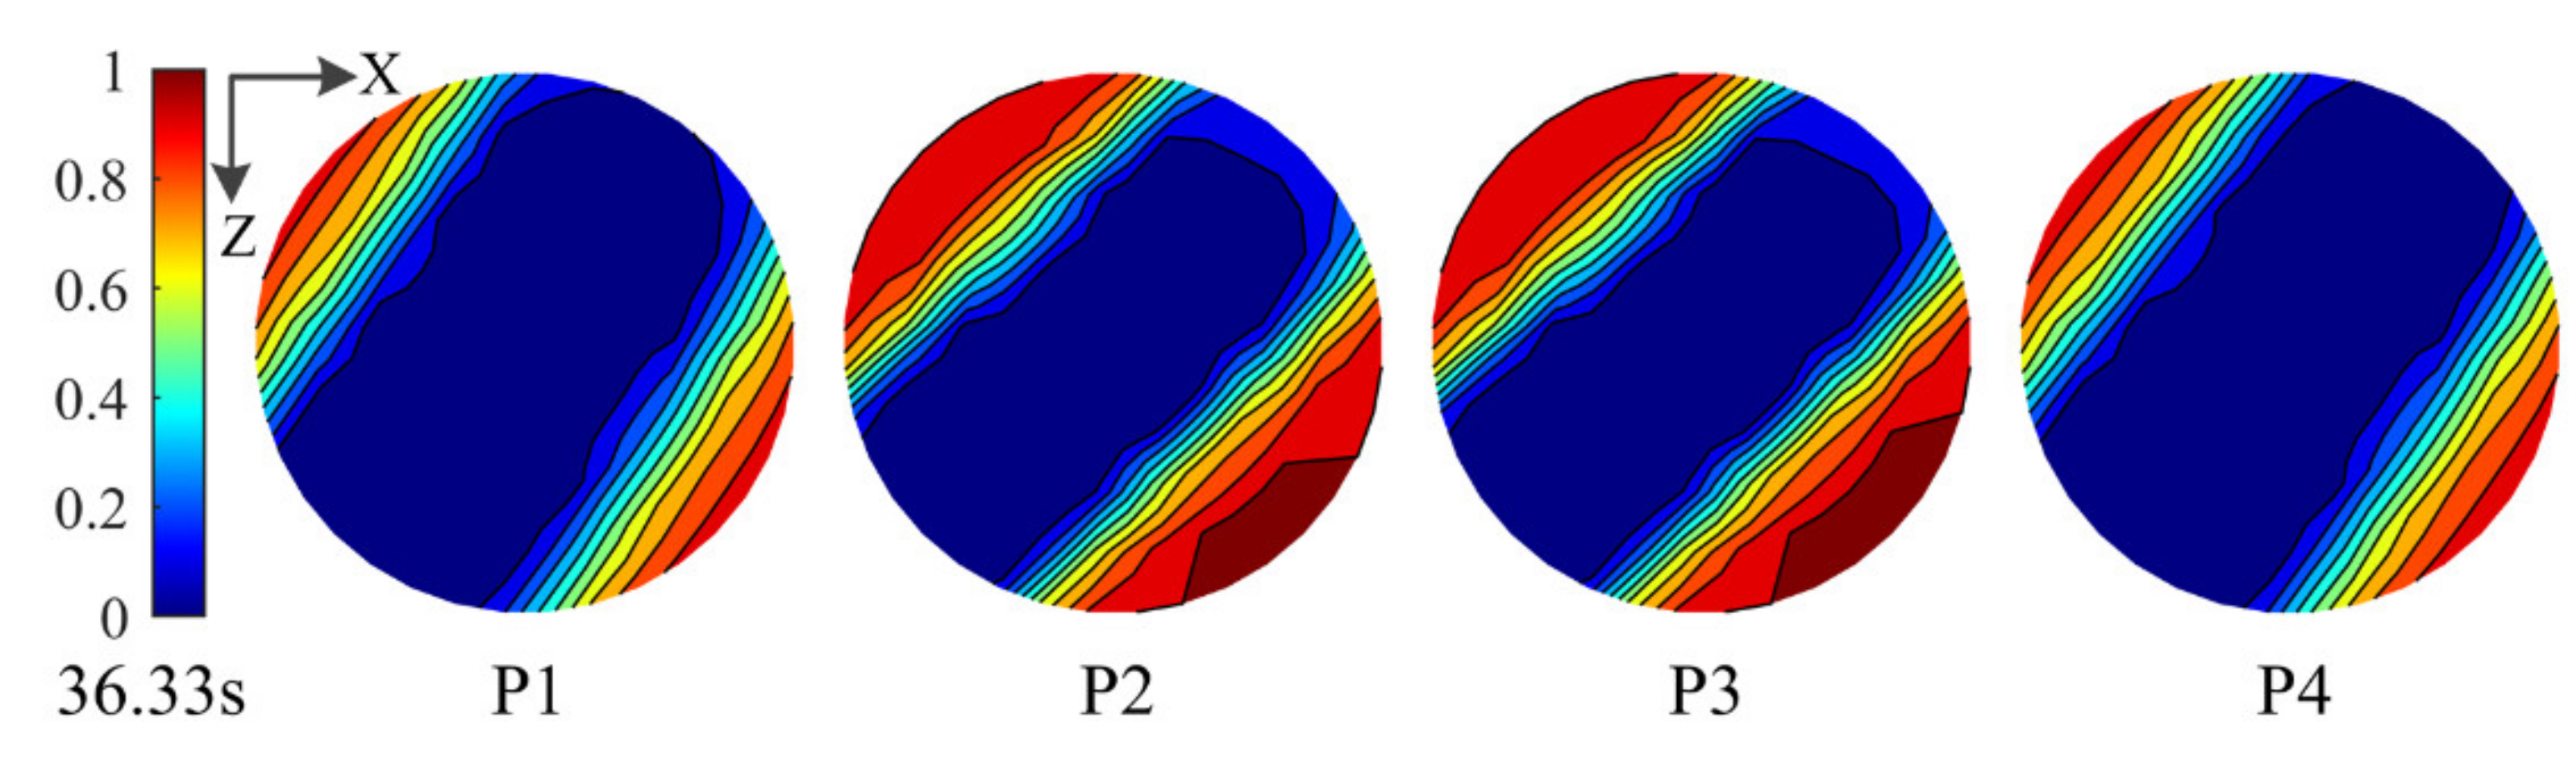
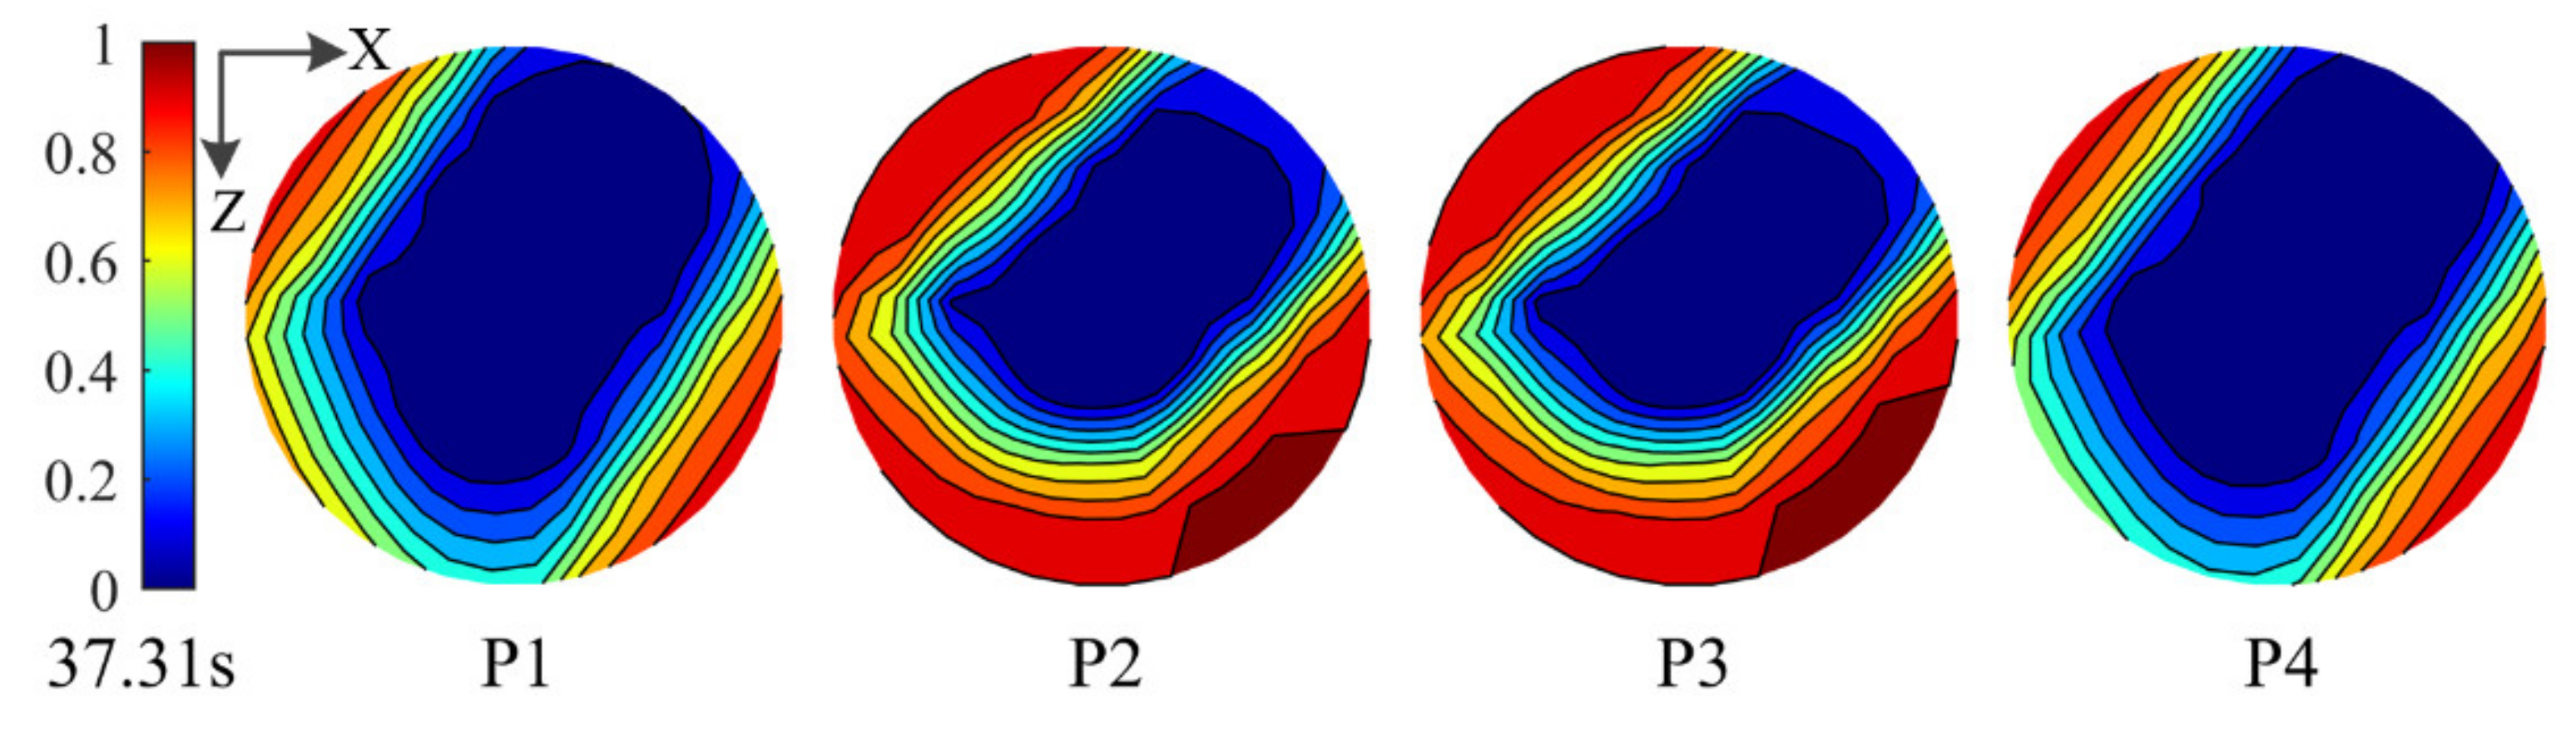
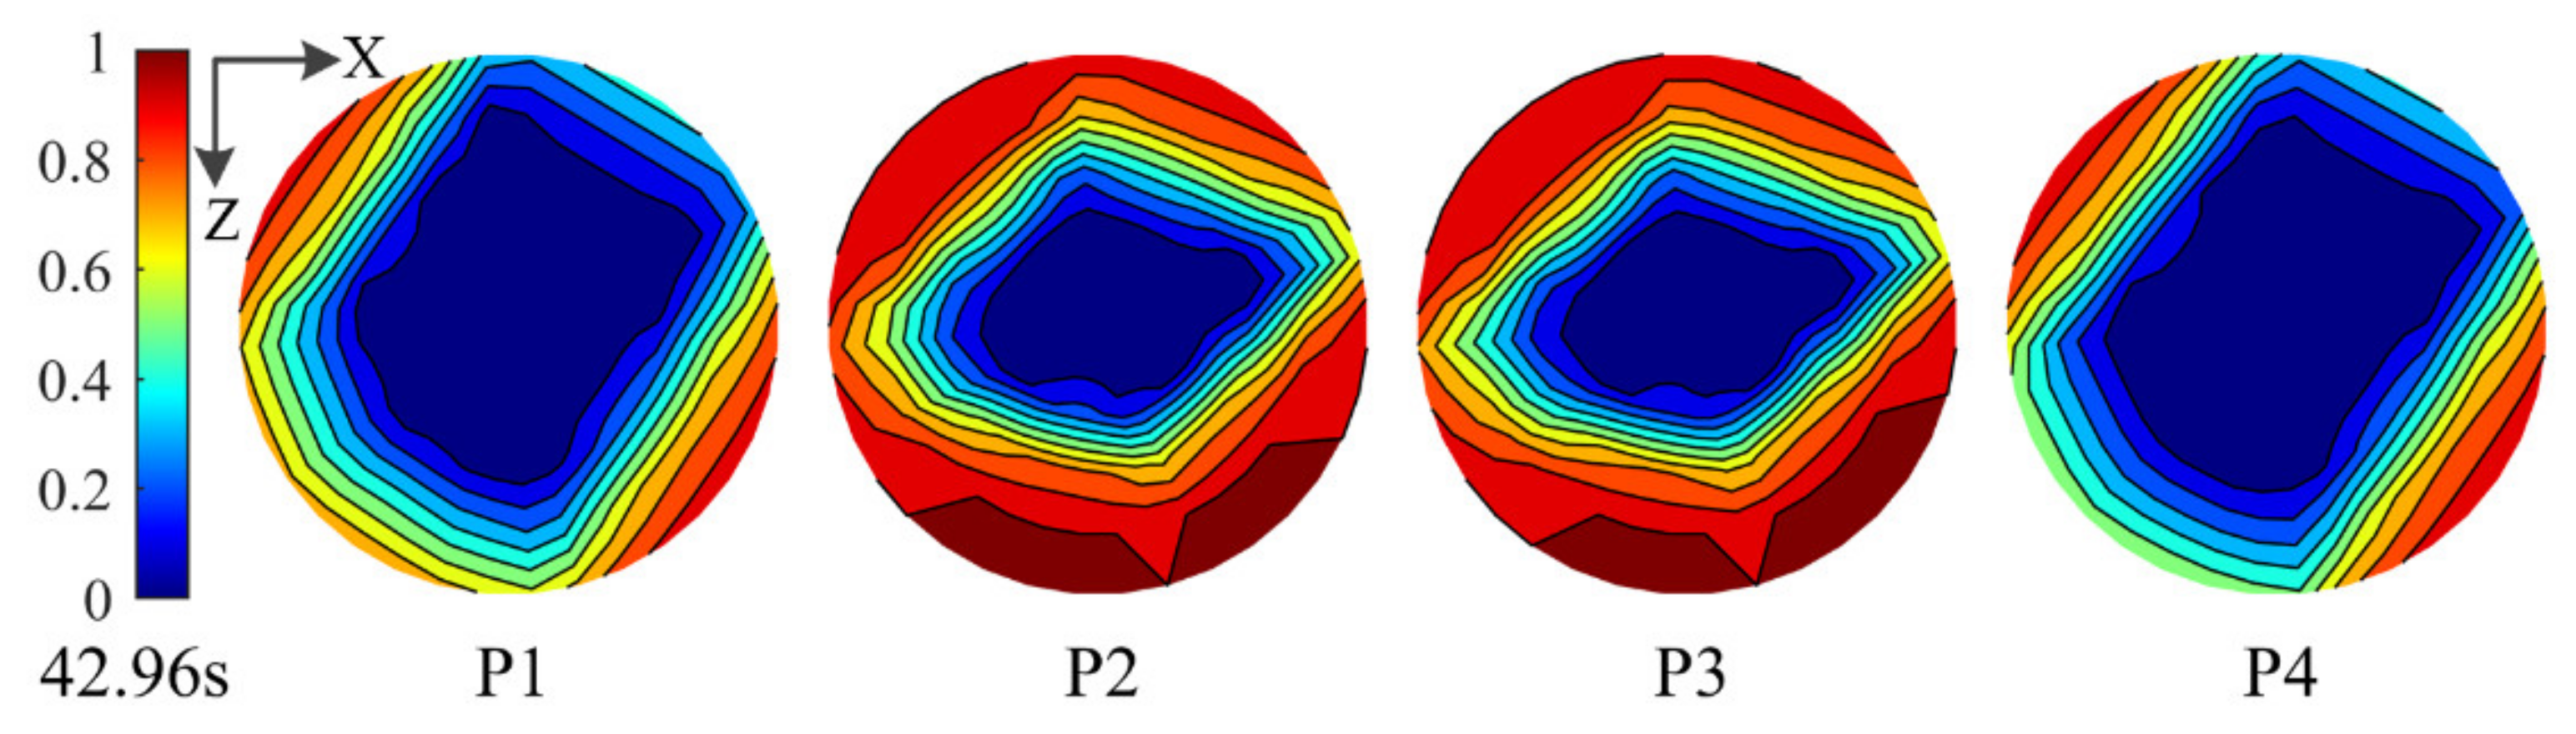
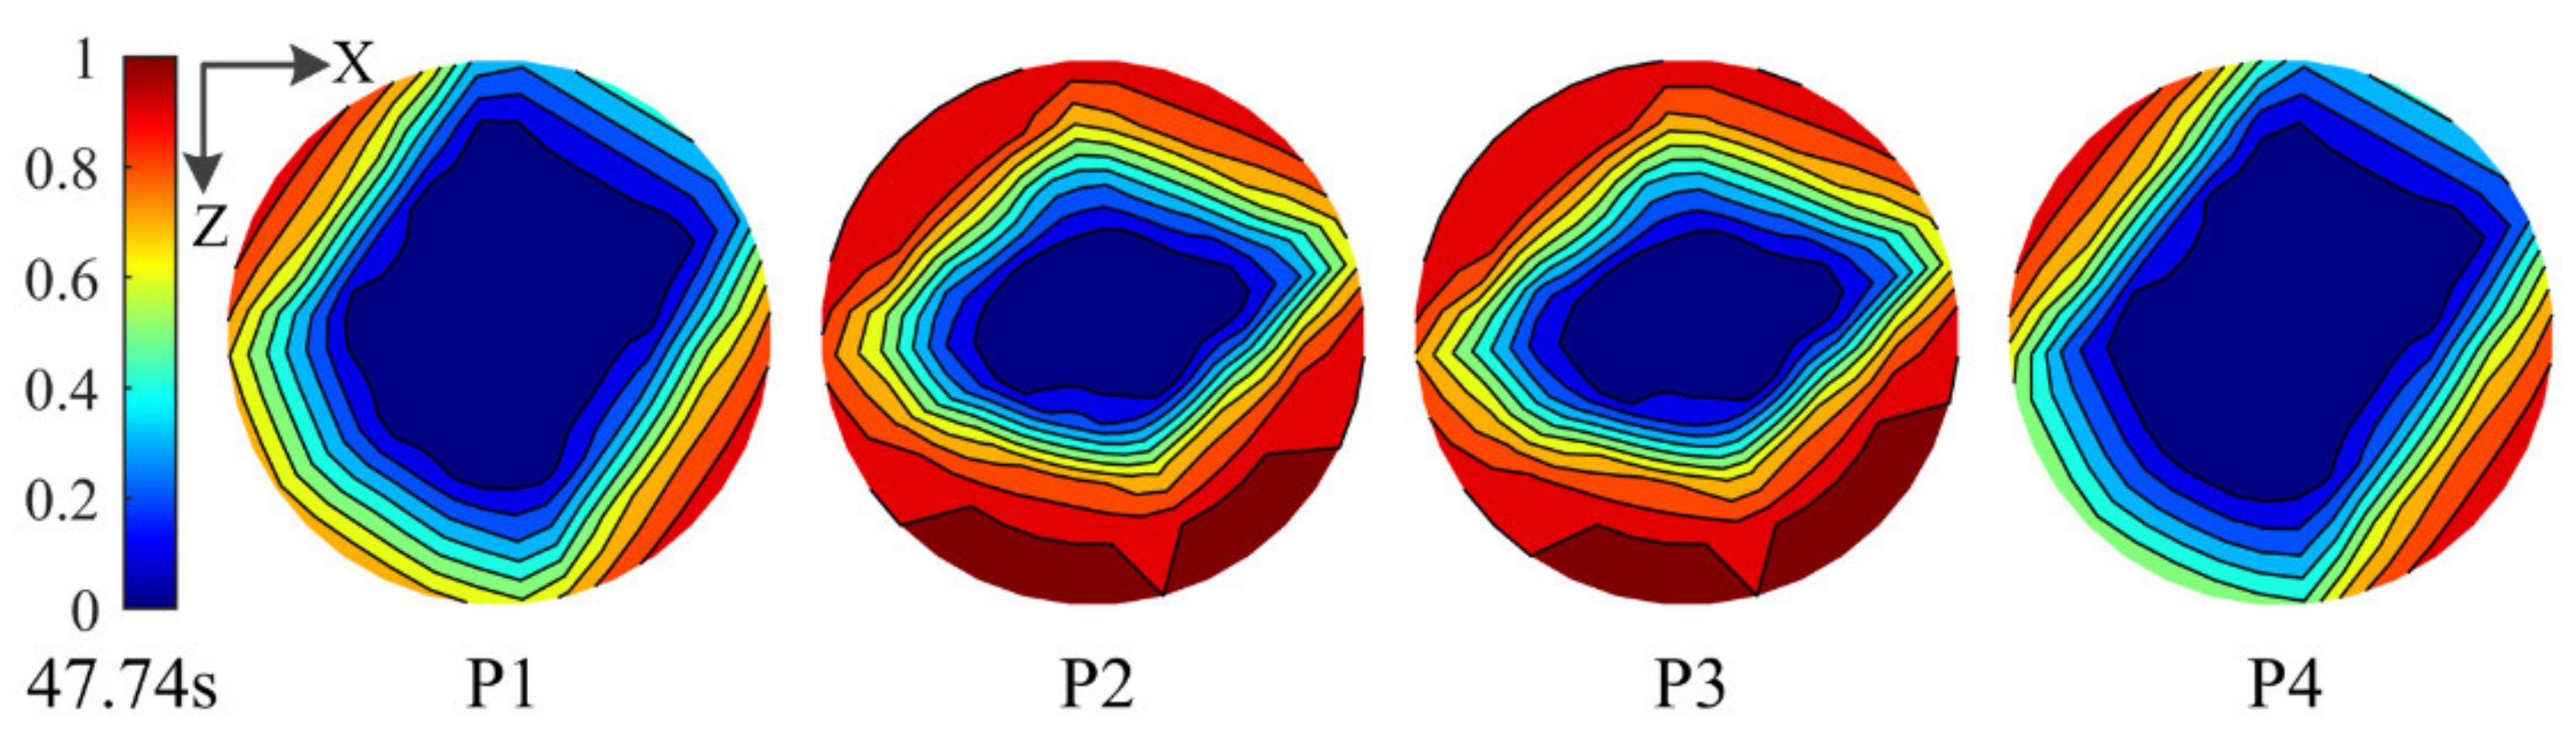
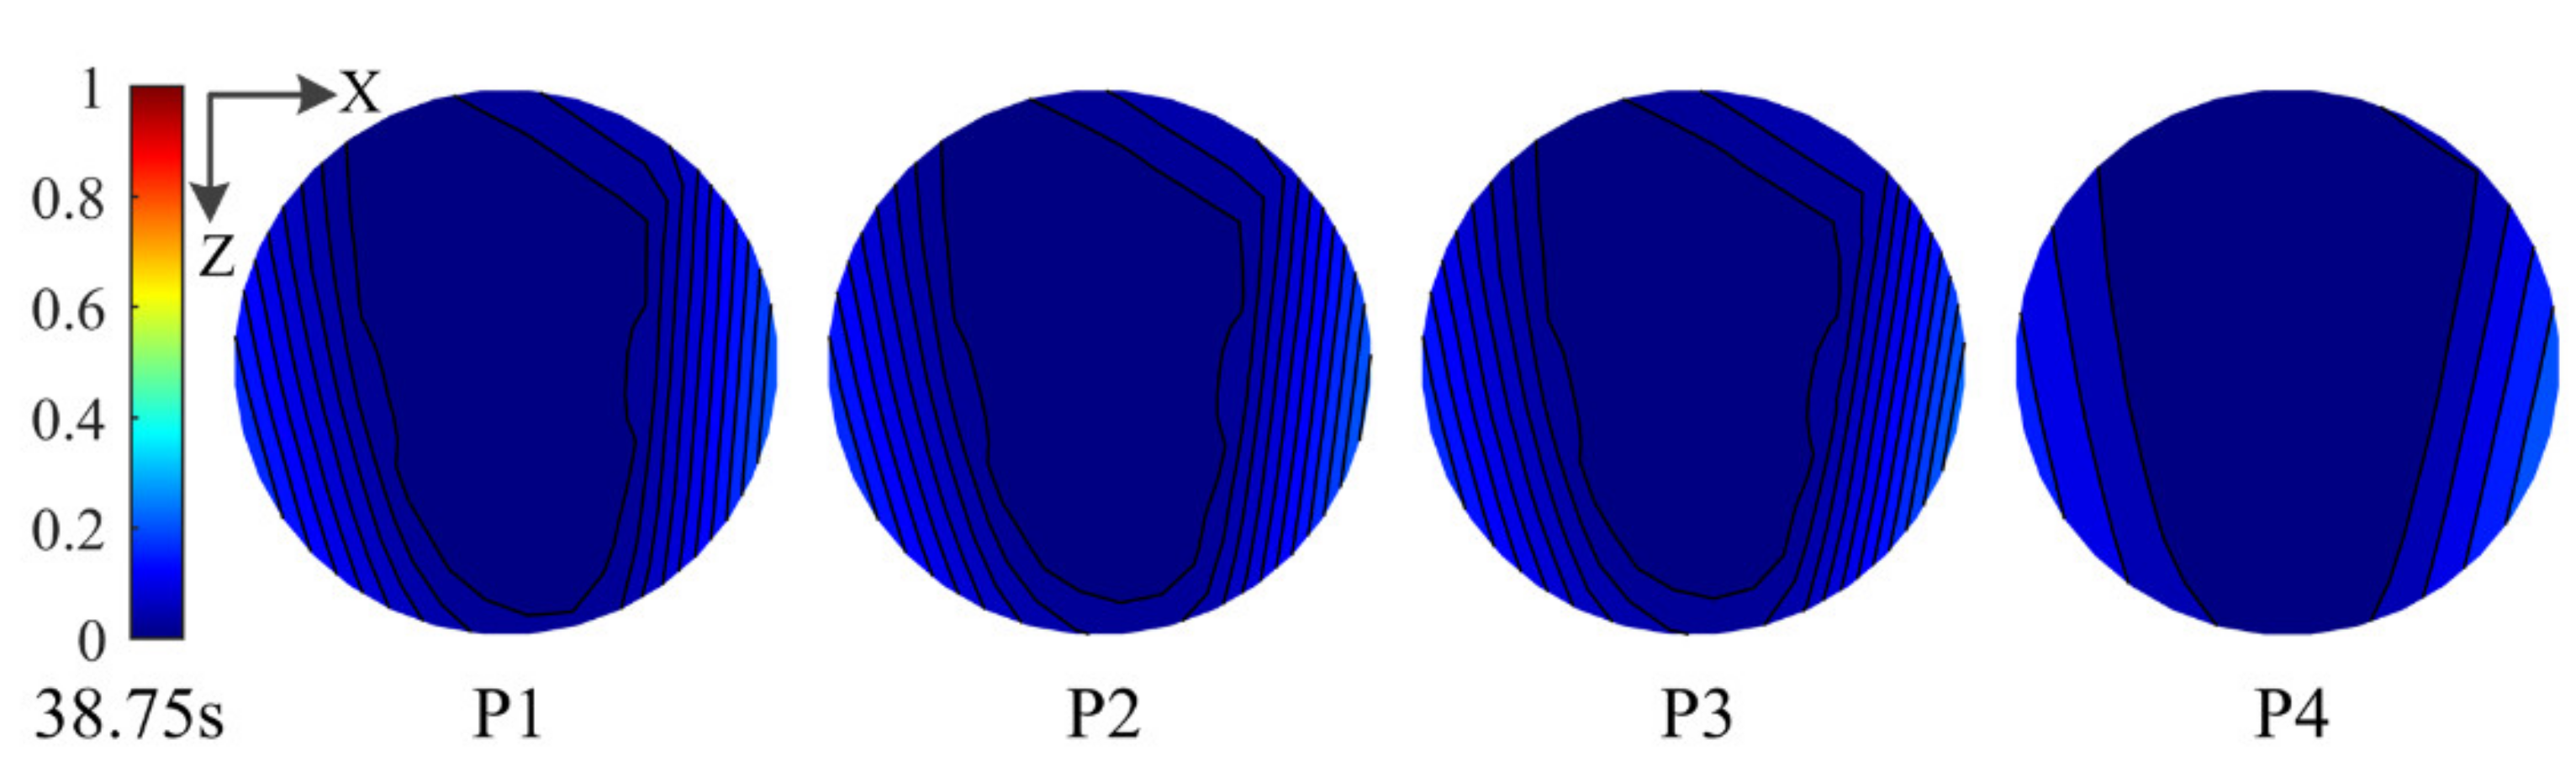
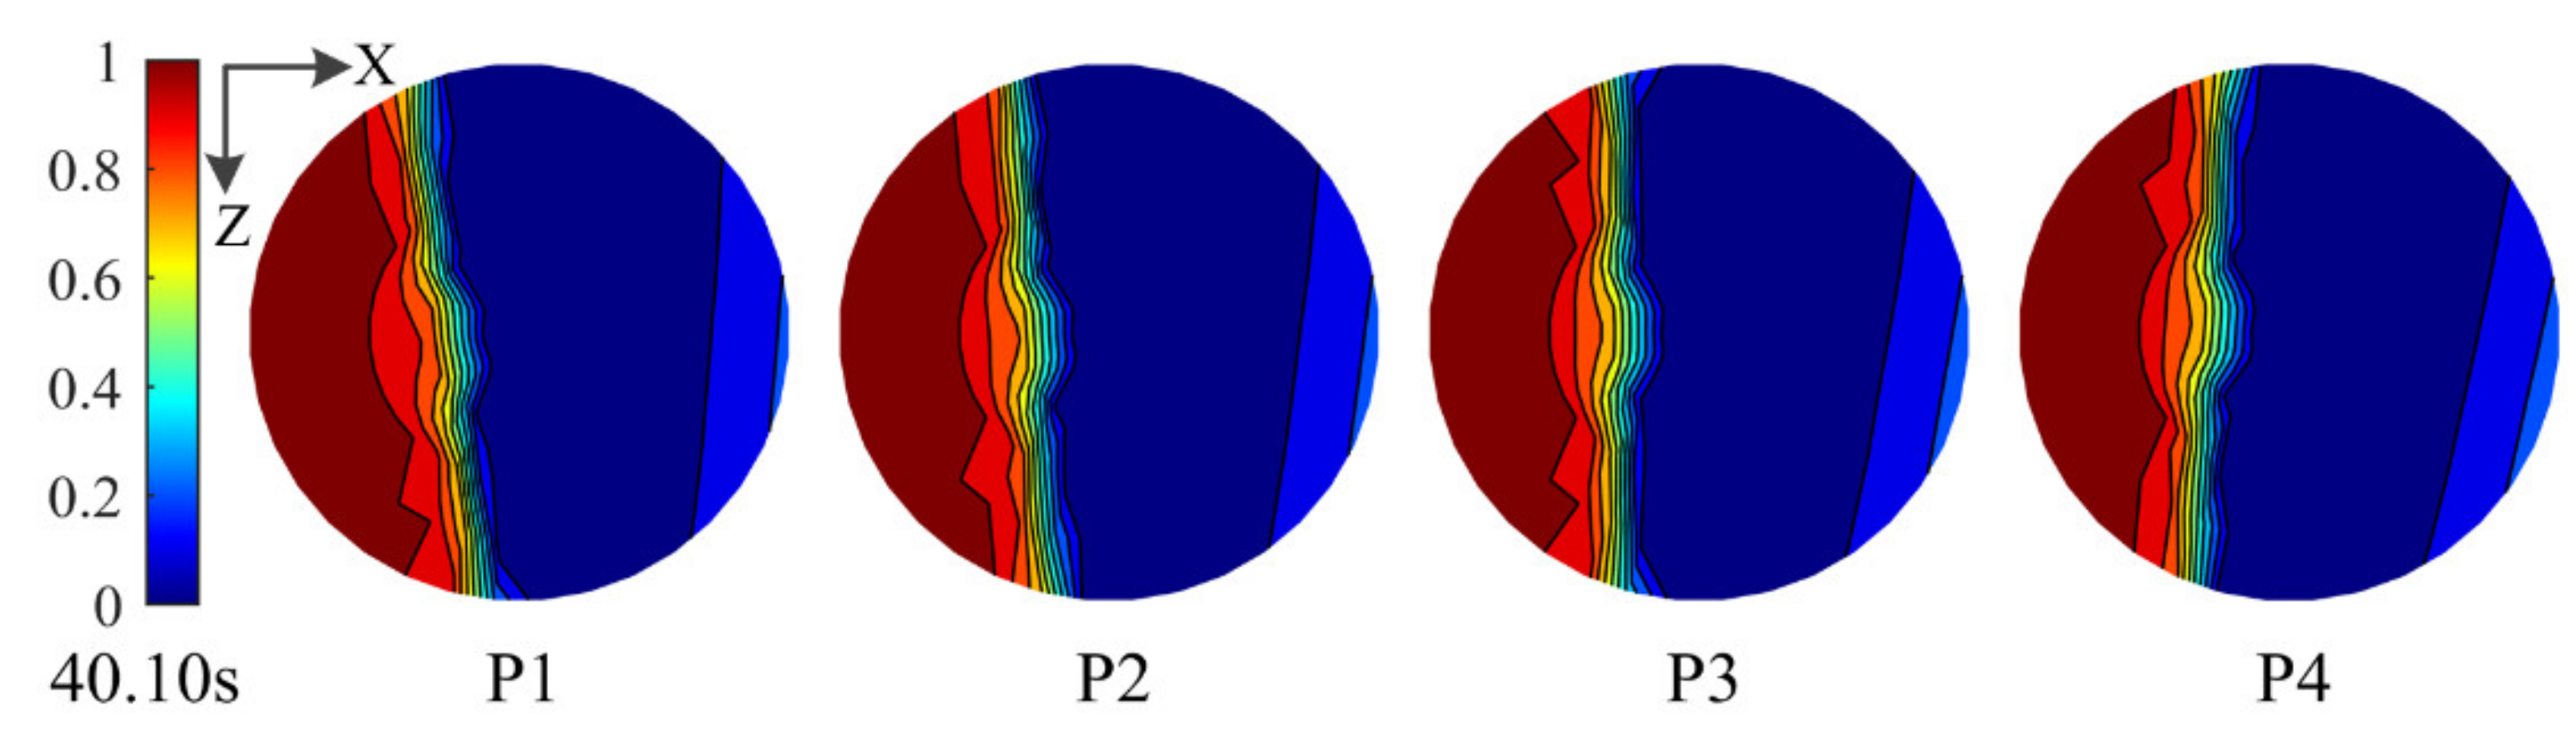
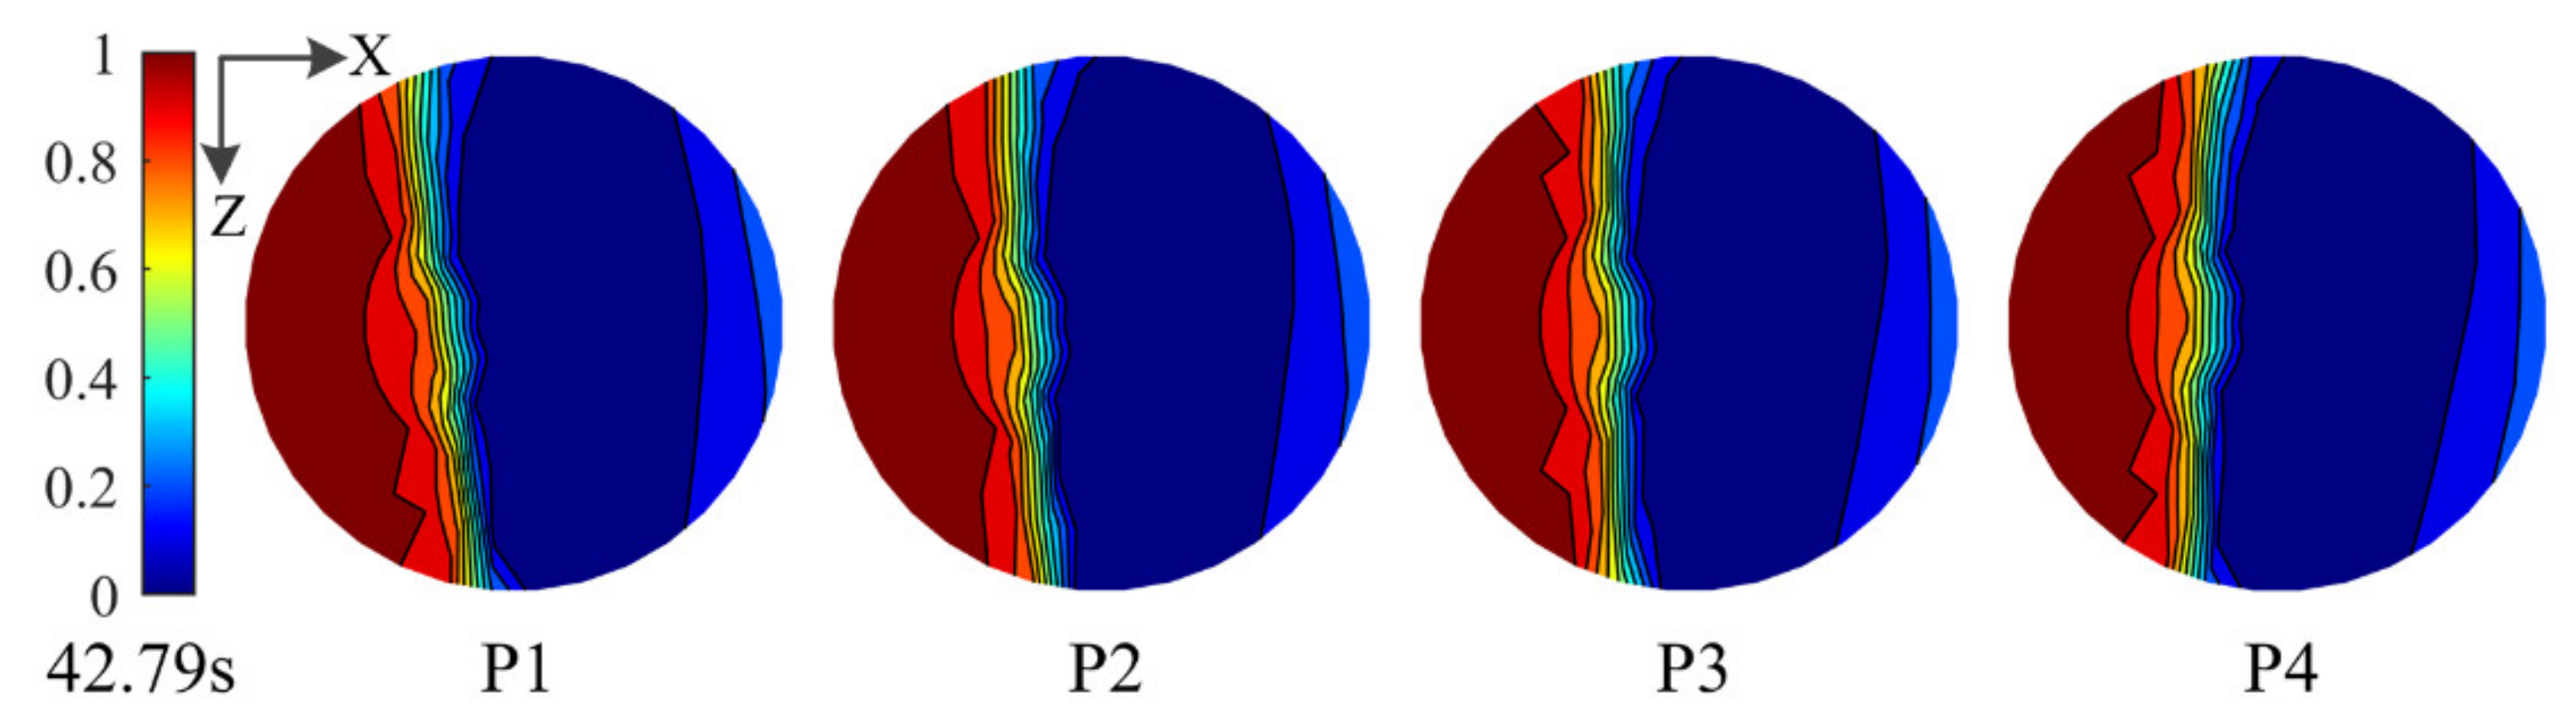
3.2.2. Isolated Bridge

Figure 19, Figure 20, Figure 21, Figure 22, Figure 23 and Figure 24 show the compression damage of concrete in the core area of each pier at different times. At 38.75 s, both the left edges and the right edges of each pier were slightly damaged. The damage to piers P1~P3 was the same, and the damage to pier P4 was slightly smaller. At 40.10 s, significant damage occurred on the left side of each pier. The damage index in about 1/5 of the cross-sectional area of the pier reached 1, indicating that this part of the concrete was completely crushed. At 42.79 s, the damage on both the left sides and the right sides of each pier developed slightly into the interior. At 44.08 s, the right upper part of each pier was significantly damaged, and the damage of pier P4 was slightly smaller than that of the other piers. At 45.39 s, the damage to the left lower part of each pier increased. The edge area, with the damage index reaching 1, increased. At 46.47 s, only the damage on the upper side of piers P1 and P2 increased slightly, but not significantly. At this moment, the damage to each pier has reached its final state. Although the ground motion continued, the damage did not continue to develop. The damage degree of each pier is almost the same. The damage index in a large part of the area on the left side of the pier reached 1. The edge of the right upper part of the pier was significantly damaged, but the damage index did not reach 1. A large part of the concrete on the left side of each pier was completely crushed, which is the main reason for the residual displacement of the pier in the X-direction.
In the analysis, all isolation bearings failed, and the failure time is shown in Table 3. The failure of all bearings indicates that the isolation bearings cannot be used directly under the TCU068 near-fault ground motion. It can be found that the failure time of each bearing is concentrated in about 36 s, that is, before the concrete in the core area of the pier is damaged. The failure index of the bearing model used in the analysis only plays the role of identification, and the mechanical properties of the bearing are not affected. The extensive damage to the piers mentioned above indicates, however, that even if the bearing did not fail, it does not play a role in isolation under the TCU068 near-fault ground motion.

4. Conclusions

In this paper, the seismic response and damage analysis of the isolated bridge and the non-isolated bridge under TCU068 ground motion in the Chi-Chi earthquake are conducted. The following research results are obtained:
(1)
Under the TCU068 near-fault ground motion, the isolation bearing can decrease the girder acceleration, but it is not significant in the X-direction. Meanwhile, the isolation bearing increases the X-direction displacement and shear force of the pier. The displacement even increases by 1.2 times. This increment shows that the isolation bearing not only fails to work but amplifies the seismic response of the bridge.
(2)
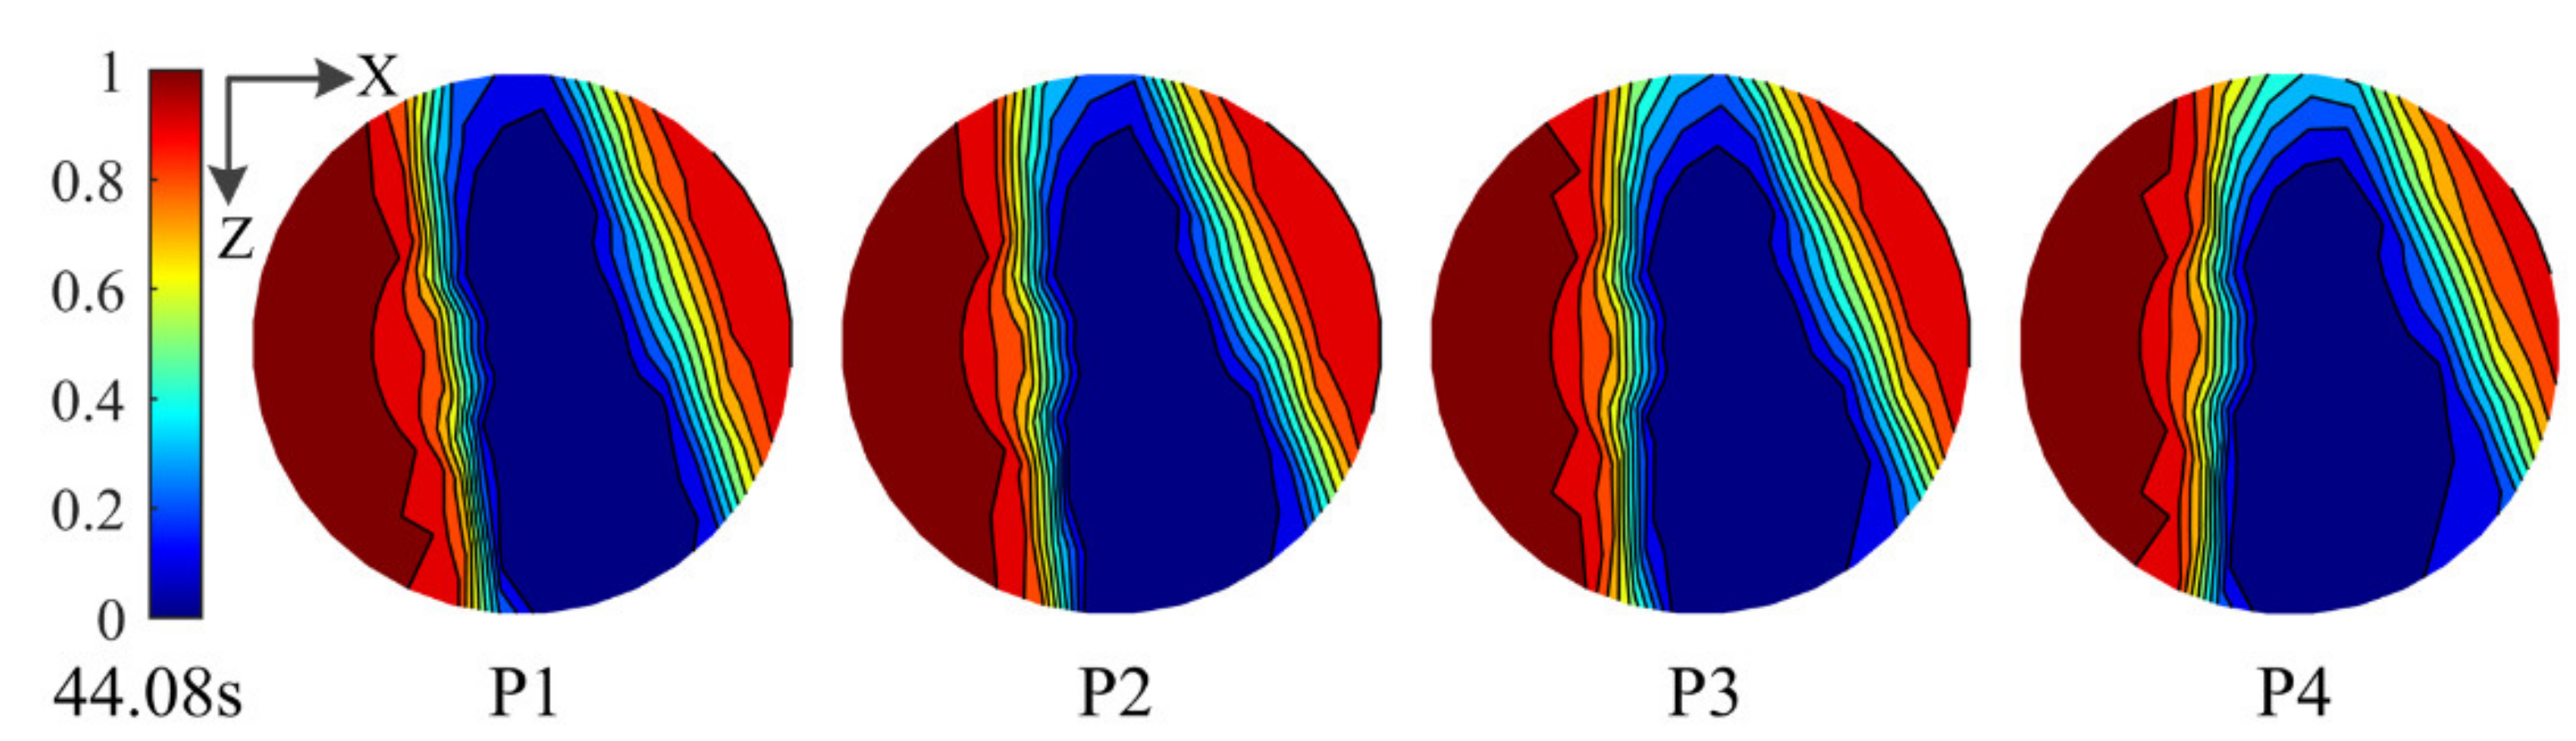
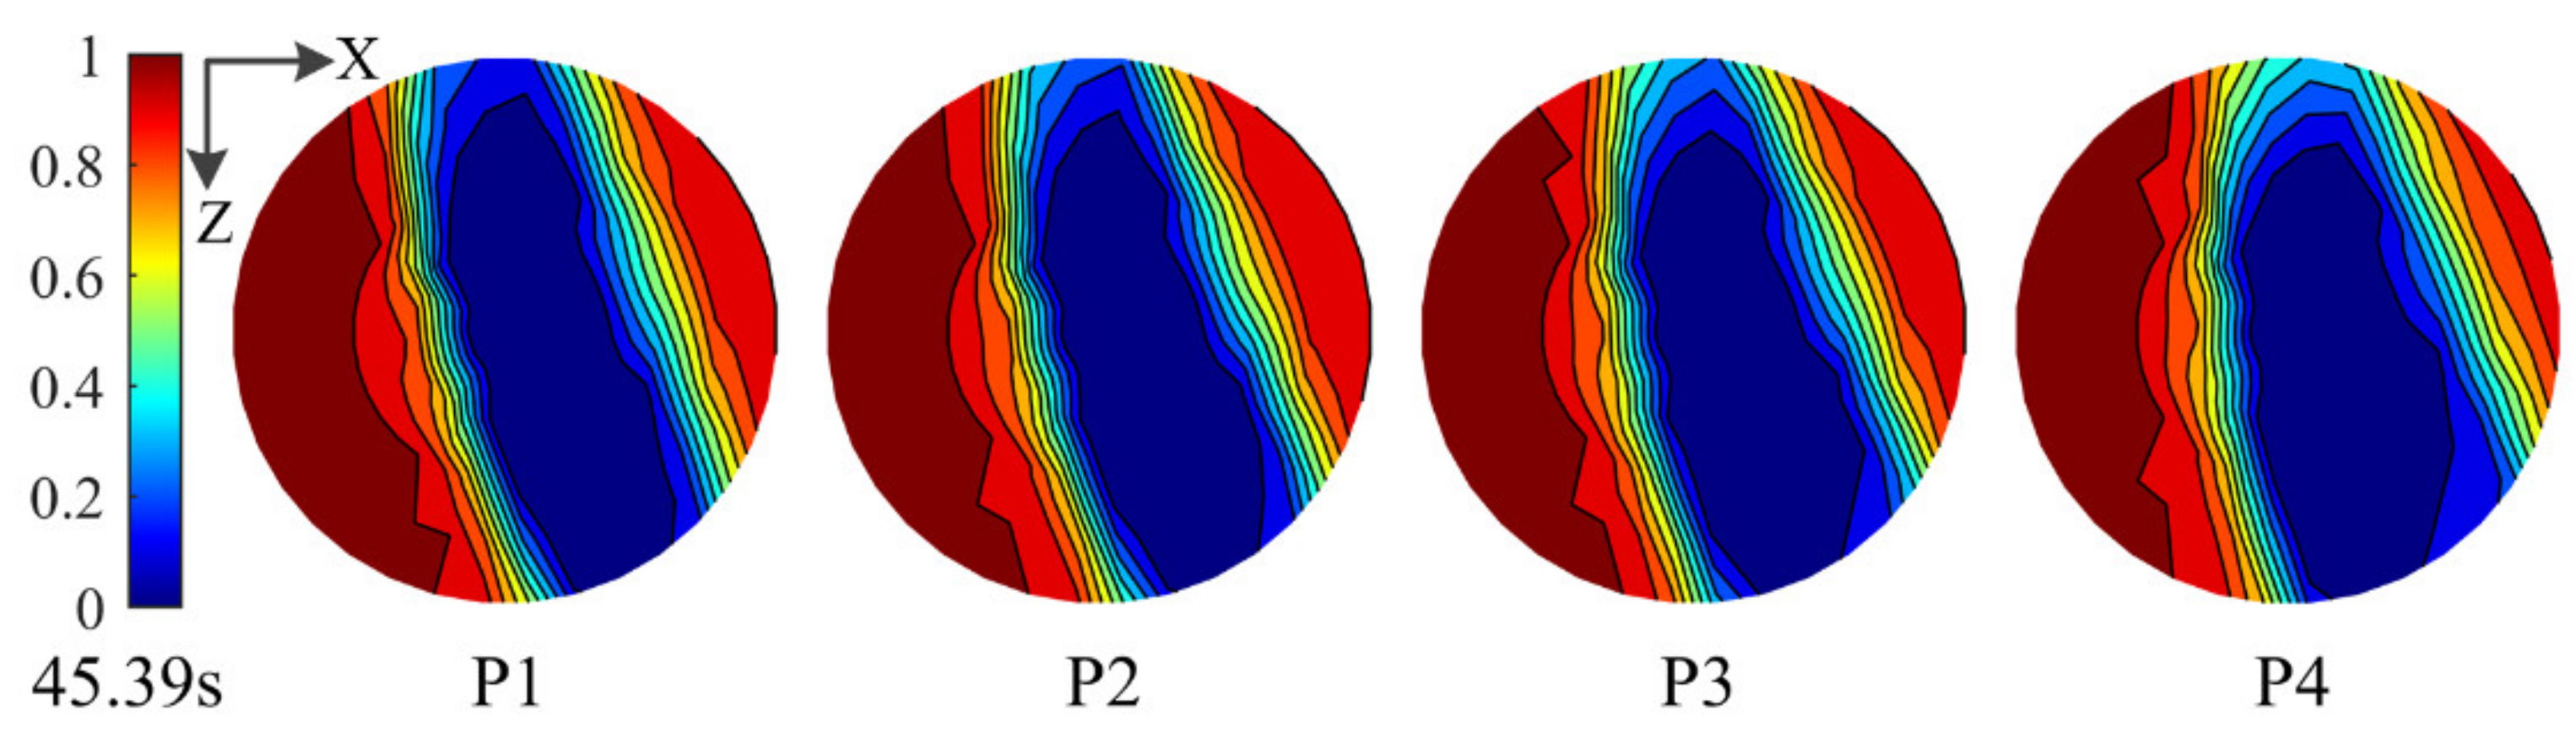
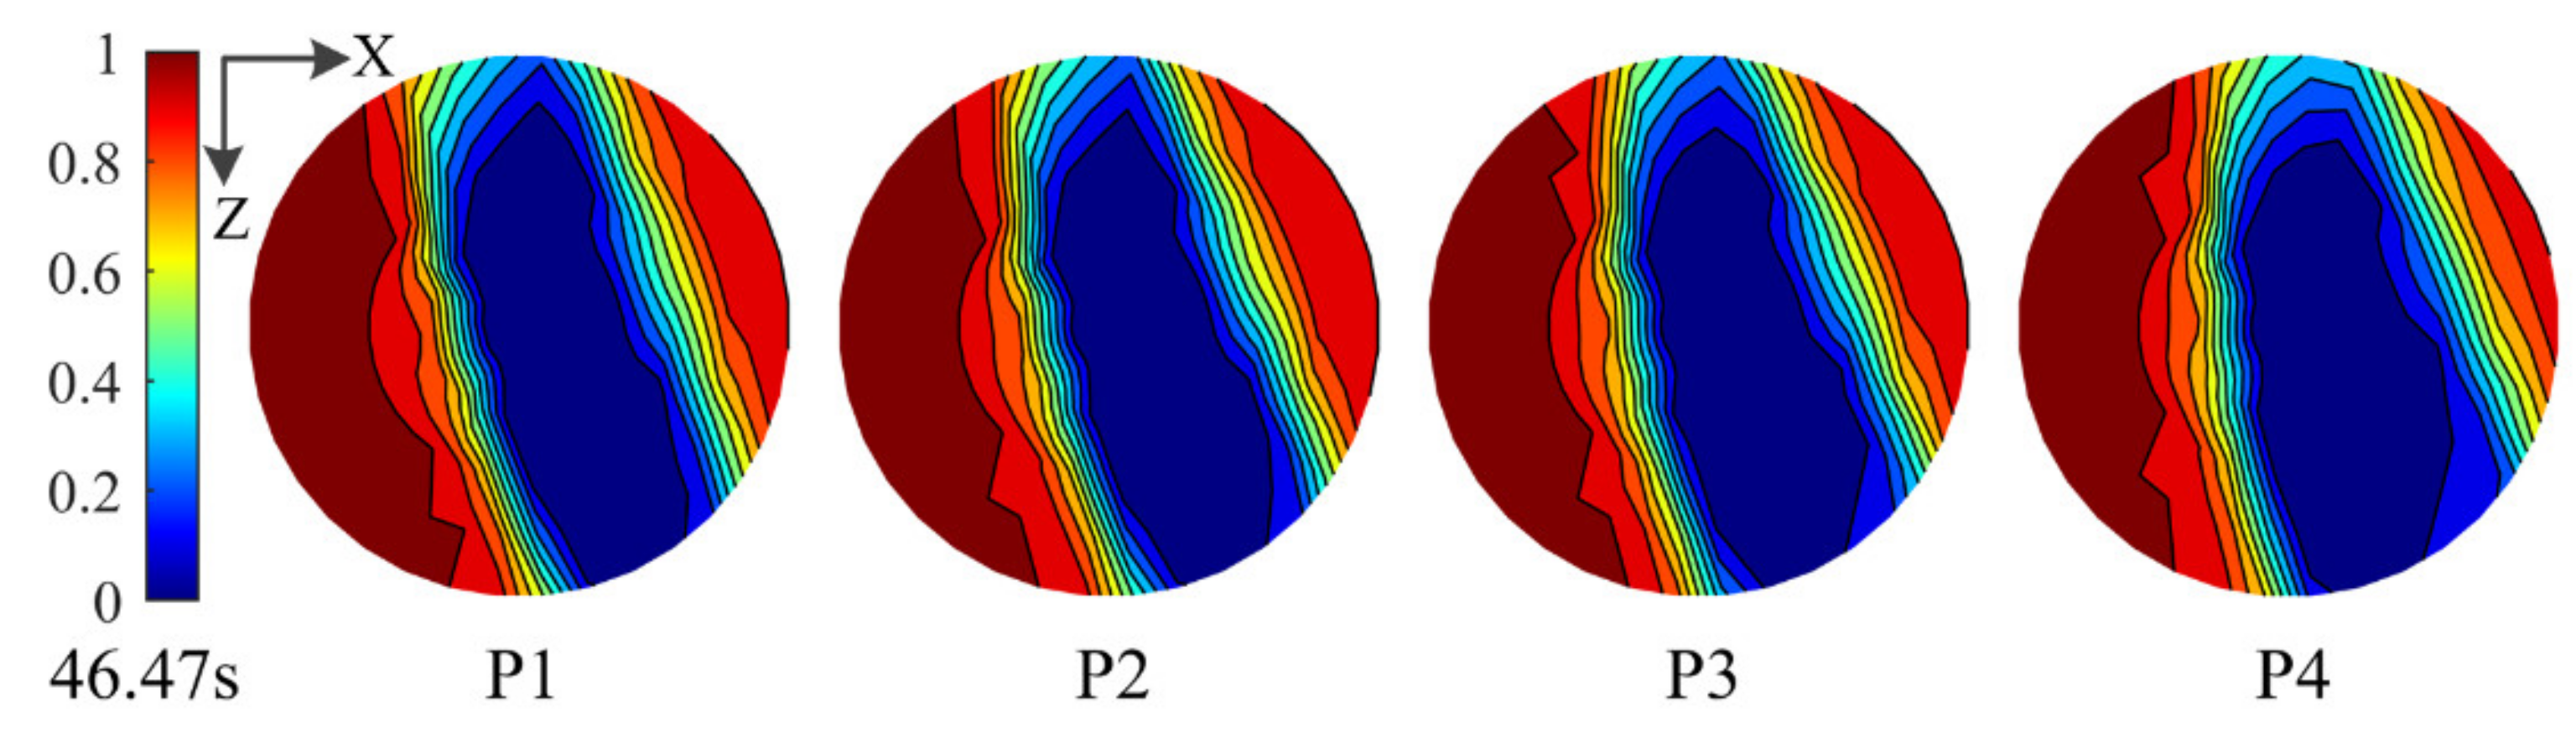
The edges of piers P2 and P3 of the non-isolated bridges are all significantly damaged. The damage to piers P1 and P4 is mainly concentrated in the left upper and right lower. Piers P2 and P3 are more severely damaged than piers P1 and P4.
(3)
The damage degree of each pier of the isolated bridge is almost the same. Furthermore, the damage index in a large part of the area on the left side of the pier reached 1. The edge of the right upper part of the pier was significantly damaged, but the damage index did not reach 1. A large part of the concrete on the left side of each pier was completely crushed, which is the main reason for the residual displacement of the pier in the X-direction.
(4)
The non-isolated bridge may collapse due to severe damage to some piers. For the isolation bridge, the isolation bearings fail firstly, and then the bridge may collapse due to severe damage to the piers.
In the case of the analyzed concrete bridge type and near-fault earthquake data, it can be concluded that the used isolating lead rubber bearings should not be recommended. In general, it can be stated that the selection of the types of bridge bearings in areas close to faults due to the specific characteristics of possibly generated seismic pulses should always be analyzed in detail. This should be conducted by designers in order to avoid unintentional amplifying of the bridge’s seismic response.

Author Contributions

Conceptualization, Y.G.; methodology, Y.G., J.C. and L.Z.; software, Y.G., J.C. and L.Z.; formal analysis, Y.G., J.C. and L.Z.; writing—original draft preparation, Y.G. and J.C.; writing—review and editing, Y.G. and L.Z.; project administration, Y.G.; funding acquisition, Y.G. All authors have read and agreed to the published version of the manuscript.

Funding

This research was funded by the National Natural Science Foundation of China (Grant No. 52108481), the Scientific and Technological Innovation Programs of Higher Education Institutions in Shanxi (Grant No. 2019L0547) and the Fundamental Research Program of Shanxi Province (Grant No. 201901D111134, Grant No. 201901D111169, and Grant No. 201801D221233).

Institutional Review Board Statement

Not applicable.

Informed Consent Statement

Not applicable.

Data Availability Statement

The data presented in this study are available on request from the corresponding author.

Conflicts of Interest

The authors declare no conflict of interest.

References

  1. Ko, Y.-F. Finite element analysis of reinforced concrete single-column bridge bent with flexural failure under near-fault ground motion. Int. J. Civ. Eng. 2021, 20, 237–256. [Google Scholar] [CrossRef]
  2. Han, Q.; Du, X.; Liu, J.; Li, Z.; Li, L.; Zhao, J. Seismic damage of highway bridges during the 2008 Wenchuan earthquake. Earthq. Eng. Eng. Vib. 2009, 8, 263–273. [Google Scholar] [CrossRef]
  3. Kawashima, K.; Takahashi, Y.; Ge, H.; Wu, Z.; Zhang, J. Damage of Bridges in 2008 Wenchuan, China Earthquake. Doboku Gakkai Ronbunshuu A 2009, 65, 825–843. [Google Scholar] [CrossRef] [Green Version]
  4. Hsu, Y.T.; Fu, C.C. Seismic effect on highway bridges in Chi Chi earthquake. J. Perform. Constr. Facil. 2004, 18, 47–53. [Google Scholar] [CrossRef]
  5. Van Cao, V. Characterization of near-fault effects on potential cumulative damage of reinforced concrete bridge piers. Int. J. Civ. Eng. 2019, 17, 1603–1618. [Google Scholar] [CrossRef]
  6. Roussis, P.; Constantinou, M.; Erdik, M.; Cakti, E.; Dicleli, M. Assessment of performance of seismic isolation system of Bolu viaduct. J. Bridge Eng. 2003, 8, 182–190. [Google Scholar] [CrossRef]
  7. Jónsson, M.H.; Bessason, B.; Haflidason, E. Earthquake response of a base-isolated bridge subjected to strong near-fault ground motion. Soil Dyn. Earthq. Eng. 2010, 30, 447–455. [Google Scholar] [CrossRef]
  8. Wang, Y.; Tang, Z.; Jing, G.Q. Effects of near-fault velocity pulse on the seismic response of isolated high-speed railway bridge. Int. J. Earth Sci. Eng. 2014, 7, 1964–1972. [Google Scholar]
  9. Shen, J.; Tsai, M.H.; Chang, K.C.; Lee, G.C. Performance of a seismically isolated bridge under near-fault earthquake ground motions. J. Struct. Eng. 2004, 130, 861–868. [Google Scholar] [CrossRef]
  10. Karalar, M.; Padgett, J.E.; Dicleli, M. Parametric analysis of optimum isolator properties for bridges susceptible to near-fault ground motions. Eng. Struct. 2012, 40, 276–287. [Google Scholar] [CrossRef]
  11. Dicleli, M. Performance of seismic-isolated bridges with and without elastic-gap devices in near-fault zones. Earthq. Eng. Struct. Dyn. 2008, 37, 935–954. [Google Scholar] [CrossRef]
  12. Zheng, W.; Wang, H.; Hao, H.; Bi, K.; Shen, H. Performance of bridges isolated with sliding-lead rubber bearings subjected to near-fault earthquakes. Int. J. Struct. Stab. Dyn. 2020, 20, 2050023. [Google Scholar] [CrossRef]
  13. Liao, W.-I.; Loh, C.-H.; Lee, B.-H. Comparison of dynamic response of isolated and non-isolated continuous girder bridges subjected to near-fault ground motions. Eng. Struct. 2004, 26, 2173–2183. [Google Scholar] [CrossRef]
  14. Jalali, R.S.; Jokandan, M.B.; Trifunac, M.D. Earthquake response of a three-span, simply supported bridge to near-field pulse and permanent-displacement step. Soil Dyn. Earthq. Eng. 2012, 43, 380–397. [Google Scholar] [CrossRef]
  15. Jalali, R.S.; Jokandan, M.B.; Trifunac, M.D. Earthquake response of a three-span bridge, with mid-span supported by isolators, to near-field pulse and permanent-displacement step. Soil Dyn. Earthq. Eng. 2013, 48, 89–103. [Google Scholar] [CrossRef]
  16. Ismail, M.; Rodellar, J.; Casas, J.R. Seismic behavior of RNC-isolated bridges: A comparative study under near-fault, long-period, and pulse-like ground motions. Adv. Mater. Sci. Eng. 2016, 2016, 481827. [Google Scholar] [CrossRef] [Green Version]
  17. Jiang, L.; Zhong, J.; Yuan, W. The pulse effect on the isolation device optimization of simply supported bridges in near-fault regions. Structures 2020, 27, 853–867. [Google Scholar] [CrossRef]
  18. Gao, Y. Study on RSAPS Based Refined Simulation Models for Seismic Damage Analysis of RC Bridge Components. Ph.D. Thesis, Tianjin University, Tianjin, China, 2016. (In Chinese). [Google Scholar]
  19. Chen, J. Seismic response analysis and isolation effect of RC frame structure under multi-dimensional near-field earthquake. Master Thesis, North University of China, Taiyuan, China, 2021. (In Chinese). [Google Scholar]
  20. Pacific Earthquake Engineering Research Center (PEER). PEER Strong Motion Database; University of California: Berkeley, CA, USA, 2000; Available online: http://peer.berkeley.edu/smcat/search.html (accessed on 12 September 2020).
  21. China Merchants Chongqing Transportation Research and Design Institute Co., Ltd. Specifications for Seismic Design of Highway Bridges, 1st ed.; China Communications Press Co., Ltd.: Beijing, China, 2020; pp. 49–52. (In Chinese) [Google Scholar]
  22. Zhu, D.S.; Lao, Y.C.; Shen, D.Y.; Li, Q. The seismic response features of isolated bridge with LRB. Eng. Mech. 2000, 18, 119–125. (In Chinese) [Google Scholar]
  23. Mohd-Yassin, M.-H. Nonlinear Analysis of Prestressed Concrete Structures under Monotonic and Cyclic Loads. Ph.D. Thesis, University of California, Berkeley, CA, USA, 1994. [Google Scholar]
  24. Menegotto, M.; Pinto, P.E. Slender RC compressed members in biaxial bending. J. Struct. Div. 1977, 103, 587–605. [Google Scholar] [CrossRef]
  25. Filippou, F.C.; Popov, E.P.; Bertero, V.V. Effects of Bond Determination on Hysterical Behavior of Reinforced Concrete Joins; EERC Report 83/19; Earthquake Engineering Research Center, University of California: Berkeley, CA, USA, 1983. [Google Scholar]
  26. Bonora, N. A nonlinear CDM model for ductile failure. Eng. Fract. Mech. 1997, 58, 11–28. [Google Scholar] [CrossRef]
  27. Pirondi, A.; Bonora, N. Modeling ductile damage under fully reversed cycling. Comput. Mater. Sci. 2003, 26, 129–141. [Google Scholar] [CrossRef]
  28. Li, Z.X.; Gao, Y.; Li, N. RSAPS-based isolation element model. Eng. Mech. 2016, 33, 144–149. (In Chinese) [Google Scholar]
  29. Casciati, F. Stochastic dynamics of hysteretic media. Struct. Saf. 1989, 6, 259–269. [Google Scholar] [CrossRef]
  30. Weisman, J.; Warn, G. Stability of elastomeric and lead-rubber seismic isolation bearings. J. Struct. Eng. 2012, 138, 215–223. [Google Scholar] [CrossRef]
Figure 1. Analysis model of the bridge.
Applsci 12 04878 g001
Figure 2. The section of the girder and the pier. (a) The section of the girder; (b) the section of the pier.
Applsci 12 04878 g002
Figure 3. The general construction diagram of the bearing. (a) The LRB bearing. (b) The laminated bearing.
Applsci 12 04878 g003
Figure 4. The cross-section fiber discretization method.
Applsci 12 04878 g004
Figure 5. Yassin’s concrete constitutive model.
Applsci 12 04878 g005
Figure 6. Tensile model of concrete.
Applsci 12 04878 g006
Figure 7. The stress–strain relationship of the steel material.
Applsci 12 04878 g007
Figure 8. The restoring force–displacement relationship of the isolation bearing model. (a) X-direction. (b) Z-direction.
Applsci 12 04878 g008
Figure 9. The acceleration spectra of the TCU068 ground motion.
Applsci 12 04878 g009
Figure 10. The acceleration time histories of the girder B2 point. (a) X-direction. (b) Z-direction.
Applsci 12 04878 g010
Figure 11. The displacement time histories of pier P2. (a) X-direction. (b) Z-direction.
Applsci 12 04878 g011
Figure 12. The shear force-time histories of pier P2. (a) X-direction. (b) Z-direction.
Applsci 12 04878 g012
Figure 13. The compression damage of concrete in the core area at 34.63 s.
Applsci 12 04878 g013
Figure 14. The compression damage of concrete in the core area at 35.81 s.
Applsci 12 04878 g014
Figure 15. The compression damage of concrete in the core area at 36.33 s.
Applsci 12 04878 g015
Figure 16. The compression damage of concrete in the core area at 37.31 s.
Applsci 12 04878 g016
Figure 17. The compression damage of concrete in the core area at 42.96 s.
Applsci 12 04878 g017
Figure 18. The compression damage of concrete in the core area at 47.74 s.
Applsci 12 04878 g018
Figure 19. The compression damage of concrete in the core area at 38.75 s.
Applsci 12 04878 g019
Figure 20. The compression damage of concrete in the core area at 40.10 s.
Applsci 12 04878 g020
Figure 21. The compression damage of concrete in the core area at 42.79 s.
Applsci 12 04878 g021
Figure 22. The compression damage of concrete in the core area at 44.08 s.
Applsci 12 04878 g022
Figure 23. The compression damage of concrete in the core area at 45.39 s.
Applsci 12 04878 g023
Figure 24. The compression damage of concrete in the core area at 46.47 s.
Applsci 12 04878 g024
Table 1. Parameters of the concrete material.
Concrete f c   ( MPa ) ε 0 ε 20 f t   ( MPa )
Protective layer−34.5−0.0025−0.0063.65
Core−35.8−0.0028−0.00723.65
Table 2. Parameters of the steel material.
E s   ( GPa ) f y   ( MPa ) b ε th ε cr D cr D 0 α
2103030.010.2591.40.0650.00.2175
Table 3. Failure time of the bearings.
BearingBearing01Bearing1Bearing2Bearing3Bearing4Bearing02
Failure Time (s)36.0135.3735.4035.4035.3735.95
Publisher’s Note: MDPI stays neutral with regard to jurisdictional claims in published maps and institutional affiliations.

