Article

Experimental Study of Mitigation of Wind-Induced Vibration in Asymmetric Cable-Stayed Bridge Using Sharp Wind Fairings

1
School of Highway, Chang’an University, Xi’an 710064, China
2
Department of Civil, Structural and Environmental Engineering, University at Buffalo, Buffalo, NY 14260, USA
*
Author to whom correspondence should be addressed.
Appl. Sci. 2022, 12(1), 242; https://doi.org/10.3390/app12010242
Submission received: 2 December 2021 / Revised: 24 December 2021 / Accepted: 25 December 2021 / Published: 27 December 2021

Abstract

:
This paper investigated the aerodynamic response features of an asymmetric cable-stayed bridge. The wind resistance design parameters for judging the response were first determined, afterwards the bridge dynamic characteristics were analyzed for subsequent aerodynamic analysis. The vortex-induced vibrations (VIV) and flutter response at various wind fairing angles were then examined by using a 1:50 sectional model in the wind tunnel test. Finally, a 1:150 full bridge aeroelastic model was employed to explore the aerodynamic stability and characteristics of the whole asymmetric bridge under different wind attack angles in various flow fields. The results show that the sharp wind fairings could reduce the VIV amplitude of the steel box girder cable-stayed bridge to some extent, and the example bridge has examined to have enough flutter stability through sectional and full bridge aeroelastic model wind tunnel tests. Unlike symmetric bridges, the bridge’s maximum displacement of first torsion mode shape is at the closure rather than the mid-span, which is the essential reason to lead this unique vibration feature. The results from the present study could highlight the important effect of structural asymmetry and fairing shape to the wind-induced bridge vibration and hence may facilitate more appropriate wind design of asymmetric cable-stayed bridges.

1. Introduction

The cable-stayed bridge with flexible steel girder is more vulnerable to wind loads. More specifically, various wind-induced vibration may occur in a long-span cable-stayed bridge, such as the vortex-induced vibration at low-speed wind [1,2,3,4,5], the buffeting response induced by the turbulence inherent in natural wind at strong wind [6], and the flutter instability due to the self-excited forces resulting from wind-bridge interaction. In spite of their vulnerability, the cable-stayed bridge continues to be built by virtue of their larger span and beautiful appearance. Therefore, it is necessary to investigate the wind-induced effects in the design stage. Although numerous researchers have presented analysis theories and prediction methods for VIV [7,8,9,10,11], buffeting [12,13], and flutter [14,15,16,17], the wind tunnel test would still be the most important and indispensable approach for evaluating the wind-resistant performance and exploring the countermeasures of final alternatives of long-span bridges [6,18,19].
To adapt to the asymmetry of terrain, landform, and other conditions, asymmetric structural forms are usually employed. The long-span asymmetric cable-stayed bridge with respect to vertical plane presents unique features of structural dynamics (in terms of modal properties) that may significantly affected its wind-induced vibration behavior. Hence, it is important to carefully examine wind effects of long-span asymmetric cable-stayed bridges. At present, there are few studies on the wind resistance of asymmetric cable-stayed bridges. He et al. [20] investigated the wind resistance of the Wuhu Yangtze River Bridge, conducted sectional and full bridge aeroelastic wind tunnel tests, and analyzed the wind-induced response at construction and service stage; however, they did not focus on the characteristics of asymmetric structures. Song et al. [21] investigated the Jingyue Yangtze River Highway Bridge’s wind resistance performance, measuring the displacement response of the mid span and quarter points in full bridge aeroelastic model wind tunnel test, while the closure displacement was not measured to study the asymmetric characteristics. Wang et al. [22] studied the VIV and vibration mitigating measures of Huangyi Changjiang River Bridge; however, owing only the sectional model test being adopted, the wind resistance characteristics of the asymmetric structure of the whole bridge cannot be considered.
Aerodynamic measures are often used to improve the wind-induced vibration performance for bridges. The wind tunnel experimental test is widely applied for investigating the performance of different aerodynamic measures. The section model test with large scale ratio is normally employed to measure the aerodynamic coefficients as well as VIV analyses and the investigation of two-degree-of-freedom-coupled flutter. Larsen et al. [23] discovered that lowering the bottom plate/side panel angle of the deck to less than 15° significantly eliminates VIV. Wang et al. [24] studied the impacts of affiliated facilities such as solid ratio of handrails, rail position, and wind fairing guide vanes on the bridge’s aerodynamic performance using a series of sectional model tests. Through the sectional models tests of Xiangshangang Bridge and Jiaojiang Bridge, MENG et al. [25] discovered that the variation of wind fairing angles of the deck affects the VIV of fully enclosed steel box girder cable-stayed bridges and semi-enclosed separated double box girder cable-stayed bridges. The full-bridge aeroelastic model test can simulate the bridge’s multi-order modalities, which can more accurately depict the bridge structure’s aerodynamic stability and wind-induced vibration response in the actual atmospheric boundary layer. Using the full bridge aeroelastic model test of the Third Nanjing Bridge across Yangtze River, Zhu et al. [6] proved that the bridge has enough aerodynamic stability and that the most unfavorable buffeting responses generally occur in yaw wind cases with a yaw angle between 5° and 30°. Diana et al. [26] used four aeroelastic models representing three different construction states and a service state of the bridge to verify the aerodynamic stability and buffeting response of the Izmit Bay Bridge in Turkey under various flow fields. Using sectional and full bridge aeroelastic model tests of the Stonecutters Bridge, Sham et al. [27] confirmed that aeroelastic damping controls the vertical and torsional response of the buffeting vibration.
Among them, wind fairing is a common measure to improve the flutter and VIV of cable-stayed bridges with steel box girders. In addition to the above Meng’s research, Tang et al. [28] indicate that a reasonable type of wind fairings could improve the flutter stability by weakening the vortex which drives the bridge to torsional vibration. Li et al. [29] tested three different wind fairings that were added to the original section. The results showed that after the wind fairings were placed, the deck’s VIV response was mitigated, and the wind fairings angle were reduced, the optimization effect was more significant. Larsen et al. [23] found that vortex shedding excitation could be mitigated if the angle between the bottom plate and lower side panel could be kept less than 15°.
In this study, an asymmetric cable-stayed bridge with span distribution as 2 × 66 m + 626 m + 3 × 60 m + 55 m (shown in Figure 1) is taken as the engineering background for detailing investigation. Figure 2 shows the deck configuration, which is a closed streamline cross-section of a single box girder with two wind-fairings. The cables are arranged in vertical planes at the edges of the deck fanning out from H-shaped towers with different heights and each tower is compounded of a major part of steel over the steel anchorage box and a concrete part below the steel anchorage box. The significant asymmetry is the unequal height tower, thus causing the unequal cable numbers. In order to identify the dynamic characteristics of asymmetric bridge which might reveal the essential mechanism of the wind-induced vibration phenomenal, the finite element model of the bridge is first developed for dynamic analysis. Then, a section model test is applied to identify the aerodynamic coefficients and examine the flutter and VIV response under different fairing angles. Afterwards, in order to evaluate the wind resistant stability of the bridge under different wind attack angles in uniform and turbulent wind fields, a 1:150 full bridge aeroelastic model is designed. The effects of VIV, flutter, and buffeting are all monitored and evaluated. Finally, the results from the present study could highlight the important effect of structural asymmetry and fairing shape to the wind-induced bridge vibration and hence may facilitate a more appropriate wind design of asymmetric cable-stayed bridges.

2. Wind-Resistant Design Parameters and Modal Analysis

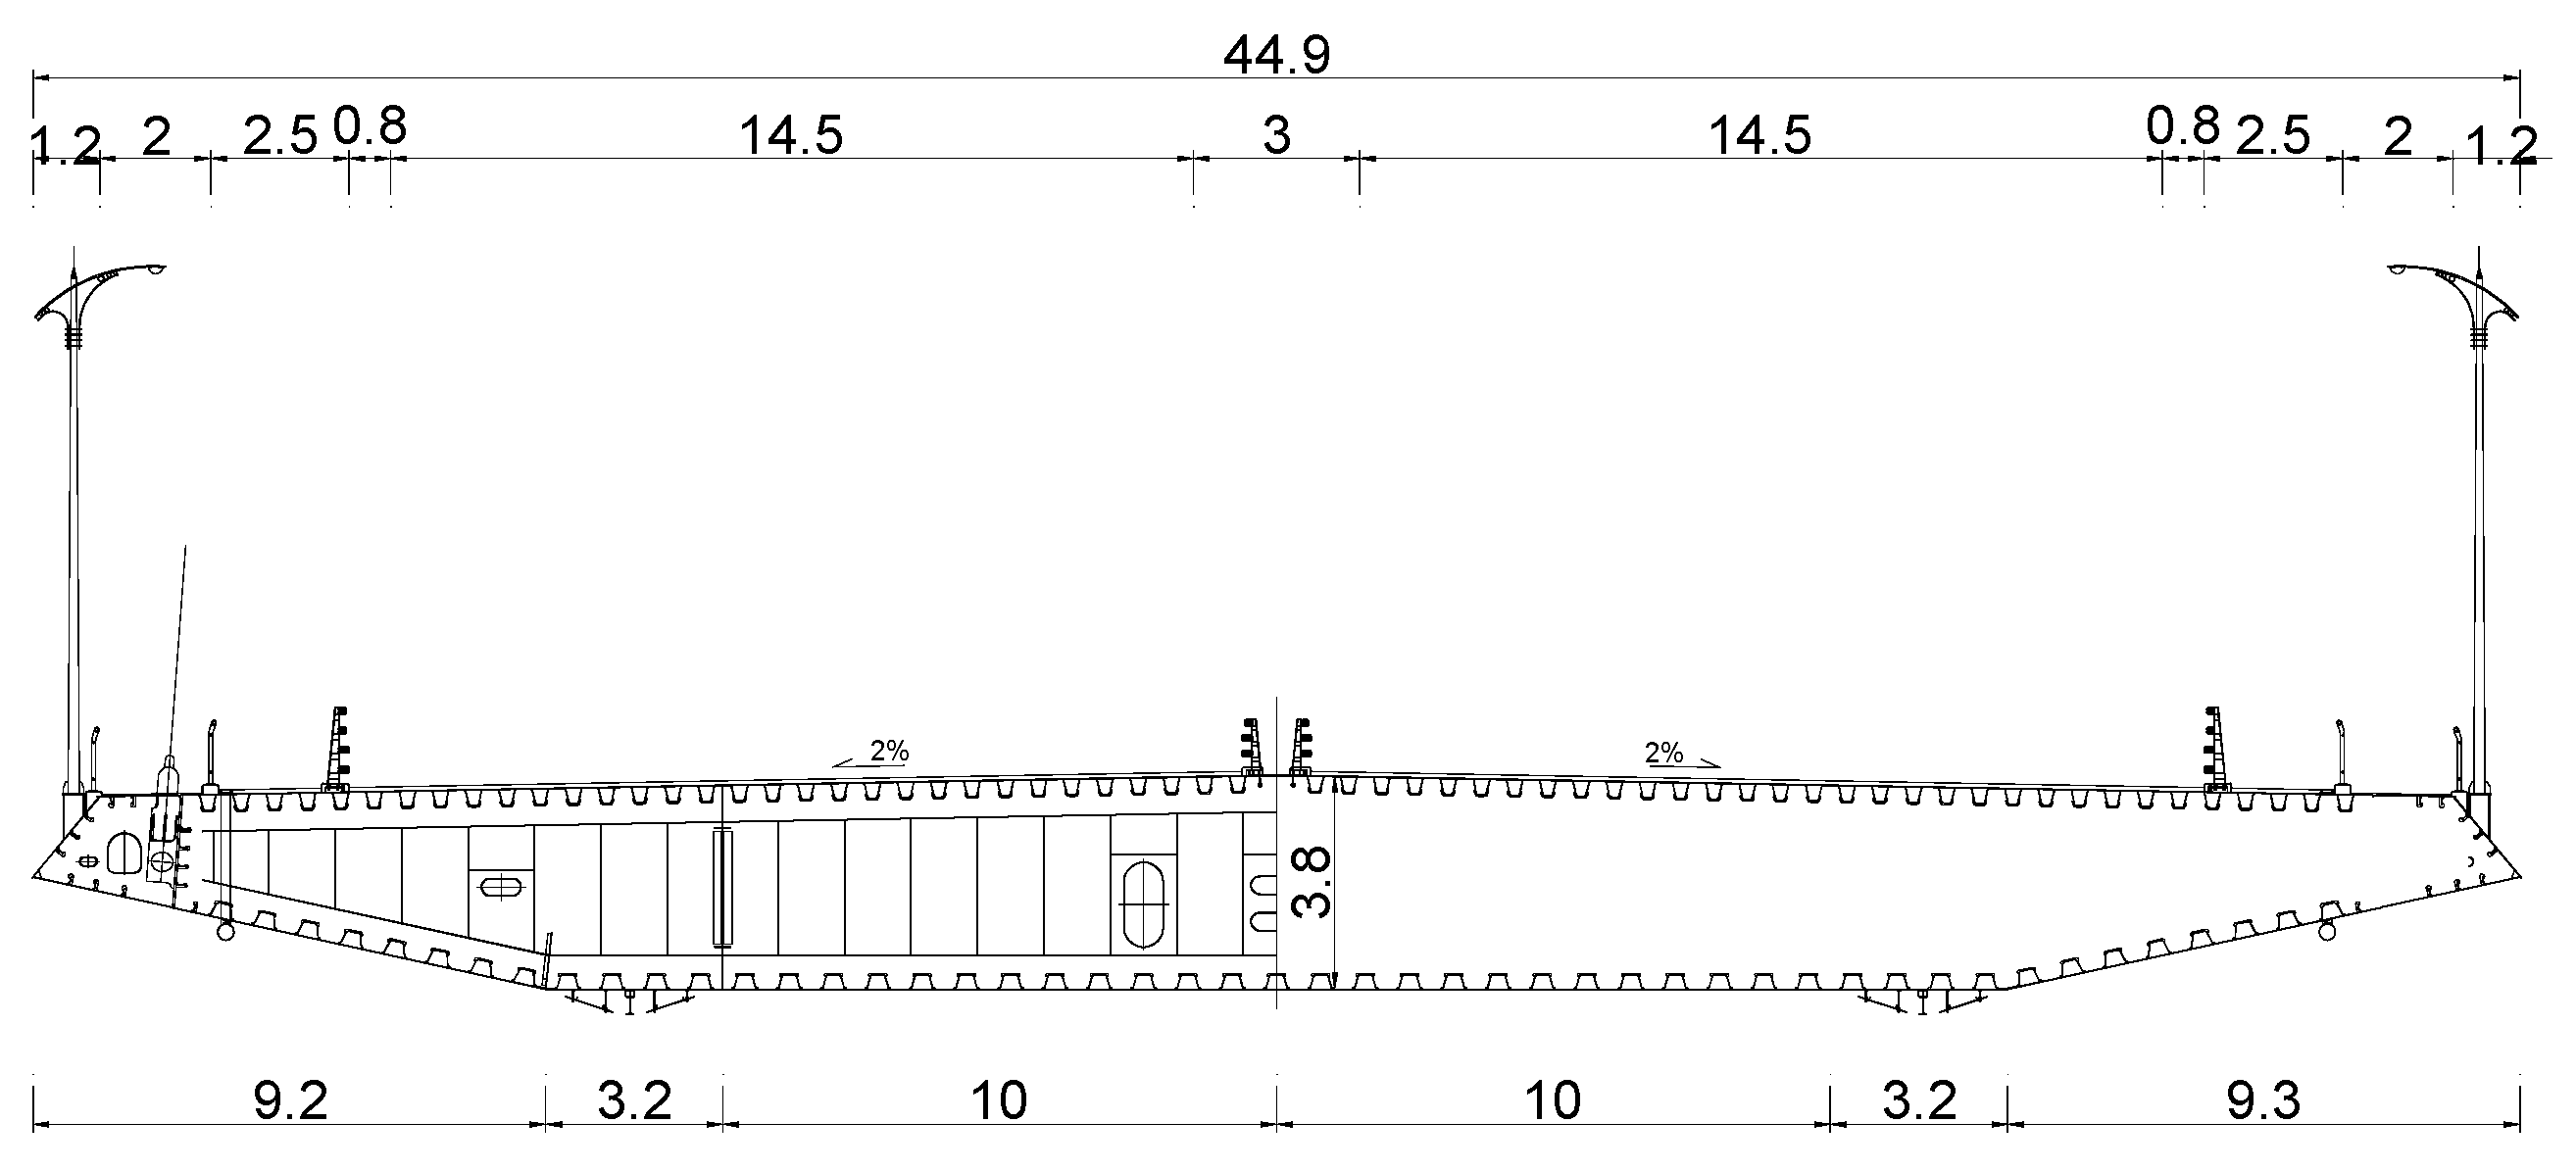
2.1. Determination of Basic Design Parameters

The bridge is located about 40 km from the Pearl River estuary, in the western Pacific Ocean’s strong wind belt, with six typhoons impacting the region in 2018, which could have a substantial impact on the bridge’s construction and service states. The wind parameters required for wind resistance design are determined according to “wind-resistant design specification for highway bridges” (‘Chinese Specification’ for short). The yearly-maximum 10 min averaged mean wind speed at 10 m height corresponding to 100-year return period, defined as basic wind speed at the bridge site (U10), is 32.8 m/s, according to the general condition of the bridge and Chinese Specification. The exponent of mean wind profile at the bridge site is about α0 = 0.16. The wind speed was calculated using the exponential distribution along the height of the bridge deck, thus the design reference wind speed (Ud) at deck level, which is 25 m above normal water level, could be calculated using Equation (1). According to the Chinese Specification, the flutter checking wind speed was calculated by Equation (2).
U s 10 = k c U 10 ,   U d U s 10 = k f ( Z 10 ) α 0
U f = γ f γ t γ α U d
where kc is conversion coefficient of basic wind speed surface category, and is set to 1.0 here according to the Chinese Specification. kf is the wind resistance risk factor, according to the Specification, the service stage is set to 1.05, construction stage is set to 0.88. Uf is the flutter checking wind speed. γf is the partial coefficient of flutter stability, when the wind tunnel test method is used to obtain the flutter critical wind speed, it is taken as 1.15. γt is the partial coefficient of spatial influence of wind speed fluctuation, according to the main span of the bridge and surface type, 1.27 is taken according to the Chinese Specification. γα is the partial coefficient of attack angle effect, when the wind angle of attack α is +3°, 0°, −3°, the value is taken as 1.0. The wind speed design parameters are shown in Table 1.

2.2. Modal Analysis

The finite element model (FEM) made of beams elements can accurately predict the eigenmode shapes and eigenfrequencies of cable-stayed bridges that are highly flexible and lightly damped structures, and these frequencies were used to analyze the bridge’s response to wind action. The ratio between the torsional and vertical frequencies of homologues mode shapes is critical: The higher this ratio, the higher the flutter velocity, as previously stated. The purpose of the FEM dynamics analysis is:
(1)
To gain further understanding of the inherent dynamic properties of bridge structures and to propose design solutions for improving wind resistance.
(2)
Provide design frequencies and vibration modes for sectional model and full bridge aeroelastic model testing.
(3)
Provide design parameters for calculating wind vibration response.
FEM was used to analyze the most unfavorable construction state and the service state of the bridge. The most unfavorable state was chosen as the longest single-cantilever construction state (‘construction state’ for short). Table 2 shows the basic frequencies of the two states. Figure 3 and Figure 4 shows the fundamental modes of construction and service state, respectively.
The lateral, vertical, and torsional mode shapes calculated by FEM are shown in Figure 5, respectively. Since the bridge is asymmetric, compared with those of symmetric bridges [6], the first vertical and lateral mode shapes are still symmetric about the mid-span, whereas the first-order torsional mode is no longer symmetrical, and the maximum displacement of positive symmetric torsional mode and 0 displacement of antisymmetric torsional mode appear at the closure rather than the mid-span, as seen in Figure 4a,b. It is assumed that the most unfavorable position of vertical and lateral is in the mid-span, while the most unfavorable position of torsion is in the closure, which will determine the arrangement of sensors in the full bridge aeroelastic model testing. Due to the asymmetry of the structure, the similarity of vertical and torsional modes of the deck is lower than that of the traditional symmetrical structure. Under the same conditions, such as vertical, torsional frequency and the ratio of them, the asymmetric structure is less prone to vertical torsional-coupled flutter.

3. Sectional Model Wind Tunnel Test

A linear scale of 1:50 was chosen for the sectional model and carried out in Chang’an University CA-1 boundary layer wind tunnel’s 3.0 × 2.5 m test section (shown in Figure 6). According to the flow physics involved, flutter phenomenon is often divided in two categories: one-degree-of-freedom flutter and two-degree-of-freedom-coupled flutter. The sectional model wind tunnel testing could demonstrate whether the bridge will be affected by them.

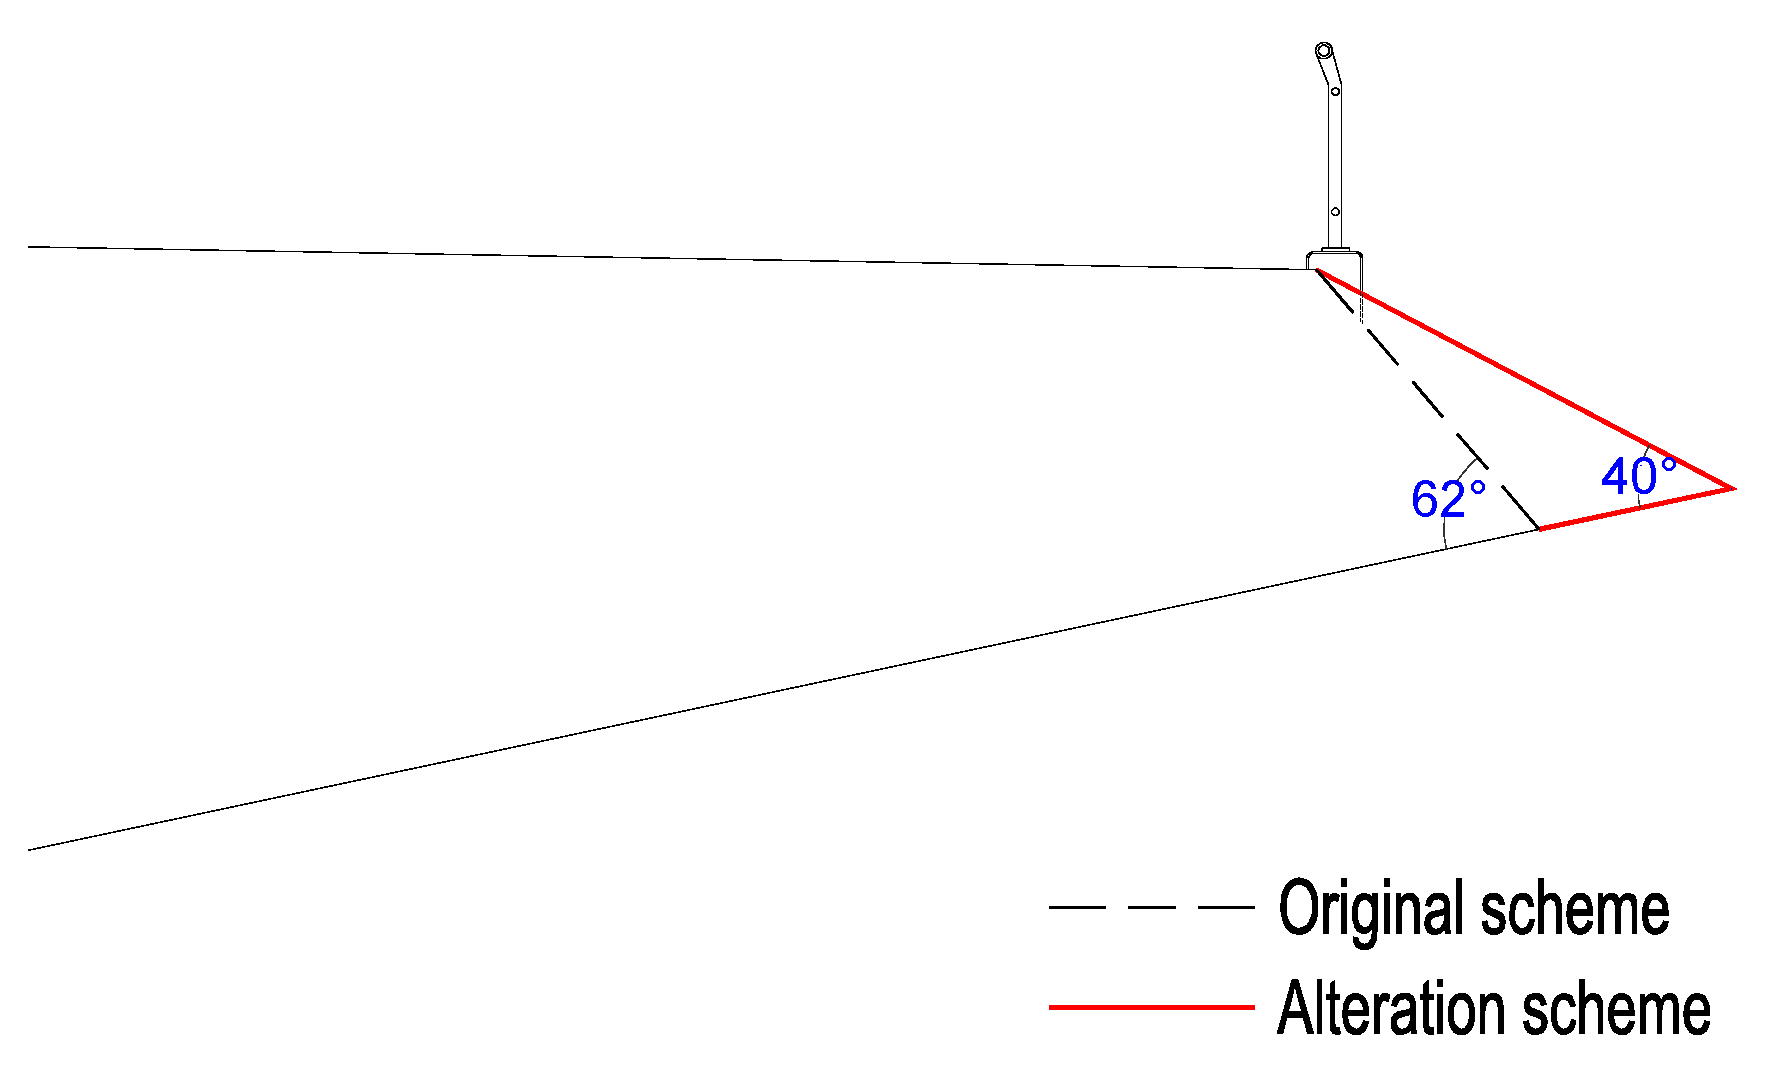
3.1. Aerodynamic Coefficient

Flutter instabilities are created by aerodynamic forces on the deck caused by motion (shown in Figure 7). One-degree-of-freedom flutter involves only one structural mode of the bridge, specifically the deck’s lowest torsion mode. The presence of a bluff windward edge on the deck, which permits significant leading-edge vortices to form, is a prerequisite for one-degree-of-freedom flutter. The aerodynamic force associated with motion increases as wind speed increases, bringing torsional and vertical frequencies of homologues mode shapes closer together, eventually forming a two-degree-of-freedom-coupled flutter instability.
The tests were performed on elastically suspended models, and aerodynamic coefficients were obtained for the construction and service states with a comparable profile to the actual bridge to investigate the effect of aerodynamic forces on the system. It can be seen that the aerodynamic coefficients change as a function of wind attack angle (α).
The aerodynamic coefficients are function of the wind angle of attack (α), as shown in Figure 8. The aerodynamic coefficients in wind axis are represented by the subscripts D and L, whereas in body axis are represented by the subscripts H and V, respectively. Because the slopes of the lift and moment coefficients of the deck at all test attack angles are positive, there is no one-degree-of-freedom instability. The enormous frontal windward area of the old Tacoma Bridge, as aforementioned, produces negative slope lift and moment aerodynamic coefficients, causing this instability and ultimately the bridge’s spectacular destruction.

3.2. Vortex-Induced Vibrations

Vortex forms in large volumes on non-streamlined bodies and decks, due to knuckle lines, wind screen, or other ancillary facilities. An elastically suspended model with correctly scaled mass and damping characteristics was used to measure the VIV. Table 3 lists the test conditions that were used to study the VIV in construction and service states. The vertical and torsional VIV limitations for construction and service states ruled by Chinese Specification are shown in Equation (3). The Chinese Specification specifies the VIV allowable magnitude of bridges with a span that is less than 200 m, but the VIV allowable magnitude of longer span bridges should be specially discussed. The vertical VIV allowable magnitude adopted by the Chinese Specification and Wind Resistant Design Manual for high-way Bridges in Japan [30] (“Japan Specification” for short) is presented in Equation (3). Because bridge VIV is generally symbolized by single-mode harmonic vibration, the displacement response of VIV can be approximately represented by a sine or cosine function. Then the corresponding allowable acceleration value Av can be taken as Equation (4). The first vertical mode frequency obtained by modal analysis is 0.2688 Hz. It is easy to calculate that the acceleration is 0.42 m/s2 by substituting into Equation (4). Compared with the specifications of various countries and the technical report of RWDI, when 0.25 Hz < fv < 1.0 Hz, the VIV allowable magnitude of RWDI UK is the most stringent [31], that is, when the wind speed is less than 20 m/s, the vertical acceleration amplitude of the deck does not exceed 0.4 m/s2, which is slightly different from the allowable acceleration value derived from the Chinese Specifications. ISO-2631-3-1985 lists the root mean square limit of human vibration acceleration that may lead to motion sickness, which is called severe discomfort boundary (SDB). The SDB is related to the time and frequency of vibration. It is divided into three classes according to the time of vibration, which are 30 min, 2 h, and 8 h, respectively. Considering that the time of vehicles passing through the bridges is often less than 30 min and the time of pedestrians passing through the bridges is basically less than 2 h, the “2 h motion sickness limit” can be conservatively adopted as the VIV limit of the bridge. When 0.1 Hz < fv < 0.315 Hz, the root mean square value of acceleration corresponding to “2 h motion sickness limit” is equal to 0.5 m/s2. Meantime, the results calculated by Chinese Specifications meet the requirements of ISO-2631-3-1985. Furthermore, the visual impact of the oscillations could distract motorists and possibly impede road safety, for the high-order modal VIV with three or more half waves, the VIV amplitude shall be limited to less than 0.35 m at least [31], and the vertical VIV allowable magnitude calculated by Chinese Specification is hv = 0.04/0.2688 = 0.1488 m < 0.35 m. Therefore, when the span exceeds 200 m, the VIV allowable magnitude specified in the Chinese Specification is overly strict and can still be used. The results are included in Table 3.
h v < γ v 0.04 f v ,   θ t < γ v 4.56 B f t
A v = γ v 0.04 f v ω b 2 = 0.04 f v ( 4 π 2 f v 2 ) = 1.58 f v
hv is the vertical VIV amplitude (m); fv is the first vertical mode frequency (Hz); γv is the VIV coefficient, which is set to 1.0 when taking wind tunnel test to obtain, θt is the torsional VIV amplitude (°); ft is the first torsional mode frequency (Hz).
As is shown in Figure 9a,b, there is no VIV phenomenon during the construction state. While in service state, the vertical and torsional amplitudes caused by VIV exceed the limit value defined by the Chinese Specification. Furthermore, both have two lock-in ranges, indicating that the bridge may appear hazardous vibrations at both low and high wind speeds. All these should be mitigated properly.
To mitigate VIV, there are three basic measures: aerodynamic countermeasure, mechanical countermeasure, and structural countermeasure [32]. It is widely used since the aerodynamic countermeasure such as changing the angle of wind fairings is a method that the added cost of installation and maintenance could be low. Specific aerodynamic measures can be determined by a mixture of computational fluid dynamics (CFD) and wind tunnel tests. It has been proved that appropriate reduction of the wind fairings angle can mitigate the VIV amplitude with no adverse effect on flutter stability [25]. The application of aerodynamic countermeasure, as depicted in Figure 10.
Through the CFD results, not only the aerodynamic forces of the air flow acting on the deck can be simulated, but also the distribution of the air flow outside the deck can be obtained, which provides intuitive information for qualitatively explaining the impact of the change of wind fairings angle on the aerodynamic characteristics of the deck. Due to the influence of auxiliary structure, the triangular unstructured mesh is adopted to facilitate mesh division. The mesh size near the deck gradually increases, the growth rate is not greater than 1.15, and the mesh quality is controlled above 0.46. After mesh independence verification, the number of meshes in the final calculation scheme is about 100,000. Fluent is used for simulation and the commonly used SST k-ω turbulence model is adopted.
Two larger-scale vortices are created near the deck, including a big one on the deck and one on the downwind knuckle lines with blunt wind fairings while there is just one vortex on the downwind knuckle lines with sharp wind fairings, as shown in Figure 11. Only by changing the wind fairing angle does the wind flow around the deck change significantly. The formed vortices with blunt wind fairings are not only low in frequency and high in energy but they are also easy to detach from deck and form von Karman vortex street. Only a smaller vortex forms with sharp wind fairings, which will modify the vortices’ action position and the aerodynamic forces on the deck. As a result, it can be concluded that sharping the wind fairings angle is useful in mitigating the VIV phenomenon by CFD.
In the sectional model wind tunnel test, the VIV was investigated with 40° wind fairings. The VIV suppression effect is compared in Figure 12 when the wind attack angles are 0°, +3°, and +5° in the service state.
The test shows that the vertical VIV disappears and the torsional VIV with two lock-in ranges is mitigated with sharp wind fairings. The VIV peak value is far less than the limit value. It can be concluded that sharpening the wind fairings could mitigate the VIV phenomenon caused by wind tunnel testing. The test results also verify the effectiveness of the above CFD analysis results.

3.3. Flutter Instability

The bridge is not prone to one-degree-of-freedom instability; hence, the elastically suspended section model wind tunnel test will be used to verify if the bridge will suffer two-degree-of-freedom-coupled instability. The test results are reported in Table 4, and it can be concluded that the bridge with sharp wind fairings is flutter stable since it does not have two-degree-of-freedom-coupled instability.

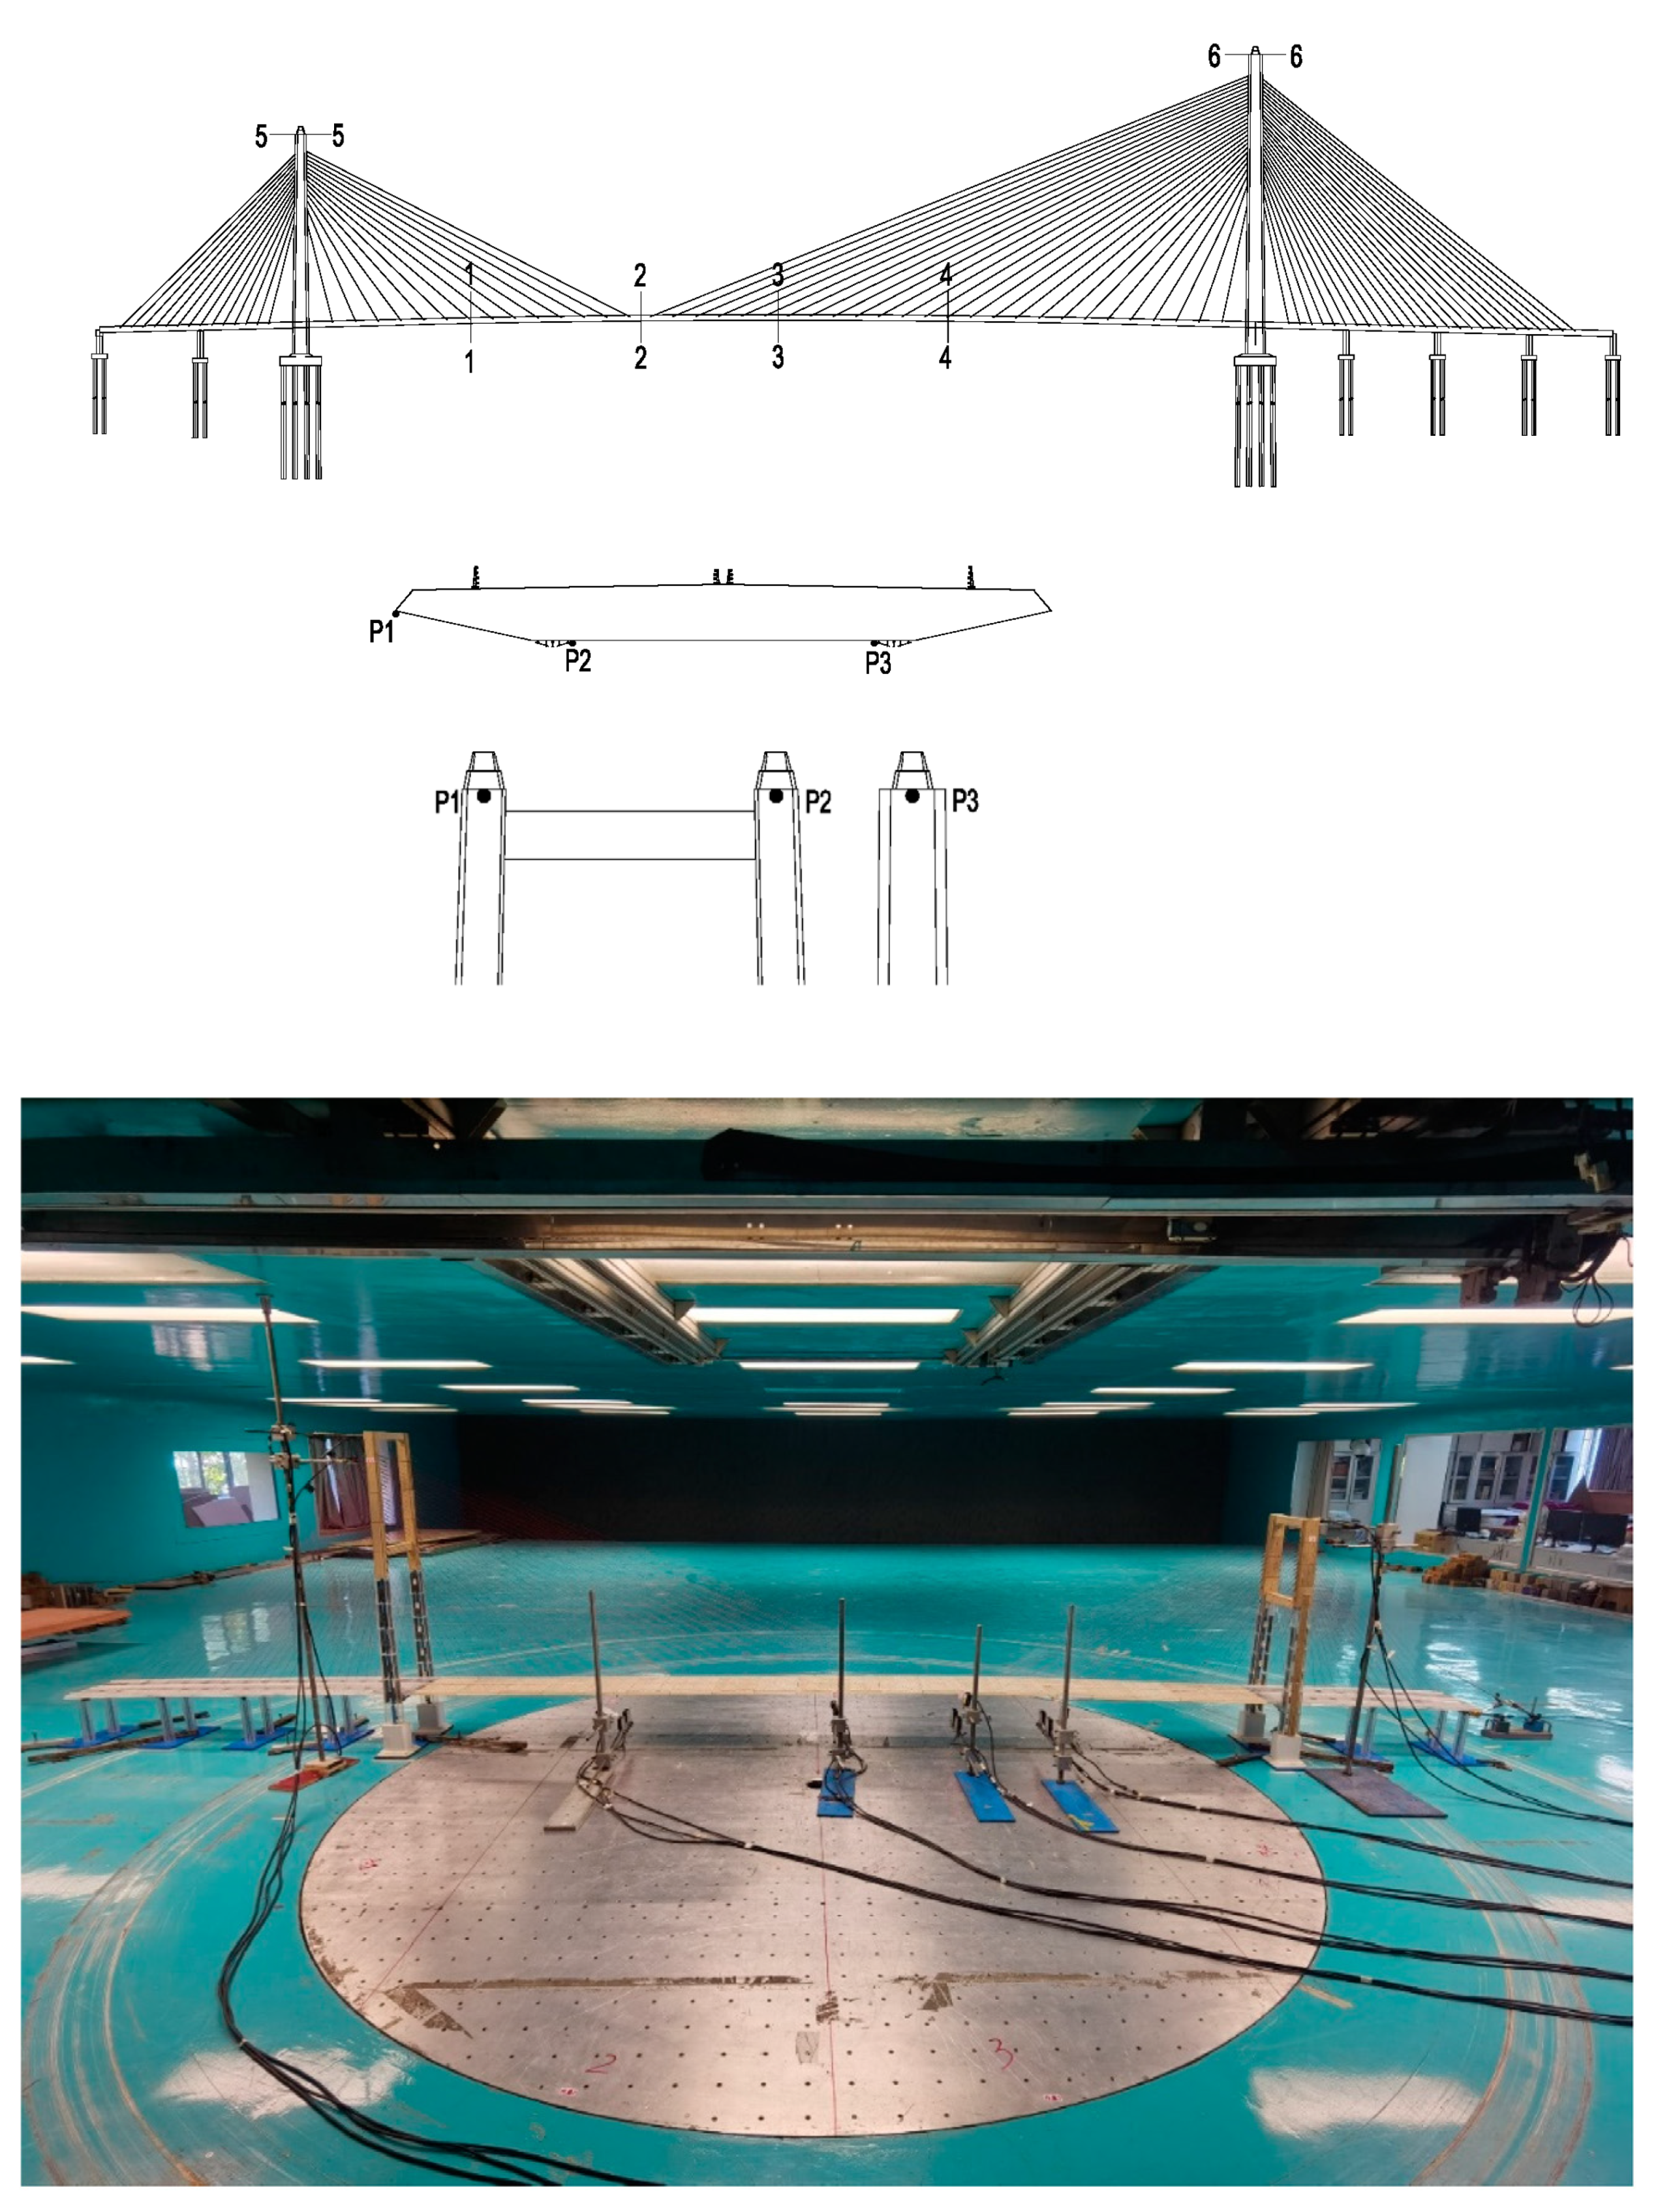
4. Full Bridge Aeroelastic Model

Owing to the fact that the sectional model wind tunnel test is not enough to fully reflect the aerodynamic response of asymmetric structures, in order to investigate wind stability further than the optimization measure scheme, the VIV and flutter performances of the bridge were investigated via a full bridge aeroelastic model test in both uniform and turbulent wind fields with various combinations of wind attack angles. Although the full bridge aeroelastic wind tunnel test has some drawbacks, such as not meeting all similar criteria at the same time and having a small scale, it can more realistically reflect the aerodynamic stability and wind-induced vibration response in the atmospheric boundary layer, as well as take into account three-dimensional spatial effects and multimodal coupling effects. As a result, a full bridge aeroelastic wind tunnel test for the bridge is necessary.

4.1. Modelling Parameters

The full bridge aeroelastic model test was carried out in the TJ-3 Wind Tunnel at Tongji University, China. A full bridge aeroelastic model at scale of 1:150 taking into account the actual parameters of the TJ-3 boundary layer wind tunnel were designed to be as close to the prototype as possible in terms of dominant structural features, mass properties, geometry, and wind loading. The model was designed using the Froude similarity so that it has the same shape, dynamic properties, and mass as the prototype structure. Other scaling property ratios were calculated using the geometrical scale ratio and the accompanying similarity criteria, which are listed in Table 5.

4.2. Model Design and Manufacture

Because some structural properties, such as axial stiffness of beams or bending stiffness of cables, have little impact on bridge response, it is usually impracticable or unnecessary to represent all structural properties precisely. As a result, the relevance of each property is given due consideration in the modeling of each element, and the modeling simplification is done accordingly.
The model’s deck was comprised of aluminum core beam (simulating the deck stiffness), high-dense foam coats (simulating the deck appearance), auxiliary equipment, and lead compensating weights. The aluminum core beam employed a “U” shaped skeleton to meet the identical requirements of lateral, vertical and torsional stiffness of the deck. To replicate the aerodynamic shape, the shape of the concrete deck was simulated with plexiglass, while the shape of the steel deck was simulated with light wood. Auxiliary facilities, such as the central separation belt, various railings, and the maintenance vehicle track and its deflector, were simulated. Lead compensating weights were pasted into the coat to adjust the deck’s mass and mass moment of inertia.
The stay cable was made up of constantan wire and spring to simulate its shape and tension. Steel core beams, light wood coats, and compensating weights made up the model’s towers and piers. The steel core beams were selected with rectangular sections and their parameters were established to fulfill identical stiffness requirements, and the towers and piers were generally simulated in longitudinal and transverse bending. Furthermore, all support conditions for the deck and towers or piers must be precisely simulated, with the appropriate restrictions and motion releases. This was accomplished by combining the use of leaf springs, wires, and rigid connections. After installation, the full bridge aeroelastic model placed in TJ-3 wind tunnel is shown in Figure 13.

4.3. Model Validation

To verify the accuracy of the bridge’s dynamic characteristics simulation, the model should be validated by checking the eigenmode frequencies, mode shapes, and damping values prior to testing.
The model’s first vertical and torsional frequencies and damping ratio are critical characteristics. The service state’s model frequencies and modal damping ratios were identified using the free-decay vibration approach, and are listed in Table 6. Except for the symmetric torsion, which is slightly greater than the limit, the discrepancy of modal frequency is within the allowed range. Considering that the deck is a steel-concrete composite beam, the damping ratio is also within a reasonable range according to the Specifications. All of this demonstrates that the test’s model design, manufacture, and installation were successful.

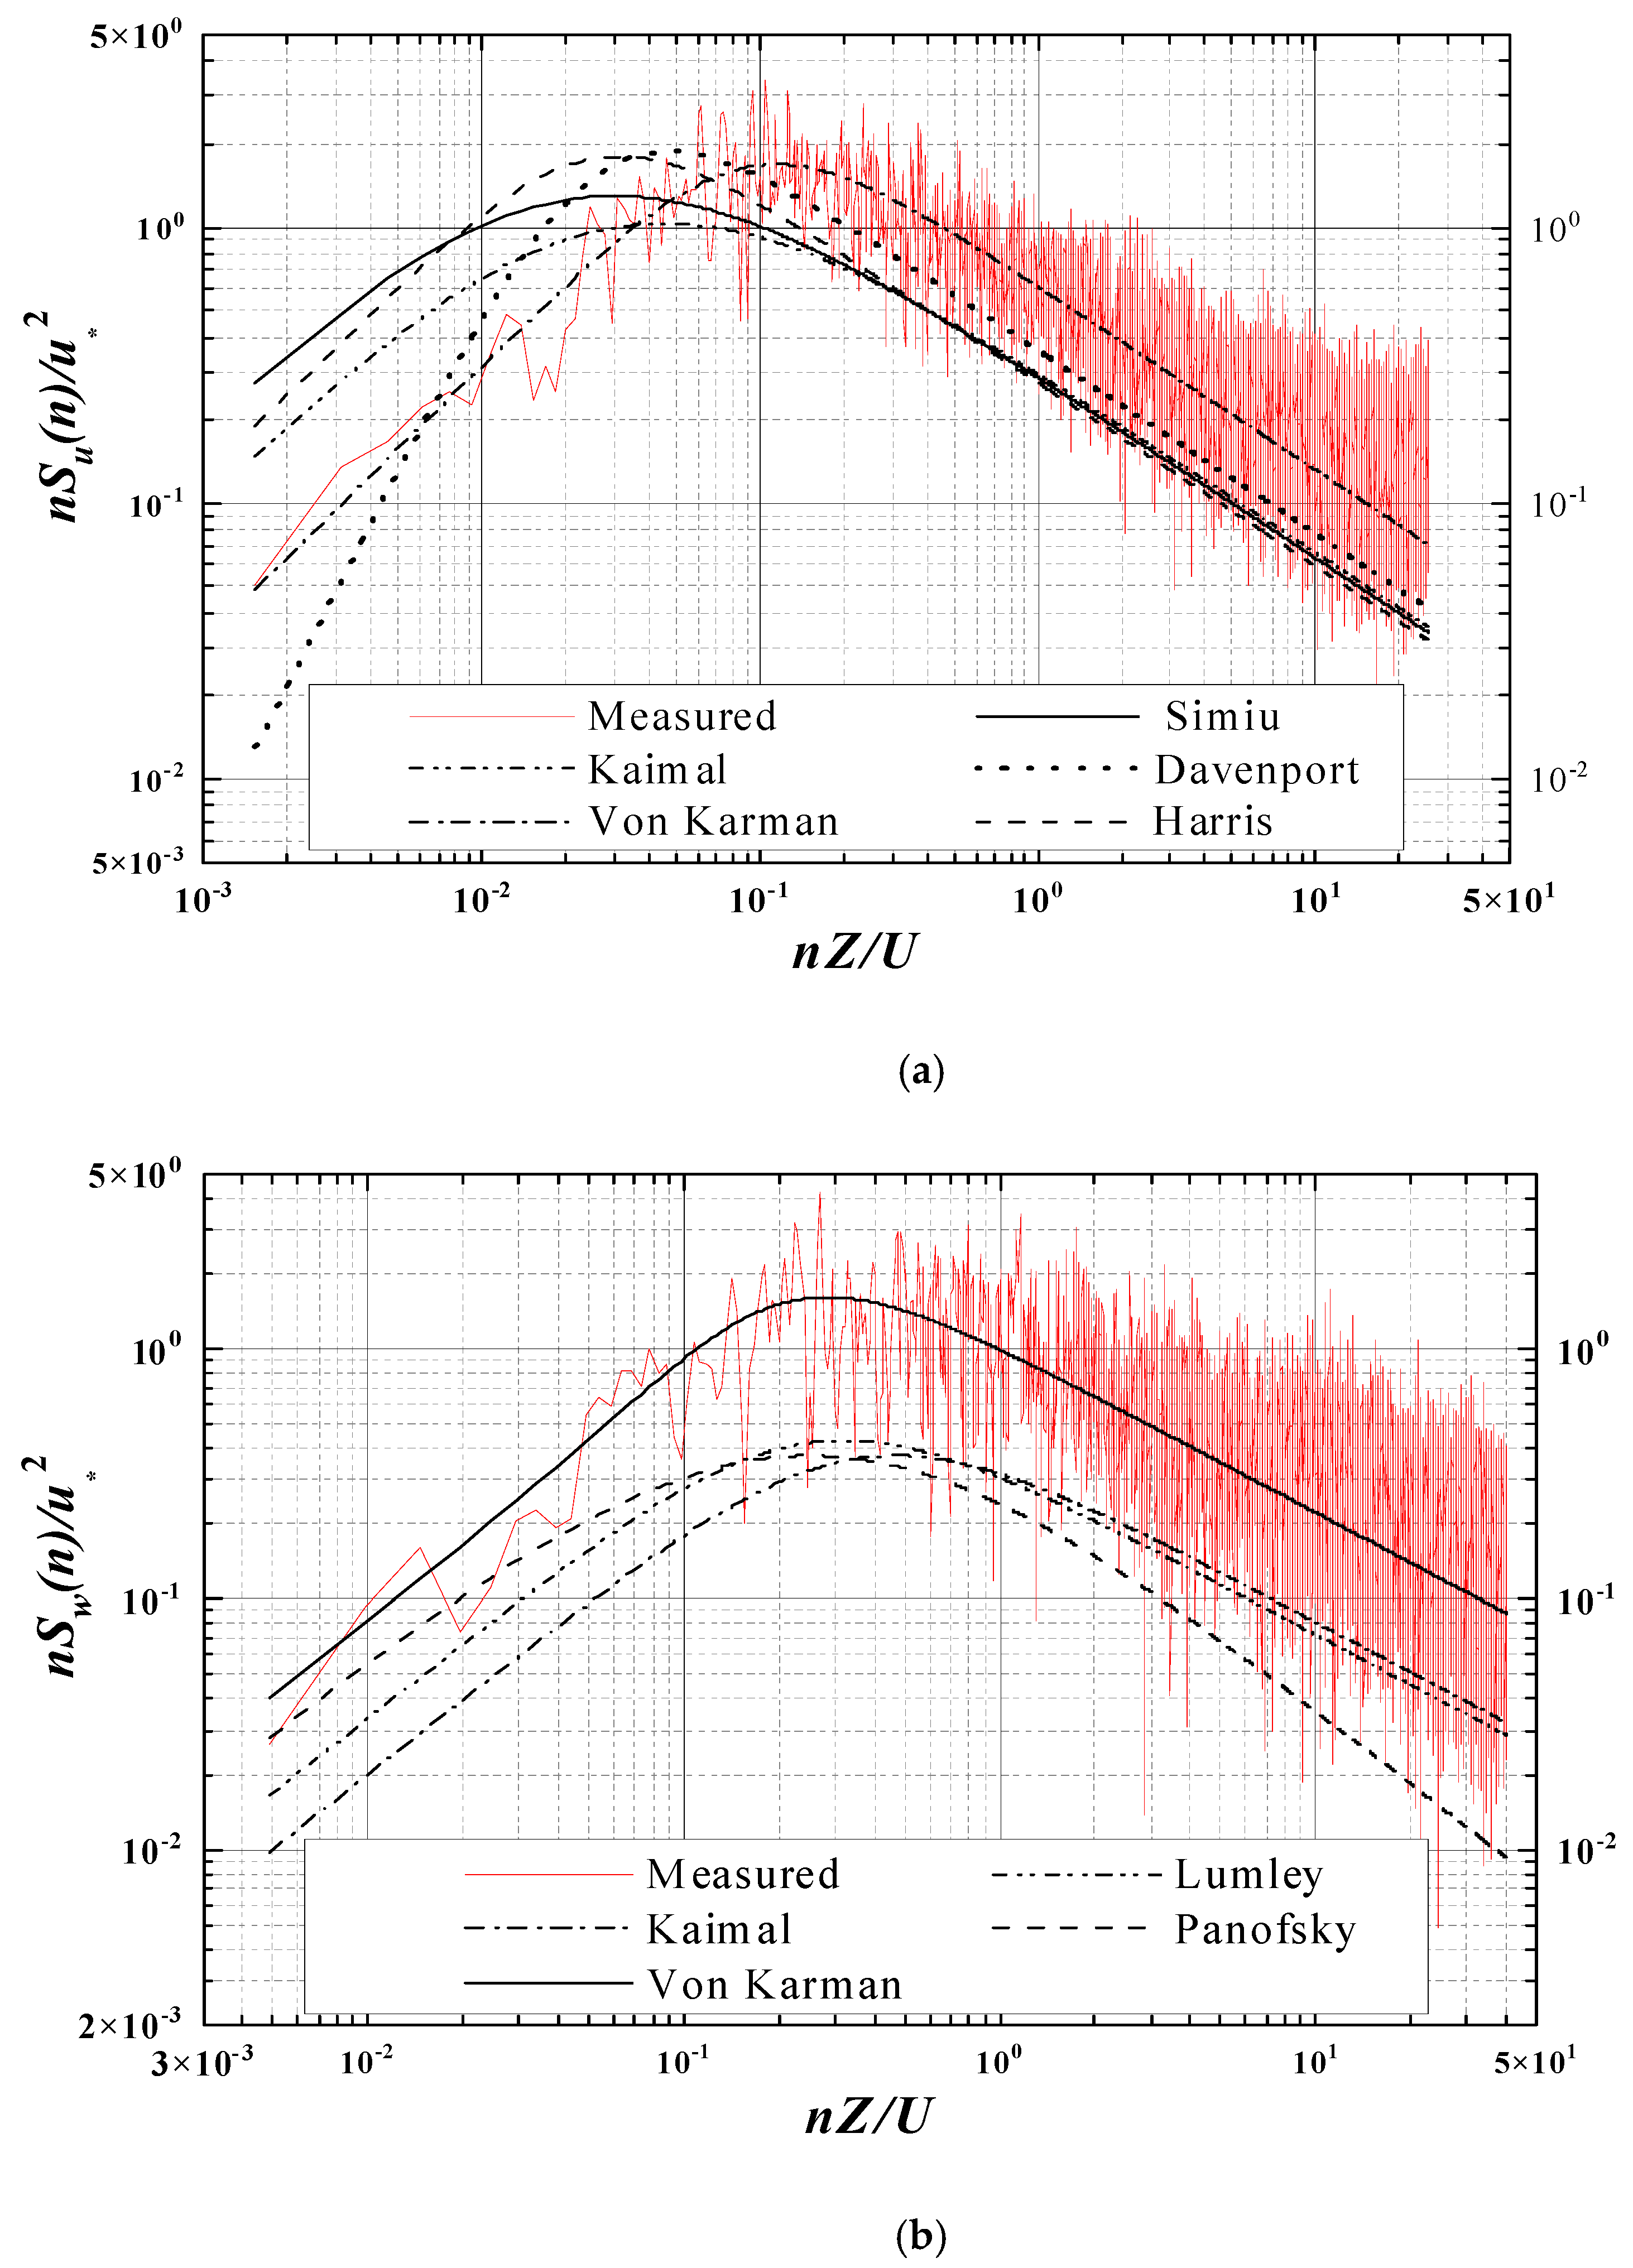
4.4. Simulation of Wind Field

An atmospheric boundary layer wind field (turbulent wind) with a scaling ratio of 1:150 was simulated in the TJ-3 wind tunnel of Tongji University using the roughness and spirelets, as indicated in Figure 14, for a Class B landform based on an investigation of the wind environment at the bridge location. The exponent of mean wind profile is set at 0.16, and the gradient wind height is set at 350 m. The mean wind speed profile measured in the wind tunnel at the bridge’s intended location is shown in Figure 15a. The targeted profile with a power law exponent of 0.16 is also presented on the same graph. This demonstrates that the provided mean wind profile is appropriate. Figure 15b compares the measured turbulence intensities to the target values, which were taken at the bridge’s intended location in the wind tunnel. Figure 16 shows the measured turbulence spectra at deck level, as well as several empirical spectra [33,34,35].

4.5. Measurement Point Arrangement

According to the dynamic analysis, the layout of measuring points is shown in Figure 17. The measured sections were 1-1 cross-section at the quarter span of the low tower side, 2-2 cross-section at the closure, 3-3 cross-section at the mid-span of the bridge, 4-4 cross-section at the quarter span of the high tower side, 5-5 cross-section at the top of the low tower, and 6-6 cross-section at the top of the high tower in order to study the wind vibration response of the asymmetric bridge. The vertical, lateral, and torsional displacement responses of the deck, as well as the longitudinal, transversal, and torsional displacement responses of the bridge tower, were measured using three sensors for each section. Two sensors measured the vertical motion on either side of the deck, from which the pure vertical and torsional components could be separated, while the third measured lateral motion.

5. Major Test Results and Findings

The full aeroelastic bridge model was tested in uniform flow for final verification of aeroelastic stability, as well as in turbulence for verification of the buffeting calculations. To investigate the aerodynamic stability under different wind attack angles, metal pads were placed at the bottom of the bridge piers and towers. The wind attack angles were adjusted to −3°, 0°, and +3° for the tests in this study.

5.1. Vortex-Induced Vibrations in Uniform Wind

The test curves of the vertical and torsional root mean square (RMS) were subject to different mean wind speeds (U) for the deck response at mid-span and closure of the service state, under uniform wind with most unfavorable wind attack angle, where the responses and wind speed were transferred to the prototype values, as shown in Figure 18a,b, respectively. The VIV with lock-in range was also measured in the full bridge aeroelastic model test, which is similar to the sectional model test. Furthermore, the vertical response of 2-2 cross-section(mid-span) is larger than that of 3-3 cross-section(closure), as shown in Figure 18a, while the torsional response of the closure section is greater than that of the mid-span section, as shown in Figure 18b. It is also demonstrated that an asymmetric structure’s torsional mode differs from that of a symmetric structure. In addition, it is found in Figure 18 that the sharp wind fairings can significantly mitigate the VIV, and the vertical or torsional VIV of the bridge with sharp wind fairings exceeds the deck’s permitted amplitude with a very small probability.

5.2. Flutter in Uniform Wind

Due to the presence of self-excited vibration, the response of the deck in uniform wind is not zero, as shown in Figure 19 a,b, respectively. The vertical and torsional RMS of deck responses at the mid-span and closure in the service state were not higher than 0.464 m and 0.040°, respectively, for all sections and wind directions concerned, up to a wind speed of 58.24 m/s (Flutter text wind speed). Furthermore, the aerodynamic instability phenomena did not occur up to a wind speed of 75 m/s, showing that the flutter critical wind speed of service state is much higher than flutter text wind speed, indicating that the bridge has sufficient flutter stability margin in uniform wind. Furthermore, the vertical response of each measure points is the largest when the wind attack angle is −3°, indicating that the bridge is more susceptible to negative wind attack angles. In addition, the response is largest in 3-3 cross-section, which corresponds to the vertical mode’s maximum value above. In terms of torsion, the bridge is more susceptible to positive attack angles, and the 2-2 cross-section’s response is largest when the attack angle is +3°, which corresponds to the maximum value of the torsion mode above. Therefore, it can be inferred that, because the maximum position of vertical and torsional response of asymmetric bridge is not in the same section, the vertical and torsion are not easy to couple, so as to improve the flutter critical wind speed.

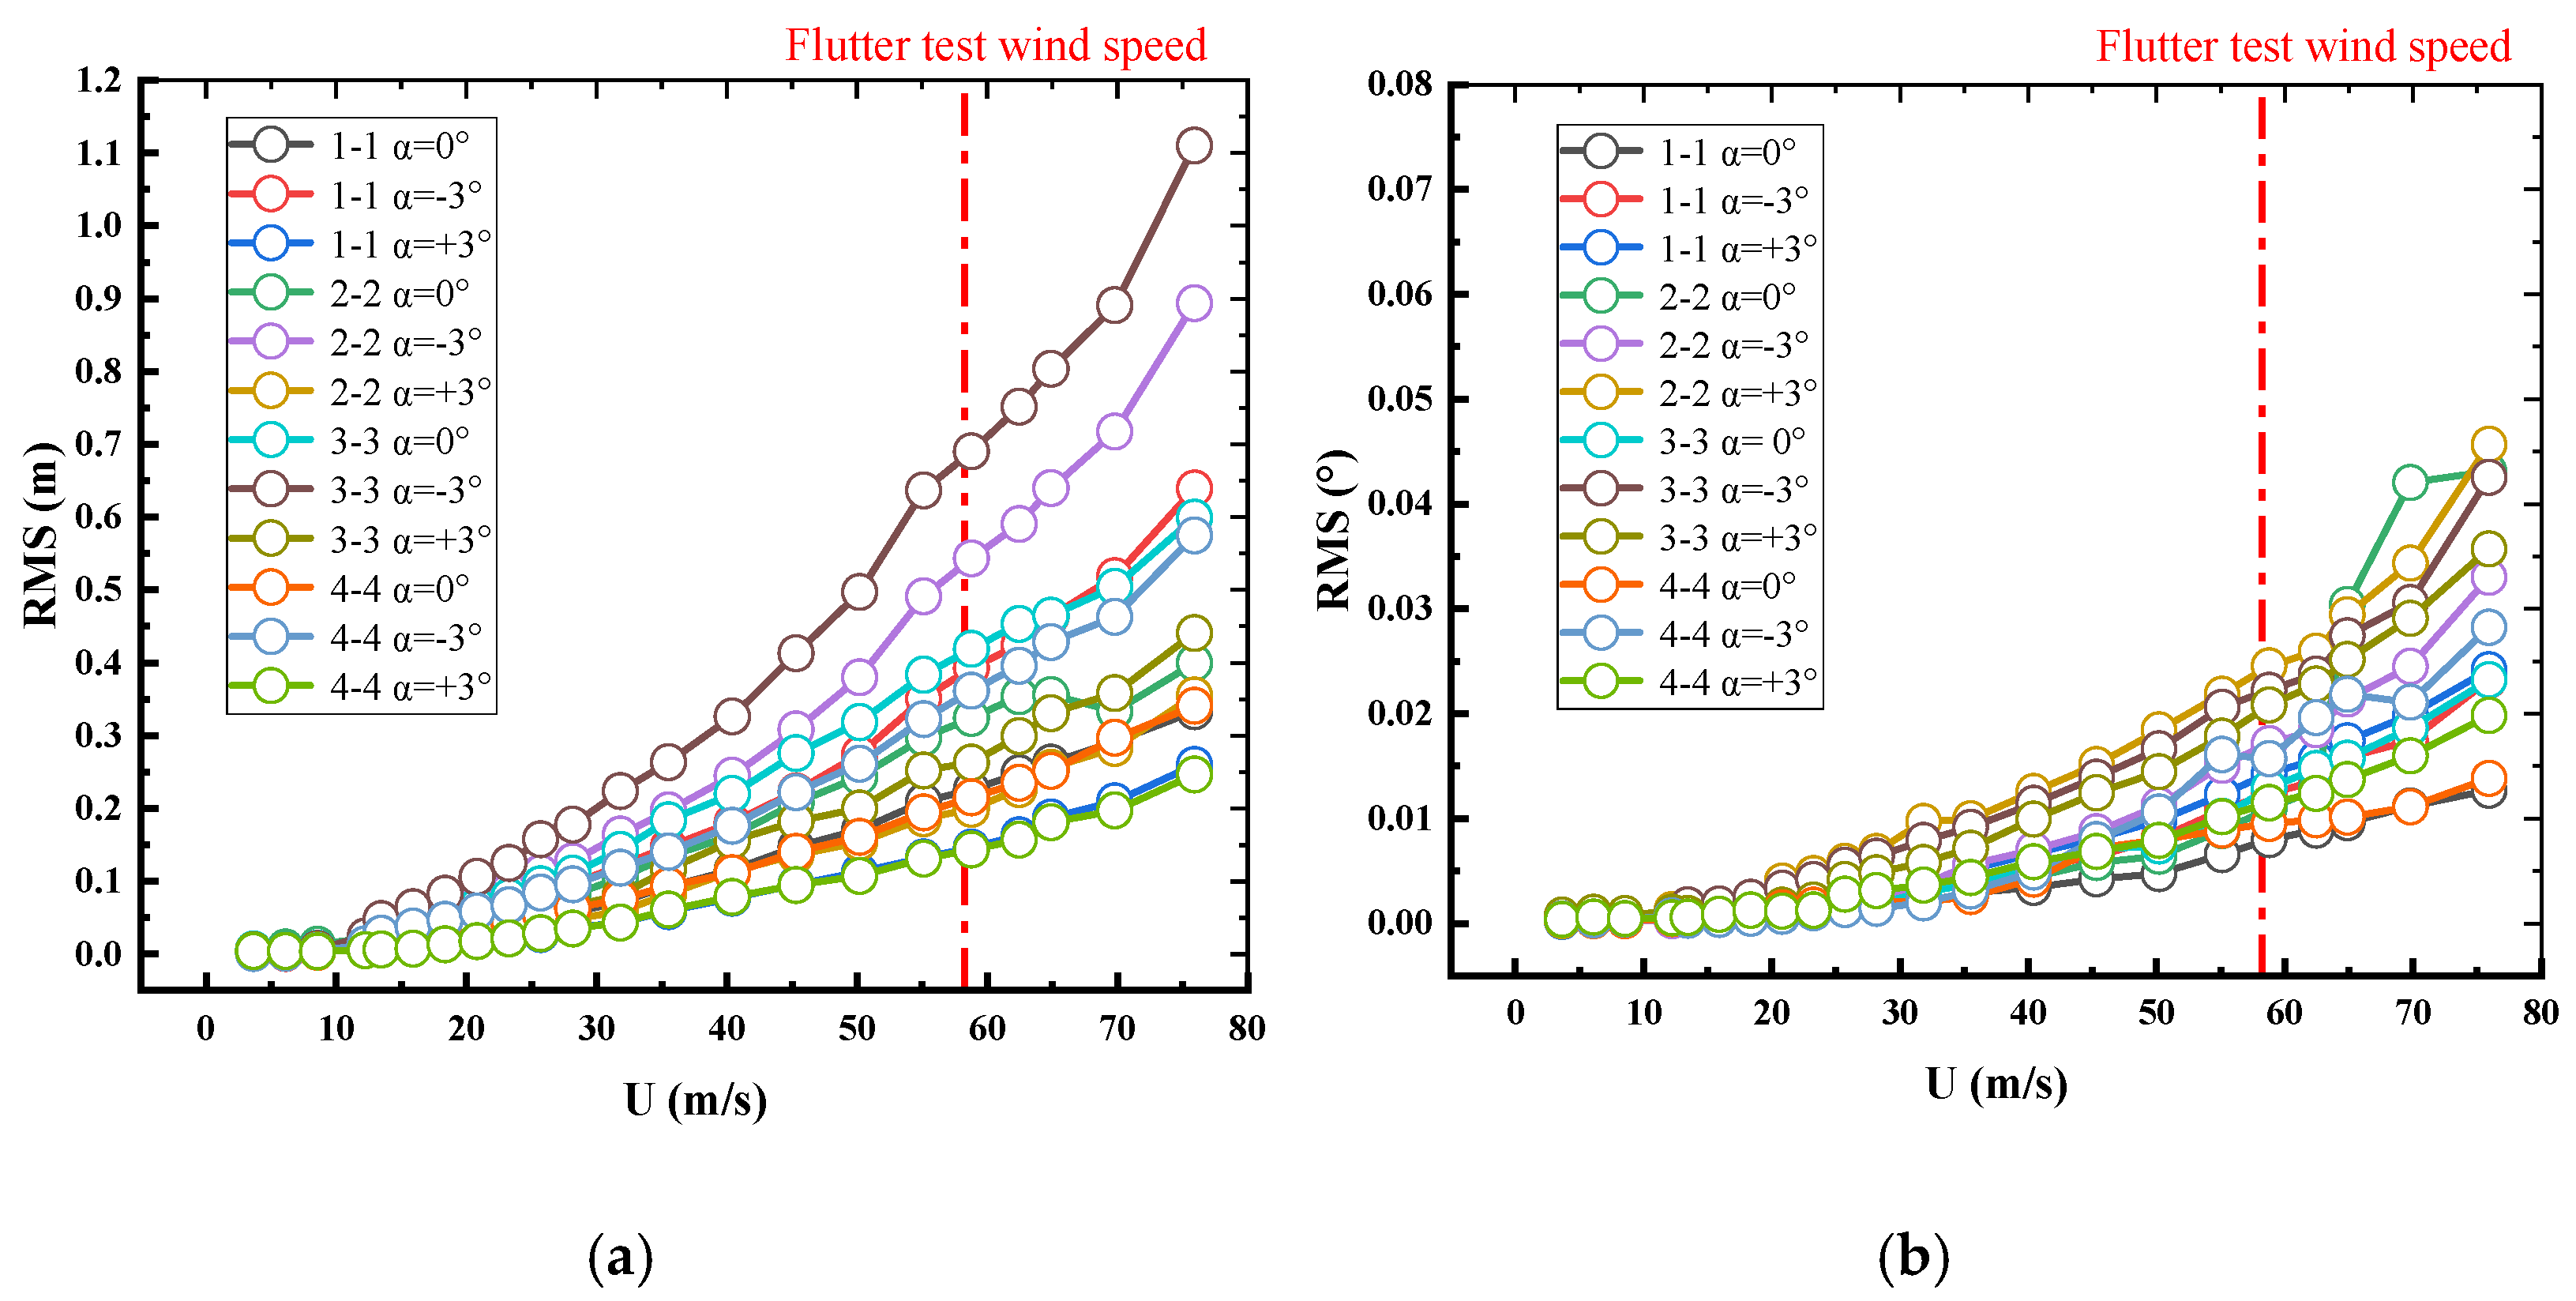
5.3. Flutter in Simulated Turbulent Wind Field of Boundary Layer

The test curves of the vertical and torsional root mean square (RMS) subject to mean wind speed (U) for the deck response at each measure point at the service state, to turbulent wind with various wind attack angles, where the responses and wind speed were transferred to the prototype values, are shown in Figure 20a,b, respectively. According to Figure 20, the vertical and torsional RMS responses of the service state were not more than 0.690 m and 0.024°, respectively, for all sections and wind directions, up to a wind speed of 58.24 m/s. As a result, the bridge is aerodynamically stable enough in turbulent wind field. The largest vertical response can still be found in the 3-3 cross-section with a −3° wind attack angle, while the maximum torsional response can still be found in the 2-2 cross-section with a +3° wind attack angle. We can conclude that the previous conclusions in Section 5.2 remain valid.

6. Conclusions

The vibration test of the sectional model at two wind fairing angles—sharp and blunt—was used to evaluate the VIV performance of the box girder section with different wind fairing angles. Meanwhile, the VIV, flutter, and buffeting of the bridge, which is a typical asymmetric flat steel box girder cable-stayed bridge, were investigated using a full bridge aeroelastic model test. According to the results of the dynamics analysis and wind tunnel test, the following key conclusions may be drawn:
  • The modification of wind fairing angles will affect the VIV performance of the flat steel box girder cable-stayed bridge, according to the sectional model wind tunnel test. The vortex energy created by the sharper wind fairing under the influence of the incoming flow is smaller and has a higher frequency. The VIV can be efficiently mitigated by using sharper wind fairing. In this paper, however, just two distinct wind fairing angles are used to demonstrate how they affect VIV. It is necessary to do a more in-depth quantitative investigation of the law of VIV as they change with wind fairing angles.
  • The bridge’s mode shapes are different from symmetrical structure, according to numerical calculations and mode tests. The maximum displacement of the of first torsion mode shape is at the closure rather than the mid-span due to the asymmetric structure. This conclusion was also supported by the results of the full bridge aeroelastic model testing.
  • The bridge sectional model has a positive slope lift coefficient and moment coefficient, and the ratio of torsional and vertical frequency in the service state is larger than 2, indicating that it has stronger wind resistance stability. Furthermore, the flutter critical wind speed is substantially greater than the flutter checking wind speed under uniform and turbulent wind, according to the full bridge aeroelastic model testing. As a result, the bridge has enough aerodynamic stability in the service state.
  • Uniform wind causes minimal amplitude vertical and torsional VIV that are substantially below the limits, while there is no VIV in the turbulent wind. Consequently, the odds of vertical or torsional VIV exceeding the permissible amplitude in the service state are exceedingly remote.

Author Contributions

Conceptualization, G.Z.; methodology, G.Z.; formal analysis, Z.W., J.H. and J.W.; writing—original draft preparation, Z.W. and S.Z.; writing—review and editing, Z.W. and J.H.; supervision, G.Z, and J.H. All authors have read and agreed to the published version of the manuscript.

Funding

This study is sponsored by the Fundamental Research Funds for the Central Universities, Chang’an University (No. 300102210108), which are greatly acknowledged. The Center for Computational Research at the University at Buffalo are greatly acknowledged.

Institutional Review Board Statement

Not applicable.

Informed Consent Statement

Not applicable.

Conflicts of Interest

The authors declare no conflict of interest.

Abbreviations

Simple symbols shall be used as far as possible in this paper, and the precise description of each symbol shall be based on the description of the chapter in which the symbol is located. Scalars in this paper are in fine italic letters, and vectors are in thick italic letters.
SymbolDescriptionSymbolDescription
Us10design basic wind speed of bridgekcconversion coefficient of basic wind speed surface category
U10basic wind speedUdthe design reference wind speed
kfwind resistance risk factorZbase height of component
α0exponent of mean wind profileUfflutter checking wind speed
γfpartial coefficient of flutter stabilityγtpartial coefficient of spatial influence of wind speed fluctuation
γαpartial coefficient of attack angle effectCHdrag coefficient(body axis)
CVlift coefficient(body axis)CMmoment coefficient
CDdrag coefficient(wind axis)CLlift coefficient(wind axis)
hvvertical VIV amplitudeγvthe VIV coefficient
fvfirst vertical mode frequencyθttorsional VIV amplitude
ftfirst torsional mode frequencyBsection width

References

  1. Larsen, A.; Esdahl, S.; Andersen, J.E.; Vejrum, T. Storeblt suspension bridge—Vortex shedding excitation and mitigation by guide vanes. J. Wind Eng. Ind. Aerodyn. 2000, 88, 283–296. [Google Scholar] [CrossRef]
  2. Larsen, A. Aerodynamic aspects of the final design of the 1624 m suspension bridge across the Great Belt. J. Wind Eng. Ind. Aerodyn. 1993, 48, 261–285. [Google Scholar] [CrossRef]
  3. Li, H.; Laima, S.; Ou, J.; Zhao, X.; Zhou, W.; Yu, Y.; Li, N.; Liu, Z. Investigation of vortex-induced vibration of a suspension bridge with two separated steel box girders based on field measurements. Eng. Struct. 2011, 33, 1894–1907. [Google Scholar] [CrossRef]
  4. Li, H.; Laima, S.; Zhang, Q.; Li, N.; Liu, Z. Field monitoring and validation of vortex-induced vibrations of a long-span suspension bridge. J. Wind Eng. Ind. Aerodyn. 2014, 124, 54–67. [Google Scholar] [CrossRef]
  5. Ge, Y.; Zhu, L.; Xu, K. Review and Reflection on Vortex-induced Vibration of Main Girders of Long-span Bridges. China J. Highw. Transp. 2019, 32, 1–18. [Google Scholar] [CrossRef]
  6. Zhu, L.; Wang, M.; Wang, D.; Guo, Z.; Cao, F. Flutter and buffeting performances of Third Nanjing Bridge over Yangtze River under yaw wind via aeroelastic model test. J. Wind Eng. Ind. Aerodyn. 2007, 95, 1579–1606. [Google Scholar] [CrossRef]
  7. Scanlan, R. FHWA-RD-80-50 Final Report; FHWA: Washington, DC, USA, 1981. [Google Scholar]
  8. Vickery, B.; Basu, R. Across-wind vibrations of structures of circular cross-section. Part I. Development of a mathematical model for two-dimensional conditions. J. Wind Eng. Ind. Aerodyn. 1983, 12, 49–73. [Google Scholar] [CrossRef]
  9. Diana, G.; Resta, F.; Belloli, M.; Rocchi, D. On the vortex shedding forcing on suspension bridge deck. J. Wind Eng. Ind. Aerodyn. 2006, 94, 341–363. [Google Scholar] [CrossRef]
  10. Meng, X. Nonliner Behavior and Mechanism of Vertical Vortex-Induced Vibration of Longspan Steel-Box-Deck Bridges; Tongji University: Shanghai, China, 2013. [Google Scholar]
  11. Liu, Y. Non-linear Aerodynamic Model and Non-stationary Whole-process Wind Response of Long-Span Bridges; Tongji University: Shanghai, China, 2014. [Google Scholar]
  12. Yan, L.; Zhu, L.; He, X.; Flay, R. Experimental determination of aerodynamic admittance functions of a bridge deck considering oscillation effect. J. Wind Eng. Ind. Aerodyn. 2019, 190, 83–97. [Google Scholar] [CrossRef]
  13. Kavrakov, I.; Argentini, T.; Omarini, S.; Rocchi, D.; Morgenthal, G. Determination of complex aerodynamic admittance of bridge decks under deterministic gusts using the Vortex Particle Method. J. Wind Eng. Ind. Aerodyn. 2019, 193, 103971. [Google Scholar] [CrossRef] [Green Version]
  14. Wang, Q. The Study on Nonlinear Motion-Induced Aerodynamic Force and Nonlinear Aerodynamic Stability of Long-Span Bridge Girder. Doctor Dissertation, Southwest Jiaotong University, Chengdu, China, 2011. [Google Scholar] [CrossRef]
  15. Zhu, L.; Gao, G. A nonlinear self-excited force model for soft flutter phenomenon of a twin-side-girder bridge section. J. Vib. Shock 2016, 35, 29–35. [Google Scholar] [CrossRef]
  16. Gao, G.; Zhu, L.; Han, W.; Li, J. Nonlinear post-flutter behavior and self-excited force model of a twin-side-girder bridge deck. J. Wind Eng. Ind. Aerodyn. 2018, 177, 227–241. [Google Scholar] [CrossRef]
  17. Diana, G.; Rocchi, D.; Argentini, T.; Muggiasca, S. Aerodynamic instability of a bridge deck section model: Linear and nonlinear approach to force modeling. J. Wind Eng. Ind. Aerodyn. 2010, 98, 363–374. [Google Scholar] [CrossRef]
  18. Laima, S.; Li, H.; Chen, W.; Ou, J. Effects of attachments on aerodynamic characteristics and vortex-induced vibration of twin-box girder. J. Fluids Struct. 2018, 77, 115–133. [Google Scholar] [CrossRef]
  19. Hu, C.; Zhao, L.; Ge, Y. Mechanism of suppression of vortex-induced vibrations of a streamlined closed-box girder using additional small-scale components. J. Wind Eng. Ind. Aerodyn. 2019, 189, 314–331. [Google Scholar] [CrossRef]
  20. He, X.; Zhang, B.; Zou, Y.; Yi, L.; Cai, C. Experimental Research on Wind-resistant Performance of mainBridge of Wuhu Changjiang River rail- Road bridge. Bridge Constr. 2019, 49, 6. [Google Scholar]
  21. Song, J.; Ding, W.; Ding, Q.; Zhou, Z.; Zhao, L.; Xu, J. Experimental study on wind resistance of Hubei Jingyue Yangtze River Highway Bridge. In Proceedings of the 15th National Conference on Structural Wind Engineering, Beijing, China, 1–6 September 2019. [Google Scholar]
  22. Wang, X.; Zeng, Y. Study on vortex induced vibration characteristics and vibration control measures of main girder of Luzhou Huangyi Changjiang River Bridge. HIGHWAY 2018, 63, 4. [Google Scholar]
  23. Larsen, A.; Larose, G. Dynamic wind effects on suspension and cable-stayed bridges. J. Sound Vib. 2015, 334, 2–28. [Google Scholar] [CrossRef]
  24. Wang, Q.; Liao, H.; Li, M.; Ma, C. Influence of Aerodynamic Shape of Streamline Box Girder on Bridge Flutter and Vortex-induced Vibration. J. Highw. Transp. Res. Dev. 2012, 29, 44–50. [Google Scholar] [CrossRef]
  25. Meng, X.L.; Guo, Z.S.; Ding, Q.S.; Zhu, L.D. Influence of windfairing angle on vortex-induced vibrations and flutter performances of closed and semi-closed box decks. Eng. Mech. 2011, 28, 184–188. [Google Scholar]
  26. Diana, G.; Yamasaki, Y.; Larsen, A.; Rocchi, D.; Giappino, S.; Argentini, T.; Pagani, A.; Villani, M.; Somaschini, C.; Portentoso, M. Construction stages of the long span suspension Izmit Bay Bridge: Wind tunnel test assessment. J. Wind Eng. Ind. Aerodyn. 2013, 123, 300–310. [Google Scholar] [CrossRef]
  27. Sham, S.; Wyatt, T.A. Construction aerodynamics of cable-stayed bridges for record spans: Stonecutters Bridge. Structures 2016, 8, 94–110. [Google Scholar] [CrossRef]
  28. Tang, H.; Zhang, H.; Mo, W.; Li, Y. Flutter performance of box girders with different wind fairings at large angles of attack. Wind Struct. 2021, 32, 509–520. [Google Scholar] [CrossRef]
  29. Li, Y.; Chen, K.; Wang, B. Optimal measures for vortex-induced vibration of a bluff girder with separated twin-box. J. Vib. Shock 2018, 37, 7. [Google Scholar]
  30. Sato, H. Wind-resistant design manual for highway bridges in Japan. J. Wind Eng. Ind. Aerodyn. 2003, 91, 1499–1509. [Google Scholar] [CrossRef]
  31. Chen, Z.; Huang, Z. Analysis of main Factors Influencing Allowable magnitude ofVertical Vortex- induced Vibration of long- span bridges. China J. Highw. Transp. 2015, 28, 8. [Google Scholar]
  32. Fujino, Y.; Siringoringo, D. Vibration Mechanisms and Controls of Long-Span Bridges: A Review. Struct. Eng. Int. J. Int. Assoc. Bridge Struct. Eng. 2013, 23, 248–268. [Google Scholar] [CrossRef]
  33. Simiu, E.; Scanlan, R.H. Wind Effects on Structures: Fundamentals and Applications to Design; Wiley: New York, NY, USA, 1996. [Google Scholar]
  34. Morfiadakis, E.E.; Glinou, G.L.; Koulouvari, M.J. The suitability of the von Karman spectrum for the structure of turbulence in a complex terrain wind farm. J. Wind Eng. Ind. Aerodyn. 1996, 62, 237–257. [Google Scholar] [CrossRef]
  35. Kaimal, J.C.; Wyngaard, J.C.; Izumi, Y.; Coté, O. Spectral characteristics of surface-layer turbulence. Q. J. R. Meteorol. Soc. 1972, 98, 563–589. [Google Scholar] [CrossRef]
Figure 1. Elevation of the bridge (unit, m).
Applsci 12 00242 g001
Figure 2. Typical cross section of the bridge (unit, m).
Applsci 12 00242 g002
Figure 3. Fundamental modes of construction state. (a) Lateral (0.1869 Hz); (b) vertical (0.2688 Hz). (c) torsional (0.6030 Hz).
Applsci 12 00242 g003
Figure 4. Fundamental modes of service state. (a) Lateral (0.3613 Hz); (b) vertical (0.2809 Hz). (c) torsional (0.6268 Hz).
Applsci 12 00242 g004aApplsci 12 00242 g004b
Figure 5. The lateral, vertical, and torsional modes. (a) Lateral; (b) vertical; (c) torsional.
Applsci 12 00242 g005
Figure 6. Sectional model in CA-1 wind tunnel. (a) Construction; (b) service.
Applsci 12 00242 g006
Figure 7. Aerodynamic forces acting on the deck.
Applsci 12 00242 g007
Figure 8. Aerodynamic coefficients as function of the wind attack angle α. (a) Construction; (b) service.
Applsci 12 00242 g008
Figure 9. Vertical and torsional response. (a) Vertical amplitude of construction; (b) torsional amplitude of construction; (c) vertical amplitude of service; (d) torsional amplitude of service.
Applsci 12 00242 g009
Figure 10. Aerodynamic measures.
Applsci 12 00242 g010
Figure 11. Winding flow pattern in the area near the deck with different wind fairing angles. (a) 62° wind fairing; (b) 40° wind fairing.
Applsci 12 00242 g011
Figure 12. The effect of wind fairing angle on VIV in the service stage. (a) Vertical; (b) torsional.
Applsci 12 00242 g012
Figure 13. Full bridge aeroelastic model in TJ-3 wind tunnel.
Applsci 12 00242 g013
Figure 14. Atmospheric boundary layer turbulent wind field simulator.
Applsci 12 00242 g014
Figure 15. Wind profiles measured in wind tunnel. (a) Mean wind speed profiles; (b) turbulence intensities profiles.
Applsci 12 00242 g015
Figure 16. Spectrum of vertical turbulence at deck lever. (a) Component u; (b) component w.
Applsci 12 00242 g016
Figure 17. Measurement point layout.
Applsci 12 00242 g017
Figure 18. The root mean square (RMS) value of the displacement of mid-span and closure of the service state in uniform wind. (a) Vertical; (b) torsional.
Applsci 12 00242 g018
Figure 19. The root mean square (RMS) value of the displacement of each measure point of the service state in uniform wind. (a) Vertical; (b) torsional.
Applsci 12 00242 g019
Figure 20. The root mean square (RMS) value of the displacement of each measure point of the service state in turbulent wind. (a) Vertical; (b) torsional.
Applsci 12 00242 g020
Table 1. Basic wind parameters.
StatesDesign Reference
Wind Speed (m/s)
flutter Checking Wind Speed (m/s)Static Wind Instability Test Wind Speed (m/s)
construction32.2141.3945.34
service39.8858.2463.81
Table 2. Basic frequencies of construction and service state.
ConstructionService
Mode ShapeFrequency (Hz)Mode ShapeFrequency (Hz)
L10.1869V2-S0.2809
V20.2688L3-S0.3613
V40.4303V5-A0.4008
T50.6030T8-S0.6268
T141.4145T11-A0.9377
Note: V—vertical bending of deck; L—lateral bending of deck; T—torsional bending of deck; S—symmetric mode shape; A—asymmetric mode shape; number—mode order.
Table 3. Test conditions and limit values.
StatesWind Attack AngleFlow FieldWind Speed RatioVortex Vibration Limit
Vertical (m)Torsional (Deg)
construction−5°, −3°, 0°,+3°, +5°41.391:2.20.14880.1684
service−5°, −3°, 0°,+3°, +5°58.241:2.50.14240.1620
Table 4. Flutter critical wind speed test results.
Attack AngleConstructionService
Test Critical Wind Speed (m/s)Real Bridge Critical Wind Speed (m/s)Flutter Checking Wind Speed (m/s)Test Critical Wind Speed (m/s)Real Bridge Critical Wind Speed (m/s)Flutter Checking Wind Speed (m/s)
>12>55.2041.39>14>74.2058.24
>12>55.20>14>74.20
>12>55.20>14>74.20
Table 5. Scaling parameters for Froude number similitude.
PropertyNameScaling FactorValuePropertyNameScaling FactorValue
LengthλL1/150Frequencyλf1/(λL/λV)1501/2/1
Wind speedλVλL1/21/1501/2Damping ratioλξ1/1
Densityλρ1/1Timeλt1/1501/2
Mass per unit lengthλmλρ × λL21/1502Mass moment of inertia per unit lengthλJλρ × λL41/1504
Axial stiffnessλEAλρ × λV2 × λL21/1503Torsional stiffnessλGJλρ × λV2 × λL41/1505
Accelerationλa1/1Bending stiffnessλEIλρ × λV2 × λL41/1505
LengthλL1/150Frequencyλf1/(λL/λV)1501/2/1
Table 6. Scaling parameters for Froude number similitude.
ModesComputed Frequency of PrototypeDesign ValuesMeasured ValuesDiscrepancy (%)Limit (%)Damping Ratio (%)
1V-S0.28093.4403.3123.735.000.75
2L-S0.36134.4254.3960.665.00
3V-A0.40084.9094.940−0.645.000.90
4T-S0.62687.6778.063−5.025.000.83
5T-A0.937811.4865.00
Publisher’s Note: MDPI stays neutral with regard to jurisdictional claims in published maps and institutional affiliations.

