
Assessing the Electrochemical Performance of Different Nanostructured CeO2 Samples as Anodes for Lithium-Ion Batteries

 ,
,
Abstract
:
1. Introduction
2. Materials and Methods
2.1. Synthesis Procedures of the Ceria Samples
2.2. Characterization Techniques
3. Results and Discussion
3.1. Structural and Microstructural Characterization
3.2. Electrochemical Characterization
Supplementary Materials
Author Contributions
Funding
Institutional Review Board Statement
Informed Consent Statement
Acknowledgments
Conflicts of Interest
References
- Weiss, M.; Ruess, R.; Kasnatscheew, J.; Levartovsky, Y.; Levy, N.R.; Minnmann, P.; Stolz, L.; Waldmann, T.; Wohlfahrt-Mehrens, M.; Aurbach, D.; et al. Fast Charging of Lithium-Ion Batteries: A Review of Materials Aspects. Adv. Energy Mater. 2021, 11, 2101126. [Google Scholar] [CrossRef]
- Poizot, P.; Laruelle, S.; Grugeon, S.; Dupont, L.; Tarascon, J.-M. Nano-sized transition-metal oxides as negative-electrode materials for lithium-ion batteries. Nature 2000, 407, 496–499. [Google Scholar] [CrossRef] [PubMed]
- Vetter, J.; Novák, P.; Wagner, M.R.; Veit, C.; Möller, K.-C.; Besenhard, J.O.; Winter, M.; Wohlfahrt-Mehrens, M.; Vogler, C.; Hammouche, A. Ageing mechanisms in lithium-ion batteries. J. Power Sources 2005, 147, 269–281. [Google Scholar] [CrossRef]
- Huang, Y.-H.; Park, K.-S.; Goodenough, J.B. Improving Lithium Batteries by Tethering Carbon-Coated LiFePO4 to Polypyrrole. J. Electrochem. Soc. 2006, 153, A2282. [Google Scholar] [CrossRef]
- Chen, Y.; Kang, Y.; Zhao, Y.; Wang, L.; Liu, J.; Li, Y.; Liang, Z.; He, X.; Li, X.; Tavajohi, N.; et al. A review of lithium-ion battery safety concerns: The issues, strategies, and testing standards. J. Energy Chem. 2021, 59, 83–99. [Google Scholar] [CrossRef]
- Gong, Q.; Gao, T.; Huang, H.; Wang, R.; Cao, P.; Zhou, G. Double-shelled CeO2@C hollow nanospheres as enhanced anode materials for lithium-ion batteries. Inorg. Chem. Front. 2018, 5, 3197–3204. [Google Scholar] [CrossRef]
- Aziam, H.; Tamraoui, Y.; Ma, L.; Amine, R.; Wu, T.; Manoun, B.; Xu, G.L.; Amine, K.; Alami, J.; Saadoune, I. Mechanism of the First Lithiation/Delithiation Process in the Anode Material CoFeOPO4@C for Li-Ion Batteries. J. Phys. Chem. C 2018, 122, 7139–7148. [Google Scholar] [CrossRef]
- Chavali, M.S.; Nikolova, M.P. Metal oxide nanoparticles and their applications in nanotechnology. SN Appl. Sci. 2019, 1, 607. [Google Scholar] [CrossRef] [Green Version]
- Lykaki, M.; Pachatouridou, E.; Iliopoulou, E.; Carabineiro, S.A.C.; Konsolakis, M. Impact of the synthesis parameters on the solid state properties and the CO oxidation performance of ceria nanoparticles. RSC Adv. 2017, 7, 6160–6169. [Google Scholar] [CrossRef] [Green Version]
- Solsona, B.; Sanchis, R.; Dejoz, A.; Garcia, T.; Rodríguez, L.; Nieto, J.M.; Cecilia, J.A.; Rodriguez-Castellon, E. Total Oxidation of Propane Using CeO2 and CuO-CeO2 Catalysts Prepared Using Templates of Different Nature. Catalysts 2017, 7, 96. [Google Scholar] [CrossRef] [Green Version]
- Solsona, B.; Concepción, P.; Hernández, S.; Demicol, B.; Nieto, J.M.L. Oxidative dehydrogenation of ethane over NiO-CeO2 mixed oxides catalysts. Catal. Today 2012, 180, 51–58. [Google Scholar] [CrossRef]
- Jasinski, P.; Suzuki, T.; Anderson, H.U. Nanocrystalline undoped ceria oxygen sensor. Sens. Actuators B Chem. 2003, 95, 73–77. [Google Scholar] [CrossRef]
- Primo, A.; Marino, T.; Corma, A.; Molinari, R.; García, H. Efficient Visible-Light Photocatalytic Water Splitting by Minute Amounts of Gold Supported on Nanoparticulate CeO2 Obtained by a Biopolymer Templating Method. J. Am. Chem. Soc. 2011, 133, 6930–6933. [Google Scholar] [CrossRef]
- Wang, B.; Zhu, B.; Yun, S.; Zhang, W.; Xia, C.; Afzal, M.; Cai, Y.; Liu, Y.; Wang, Y.; Wang, H. Fast Ionic Conduction in Semi-conductor CeO2−δ Electrolyte Fuel Cells. NPG Asia Mater. 2019, 11, 1–12. [Google Scholar] [CrossRef] [Green Version]
- Tarnuzzer, R.W.; Colon, J.; Patil, S.; Seal, S. Vacancy Engineered Ceria Nanostructures for Protection from Radiation-Induced Cellular Damage. Nano Lett. 2005, 5, 2573–2577. [Google Scholar] [CrossRef] [PubMed]
- Salaev, M.; Salaeva, A.; Kharlamova, T.; Mamontov, G. Pt-CeO2-based composites in environmental catalysis: A review. Appl. Catal. B Environ. 2021, 295, 120286. [Google Scholar] [CrossRef]
- Yang, S.; Gao, L. Controlled Synthesis and Self-Assembly of CeO2 Nanocubes. J. Am. Chem. Soc. 2006, 128, 9330–9331. [Google Scholar] [CrossRef]
- Minakshi, M.; Nallathamby, K.; Mitchell, D.R. Electrochemical characterization of an aqueous lithium rechargeable battery: The effect of CeO2 additions to the MnO2 cathode. J. Alloys Compd. 2009, 479, 87–90. [Google Scholar] [CrossRef] [Green Version]
- Minakshi, M.; Mitchell, D.R.G.; Carter, M.L.; Appadoo, D.; Nallathamby, K. Microstructural and Spectroscopic Investigations into the Effect of CeO2 Additions on the Performance of a MnO2 Aqueous Rechargeable Battery. Electrochim. Acta 2009, 54, 3244–3249. [Google Scholar] [CrossRef] [Green Version]
- Sasidharan, M.; Gunawardhana, N.; Yoshio, M.; Nakashima, K. CeO2 Hollow Nanospheres as Anode Material for Lithium Ion Batteries. Chem. Lett. 2012, 41, 386–388. [Google Scholar] [CrossRef]
- Liu, H.; Le, Q. Synthesis and performance of cerium oxide as anode materials for lithium ion batteries by a chemical precipitation method. J. Alloys Compd. 2016, 669, 1–7. [Google Scholar] [CrossRef]
- Ogunniran, K.O.; Murugadoss, G.; Thangamuthu, R.; Nishanthi, S.T. Nanostructured CeO2/FeO3/Mn-RGO Composite as Anode Material in Li-Ion Battery. J. Alloys Compd. 2019, 786, 873–883. [Google Scholar] [CrossRef]
- Kim, H.; Shuvo, M.A.I.; Karim, H.; Noveron, J.C.; Tseng, T.-L.; Lin, Y. Synthesis and characterization of CeO2 nanoparticles on porous carbon for Li-ion battery. MRS Adv. 2017, 2, 3299–3307. [Google Scholar] [CrossRef] [Green Version]
- Lee, J.; Moon, J.; Han, S.A.; Kim, J.; Malgras, V.; Heo, Y.-U.; Kim, H.; Lee, S.-M.; Liu, H.K.; Dou, S.X.; et al. Everlasting Living and Breathing Gyroid 3D Network in Si@SiOx/C Nanoarchitecture for Lithium Ion Battery. ACS Nano 2019, 13, 9607–9619. [Google Scholar] [CrossRef] [PubMed]
- Kim, J.; Kim, J.H.; Ariga, K. Redox-Active Polymers for Energy Storage Nanoarchitectonics. Joule 2017, 1, 739–768. [Google Scholar] [CrossRef] [Green Version]
- Cheng, C.; Chen, F.; Yi, H.; Lai, G. CeO2 mesoporous microspheres for high performance supercapacitors and lithium-ion batteries. J. Energy Storage 2021, 35, 102305. [Google Scholar] [CrossRef]
- Jayakumar, G.; Irudayaraj, A.A.; Raj, A.D. Investigation on the synthesis and photocatalytic activity of activated carbon-cerium oxide (AC-CeO2) nanocomposite. Appl. Phys. A 2019, 125, 742. [Google Scholar] [CrossRef]
- Sun, J.; Li, B.; Jin, C.; Peng, L.; Dai, D.; Hu, J.; Yang, C.; Lu, C.; Yang, R. Construction of 3D porous CeO2 ceramic hosts with enhanced lithiophilicity for dendrite-free lithium metal anode. J. Power Sources 2021, 484, 229253. [Google Scholar] [CrossRef]
- Minakshi, M.; Mitchell, D.R.G.; Munnangi, A.R.; Barlow, A.J.; Fichtner, M. New insights into the electrochemistry of magnesium molybdate hierarchical architectures for high performance sodium devices. Nanoscale 2018, 10, 13277–13288. [Google Scholar] [CrossRef] [Green Version]
- Ma, Y.; Ma, Y.; Giuli, G.; Euchner, H.; Groß, A.; Lepore, G.O.; d’Acapito, F.; Geiger, D.; Biskupek, J.; Kaiser, U.; et al. Introducing Highly Redox-Active Atomic Centers into Insertion-Type Electrodes for Lithium-Ion Batteries. Adv. Energy Mater. 2020, 10, 2000783. [Google Scholar] [CrossRef]
- Shi, Y.; Fu, J.; Hui, K.; Liu, J.; Gao, C.; Chang, S.; Chen, Y.; Gao, X.; Gao, T.; Xu, L.; et al. Promoting the Electro-chemical Properties of Yolk-Shell-Structured CeO2 Composites for Lithium-Ion Batteries. Microstructures 2021, 1, 2021005. [Google Scholar]
- Su, Q.; Chang, L.; Zhang, J.; Du, G.; Xu, B. In Situ TEM Observation of the Electrochemical Process of Individual CeO2/Graphene Anode for Lithium Ion Battery. J. Phys. Chem. C 2013, 117, 4292–4298. [Google Scholar] [CrossRef]
- Li, K.; Zhou, X.; Nie, A.; Sun, S.; He, Y.-B.; Ren, W.; Li, B.; Kang, F.; Kim, J.-K.; Zhang, T.-Y. Discovering a First-Order Phase Transition in the Li-CeO2 System. Nano Lett. 2017, 17, 1282–1288. [Google Scholar] [CrossRef] [PubMed]


| Notation | Synthesis Method | Crystallite Size (nm) b | a (Å) | SBET (m2 g−1) c | Particle Size Range (nm) d |
|---|---|---|---|---|---|
| Ce-pH13 | Hyd a, pH = 13 | 34.3 | 5.4244 (2) | 9 | 10–100 |
| Ce-pH7 | Hyd a, pH = 7 | 15.0 | 5.4186 (2) | 42 | 3–18 |
| Ce-ox | Oxalate precursor | 9.5 | 5.4144 (7) | 14.1 | 2–15 |
| Ce-PMMA | PMMA template | 8.2 | 5.4159 (9) | 120 | 2–20 |
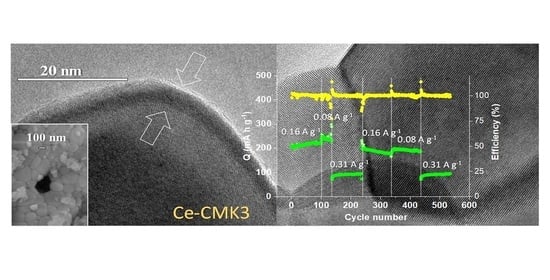
| Ce-CMK3 | CMK3 template | 42.8 | 5.4123 (1) | 7 | 15–130 |
| Ce-Ref | Calcination | 9.4 | 5.4175 (7) | 24.1 | 3–15 |
| Sample | Qd 1st Cycle (mA h g−1) | Qd at 0.155 A g−1 (mA h g−1) * |
|---|---|---|
| Ce-pH13 | 184 | 91 (15)–103 (2) |
| Ce-pH7 | 193 | 24 (50)–67 (2) |
| Ce-ox | 227 | 85 (30)–102 (2) |
| Ce-PMMA | 108 | 43 (25)–56 (2) |
| Ce-CMK3 | 401 | 212 (45)–226 (2) |
| Ce-ref | 179 | 58 (50)–85 (2) |
Publisher’s Note: MDPI stays neutral with regard to jurisdictional claims in published maps and institutional affiliations. |
© 2021 by the authors. Licensee MDPI, Basel, Switzerland. This article is an open access article distributed under the terms and conditions of the Creative Commons Attribution (CC BY) license (https://creativecommons.org/licenses/by/4.0/).
Share and Cite
Lamara, F.; Bounar, N.; Solsona, B.; Llopis, F.J.; Pico, M.P.; Alonso-Domínguez, D.; López, M.L.; Álvarez-Serrano, I. Assessing the Electrochemical Performance of Different Nanostructured CeO2 Samples as Anodes for Lithium-Ion Batteries. Appl. Sci. 2022, 12, 22. https://doi.org/10.3390/app12010022
Lamara F, Bounar N, Solsona B, Llopis FJ, Pico MP, Alonso-Domínguez D, López ML, Álvarez-Serrano I. Assessing the Electrochemical Performance of Different Nanostructured CeO2 Samples as Anodes for Lithium-Ion Batteries. Applied Sciences. 2022; 12(1):22. https://doi.org/10.3390/app12010022
Chicago/Turabian StyleLamara, Farah, Nedjemeddine Bounar, Benjamín Solsona, Francisco J. Llopis, María Pilar Pico, Daniel Alonso-Domínguez, María Luisa López, and Inmaculada Álvarez-Serrano. 2022. "Assessing the Electrochemical Performance of Different Nanostructured CeO2 Samples as Anodes for Lithium-Ion Batteries" Applied Sciences 12, no. 1: 22. https://doi.org/10.3390/app12010022