Article

Autonomous Multiple Tramp Materials Detection in Raw Coal Using Single-Shot Feature Fusion Detector

1
School of Mechanical Electronic & Information Engineering, China University of Mining & Technology, Beijing 100083, China
2
College of Applied Science & Technology, Beijing Union University, Beijing 100012, China
3
Community Service & Management, University of Science & Technology Beijing, Beijing 100083, China
*
Author to whom correspondence should be addressed.
Appl. Sci. 2022, 12(1), 107; https://doi.org/10.3390/app12010107
Submission received: 26 November 2021 / Revised: 19 December 2021 / Accepted: 21 December 2021 / Published: 23 December 2021

Abstract

:
In the coal mining process, various types of tramp materials will be mixed into the raw coal, which will affect the quality of the coal and endanger the normal operation of the equipment. Automatic detection of tramp materials objects is an important process and basis for efficient coal sorting. However, previous research has focused on the detection of gangue, ignoring the detection of other types of tramp materials, especially small targets. Because the initial Single Shot MultiBox Detector (SSD) lacks the efficient use of feature maps, it is difficult to obtain stable results when detecting tramp materials objects. In this article, an object detection algorithm based on feature fusion and dense convolutional network is proposed, which is called tramp materials in raw coal single-shot detector (TMRC-SSD), to detect five types of tramp materials such as gangue, bolt, stick, iron sheet, and iron chain. In this algorithm, a modified DenseNet is first designed and a four-stage feature extractor is used to down-sample the feature map stably. After that, we use the dilation convolution and multi-branch structure to enrich the receptive field. Finally, in the feature fusion module, we designed cross-layer feature fusion and attention fusion modules to realize the semantic interaction of feature maps. The experiments show that the module we designed is effective. This method is better than the existing model. When the input image is 300 × 300 pixels, it can reach 96.12% MAP and 24FPS. Especially in the detection of small objects, the detection accuracy has increased by 4.1 to 95.57%. The experimental results show that this method can be applied to the actual detection of tramp materials objects in raw coal.

1. Introduction

Due to the limitations of equipment and technology, tramp materials such as gangue, bolt, stick, iron sheet, and iron chain will be mixed into the raw coal in the mining process [1,2]. These tramp materials mixed in the raw coal can easily cause blockage and scratches of the transfer equipment, and can even cause the failure of the equipment, and in particular, can cause accidents [3]. As the most important solid waste generated during coal mining, gangue will affect the calorific value of coal during the combustion process and cause environmental pollution [4]. Therefore, the automatic and efficient separation of coal and tramp materials is of great significance for ensuring safe production and for improving coal mining efficiency [5]. At present, most coal mines use manual separation to remove tramp materials in raw coal, as shown in Figure 1. This method mainly relies on the manual identification of objects, resulting in a poor working environment, high physical labor intensity, and low productivity, all of which endangers the health of miners, and is not in line with the intelligent development of mines. Other sorting methods, such as wet sorting, will use a lot of water and cause water pollution, while dry sorting has become a potential direction of sorting technology due to non-contact and economic efficiency. Among them, computer vision-based mineral separation technology has become a hot research topic in recent years [6]. Therefore, detecting tramp materials mixed in raw coal from optical images is an economical and effective method of beneficiation [7,8,9].
A tramp material image of raw coal has a rich color, grayscale, texture, shape and contains other characteristic information. However, due to surface pollution, light changes, size differences, and the variety of tramp material shapes, how to extract robust tramp material image features is a challenging task. The detection method based on traditional image processing constructs are featured manually and use support vector machines for classification [10]. This method has high requirements for the detection environment and highly depends on the manual parameter setting, so there is still much room for improvement in the generalization effect and stability of the detection [11,12,13]. On the other hand, the object detection technology based on deep learning improves the performance of the detector by learning from training data and by adaptively extracting stable image resources [14].
Previous research has focused on the detection of gangue, ignoring the detection of other types of tramp materials, especially small targets. In this research, we designed a object detection algorithm for multiple tramp materials in raw coal. To ensure real-time target detection performance, we used a structure similar to SSD [15]. SSD uses a multi-scale feature map strategy to detect objects of different sizes in real time. However, because there is no semantic interaction between shallow and deep feature maps, small targets cannot be detected effectively. For this reason, SSD is not suitable for detecting multi-scale tramp material targets. To improve the performance of the detector, we first used a densely connected network containing a four-stage feature extractor to stably down-sample the feature map. The feature extraction module adopts a multi-branch dilation convolution structure to realize the efficient use of feature images by fusing feature images of different receptive fields. The cross-layer feature fusion and the attention fusion module are used in the feature fusion module to fuse the position information of the shallow feature map and the semantic information of the deep feature map to improve the detection ability of small objects. We refer to the proposed detector as the tramp materials in raw coal single-shot detector (TMRC-SSD). The main contributions of this research can be summarized as follows:
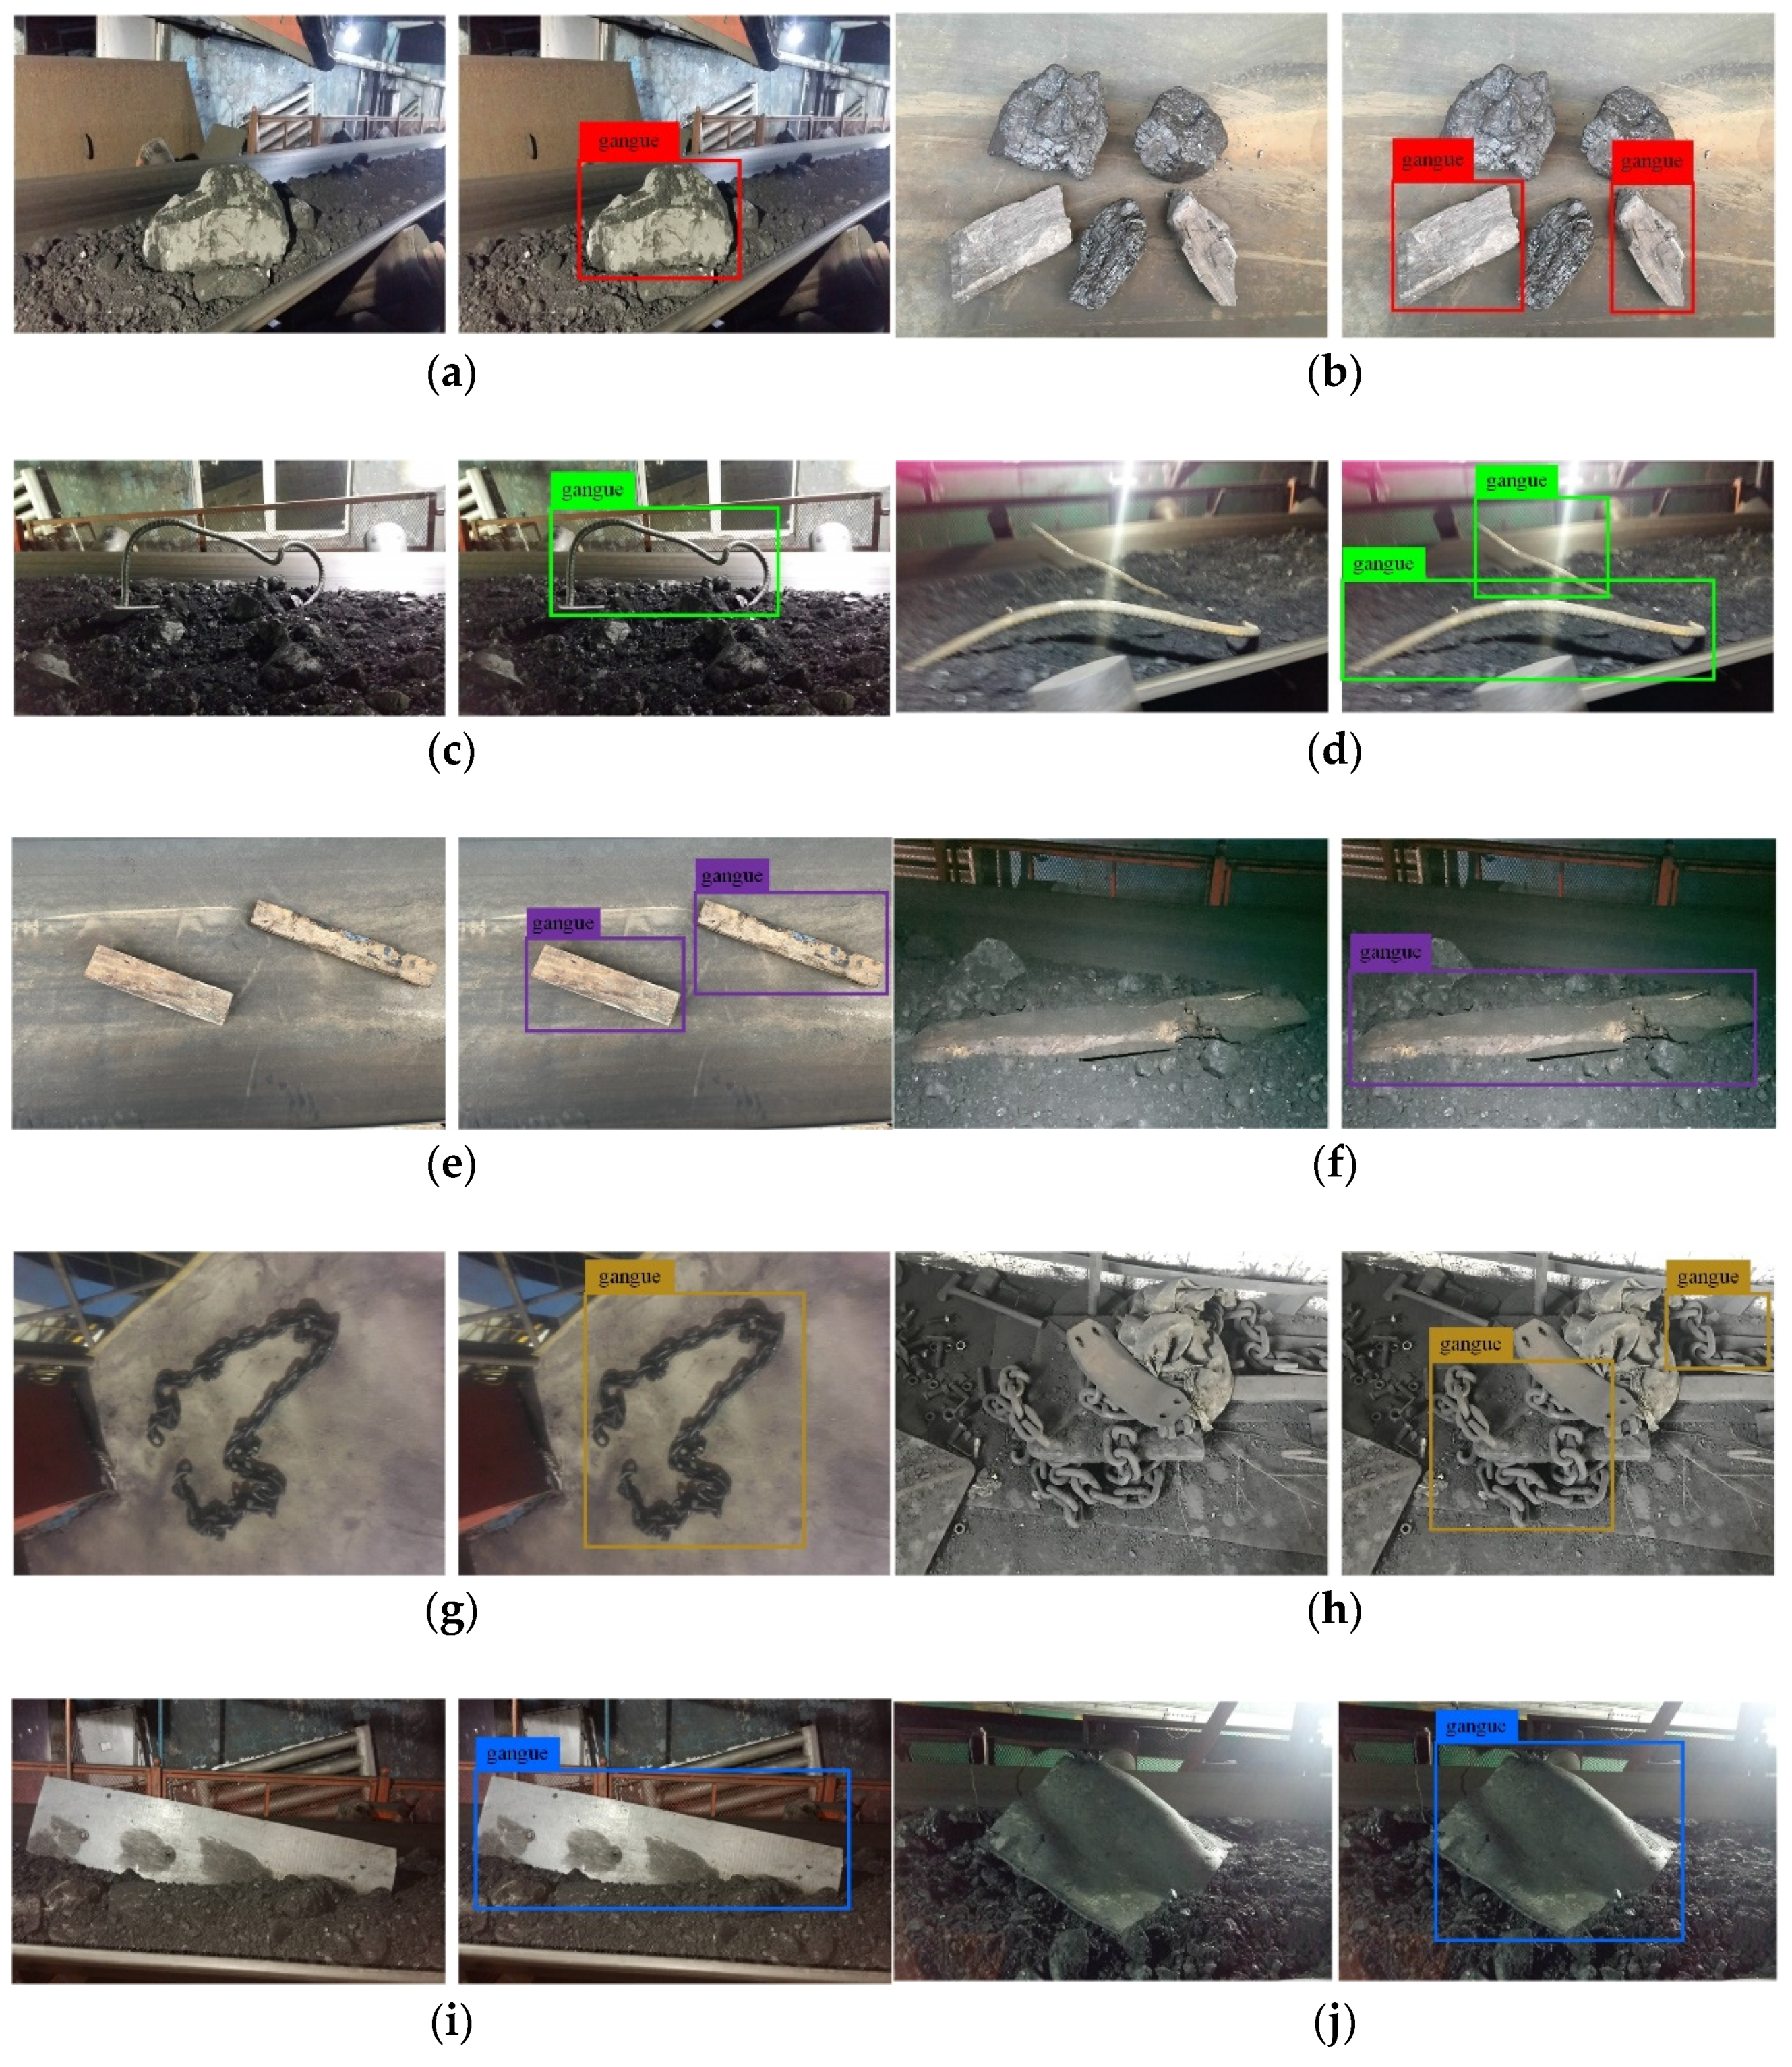
1. A CNN model-based detection algorithm for multiple tramp material objects in raw coal is proposed, namely TMRC-SSD. It can extract multi-scale image features, and can effectively detect five types of tramp materials, including gangue, bolt, stick, iron sheet, and iron chain by training deep learning models. Experimental results show that our proposed network achieves 96.12% MAP at 24FPS.
2. Construction of an image dataset of tramp materials in raw coal; we verified the effectiveness of our proposed MDCS, CLFF and AFM modules in improving detection accuracy through experiments. The experimental results showed that the TMRC-SSD network increases the AP of small object detection by 4.1 to 95.57%.
The organizational structure of this article is as follows. In Section 2, we discuss the previous research on the detection of tramp materials in raw coal. In Section 3, we introduced the detail of TMRC-SSD. In Section 4, we introduced the dataset and evaluation index. In Section 5, we obtained the experimental and visualization results. Finally, Section 6 summarizes the research results.

2. Related Works

2.1. Image-Based Detection for Extraction of Tramp Materials in Raw Coal

Because it does not need to use water, dry coal preparation technology has advantages in environmental protection and economy, and has become a hot research field. The method based on radiation [16] requires the careful management of radiation sources to avoid harm to the human body. The method based on density [9] measurement is complicated and requires materials to be arranged neatly. The image-based detection method is safer and more convenient than the above-mentioned methods. Traditional image processing and classic machine learning algorithms can use the image’s grayscale [17], texture [18], fractal dimension [19,20], morphology [8] and spectral feature [21], by constructing a feature vector to identify tramp material objects represented by gangue. However, this approach relies too much on human experience judgment and prior knowledge, which has certain limitations. With the rise of deep learning technology represented by Convolutional Neural Networks (CNN), a new technical approach is provided for image recognition of tramp material objects. CNN adopts an end-to-end training method, which can adaptively extract robust image features, thereby avoiding the subjectivity of manually extracting features. Su [22] proposed a simple LeNet-5 model, which realizes the automatic classification of coal and gangue images. Pu [23] uses transfer learning strategies to train small sample datasets to improve recognition accuracy. According to the difference between thermal images of coal and gangue, Alfarzaeai [24] proposed a recognition model based on CNN. Xing [25] proposed a method to identify coal gangue using the intensity image of lidar echo and DenseNet, the recognition rate reached being 93%. However, the above four studies only explore the recognition of coal and gangue images, and could not achieve the detection tasks of target positioning and other various types of tramp materials. Gao [26] proposed a full convolutional network based on U-Net to achieve pixel-level segmentation of coal and gangue in images. Nonetheless, due to the limitations of the dataset size and type, detection of other types of tramp materials such as bolt cannot be achieved. Sun [27] proposed a CG-YOLO dynamic target detection method and tested the sorting effect of supporting robots at different speeds, which can provide a solution for the realization of mechanical sorting execution unit after the completion of tramp material object detection. Lv [28] integrates the method of a multi-channel feature fusion layer and optimization loss function into the cascade network to improve the identification accuracy. Although experiments and visualizations show that this method is effective for the detection of coal and gangue, other types of tramp materials on the conveyor belt are not fully considered. Through the continuous in-depth research of many scholars, the image-based detection of tramp materials in raw coal is a feasible technical approach and has potential.

2.2. Object Detection with CNN

In order to solve the problem of gradient elimination in network training, Hinton proposed the theory of deep learning [29]. Since AlexNet [30] was proposed in 2012, the use of CNN for target detection has achieved exciting results in the field of computer vision. According to the difference of algorithm framework, CNN detector can be classified into two main types: region-based proposal and regression-based algorithm, called two-stage algorithm and a one-stage algorithm, respectively. In the two-stage method, the sliding windows is set in the input image to extract the regional suggestion network, and then the convolution operation is performed on each region to achieve the target classification and positioning task in the candidate region, such as RCNN [31], Fast R-CNN [32] and Faster R-CNN [33]. This detection method has advantages in detection accuracy by extracting the image information in the candidate box, but the selection of the region of interest will use a lot of computing costs, so it is difficult to meet the requirements of real-time detection speed. As a classical framework of single-stage methods, YOLO [34] extracts image features of input images through convolutional networks. For multi-scale target detection tasks, only a single feature layer is used to achieve classification and regression tasks, which cannot meet the requirements of fine detection. SSD can extract feature images of different levels through a backbone network, and use feature images of different scales to detect scale targets. Because SSD feature maps are extracted from bottom to top, there is no semantic interaction between feature maps, and shallow feature maps lack contents of high-level semantic features, so small target objects cannot be effectively detected. In order to solve the limitations of the above problems, researchers put forward many new means and methods to improve the performance of the detector. FPN [35] realizes the interaction between shallow feature maps and deep feature maps by constructing feature pyramids. DSSD [36] enriches the semantic information of a specific feature layer by combining feature graphs.

3. Proposed Method

3.1. Backbone Network

The shallow feature map retains more detailed information of the image. The traditional SSD network performs feature extraction by continuously reducing the feature map. This has the advantage of reducing the computational cost, but losing part of the image information. Inspired by the densely connected networks, we designed a modified DenseNet as the backbone network of TMRC-SSD, named M-Densenet, as shown in Table 1.
A 7 × 7 convolutional layer and a 3 × 3 maximum pool was inserted before the first dense block in the original DenseNet design (Figure 2). In M-DenseNet, we designed the steam block to replace the operation before stage (1). The input image in the steam block first passes through a 3 × 3 convolution with stride as 2, and then connect a central asymmetric convolution structure, and finally performs a filter concatenate and 1 × 1 convolution operation. Such an operation can effectively improve the expressive ability of features without increasing the computational cost.
All DenseNet structures contain a 4 dense block. The pooling operation is used in each transition layer to down-sample the feature map. As the backbone of TMRC-SSD, M-DenseNet is different from the base DenseNet, which increases the number of convolution operations in the dense block. In order to prevent the difficulty of feature mapping due to the deepening of the network, we use the strategy of a simple transition layer to improve the performance of the detector.
All layers of Dense Block output k feature maps after convolution indicate that the number of channels in the generated feature map is k. Because DenseNet uses a concatenation connection method, if each layer generates k feature maps, it will produce a large number of feature maps; in order to prevent the network from becoming very wide, k needs to be limited to a small range. In M-DenseNet, we set k = 32. Moreover, in order to reduce the width of the network, before each 3 × 3 convolution, 1 × 1 convolution is introduced as a narrow space level to check the calculation load. Compression can use convolution to compress the model dimensions between blocks. In M-DenseNet, we set the θ = 1 to enhance the expressive ability of features.

3.2. Extract Feature Module

Expanding the receptive field of the detector is an effective means to improve the performance of the detector. Previous researchers extracted multi-scale information by using multi-scale convolution kernels. With the continuous increase of the convolution kernels, the detection effect was improved while the computational cost increased rapidly.
Dilation convolution is a variant of traditional image convolution. By adding dilation to traditional image convolution, the receptive field expansion of traditional image convolution is completed. Dilation convolutions with different numbers of dilation are often used for the fusion of multi-scale feature map information and receptive fields. The calculation is as follows:
r f k = r f k 1 + ( ( n k 1 ) × i = 1 k 1 s i )
r f k   represents the size of the k layer receptive field; r f k 1 represents the size of the k − 1 layer receptive field; n k represents the size of the convolution kernel of the k layer; and s i is represents the size of the k layer before the step size of the i layer convolution.
The dilation convolution expands the receptive field without reducing the size of the feature map. The kernel size d l k of the k layer of dilation convolution is as follows:
d l k = l k + ( l k 1 ) × ( d 1 )
where l k represents the kernel size of the k layer of the original ordinary convolution, and d represents the number of spaces inserted. Combining the above two formulas, the receptive field of the k layer d l k size dilation convolution kernel for the l k size ordinary convolution kernel expansion is r f _ e x p e n d k as follows:
r f _ e x p e n d k = ( ( l k 1 ) × ( d 1 ) × i = 1 k 1 s i
The concrete description of the receptive field relationship is shown in Figure 3. Take a 5 × 5 ordinary convolution kernel to perform a convolution operation on a 5 × 5 image matrix as an example. After the original image is convolved, a 1 × 1 feature map is obtained, that is, the feature map only saves the receptive field of pixels as the entire original image. The dilation convolution kernel is 3 × 3 and d = 2, as shown in Figure 3b. Perform a convolution operation on a 5 × 5 image matrix with the dilation convolution to obtain a 1 × 1 feature map. It can be seen that the feature map obtained by this dilation convolution operation is consistent with the receptive field of a convolution operation using a 5 × 5 ordinary convolution. The dilation convolution uses a smaller parameter to achieve a larger receptive field.
Due to the preset fixed size of the convolution kernel, a standard convolution can only extract the information of some receptive fields in the image. In order to obtain richer image information, we designed a multi-branch dilation convolution structure (MDCS), as shown in Figure 4. First, use 1 × 1 convolution to achieve channel interaction, then reduce the number of channels in each branch to a quarter of the previous input level. In order to reduce the parameter size, we add a 3 × 3 convolution operation on the middle three branches respectively. Next, the dilation convolution of d = 1, 2, 3 and 5 was used on each branch to enrich the receptive field. A splice operation is then used to join the branches. To avoid the instability of gradient transfer the shortcut is integrated into the designed modules. MDCS introduces dilation convolution and adjusts the expansion rate to obtain feature maps of different receptive field without increasing the calculation parameters. By fusing the receptive fields of different scales and making full use of the context information of the feature map, the feature representation ability of the model is enhanced.

3.3. Feature Fusion Module (FFM)

3.3.1. Cross-Layer Feature Fusion (CLFF)

In the original SSD design, a convolution kernel of a selected size was used to obtain the local receptive field in the image, and a series of sampling operations were carried out to make the size of the feature graph shrink continuously, and the semantic information of small target objects decrease continuously in this process. SSD adopts the strategy of a shallow feature map detecting small targets and deep feature map detecting large targets to detect targets of different scales, but this method has been proved to be defective in the detection of small targets. Inspired by the idea of feature fusion, we designed a cross-layer feature fusion module (CLFF) to fuse the position information of the shallow feature map and the high-level semantic information of the deep feature map to improve the model’s ability to detect small targets. In CLFF-1, the feature layer of 38 × 38 × 512 size is formed by the fusion of the three-level feature graph (stage1, stage2, conv7) extracted from the network, as shown in Figure 5. The specific fusion operation is as follows: firstly, stage1 is down-sampled, and conv7 is up-sampled. After the size is the same, stage1, stage2 and conv7 all go through a 3 × 3 con-volution layer. In order to avoid the influence of gradient fluctuation, we use batch normalization operation for the fused feature images. We abbreviate batchnorm, scale, and ReLU as B-S-R. Other CLFF modules have a similar fusion process.

3.3.2. Attention Fusion Module (AFM)

Continuous down-sampling and convolution of the original image can obtain feature layers with different semantic features and resolutions. Selecting a suitable feature layer is very important for the detection of multi-scale targets, and the detection of small targets is a difficult problem. For basic SSD networks, small target detection is poor due to the lack of interaction between feature graphs. This paper designs the attention fusion module (AFM), which is embedded in the feature fusion module to fuse high-level and low-level semantic information, and construct a multi-scale feature map containing the object to be tested, which is used to improve the detection accuracy of small targets. The attention fusion block achieves the purpose of efficient feature extraction by assigning different weights to different channels and positions on the feature map. In order to ensure the unity of dimension of the adjacent feature graph, deconvolution operation is used here. Next, in order to make the network give a higher weight to the region of interest, SENet is integrated into the AFM, as shown in Figure 6.

3.3.3. Residual Block

Traditional SSD achieves classification and regression by using convolution filters embedded in front of each detection head. We designed a residual block, adding it before each prediction layer, as shown in Figure 7. We used standard convolution operations to obtain different receptive fields, and to add residual connections to achieve unity of features, which can effectively restrict the growth of parameters and increase the depth and width of the network. The use of the residual block makes the gradient of the loss function not directly flow to the back propagation network, which reduces the computational cost while effectively improving the detection accuracy and improving the network performance.

3.4. Construction of TMRC-SSD

The purpose of this research is to improve the accuracy of tramp material detection in raw coal. We propose an improved SSD detection framework named as tramp materials in raw coal single-shot detector (TMRC-SSD), as shown in Figure 8. It mainly includes backbone network, an extract feature module, a feature fusion module, a detection head and non-maximum suppression. The original image is processed and entered into the subsequent processing network at a preset size. Next, after a stem block module, a four-level feature extractor is used in the backbone to down-sample the feature map stably. Multi-branch dilation convolutional structure was integrated into conv7~conv11 modules to obtain rich receptive fields and extract robust feature map information, so as to avoid the sharp increase of computing cost caused by the expansion of receptive fields. In order to realize the information interaction between feature graphs, four cross-layer feature fusion modules are integrated into the feature fusion module. The attention fusion block is used to fuse adjacent CLFF feature layers. SENet improves the accuracy of detection by enhancing the weight of the region of interest, and at the same time enhances the network’s ability to detect small targets. Before each prediction layer, a residual block is used to control the flow direction of the gradient in the loss function and improve the performance of the network.

3.5. Loss Function

The loss function of the network we designed mainly consists of two parts, confidence loss (conf) and localization loss (loc). The weight term α is set to 1 by cross-validation.
L ( x , c , l , g ) = 1 N ( ( L c o n f ( x , c ) + α L l o c ( x , l , g ) )
where, the N represents the number of positive box. The localization loss is the smooth L1 loss between the prediction box ( l ) and the ground truth box ( g ). Parameters: ( c x , c y ), ( w ), and ( h ) represent the center, width, and height offsets of the default bounding box, respectively.
L l o c ( x , l , g ) = ^ i P o s N m { c x , c y , w , h } x i j k s m o o t h L 1 ( l i m g ^ j m )
g ^ j c x = ( g j c x d i c x ) / d i w g ^ j c y = ( g j c y d i c y ) / d i y
g ^ j w = log ( g j w d i w ) g ^ j h = log ( g j h d i h )
where
s m o o t h L 1 ( x ) = { 0.5 ( x ) 2 | x | < 1 | x | 0.5 o t h e r w i s e
The confidence loss is the softmax loss over multiple classes confidences ( c ) given by:
L c o n f ( x , c ) = i P o s N x i j p log ( c ^ i p ) i N e g log ( c ^ i 0 )
where
c ^ i p = exp ( c i p ) / p exp ( c i p )

4. Data and Evaluation

4.1. Dataset and Training Settings

We construct a specific dataset to evaluate the detection effect of the designed detector. In order to ensure the diversity of the data, the dataset contains 6670 images of 300 pixels × 300 pixels actually taken at the working site and in the laboratory. We marked five class: gangue, bolt, stick, iron sheet, iron chain, as a total of 9461 objects. The mean area ratio (MAR) can be calculated by dividing the pixel value of the object in the image by the total pixels of the original image. In order to investigate the detection effect of the TMRC-SSD network on different scale objects, the MAR of each class in our dataset was calculated, as shown in Table 2. By observing Table 2, it can be concluded that the proportion of iron chains is significantly smaller. The r mean area ratio is only 5.06%, which brings great challenges to the detection of small objects. Due to the differences in shooting angle and distance, the same type of foreign object may have a huge difference in area ratio in different images. Therefore, we classify each object according to the area ratio in the image where it is located. Those less than 10% are small objects, greater than 10% and less than 40% are medium objects, and greater than 40% are large objects, the statistical results are shown in Table 3. We used 80% of the images in the dataset for network training and the other 20% for detector testing.
This dataset is used for network training, which is similar to the end-to-end training strategy in SSD. We set the batch size to 16, and used a stochastic gradient descent strategy to optimize our network. In the first 10k iterations, we set the initial learning rate to 0.001, and reduced it by 0.1 times at 20k and 30k iterations.

4.2. Evaluation Indexs

The Intersection over Union (IoU) is used to test the performance of the detector, as show in Figure 9.
MIoU = 1 k + 1 i = 0 k p i i j = 0 k p i j + j = 0 k p i j p i i
P = T P T P + F P
R = T P T P + F N
A c c u r a c y = T P + T N T P + F P + T N + F N
where k , p i i , p jj , p j i and p i j represent the total number of class, the true positive (TP), the true negatives (TN), the false positive (FP) and the false negative (FN) respectively.
As to speed, frames per second (FPS) is used to measure the detection speed for the approaches.

5. Results and Analysis

5.1. Comparison with Other Methods

In this section, we have selected some widely used detectors such as SSD, Yolov3, Yolov3-tiny, DSSD, and Faster R-CNN for the comparison experiments, and to compare the results of each kind of tramp materials detection AP and all types of mAP are counted, as shown in Table 4. When the input image size is 300 pixels × 300 pixels, compared with SSD and DSSD, TMRC-SSD has achieved the best mAP which reaches 0.9612, which is 8.3 and 6.9% higher than that of SSD and 6.9% higher than that of DSSD, which shows that the three modules—MDCS, CLFF and AFM—designed to improve detection accuracy are effective. Yolov3 uses the FPN structure in feature extraction, and uses the multi-scale prediction method to perform on the feature maps of the three scales. YOLOv3-tiny is a streamlined version of YOLOv3. It only retains two independent prediction branches. The speed is improved but the detection accuracy is not as high as YOLOv3. Faster R-CNN is a two-stage detection network, which, by processing large-resolution input images and adding RPN structure to detect the tramp materials.
For the detection effect of three different sizes of objects, we use different detection networks to conduct comparative experiments. The results are shown in Table 5. YOLOv3-tiny‘s backbone network is relatively shallow, and it is difficult to extract high-level semantic features of the image, and only uses two feature layers for detection, and loses part of the scale information; therefore, the detection accuracy of small targets is only 88.56%. TMRC-SSD uses the feature fusion method to fuse the low-level features and high-level semantics of the image extracted from the shallow feature map and the deep feature map, and uses a multi-scale prediction strategy to detect targets of different sizes. In small object and large objects, the detection accuracy on the two types reached 95.57% and 97.06% respectively.

5.2. Ablation Experiment

We designed three variants of TMRC-SSD and tested them with tramp material datasets to evaluate the efficiency of MDCS, CLFF and AFM components. In the TMRC-SSD (-3) network, MDCS, CLFF and AFM components were not included. For TMRC-SSD (-2), it has an MDCS component, but no CLFF and AFM components. The TMRC-SSD (-1) we designed adds four CLFF components on the basis of TMRC-SSD (-2). TMRC-SSD includes MDCS, CLFF and AFM components. Table 6 shows different designs, and Table 7 shows the performance test results of different designs. We first verify the effectiveness of the MDCS component. TMRC-SSD (-2) increased the mAP by 1.3% compared to TMRC-SSD (-3). Compared with TMRC-SSD (-2), the mAP of TMRC-SSD (-1) increased by 0.017, reaching 0.9609. When the AFM component is added, the mAP of TMRC-SSD increases to 0.9612. However, as the complexity of the model increases, and the MDCS, CLFF and AFM components are added, and the real-time performance of the model decreases. The test results show that the TMRC-SSD has a higher accuracy than the three variants models, and can reach 24FPS in terms of detection speed. Experiments show that the combination of MDCS, CLFF and AFM components effectively enhances the detection performance of the network.

5.3. Visualization of Detection Results

In order to more intuitively understand the detection performance of our proposed network, in Figure 10, we show the visual detection results of tramp materials in raw coal. In order to effectively evaluate the detection performance of the TMRC-SSD network, we set the classification threshold score at 0.75. In Figure 10a–j, the images on the left and the right represent the original image and the TMRC-SSD network detection effect respectively. The red boxes indicate the detected gangue, the green boxes indicate the detected bolt, the purple boxes indicate the detected stick, the yellow boxes indicate the detected iron sheet, and the blue boxes indicate the detected iron chain. Due to the limitations of the basic SSD network, the detection performance for small targets is poor. However, our proposed network uses feature fusion and multi-scale prediction strategies to improve detection performance. Experimental results show that this method can detect most objects well. For smaller targets in the scene, such as the iron chain in the upper right corner of Figure 10h, a good detection effect has been achieved.

6. Conclusions

Aiming at the problem of multiple tramp material detection in raw coal, this paper proposed a new object detection framework based on feature fusion and dense networks named TMRC-SSD, to detect five types of tramp materials such as gangue, bolt, stick, iron sheet, and iron chain. In order to improve the detection accuracy, we have designed three modules for the detection of tramp materials in complex environments, especially the detection of small targets: MDCS, CLFF and AFM. Firstly, we designed a modified DenseNet as the backbone of the detector, using a four-stage feature extractor to down-sample the feature map stably. MDCS uses a multi-branch structure and dilation convolution to obtain abundant receptive fields while reducing computational cost. In the feature fusion module, four CLFFs are used to fuse the shallow and deep feature maps to achieve semantic interaction between different feature maps. AFM is used to fuse adjacent CLFF feature layers. In the ablation experiment, the effectiveness of our proposed module is proved. In addition, we constructed a dataset containing 5 categories of tramp materials, including gangue, bolt, stick, iron sheet, and iron chain, to evaluate the performance of the detector. Experimental results show that our proposed TMRC-SSD network achieves 96.12% MAP at 24FPS, which is the most advanced result compared with other existing methods. The TMRC-SSD network increases the AP of small objects by 4.1 to 95.57%.
In the next work, we will further improve the performance of our network in the detection, speed and accuracy of tramp materials by expanding the dataset and improving the network.

Author Contributions

Conceptualization, D.L.; methodology, D.L.; software, D.L.; validation, D.L.; formal analysis, D.L. and Z.S.; investigation, G.M.; resources, G.M.; data curation, D.L.; writing—original draft preparation, D.L.; writing—review and editing, L.X.; visualization, D.L.; supervision, G.M.; project administration, G.M.; funding acquisition, G.M. All authors have read and agreed to the published version of the manuscript.

Funding

This work was supported in part by the National Key Research and Development Program of China under Grant 2016YFC0600907.

Institutional Review Board Statement

Not applicable.

Informed Consent Statement

Not applicable.

Data Availability Statement

Not applicable.

Acknowledgments

The authors would like to thank the editor and the anonymous reviewers for their constructive comments and suggestions, which improved the quality of this paper.

Conflicts of Interest

The authors declare no conflict of interest.

Abbreviations

AbbreviationsFull Name
SSDsingle shot multibox detector
TMRC-SSDtramp materials in raw coal single-shot detector
MAPmean average precision
FPSframes per second
CNNconvolutional neural network
MDCSmulti-branch dilation convolution structure
CLFFcross-layer feature fusion module
AFMattention fusion module
MIoUMean Intersection over Union
FPNfeature pyramid networks
YOLOYou Only Live Once
DSSDDeconvolutional Single Shot Detector
M-Denseneta modified DenseNet

References

  1. Dai, S.; Zheng, X.; Wang, X.; Finkelman, R.B.; Jiang, Y.; Ren, D.; Yan, X.; Zhou, Y. Stone coal in China: A review. Int. Geol. Rev. 2018, 60, 736–753. [Google Scholar] [CrossRef]
  2. Zhao, Y.; Yang, X.; Luo, Z.; Duan, C.; Song, S. Progress in developments of dry coal beneficiation. Int. J. Coal Sci. Technol. 2014, 1, 103–112. [Google Scholar] [CrossRef] [Green Version]
  3. Li, J.-G.; Zhan, K. Intelligent Mining Technology for an Underground Metal Mine Based on Unmanned Equipment. Engineering 2018, 4, 381–391. [Google Scholar] [CrossRef]
  4. Stracher, G.B.; Taylor, T.P. Coal fires burning out of control around the world: Thermodynamic recipe for environmental catastrophe. Int. J. Coal Geol. 2004, 59, 7–17. [Google Scholar] [CrossRef]
  5. Zhao, Y.; Liu, X.; Wang, S.; Ge, Y. Energy relations between China and the countries along the Belt and Road: An analysis of the distribution of energy resources and interdependence relationships. Renew. Sustain. Energy Rev. 2019, 107, 133–144. [Google Scholar] [CrossRef]
  6. McCoy, J.T.; Auret, L. Machine learning applications in minerals processing: A review. Miner. Eng. 2019, 132, 95–109. [Google Scholar] [CrossRef]
  7. Mah, J.; Samson, C.; McKinnon, S.D.; Thibodeau, D. 3D laser imaging for surface roughness analysis. Int. J. Rock Mech. Min. Sci. 2013, 58, 111–117. [Google Scholar] [CrossRef]
  8. Sun, Z.; Lu, W.; Xuan, P.; Li, H.; Zhang, S.; Niu, S.; Jia, R. Separation of gangue from coal based on supplementary texture by morphology. Int. J. Coal Prep. Util. 2019, 1–17. [Google Scholar] [CrossRef]
  9. Wang, W.; Zhang, C. Separating coal and gangue using three-dimensional laser scanning. Int. J. Miner. Process. 2017, 169, 79–84. [Google Scholar] [CrossRef]
  10. Dou, D.; Zhou, D.; Yang, J.; Zhang, Y. Coal and gangue recognition under four operating conditions by using image analysis and Relief-SVM. Int. J. Coal Prep. Util. 2020, 40, 473–482. [Google Scholar] [CrossRef]
  11. Wang, W.; Lv, Z.; Lu, H. Research on methods to differentiate coal and gangue using image processing and a support vector machine. Int. J. Coal Prep. Util. 2021, 41, 603–616. [Google Scholar] [CrossRef]
  12. Hou, W. Identification of Coal and Gangue by Feed-forward Neural Network Based on Data Analysis. Int. J. Coal Prep. Util. 2019, 39, 33–43. [Google Scholar] [CrossRef]
  13. Zheng, K.; Du, C.; Li, J.; Qiu, B.; Yang, D. Underground pneumatic separation of coal and gangue with large size in green mining based on the machine vision system. Powder Technol. 2015, 278, 223–233. [Google Scholar] [CrossRef]
  14. Li, D.; Zhang, Z.; Xu, Z.; Xu, L.; Meng, G.; Li, Z.; Chen, S. An Image-Based Hierarchical Deep Learning Framework for Coal and Gangue Detection. IEEE Access 2019, 7, 184686–184699. [Google Scholar] [CrossRef]
  15. Liu, W.; Anguelov, D.; Erhan, D.; Szegedy, C.; Reed, S.; Fu, C.-Y.; Berg, A.C. SSD: Single Shot MultiBox Detector; Springer: Cham, Switzerland, 2016; pp. 21–37. [Google Scholar]
  16. Zhao, Y.; He, X. Recognition of Coal and Gangue Based on X-ray. In Proceedings of the International Conference on Applied Mechanics and Materials (ICAMM 2012), Sanya, China, 24–25 November 2012; pp. 2350–2353. [Google Scholar]
  17. Lester, E.; Watts, D.; Cloke, M.; Clift, D. Automated microlithotype analysis on particulate coal. Energy Fuels 2003, 17, 1198–1209. [Google Scholar] [CrossRef]
  18. Sun, Z.; Xuan, P.; Song, Z.; Li, H.; Jia, R. A texture fused superpixel algorithm for coal mine waste rock image segmentation. Int. J. Coal Prep. Util. 2019, 12. [Google Scholar] [CrossRef]
  19. Liu, K.; Zhang, X.; Chen, Y. Extraction of Coal and Gangue Geometric Features with Multifractal Detrending Fluctuation Analysis. Appl. Sci. 2018, 8, 463. [Google Scholar] [CrossRef] [Green Version]
  20. Fu, C.; Lu, F.; Zhang, G. Discrimination analysis of coal and gangue using multifractal properties of optical texture. Int. J. Coal Prep. Util. 2020, 1–13. [Google Scholar] [CrossRef]
  21. Lai, W.; Zhou, M.; Hu, F.; Bian, K.; Song, H. A Study of Multispectral Technology and Two-Dimension Autoencoder for Coal and Gangue Recognition. IEEE Access 2020, 8, 61834–61843. [Google Scholar] [CrossRef]
  22. Su, L.; Cao, X.; Ma, H.; Li, Y. Research on Coal Gangue Identification by Using Convolutional Neural Network. In Proceedings of the 2018 2nd IEEE Advanced Information Management, Communicates, Electronic and Automation Control Conference (IMCEC), Xi’an, China, 25–27 May 2018; pp. 810–814. [Google Scholar]
  23. Pu, Y.; Apel, D.B.; Szmigiel, A.; Chen, J. Image Recognition of Coal and Coal Gangue Using a Convolutional Neural Network and Transfer Learning. Energies 2019, 12, 1735. [Google Scholar] [CrossRef] [Green Version]
  24. Alfarzaeai, M.S.; Niu, Q.; Zhao, J.; Eshaq, R.M.A.; Hu, E. Coal/Gangue Recognition Using Convolutional Neural Networks and Thermal Images. IEEE Access 2020, 8, 76780–76789. [Google Scholar] [CrossRef]
  25. Xing, J.; Zhao, Z.; Wang, Y.; Nie, L.; Du, X. Coal and gangue identification method based on the intensity image of lidar and DenseNet. Appl. Opt. 2021, 60, 6566–6572. [Google Scholar] [CrossRef] [PubMed]
  26. Gao, R.; Sun, Z.; Li, W.; Pei, L.; Hu, Y.; Xiao, L. Automatic Coal and Gangue Segmentation Using U-Net Based Fully Convolutional Networks. Energies 2020, 13, 829. [Google Scholar] [CrossRef] [Green Version]
  27. Sun, Z.; Huang, L.; Jia, R. Coal and Gangue Separating Robot System Based on Computer Vision. Sensors 2021, 21, 1349. [Google Scholar] [CrossRef] [PubMed]
  28. Lv, Z.; Wang, W.; Xu, Z.; Zhang, K.; Lv, H. Cascade network for detection of coal and gangue in the production context. Powder Technol. 2021, 377, 361–371. [Google Scholar] [CrossRef]
  29. Hinton, G.E.; Salakhutdinov, R.R. Reducing the dimensionality of data with neural networks. Science 2006, 313, 504–507. [Google Scholar] [CrossRef] [PubMed] [Green Version]
  30. Krizhevsky, A.; Sutskever, I.; Hinton, G.E. ImageNet Classification with Deep Convolutional Neural Networks. Commun. ACM 2017, 60, 84–90. [Google Scholar] [CrossRef]
  31. Girshick, R.; Donahue, J.; Darrell, T.; Malik, J. Rich feature hierarchies for accurate object detection and semantic segmentation. In Proceedings of the 27th IEEE Conference on Computer Vision and Pattern Recognition (CVPR), Columbus, OH, USA, 23–28 June 2014; pp. 580–587. [Google Scholar]
  32. Girshick, R. Fast R-CNN. In Proceedings of the IEEE International Conference on Computer Vision, Santiago, Chile, 11–18 December 2015; pp. 1440–1448. [Google Scholar]
  33. Ren, S.Q.; He, K.M.; Girshick, R.; Sun, J. Faster R-CNN: Towards Real-Time Object Detection with Region Proposal Networks. In Proceedings of the 29th Annual Conference on Neural Information Processing Systems (NIPS), Montreal, QC, Canada, 7–12 December 2015. [Google Scholar]
  34. Redmon, J.; Divvala, S.; Girshick, R.; Farhadi, A. You Only Look Once: Unified, Real-Time Object Detection. In Proceedings of the 2016 IEEE Conference on Computer Vision and Pattern Recognition (CVPR), Seattle, WA, USA, 27–30 June 2016; pp. 779–788. [Google Scholar]
  35. Lin, T.-Y.; Dollar, P.; Girshick, R.; He, K.; Hariharan, B.; Belongie, S. Feature Pyramid Networks for Object Detection. In Proceedings of the 30th IEEE/CVF Conference on Computer Vision and Pattern Recognition (CVPR), Honolulu, HI, USA, 21–26 July 2017; pp. 936–944. [Google Scholar]
  36. Fu, C.; Liu, W.; Ranga, A.; Tyagi, A.; Berg, A.C. DSSD: Deconvolutional Single Shot Detector. arXiv 2017, arXiv:1701.06659. [Google Scholar]
Figure 1. Scene depicting manual selection.
Applsci 12 00107 g001
Figure 2. Schematic diagram of stem block.
Applsci 12 00107 g002
Figure 3. Dilation convolution operation. (a) The process of 5 × 5 general convolution Convolve. (b) The process of 3 × 3 dilated convolution (d = 2).
Applsci 12 00107 g003
Figure 4. Schematic diagram of MDCS.
Applsci 12 00107 g004
Figure 5. Schematic diagram of Cross-layer feature fusion-1(CLFF-1).
Applsci 12 00107 g005
Figure 6. Schematic diagram of attention fusion module (AFM).
Applsci 12 00107 g006
Figure 7. Schematic diagram of attention residual block.
Applsci 12 00107 g007
Figure 8. Tramp materials in raw coal single-shot detector (TMRC-SSD) architecture overview.
Applsci 12 00107 g008
Figure 9. Schematic diagram of IoU.
Applsci 12 00107 g009
Figure 10. Visualization results. In the sub-figure (aj), the left is the original picture, and the right is the visualization result of the proposed network. The sub-figures (a,b) show the detection of gangue; the sub-figures(c,d) show the detection of bolt; the sub-figures (e,f) show the detection of stick; the sub-figures (g,h) show the detection of iron chain; the sub-figures (i,j) show the detection of iron sheet.
Applsci 12 00107 g010
Table 1. Architecture of M-DenseNet.
StageLayerOutput SizeSpecification
stem block75 × 75 × 64
Stage(1)dense block(1)75 × 75 × 256 ( 1 × 1   conv 3 × 3   conv ) × 6
transition layer(1)75 × 75 × 256 1 × 1   conv
2 × 2   max pool, stride 2
Stage(2)dense block(2)38 × 38 × 512 ( 1 × 1   conv 3 × 3   conv ) × 8
transition layer(2)38 × 38 × 512 1 × 1   conv
19 × 19 × 512 2 × 2   max pool, stride 2
Stage(3)dense block(3)19 × 19 × 768 ( 1 × 1   conv 3 × 3   conv ) × 8
simplify transition layer(1)19 × 19 × 768 1 × 1   conv
Stage(4)dense block(4)19 × 19 × 1024 ( 1 × 1   conv 3 × 3   conv ) × 8
simplify transition layer(2)19 × 19 × 1024 1 × 1   conv
Table 2. Number and MAR of each class.
ClassGangueBoltStickIron SheetIron Chain
Number4661153719821223112
MAR28.9%57.4%36.6%30.1%5.06%
Table 3. Number of each category.
CategorySmall ObjectMedium ObjectLarge Object
number42775731461
Table 4. Performance with different methods for five type of objects.
MethodBackboneInput SizeGangueBoltStickIron SheetIron ChainmAP
SSDVGG-16300 × 3000.92670.92160.92870.93360.68270.8787
Yolov3Darknet-53320 × 3200.97190.92170.97760.96910.90160.9484
Yolov3-tinyDarknet-19416 × 4160.94610.85540.94180.91740.86690.9055
DSSDResNet-101300 × 3000.91170.91350.90560.97760.75180.8920
Faster RCNNResNet-101600 × 10000.97280.91410.86250.86630.75070.8733
TMRC-SSDM-DenseNet300 × 3000.96630.97140.97190.95290.94340.9612
Table 5. Performance with different components for three scales of objects.
MethodSmall ObjectMedium ObjectLarge Object
SSD0.74380.93250.9598
Yolov30.91420.97070.9602
Yolov3-tiny0.88560.89830.9326
DSSD0.81630.94220.9174
Faster RCNN0.68390.91630.9658
TMRC-SSD0.95570.96920.9706
Table 6. Models with various designs.
MethodTMRC-SSD(-3)TMRC-SSD(-2)TMRC-SSD(-1)TMRC-SSD
+MDCS
+4 CLFF
+AFM
Table 7. Performance with different components for five type of objects.
MethodGangueBoltStickIron SheetIron ChainmAPFPS
TMRC-SSD(-3)0.95910.96960.97090.92980.90230.946348
TMRC-SSD(-2)0.96070.97110.97220.95840.93190.958933
TMRC-SSD(-1)0.96860.97070.97280.95170.94070.960931
TMRC-SSD0.96630.97140.97190.95290.94340.961224
Publisher’s Note: MDPI stays neutral with regard to jurisdictional claims in published maps and institutional affiliations.

