Article

PV Benefits Assessment for PV-Powered Charging Stations for Electric Vehicles

AVENUES, Centre Pierre Guillaumat, Université de Technologie de Compiègne, CS 60 319, 60203 Compiègne, France
*
Author to whom correspondence should be addressed.
Appl. Sci. 2021, 11(9), 4127; https://doi.org/10.3390/app11094127
Submission received: 12 April 2021 / Revised: 28 April 2021 / Accepted: 29 April 2021 / Published: 30 April 2021

Abstract

:

Featured Application

The paper focuses at photovoltaic (PV) benefits assessment for PV-powered charging stations for electric vehicles including PV sources, stationary storage, and public grid connection. The proposed methodology is presented through the creation of a technical and economic tool for local stakeholders, allowing to identify the preliminary requirements and feasibility conditions for PV-powered EV charging stations leading to PV benefits growth: the needed space, the generated cost of investment, and a qualitative assessment simulating the ecological character of its infrastructure thus dimensioned.

Abstract

Recently, the lift off point for the sales of electric vehicle (EV) was started with a significant increase. Therefore, convenient access to charging station infrastructure is required. The purpose of this work is to assess the role and benefits of photovoltaic (PV) for PV-powered charging infrastructures for EVs by a better energy management. This management is performed by a microgrid based on PV panels installed on roofs or car parking shades, EVs charging terminals, electrochemical stationary storage, and public grid connection. The aim is to define the economic aspects, feasibility and preliminary requirements for this system, in order to avoid overloading the power grid and guarantee a higher percentage of clean energy. The proposed methodology is presented through the modeling and development of a techno-economic tool for local stakeholders, allowing to manage and size EV charging stations, which is divided into three phases. The first phase informs local stakeholders on the necessary space and the maximum sizing as well as the generated cost to install a PV-powered charging station (PVCS). During the second phase, the total cost of the PVCS is adjusted according to the users’ budgets and needs. The third phase presents a detailed qualitative analysis of the user-defined configuration. In this phase, the main objective is to assess the performance of the PVCS, and then, to improve its sizing and its operating modes aiming at increasing the use of PV energy, while minimizing energy supplied by the power grid. In addition, it allows evaluating the PVCS performance by proposing an energy balance according to different charging scenarios (virtuous scenario, critical scenario, realistic scenario, and personalized scenario) and weather conditions. Moreover, this tool is reproducible in peri-urban area since it is able to handle any location.

1. Introduction

Globally, 24% of total energy consumption is due to the “transport”, and a significant part of this need is satisfied by the fossil fuel production in 2018 [1]. Transportation significantly requires the existence of conventional hydrocarbons. This dependency leads to several difficulties such as energy supply stability and financial burden [2]. Furthermore, the depletion of the global fossil fuel reserves and the growing environmental impact of these resources have forced a radical change in energy resources, vehicles, infrastructures and tools that use fossil fuels. At this point, the fuel economy requirements of vehicles have also improved in addition to global regulations on CO2 emissions [3]. Furthermore, the regulation 2018/1999 of the European parliament and of the council entered into force as part of the package clean energy for all Europeans [4]. The regulation underlines the importance of meeting the energy union and climate targets for 2030. The energy union covers these dimensions: energy efficiency, the internal energy market, decarbonization, energy security, research, and innovation. For example, the decision to maintain the level of global warming under 2 °C by targeting 1.5 °C was taken in the Paris Agreement with the help of increasing the use of renewable energy by 32.5%, energy efficiency of 32%, and reducing greenhouse gas emissions by 40% [4]. This regulation provides a clear objective for the reduction of CO2 emissions from the sector of road transport: a 15% reduction in average emission of the new passenger car fleet from 1 January 2025, and 37.5% reduction from 1 January 2030 [5]. To achieve these goals, electric vehicles (EVs) are good candidates that effectively substitute for thermal vehicles [6,7]. In addition, EVs offer more feasibility to the orientation toward intelligent transport as they are more and more connected and autonomous [8]. Today, car manufacturers are faced with a major challenge: how to trust the information received by each vehicle? From this perspective, new generation vehicle-to-everything (V2X) information and communications technologies and smart roads infrastructures able to communicate with V2X are key factors in the success of the smart transport systems [9]. The new generation road is designed to provide communications between road infrastructure and EVs to improve road safety [10].
The EV concept has shown a rapid increase in last decade. For instance, the sales of EVs topped 2.1 million globally in 2019, already a record year surpassing 2018. With this increase, the worldwide stock of EVs in 2019 has been boosted to 7.2 million [11]. Although EV concept is being used worldwide in recent years, there is a strong need for efficient infrastructure because the increase in the number of EVs will lead to an electrical load rise on the power grid. In addition, the number of charging stations as well as their locations will become crucial to satisfy consumers in terms of electricity supply. By the end of 2019, there were 7.3 million EV chargers installed worldwide. The stock of chargers increased by 40% from 5.2 million in 2018 [11]. All the environmental benefits of EVs can be realized only with the production of recharging energy with zero or very low CO2 emissions. To overcome this drawback, the energy transition encourages the growth of photovoltaic (PV) power generation since it may coincide with the times during which the EV is parked at the workplace (during times when solar irradiance is the highest) and consequently reduce the burden on the public grid [12]. Therefore, PV-power infrastructure for charging EV can promote local consumption of PV energy, reduce the dependency of charging stations with the power grid and reduce directly the emissions of CO2 [13].
Therefore, the provision of PV-powered charging stations (PVCS) would contribute to the sustainable development of EVs and society. The question that arises for PVCS is how to support local authorities to facilitate their decision-making on the deployment of microgrids integrating PV sources. Thus, economic, social, and environmental factors are the key considerations to plan the location of PVCS. On this basis, an environmental and economic analysis of the PVCS is carried out in [14] by comparing an uncontrolled load scenario with an optimal load scenario. The paper [15] analyzed an economic evaluation method for PVCS using a cost estimation of second-use EVs batteries. A study is presented in [16] to design a PVCS on the idea to increasing revenue. An identification of the preliminary requirements and feasibility conditions for PVCS aiming to increase the use of PV energy for recharging EVs while minimizing the energy absorbed from the power grid is presented in [17]. It is proposed an EVs energy distribution method to determine the share of participation of each power source in EV charging according to arrival time, departure time, state of charge (SOC) at arrival, desired SOC at departure and charging mode. A study [18] evaluates the feasibility of PVCS with stationary battery storage in China and United States using a simulation model that estimates the cumulative CO2 emissions, yearly energy costs and system’s energy balance based on the PV energy share. The authors show that PV shares of 50% and 75% of the annual charging electricity are feasible, whereas a 100% PV share is possible but could lead to high system costs. In [19], an extended method of coordination distribution is proposed, based on power prediction for the microgrid PV power generation with plug-in EVs to improve the local consumption of renewable energy in the microgrid by guiding the orderly charging of EVs. In this method, a neural network and clustering algorithm are used to construct a power predicting model to characterize the PV generation uncertainty and EV charging profile. In [20], a linear programming approach is developed to share the PV energy with EVs in order to satisfy users and also maximizes PV utilization. They evaluate the performance of the approach on a real case and synthetically datasets to demonstrate that it distributes the available electric charge between EVs through the seasons with varying profiles of demand. In [21], the focus lies on the economic aspects and feasibility of EV charging system made up of PV sources connected to the grid and equipped with stationary storage. In this case, a support tool was modeled and developed, making it possible to size and manage EV charging stations with only a few input parameters. A technical and economic analysis using the tool HOMER (Hybrid Optimization Model for Multiple Energy Resources) software of PVCS under different irradiation conditions is presented in [22]. They show that a region with strong sunshine is more likely to invest in PVCS than other regions with lower solar irradiation, but the charging type is not investigated to assess more the performance of PV energy in recharging EV. As in slow charging, the PV benefits can be improved, where the EVs can depend more on PV and less on power grid whereas in fast charging, the energy demand is high, which increases the dependency on the power grid. The optimal technical design of PV and stationary storage system for charging EVs is decisive to ensure their economic feasibility, which corresponds to the system components sizing with minimum cost [23]. In [23] the study is realized using HOMER software to analyze the economic and technical performances for standalone PVCS associated with battery as stationary storage system. The off-grid PVCS can be considered as a good solution to reduce the CO2 emissions, but it generally works with slow charging terminals and for EVs with a short daily trip. In [24], an analysis is made of PV car parks that meet the aforementioned benefits. Following this techno-economic feasibility study, the PV installation is not always economically feasible, especially for areas where electricity prices are relatively low. Finding sustainable and economic methods for the deployment of PV energy is crucial for the improvement of PV benefits. Therefore, in [25] a techno-economic environmental assessment of two case studies, in Japan and China, of residential PV installations with battery or EVs allowing charging and discharging (Vehicle-to-Home) is conducted, with the projection of the costs of these technologies up to 2030. The high electricity prices in Kyoto, Japan, give the best opportunity for “PV + EV”, i.e., Vehicle-to-Home, technologies to develop. The areas where electricity prices are lower, such as Shenzhen, China, have a potential reduction of CO2 emission, but they are not economically beneficial.
Through the aforementioned literature review, it can be noticed that some problems have not been addressed by the existing investigations:
(1)
Currently, there is not enough research on preliminary requirements and feasibility conditions for PVCS.
(2)
The decision-making model should be improved including the PV benefits assessment information.
(3)
Lack of analysis of PV benefits under several solar irradiation conditions and different EVs charging profiles.
In order to resolve the above issues, this paper focuses on PV benefits assessment for PVCS, and it presents a methodology based on a model giving an economic and technical comparison under different conditions of load and weather conditions, helping the sizing, planning and management of such systems. This work brings the following improvements:
(1)
An effective methodology and easy to use Excel-based tool.
(2)
A flexible sizing of the PVCS according to the users’ needs and budgets.
(3)
A qualitative analysis of PVCS under three types of solar irradiations, two charging profiles and three predefined scenarios and personalized scenario of occupancy rates (OR) of electric charging terminals.
This infrastructure is based on PV panels installed on roofs of houses/buildings or car parking shades, EV charging terminals, electrochemical stationary storage, power electronics, and public grid connection. Based on various input parameters, the tool becomes a decision-making one.
Thus, the study aims to assess the benefits of PV for PVCS and presents a methodology based on a pre-sizing tool. This tool, divided into three phases, gradually leads the user to a choice of infrastructure compatible with the local constraints, particularly spatial and economic. The first one is to determine the maximum number of charging terminals and PV panels that can be installed with respect of the location constraints, as well as the recommended stationary storage capacity for optimal operation of the PVCS. The second one is a phase for adjusting the PVCS total cost. The third one offers a detailed qualitative analysis of the user-defined configuration in phase 2. Its objective is to assess the performance and then to improve the PVCS sizing and operating modes aiming at increasing the use of PV energy for EV charging, while minimizing energy supplied by the power grid. In phase 3, the PVCS performance is evaluated by an energy balance obtained by operating mode simulation. This tool gives the possibility to personalize the charging profile of EVs highlighting the contribution of the energy provided by the PV panels for recharging. This paper is organized as follows: Section 2 gives an overview of the methodology used in the tool’s three phases development, and finally, Section 3 draws the main conclusions and perspectives.

2. PV Benefits Assessment Methodology

The objective of this part is to detail the methodology that was followed to program the technical and economic decision support tool. The tool is devoted to local stakeholders, allowing to identify the preliminary requirements and feasibility conditions for PVCS, leading to PV benefits growth: the needed space, the generated cost of investment and a qualitative assessment simulating the ecological character of its infrastructure thus dimensioned. There are three different phases, each providing the user with additional information. For each phase, the study assumptions, the input data and how the algorithm processes data in order to calculate the output data are detailed. This tool must be easy to use and understandable for a novice user, while responding to certain precision requirements that it is representative of reality. The tool is developed in Excel, with the Visual Basic for Applications language.
The assumptions of this methodology are listed below:
  • The consumption of an EV is assumed to be 15 kWh/100 km for “normal” driving and 10 kWh/100 km for economical driving [26];
  • Maximum Power Point Tracking (MPPT) for PV power is considered to be al-ways optimal;
  • Losses due to microgrid system are estimated at 14% (average value given by PVGIS software);
  • All considered charging terminals can offer a charging power less than or equal to 22 kW. This limitation is chosen in order to reduce the dependency on the power grid in favor of PV energy in the EV charging [17].

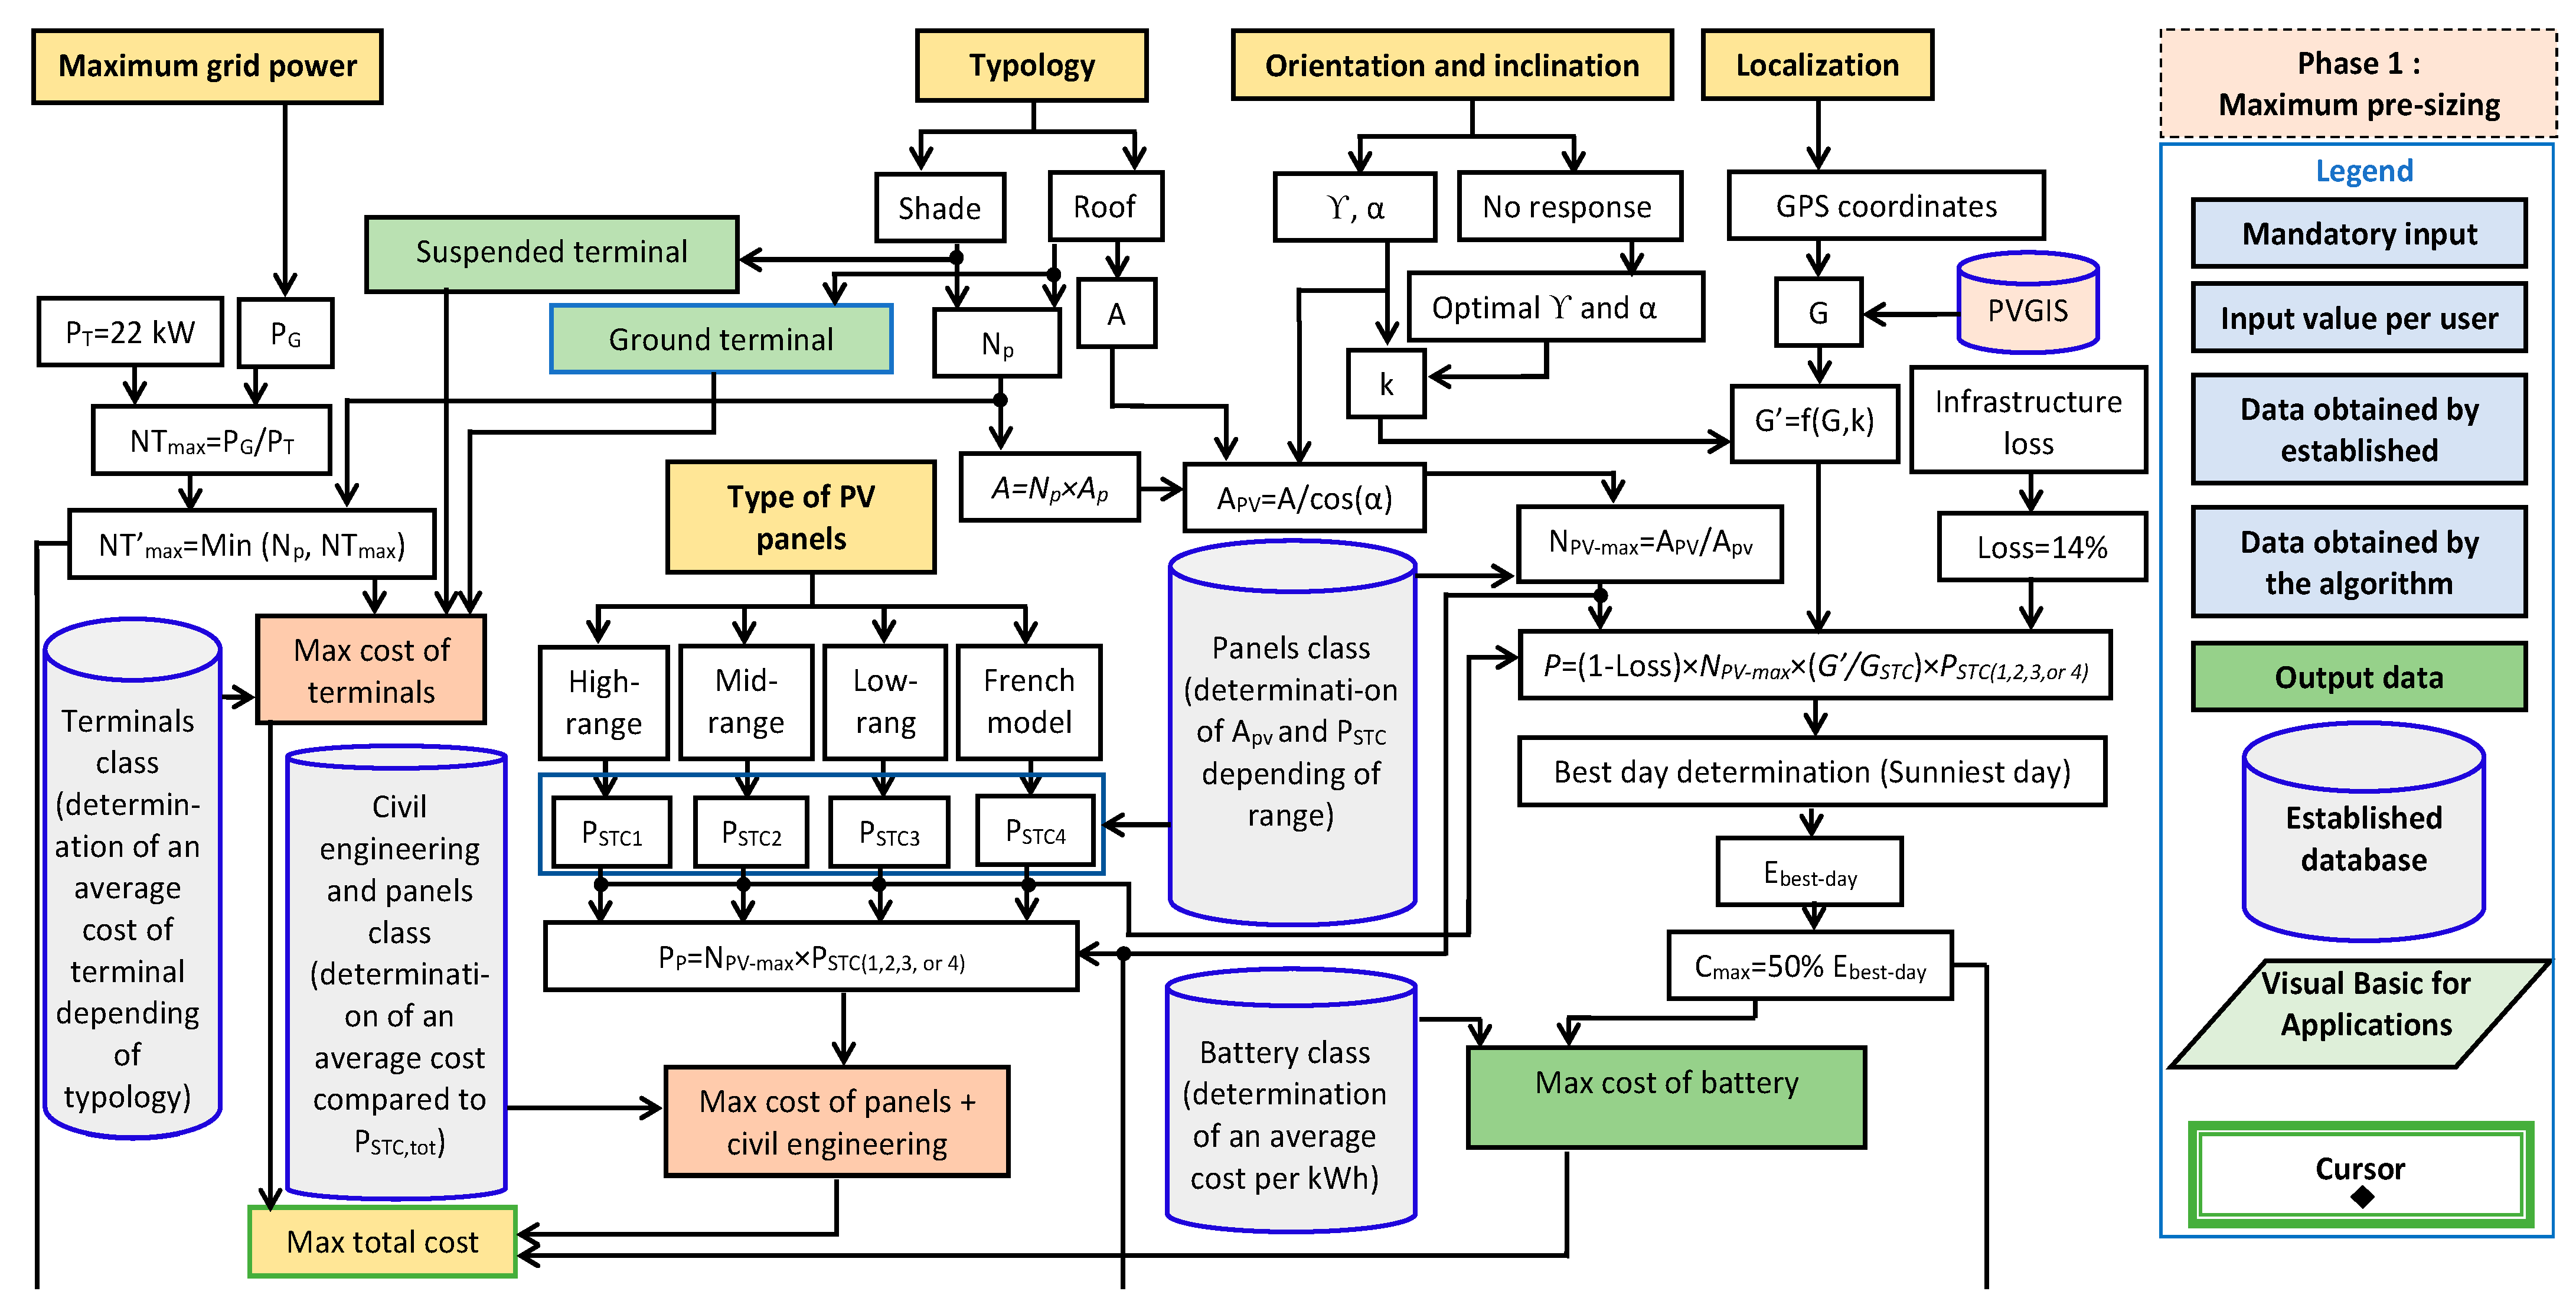
2.1. Phase 1: Maximum Pre-Sizing

The goal of this first phase is to determine the maximum number of charging terminals and PV panels that can be installed with respect to the location constraints, as well as the maximum storage capacity. At the end of this phase, the overall cost estimation is given.
Figure 1 describes the five steps of the phase 1 by using a detailed flow chart. The five steps are:
  • The sizing of charging terminals;
  • The area of the infrastructure;
  • The sizing of the PV panels;
  • The sizing of the storage;
  • The calculation of the total and maximum price of the infrastructure.

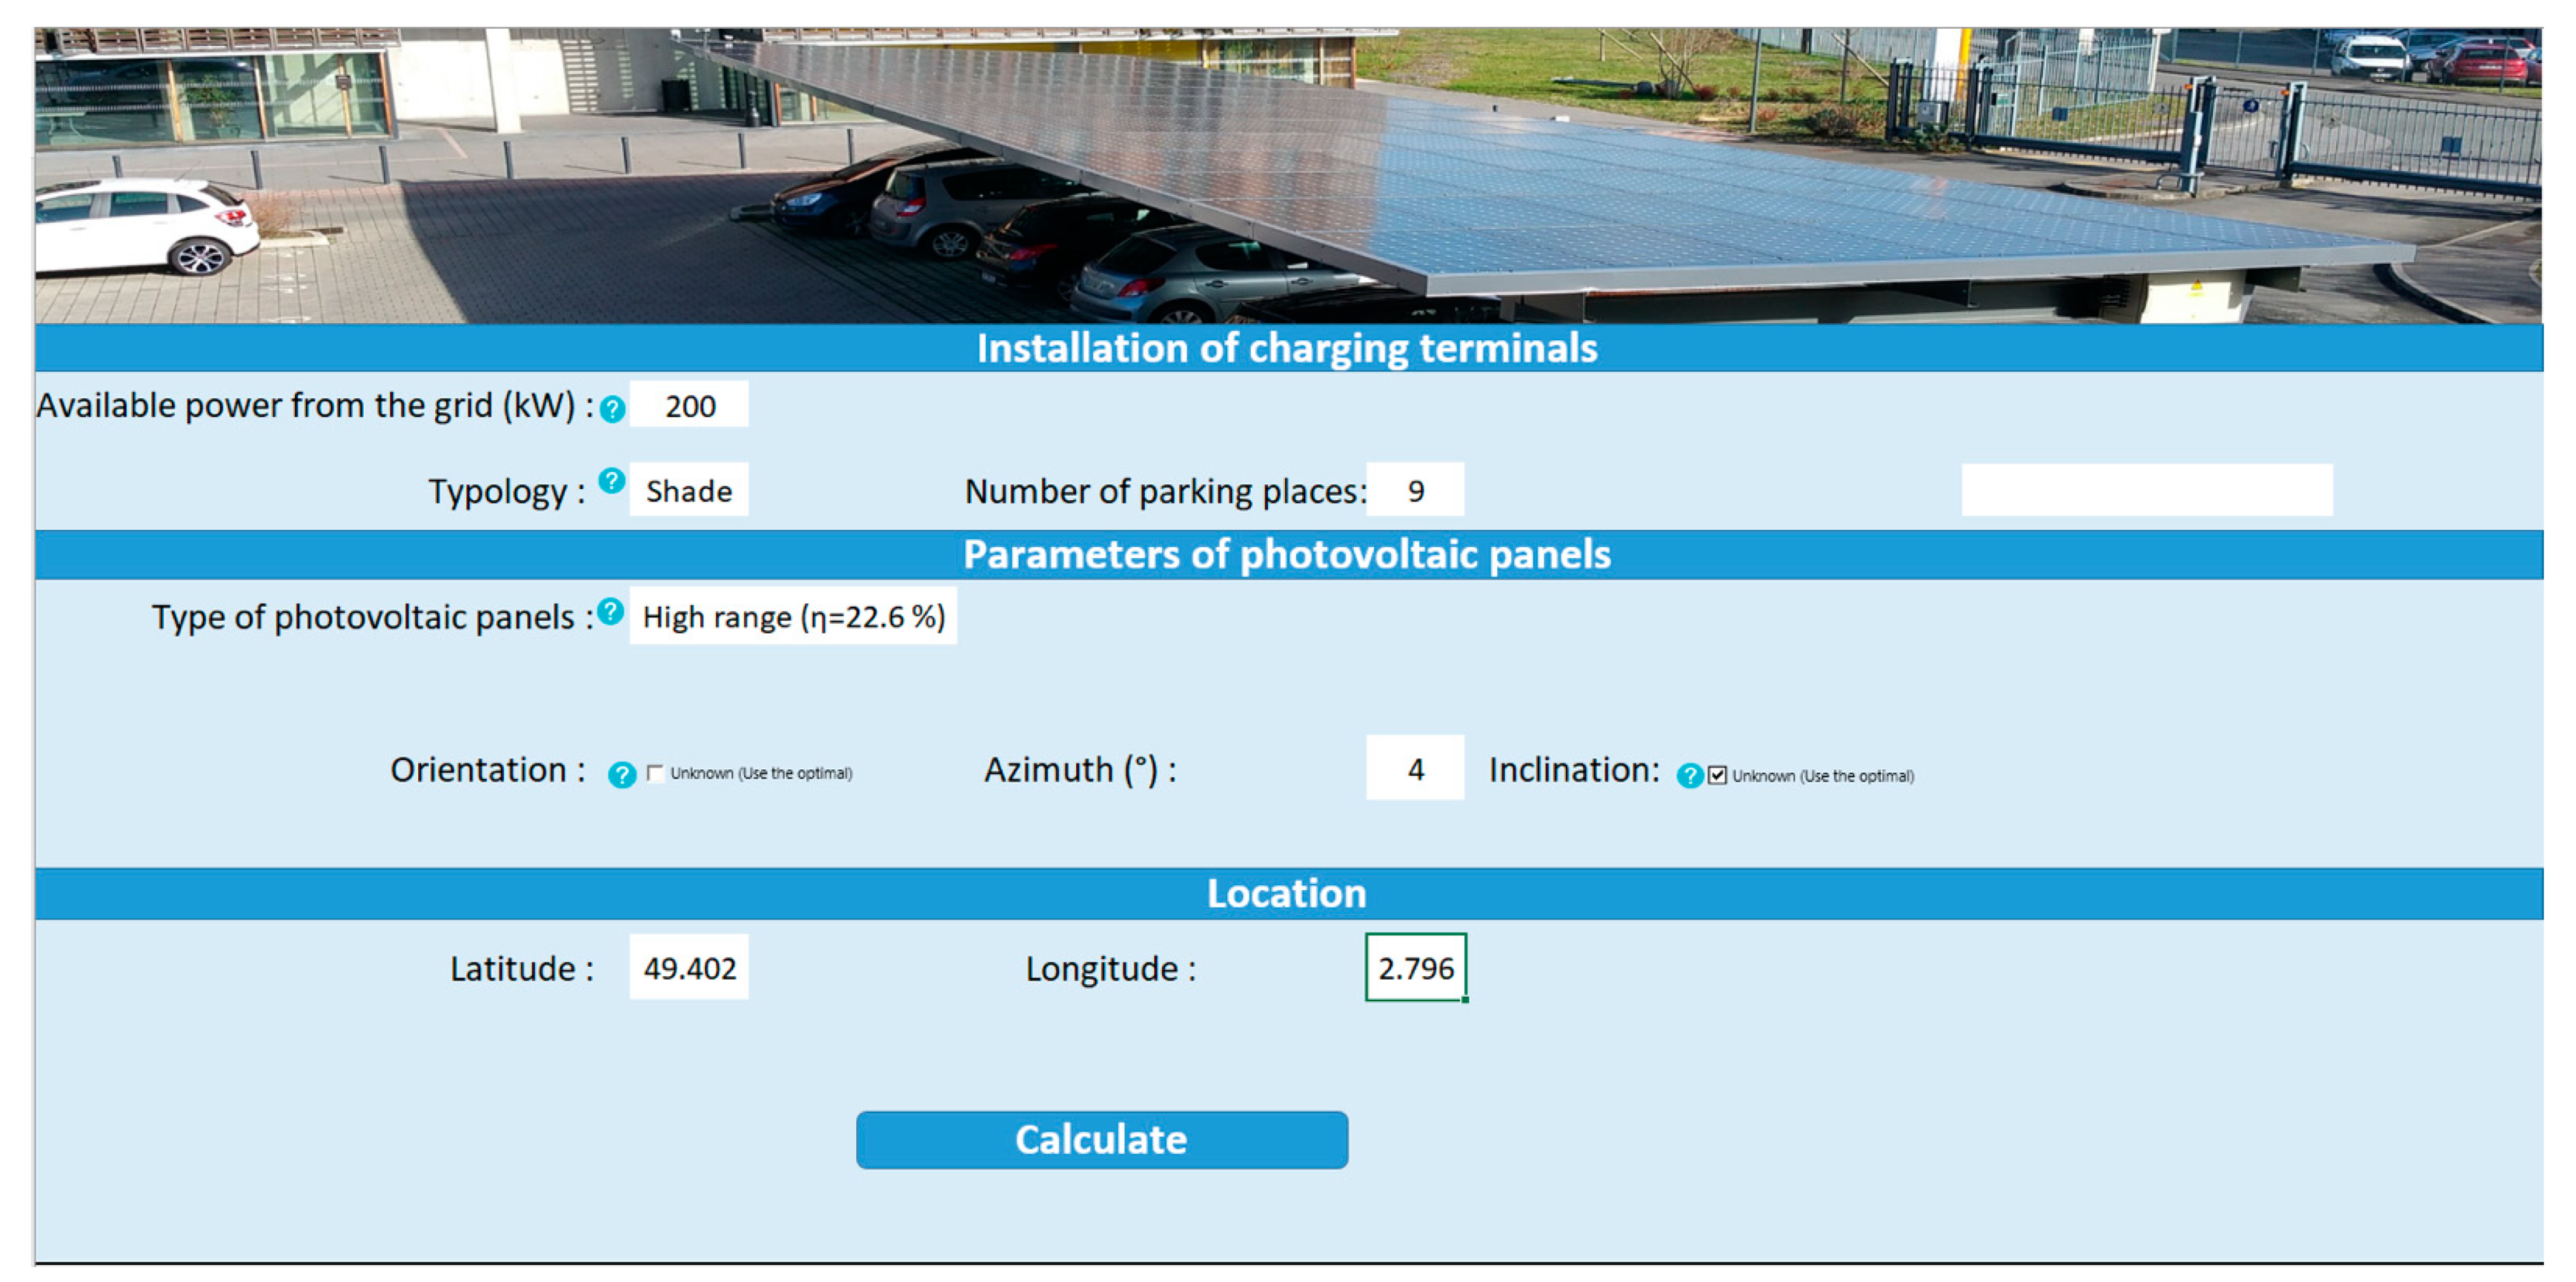
2.1.1. Requisite Data

The necessary input data, requested from the user during phase 1, are the following:
  • Available maximum public grid power PG, which corresponds to the maximum value of the power, in kW, that the power grid can supply the future PVCS;
  • Typology corresponding to the choice of PV panels installation on the roof or on the car parking shade;
  • Type of the charging terminals according to the typology PV panels installations: for a rooftop installation, ground type charging terminals are assigned, and for a shade-type installation, suspended charging terminals are assigned;
  • Number of parking spots to be covered Np;
  • Available area A corresponding to the roof area available for the PV panels installation and to the PVCS available area for car parking shade;
  • Type of PV panels according to the desired range, i.e., high-range, mid-range, low-range, and the French model, corresponding to monocrystalline panels defined according to PV power at standard test conditions (STC) PSTC and PV conversion efficiency η:
    High-range: η = 22.6%, PSTC1 = 400 W;
    Mid-range: η = 19.6%, PSTC2 = 330 W;
    Low-range: η = 18.4%, PSTC3 = 300 W;
    French model: η = 18.1%, PSTC4 = 300 W.
  • PV orientation Υ and PV inclination α, which will make it possible to determine the irradiations received by the PV panels;
  • Depending on the location, latitude and longitude, the weather data profile is generated through a download link allowing to obtain the solar irradiation data from Photovoltaic Geographical Information System (PVGIS) software [27].
These aforementioned inputs data are entered according to the interface depicted in Figure 2.
The five steps of the phase 1 shown on the flow chart schematized in Figure 1 are presented below.

2.1.2. First Step: Sizing of Charging Terminals

The purpose of this step is to determine the real maximum number of charging terminals N T max that can be installed. The PVCS is a microgrid grid-connected system; therefore, the theoretical maximum number of charging terminals N T max calculation depends on the available maximum public grid power P G and the power delivered by each terminal P T , as expressed by Equation (1).
N T max = P G P T
Finally, the real maximum number of terminals N T max is the minimum between N T max and the number of parking spaces N p entered by the user.

2.1.3. Second Step: Area of the Infrastructure

The PVCS area depends on the type of installation (a rooftop or a car parking shade PV installation) and the available area A . This latter is entered directly by the user of the tool in the case of a roof installation, while for car parking shade installation the area is calculated according to the number of parking spaces N p and the conventional surface of a parking spot A p as in Equation (2).
A = N p A p

2.1.4. Third Step: Sizing of the PV Panels

From the area A and the inclination of the PV panels α , the area of all PV panels A P V is determined by Equation (3).
A P V = A cos ( α )
Next, the maximum number of PV panels N P V max is determined by dividing the area of all PV panels A P V by the area of one PV panel A p v as expressed in (4).
N P V max = A P V A p v

2.1.5. Fourth Step: Sizing of the Storage

The solar irradiation G data for the optimum location, orientation ϒ and inclination are obtained from the PVGIS tool, whose data are available at present for every 10 min on any day, for the years from 2005 to 2016. The corrected irradiation value G is calculated according to a correction factor k and G:
G   = k G
where the factor k depends on ϒ and α , as summarized in Table 1.
The total PV power P produced by the PVCS is calculated according to Equation (6):
P = N P V max G   G S T C P S T C
where P S T C is the PV panel power at standard test estimated from a database of different available ranges of PV panels. This power calculation is made for the best sunny day in terms of irradiation, according to data from PVGIS. The obtained power is corrected by considering the losses due to the infrastructure estimated at 14%. Then, by integration, the total energy produced in this best day E b e s t d a y is obtained. Aiming at a good trade-off between cost and operation, the considered assumption is that the maximum capacity C max of stationary batteries must allow to store at least half of the energy produced on this best day, hence, the following Equation (7):
C max = 50 % E b e s t d a y

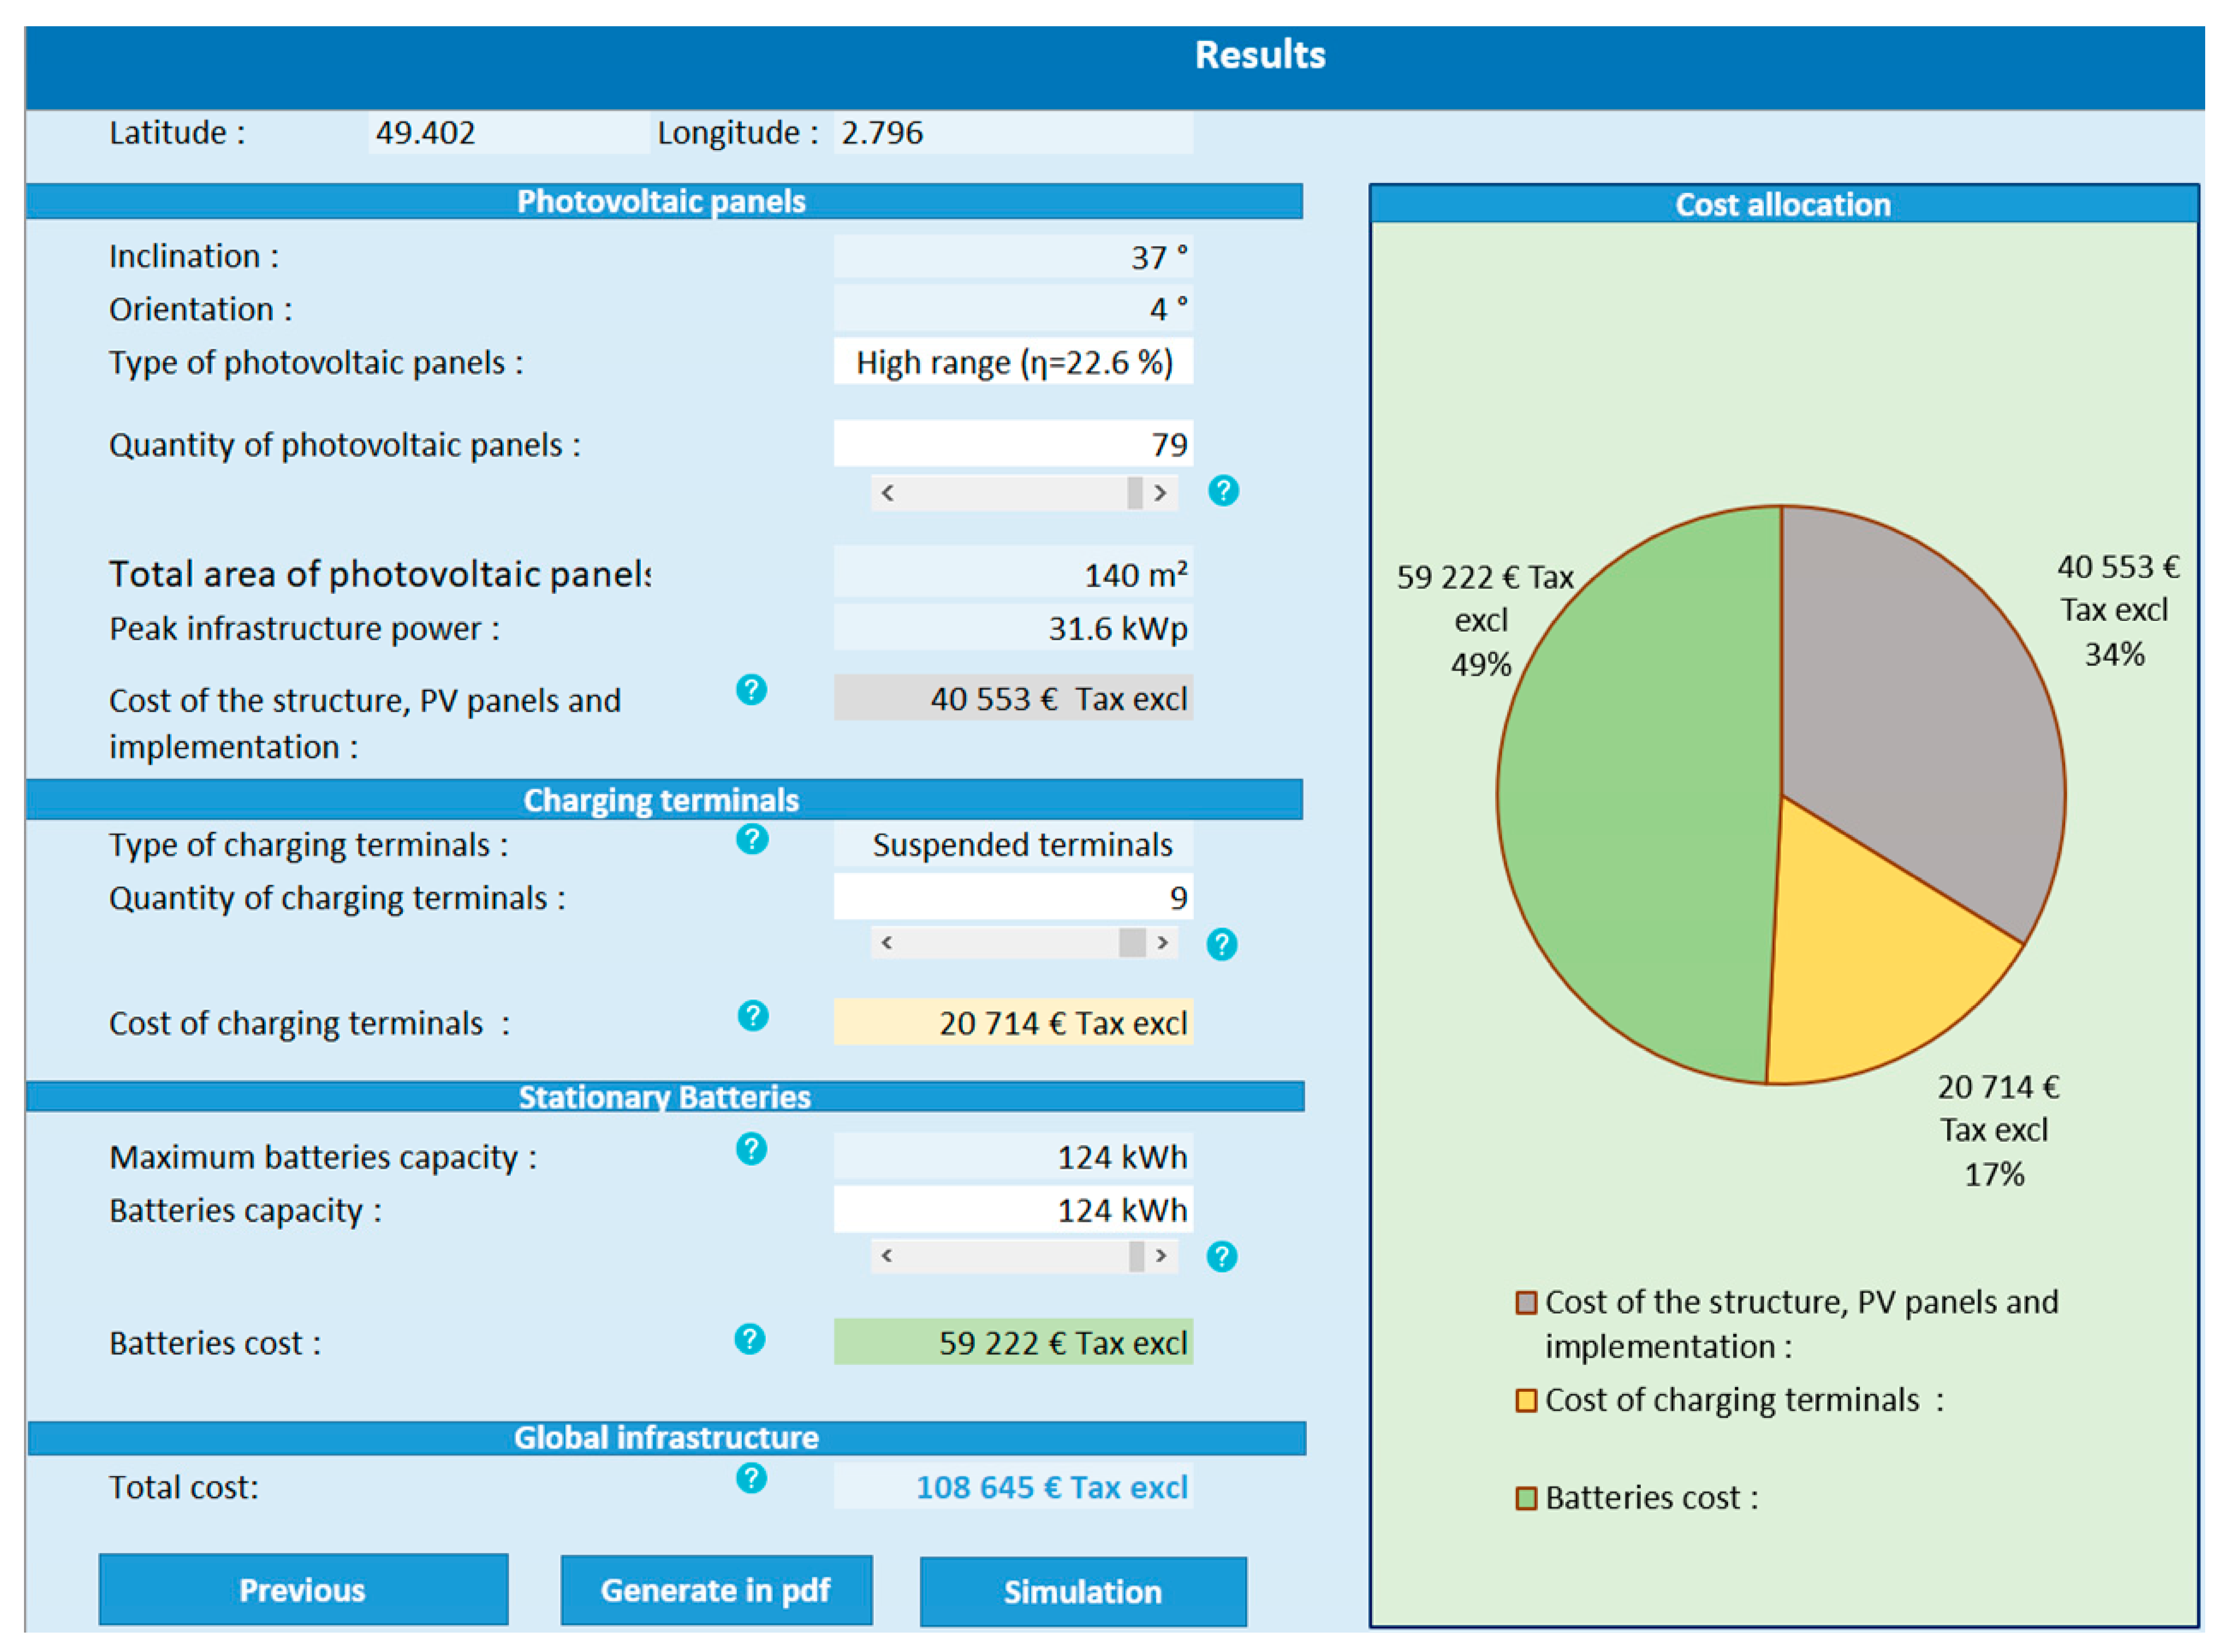
2.1.6. Fifth Step: Calculation of the Total and Maximum Price of the Infrastructure

The total PVCS cost is obtained by adding three costs:
  • The cost of the infrastructure of the PV panels and of its implementation is estimated according to the total peak power of the PV panels depending on the four ranges (high, mid, low, and French model). For the PV infrastructure installed on the roof, the estimated cost is given according to the data summarized in Table 2, while the estimated costs of the PV infrastructure installed on the car parking shade is presented according to the data summarized in Table 3. These tables allow, after mathematical linearization, to associate a cost as function of the total peak power of the of the PV panels Pp obtained by Equation (8):
    P p = N P V max P S T C ( 1 , 2 , 3 , o r 4 )
  • The cost of the stationary storage (batteries) for the PVCS is estimated from the data presented in Table 4;
  • The cost of charging terminals depends on the type of terminals (on the ground for the roof type and suspended for the shade type) and on the real maximum number of terminals NT′max. This cost is determined using a database establishing an average price for the two types of terminals.
Although the data included in Table 2, Table 3 and Table 4 as well as the cost of charging terminals come from French databases, this does not influence the proposed methodology, and other costs can be entered to agree with other references.
Concerning the phase 1, the weakness of the approach lies in its dependency on the construction of the PVGIS download link. Indeed, PVGIS changes the construction logic; the tool will then generate a bad link, and the download cannot therefore be carried out.
Finally, as presented in Figure 3, the first phase of the tool offers a maximum sizing of the PVCS (the cursors of adjustment of PV panels quantity, of terminals number and of the stationary battery capacity are at the maximum positions). The unit kWp in Figure 3, which does not belong to International System of Units while often in common use, denotes kW at STC.
The inputs used in this part are for an existing PVCS, i.e., the smart transport and energy living lab platform [28]. The output results of phase 1 are the maximum size of the PVCS before adjustment.
The obtained results potentially overestimate the PVCS costs considered in the first calculation; these can therefore be adjusted in the phase 2. Thus, the moving of cursors means the automatic passage to phase 2 to adjust the maximum pre-dimensioned parameters of the PVCS, e.g., to adjust the quantity of PV panels, quantity of charging terminals and batteries capacity.

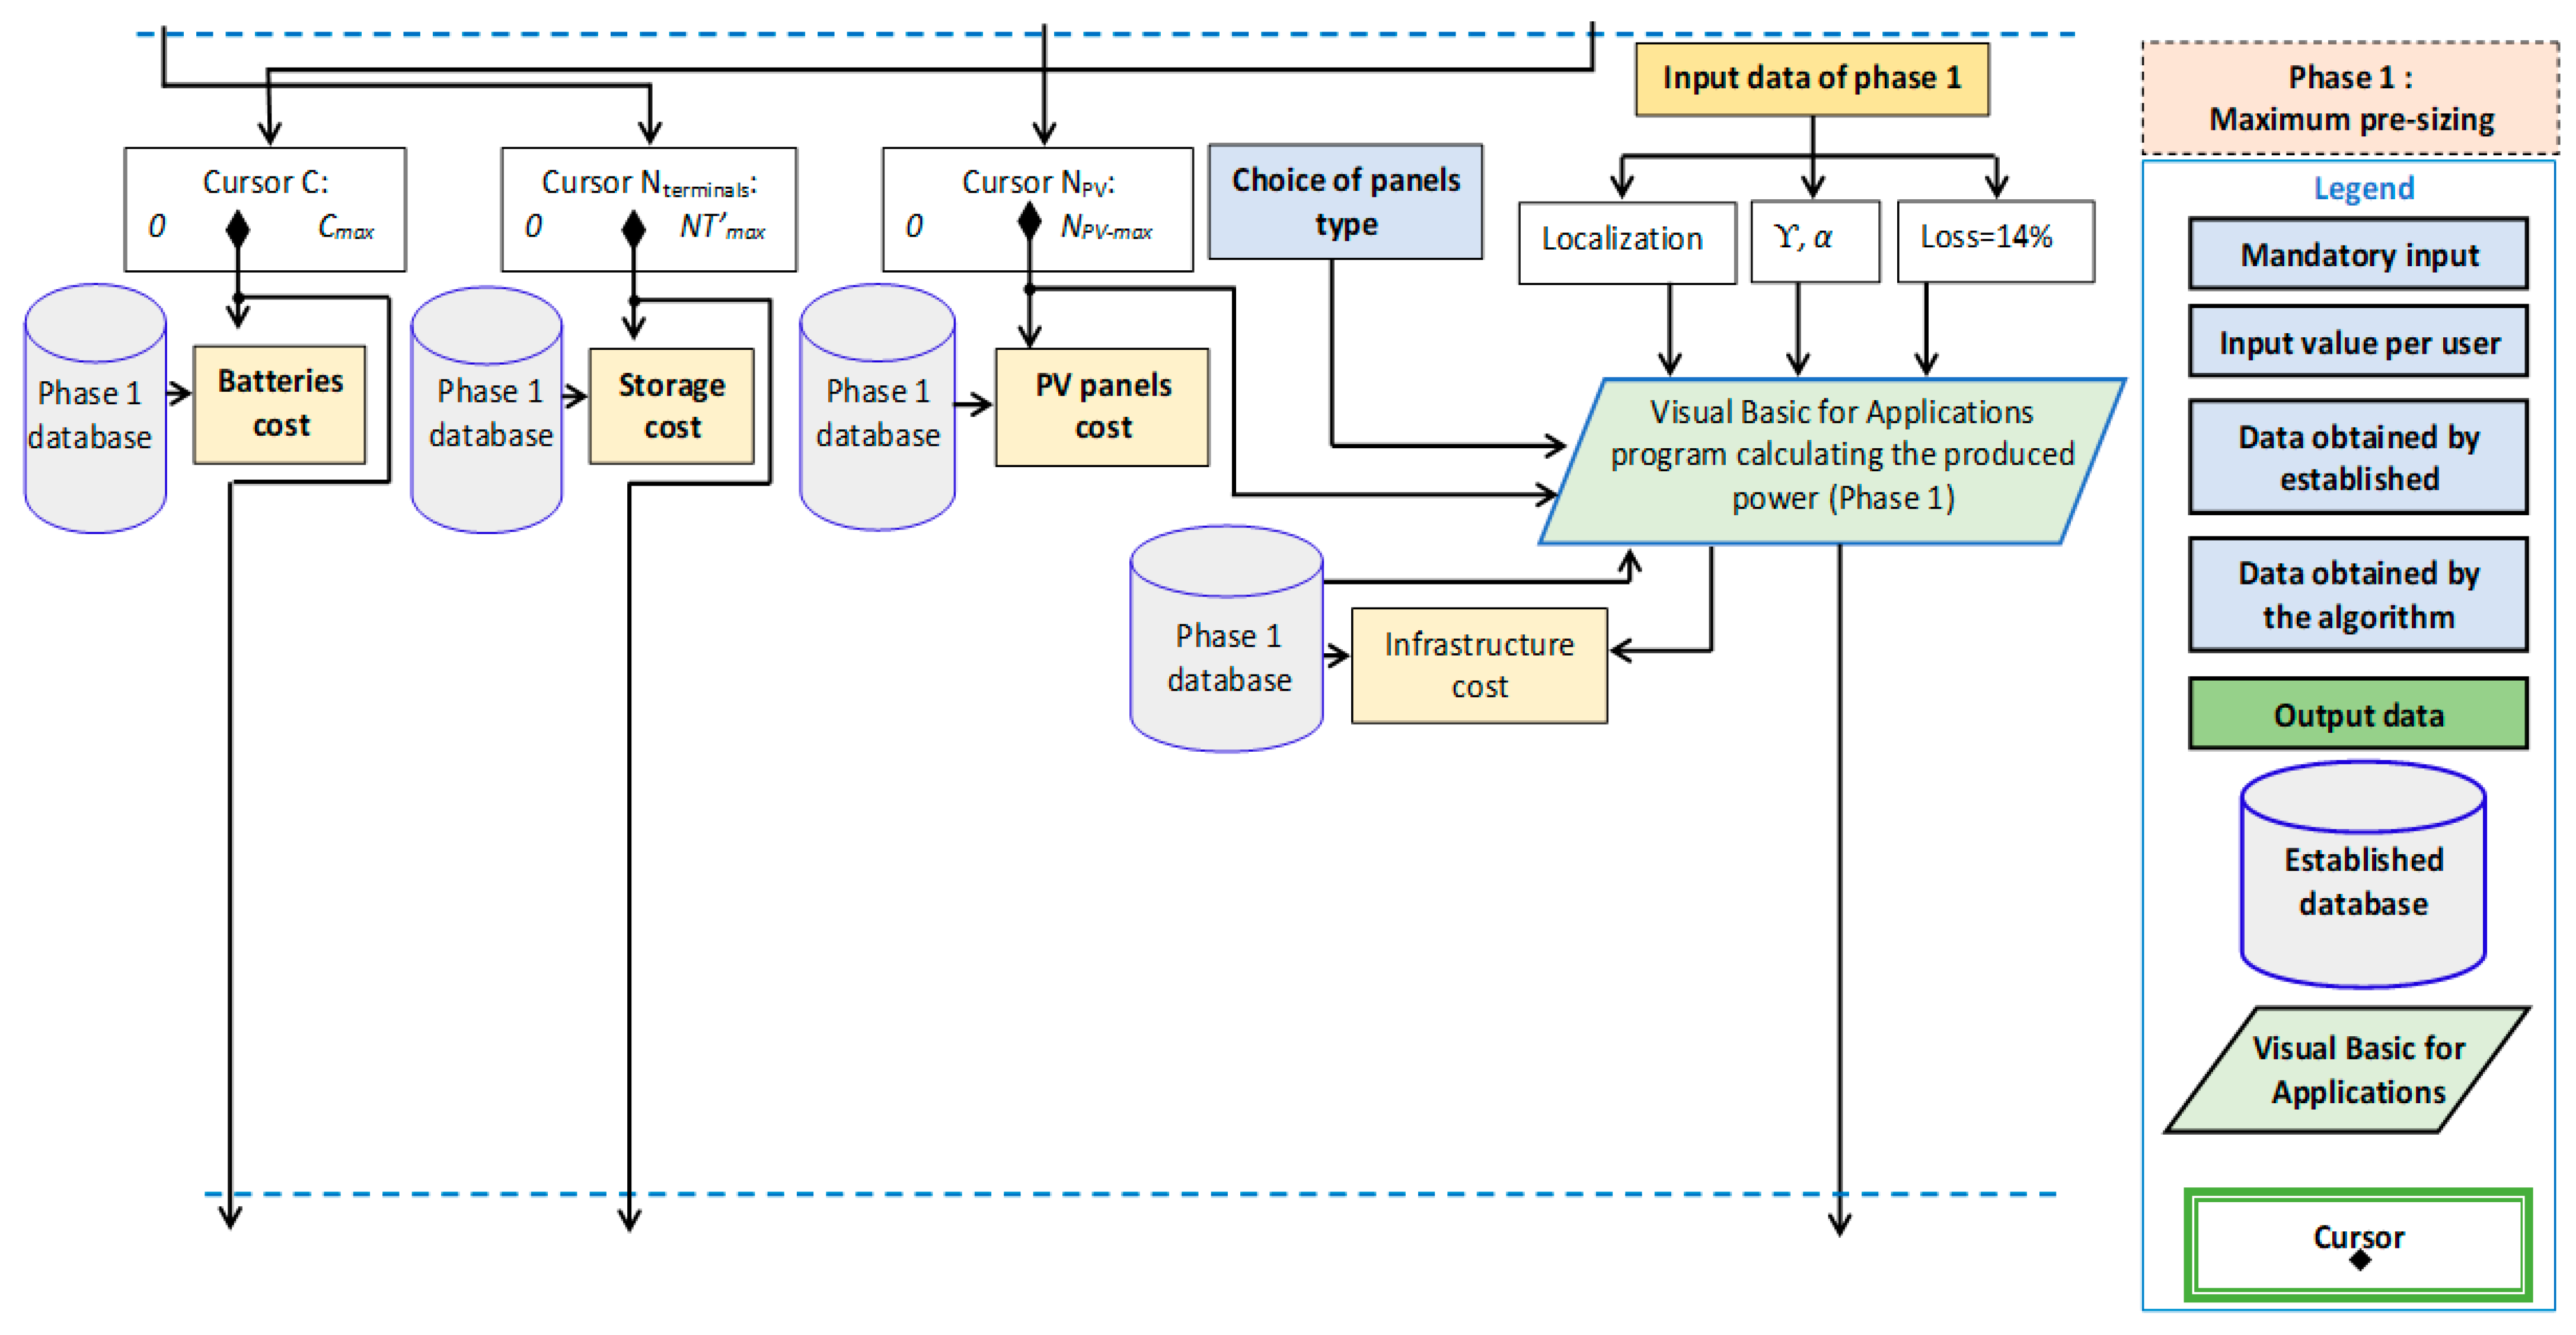
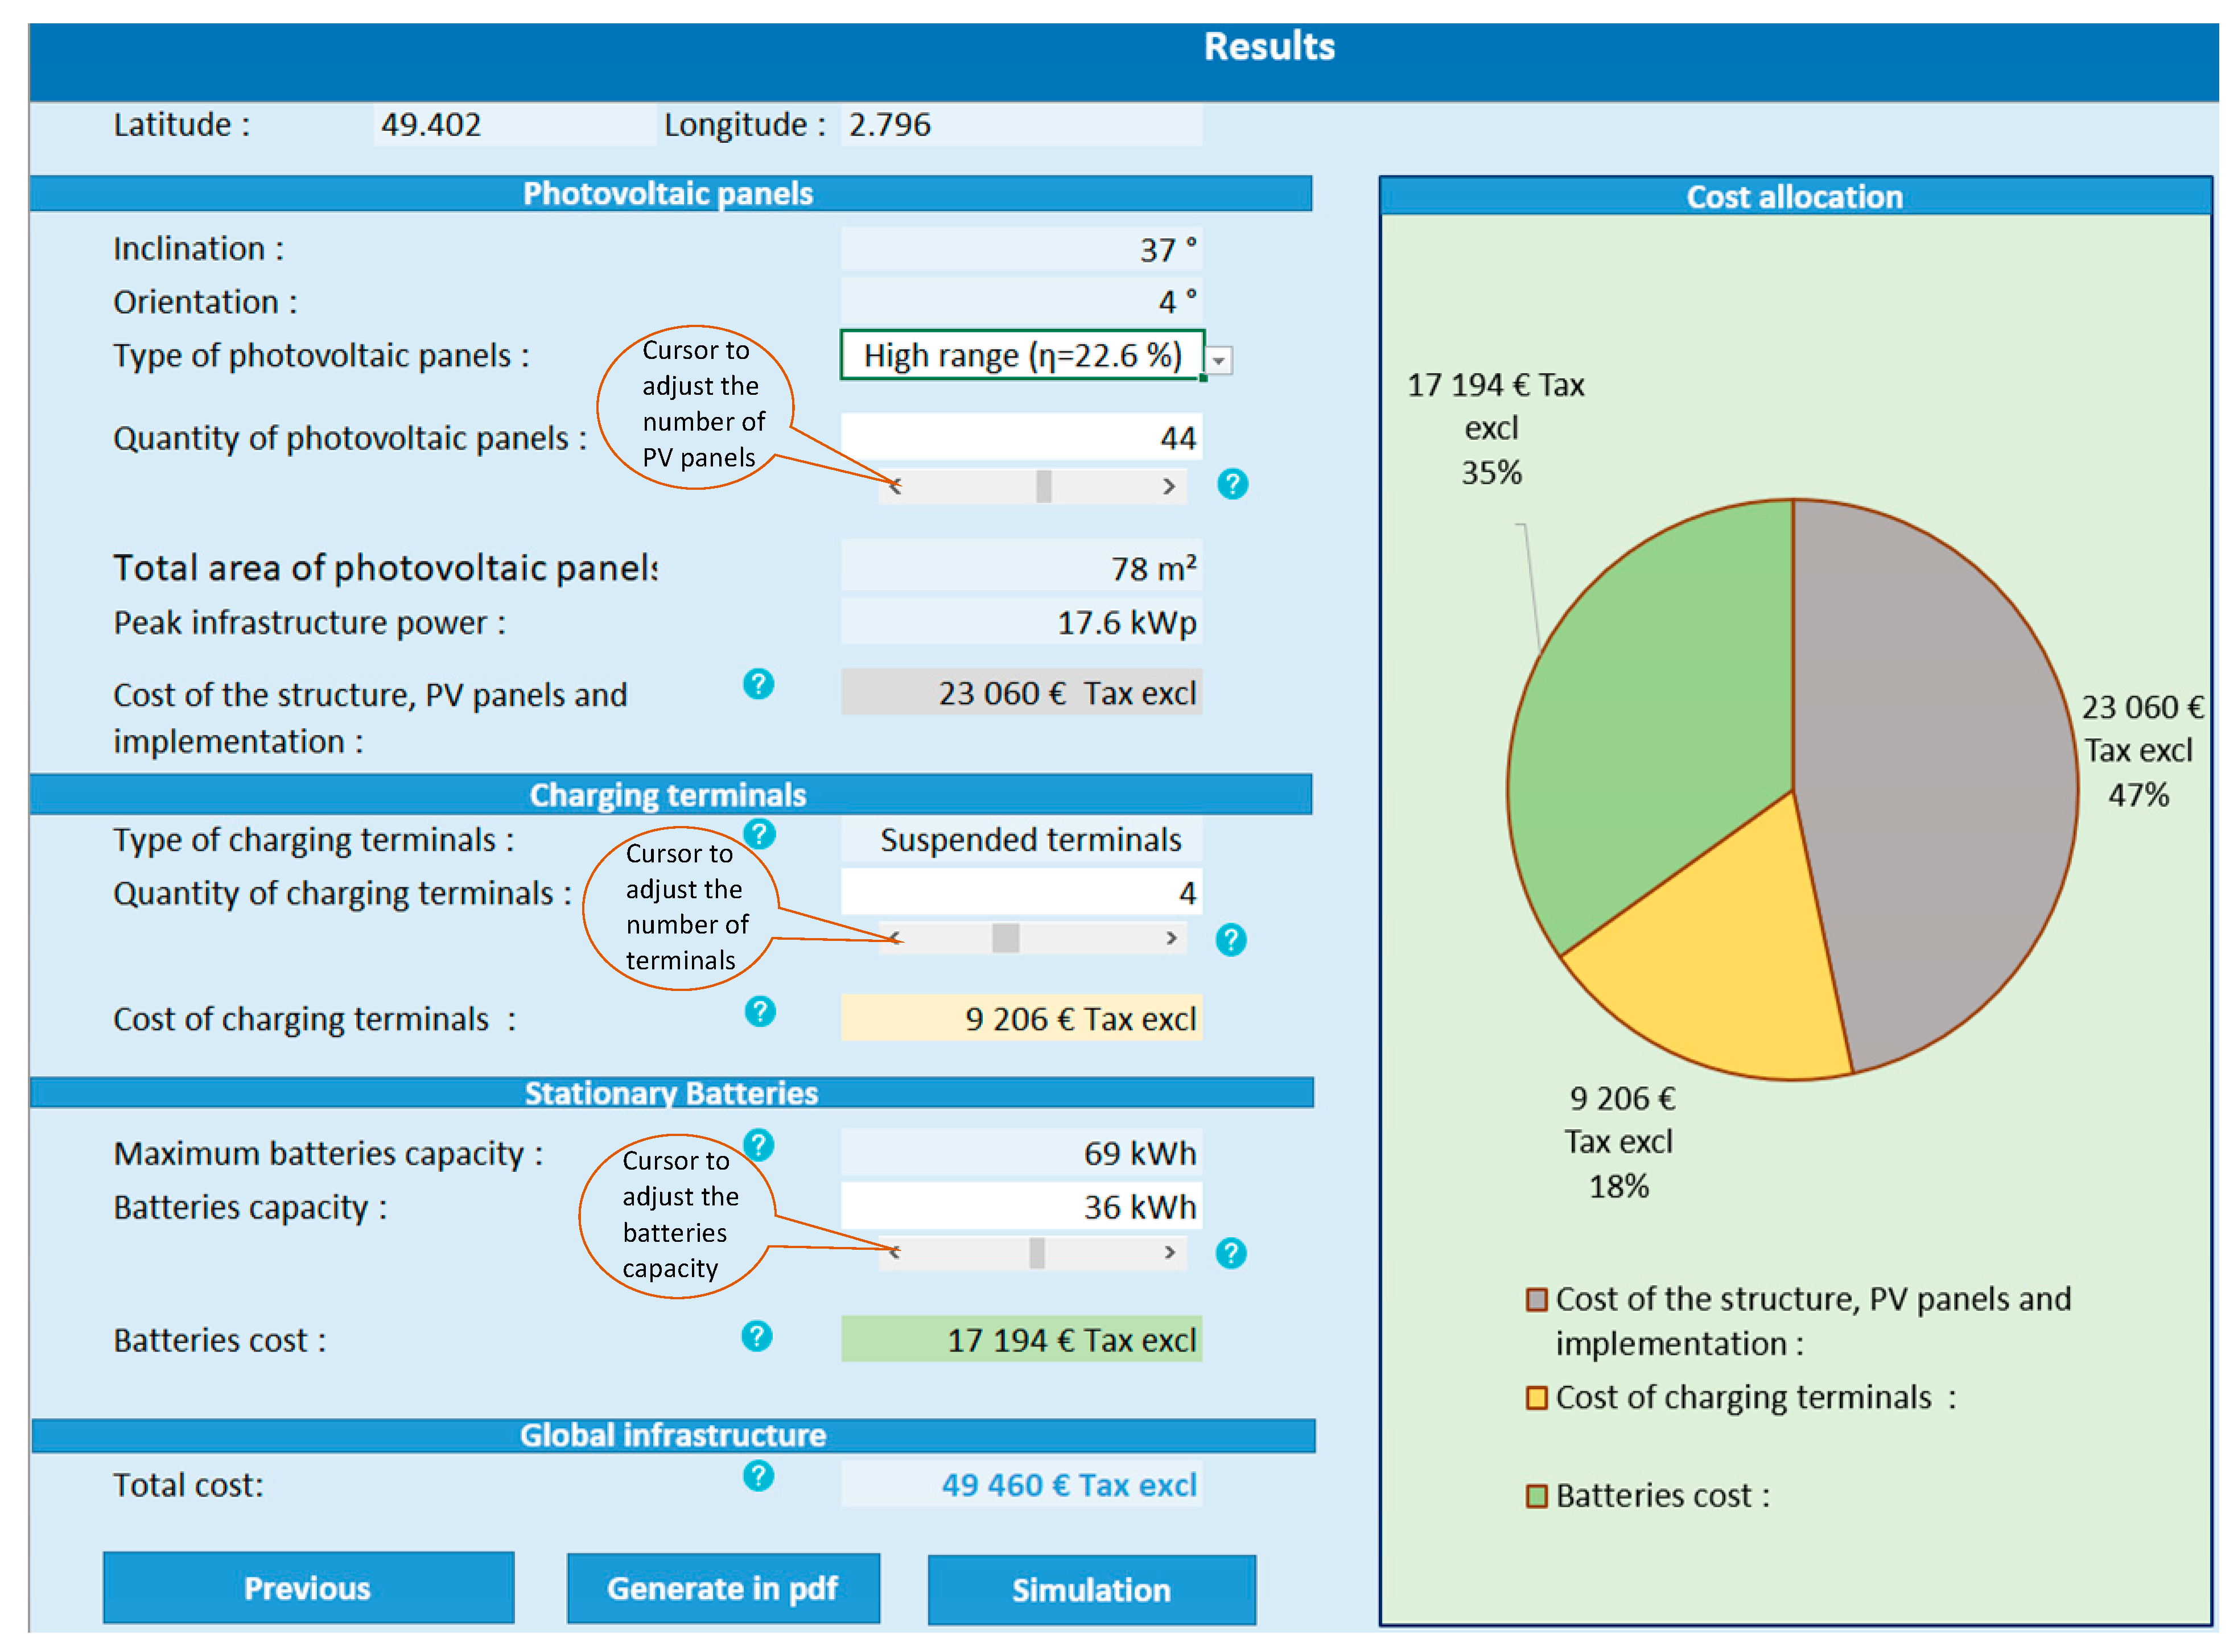
2.2. Phase 2: Price Adjustment

The second phase is for amending the total cost of the PVCS. Figure 4 shows the flow chart of phase 2.
The total cost is adjusted using four parameters:
  • The type of PV panels via the same scrolling menu as in phase 1;
  • The number of PV panels NPV via a cursor varying from 1 to the maximum number of PV panels NPV-max estimated in phase 1;
  • The number of terminals Nterminals via a cursor varying from 1 to the real maximum number of terminals NT′max estimated in phase 1;
  • The stationary batteries capacity C in kWh via a cursor varying from zero to the maximum capacity Cmax estimated in phase 1.
This second phase allows the user to change the parameters influencing the cost. The idea is to give to the user an overview of the possible combinations within a predetermined budget. Figure 5 presents the interface, highlighting the importance of each pole of expenditure (pie chart), where kWp denotes kW at STC.
The interface allows to return to the main page and enter new input data by clicking on “Previous” or to print the current results in PDF format by clicking on “Generate in PDF” or perform a simulation of the energy balance of the infrastructure by clicking on “Simulation” (Figure 5).

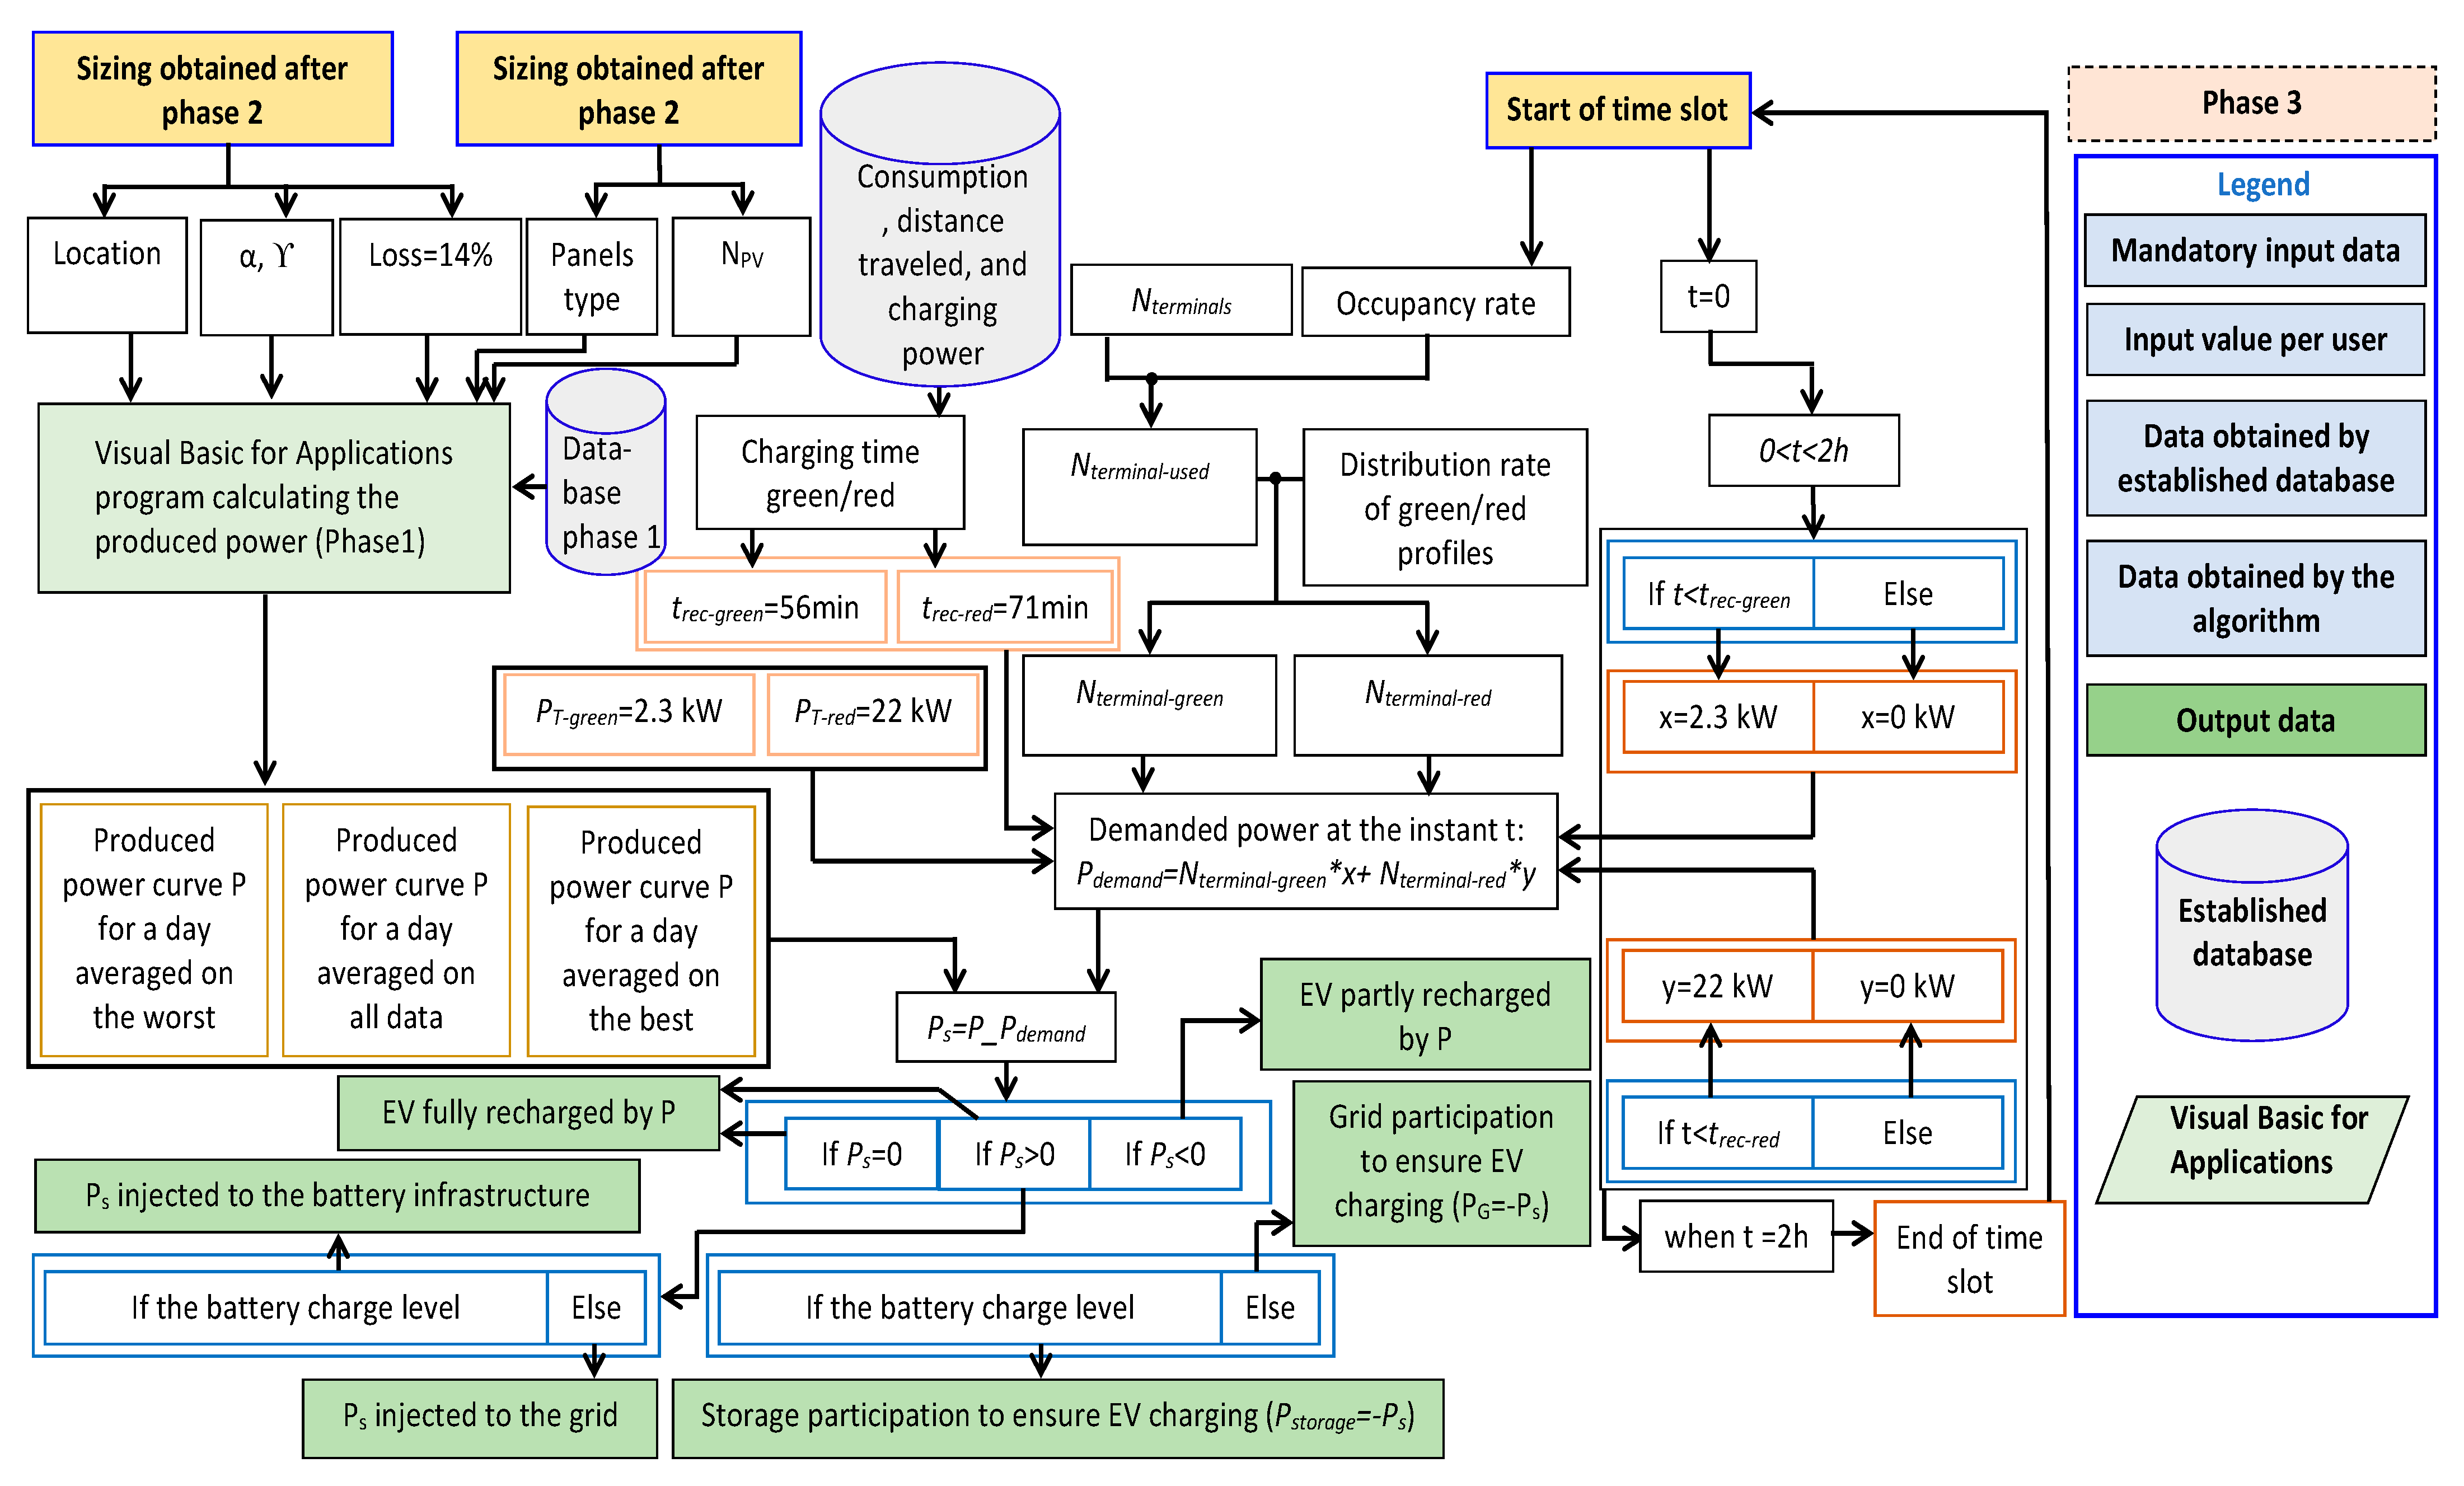
2.3. Phase 3: PVCS Performance Assessment

The phase 3 offers a detailed qualitative analysis of the new user-defined configuration in phase 2. The objective is to assess the performance of the PVCS and then to improve its sizing and operating modes, aiming at increasing the use of PV energy, while minimizing the energy supplied by the power grid. Once the dimensioning of the infrastructure has been chosen, the operating mode simulation makes it possible to evaluate its performance by proposing an energy balance according to different charging scenarios and weather conditions. The simulation algorithm proposes an arbitrary distribution of the number of EVs connected either in fast charging or in slow charging. This distribution is carried out each 2 h, between 6:00 a.m. and 22:00 p.m. To change the scenario, it is possible to choose one of the scenarios from the “Scenario” scrolling menu. The charging table is automatically modified according to the choice. The tool gives the possibility to personalize the charging profile of EVs and consequently improves the contribution of the energy provided by the PV panels for recharging. Figure 6 shows the flow chart of the phase 3.

2.3.1. General Assumptions

Additional working assumptions are formulated for phase 3. Firstly, the PVCS sizing obtained at the end of phase 2 is an input to phase 3, and the solar irradiation data used in phase 1 is also used in this phase.
The storage of the excess produced PV energy is ensured by stationary batteries within its storage capacity limits, which maximum capacity is obtained or chosen at the end of phase 2. The SOC of the stationary batteries, at the start of the day at 8:00 am, is considered to be 50%. It is assumed that the charge and discharge of the stationary storage are equally distributed among all the batteries that compose it.
In addition, in this study, it is considered that users cover a distance of 43 km daily, an average value among EV users according to the U.S. National Household Travel Survey NHTS dataset, as in [26]. The battery capacity of EVs is assumed to be 50 kWh, which corresponds to the average battery capacity of EVs on sale in 2020 [29].
Two user profiles of the PVCS are then defined. The first profile, named green profile, represents a user of the PVCS adopting eco-driving by lowering the vehicle’s consumption and promoting PV benefits, thanks to the daily EV recharging, thus allowing him to do each time small charges. Conversely, a PVCS user with a red profile charges its EV infrequently, which requires more energy for each charge. In addition, the red user does not adopt eco-driving. In addition, for the green profile, the consumption is estimated at 10 kWh per 100 km while for the red profile, it is 15 kWh per 100 km. Two different charging powers are also assumed: the green profile uses the slow charging mode based on 2.3 kW, P T g r e e n , while the red profile uses the fast-charging mode based on 22 kW P T r e d . Table 5 summarizes these two different user profiles.

2.3.2. Preliminary Calculations

For a green profile, the energy required for recharging an EV E r e c g r e e n , which covers only half of the 43 km daily above mentioned, is calculated by Equation (9) while the EV charging time is expressed by Equation (10):
E r e c g r e e n = 10 100 21.5 = 2.15   kWh
t r e c g r e e n = E r e c g r e e n P T g r e e n = 2.15 2.3 = 53   min
As for the red profile, it is considered that the EV is charged every 4 days and covers 43 km per day. Thus, the energy required for recharging an EV for a red profile E r e c r e d is calculated following (11) and the EV charging time is given by (12):
E r e c r e d = 4 15 100 43 = 25.8   kWh
t r e c r e d = E r e c r e d P T r e d = 25.8 22 = 71   min

2.3.3. Charging Scenarios

Four scenarios are studied to assess the share of PV energy in the charge of EVs and to better adapt the operation to increase the share of PV and reduce the energy supplied by the power grid. According to the chosen scenario, the profile distribution rates vary:
  • Virtuous scenario: 100% green user profiles;
  • Critical scenario: 100% red user profiles;
  • Realistic scenario: 30% red user profiles and 70% green user profiles. This scenario is intended to be realistic because the red users are, by definition, less regular users of PVCS;
  • Personalized scenario: this is proposed to give the tool user the possibility to choose the number of terminals used as well as the distribution between the users of the PVCS with green and red profiles. It is only limited by the number of terminals chosen at the end of phase 2.
In addition, for all these scenarios, OR of electric charging terminals are arbitrarily fixed, reflecting the arrivals and departures of users throughout the day. The OR is a percentage of the number of terminals used during a 2-h time slot. If the percentage applied to the number of terminals does not result in an integer value, the value is rounded by default to the next whole number:
  • 8:00 a.m. to 10:00 a.m.: OR = 50%;
  • 10:00 a.m. to 12:00 p.m.: OR = 100%;
  • 12:00 p.m. to 14:00 p.m.: OR = 50%;
  • 14:00 p.m. to 16:00 p.m.: OR = 100%;
  • 16:00 p.m. to 18:00 p.m.: OR = 75%.
These default values can nevertheless be changed manually by the tool user.

2.3.4. Algorithmic Logic

From the OR and the number of terminals N t e r m i n a l s chosen in phase 2, the algorithm is able to calculate the number of terminals used N t e r m i n a l u s e d per 2-hours’ time slot. Then, one of the four possible scenarios is chosen and the algorithm determines the number of fast charging N t e r m i n a l r e d and slow charging N t e r m i n a l g r e e n terminals, and afterwards, calculates the total demanded power P d e m a n d as expressed in Equation (13):
P d e m a n d = N t e r m i n a l r e d P T r e d + N t e r m i n a l g r e e n P T g r e e n
The algorithm then calculates the difference between the power requested by all the used terminals and the power supplied by the PV panels. If this difference P d i f f is greater than or equal to zero, then the EV is recharged only by a power P coming from the PV panels. By contrast, if the power P is less than the difference P d i f f , the excess noted Ps is sent to stationary storage provided that it has not reached a SOC greater than 80%. In case of stationary batteries are fully recharged, the surplus is injected into the power grid. If the difference P d i f f is less than zero, then the EV cannot be fully recharged by the power supplied by the PV panels. To achieve the required charging power, the complement Ps is provided by stationary storage, provided that it has not reached a charge level below 10%. In this specific case, it is the power grid that completes the charge of the EV.
To illustrate the simulation, based on arbitrary inputs data and the PVCS sizing adjusted in phase 2, some results are given in Figure 7. The energy rating is based on the share of energy supplied by the PV panels compared to that supplied by the power grid. With the reduction in the number of EVs in fast charge, PV benefits increase for the EV charging, and the dependency on the public grid is reduced. The simulation presents three predefined scenarios with three predefined hourly occupancy percentage. The realistic scenario is proposed by default (Figure 7a). If one of the scenarios is chosen from the scrolling menu, the table indicating the number and type of terminals occupied per time slot is pre-filled (Figure 7b). Following the choice of scenario, the energy balance comes in three types of days:
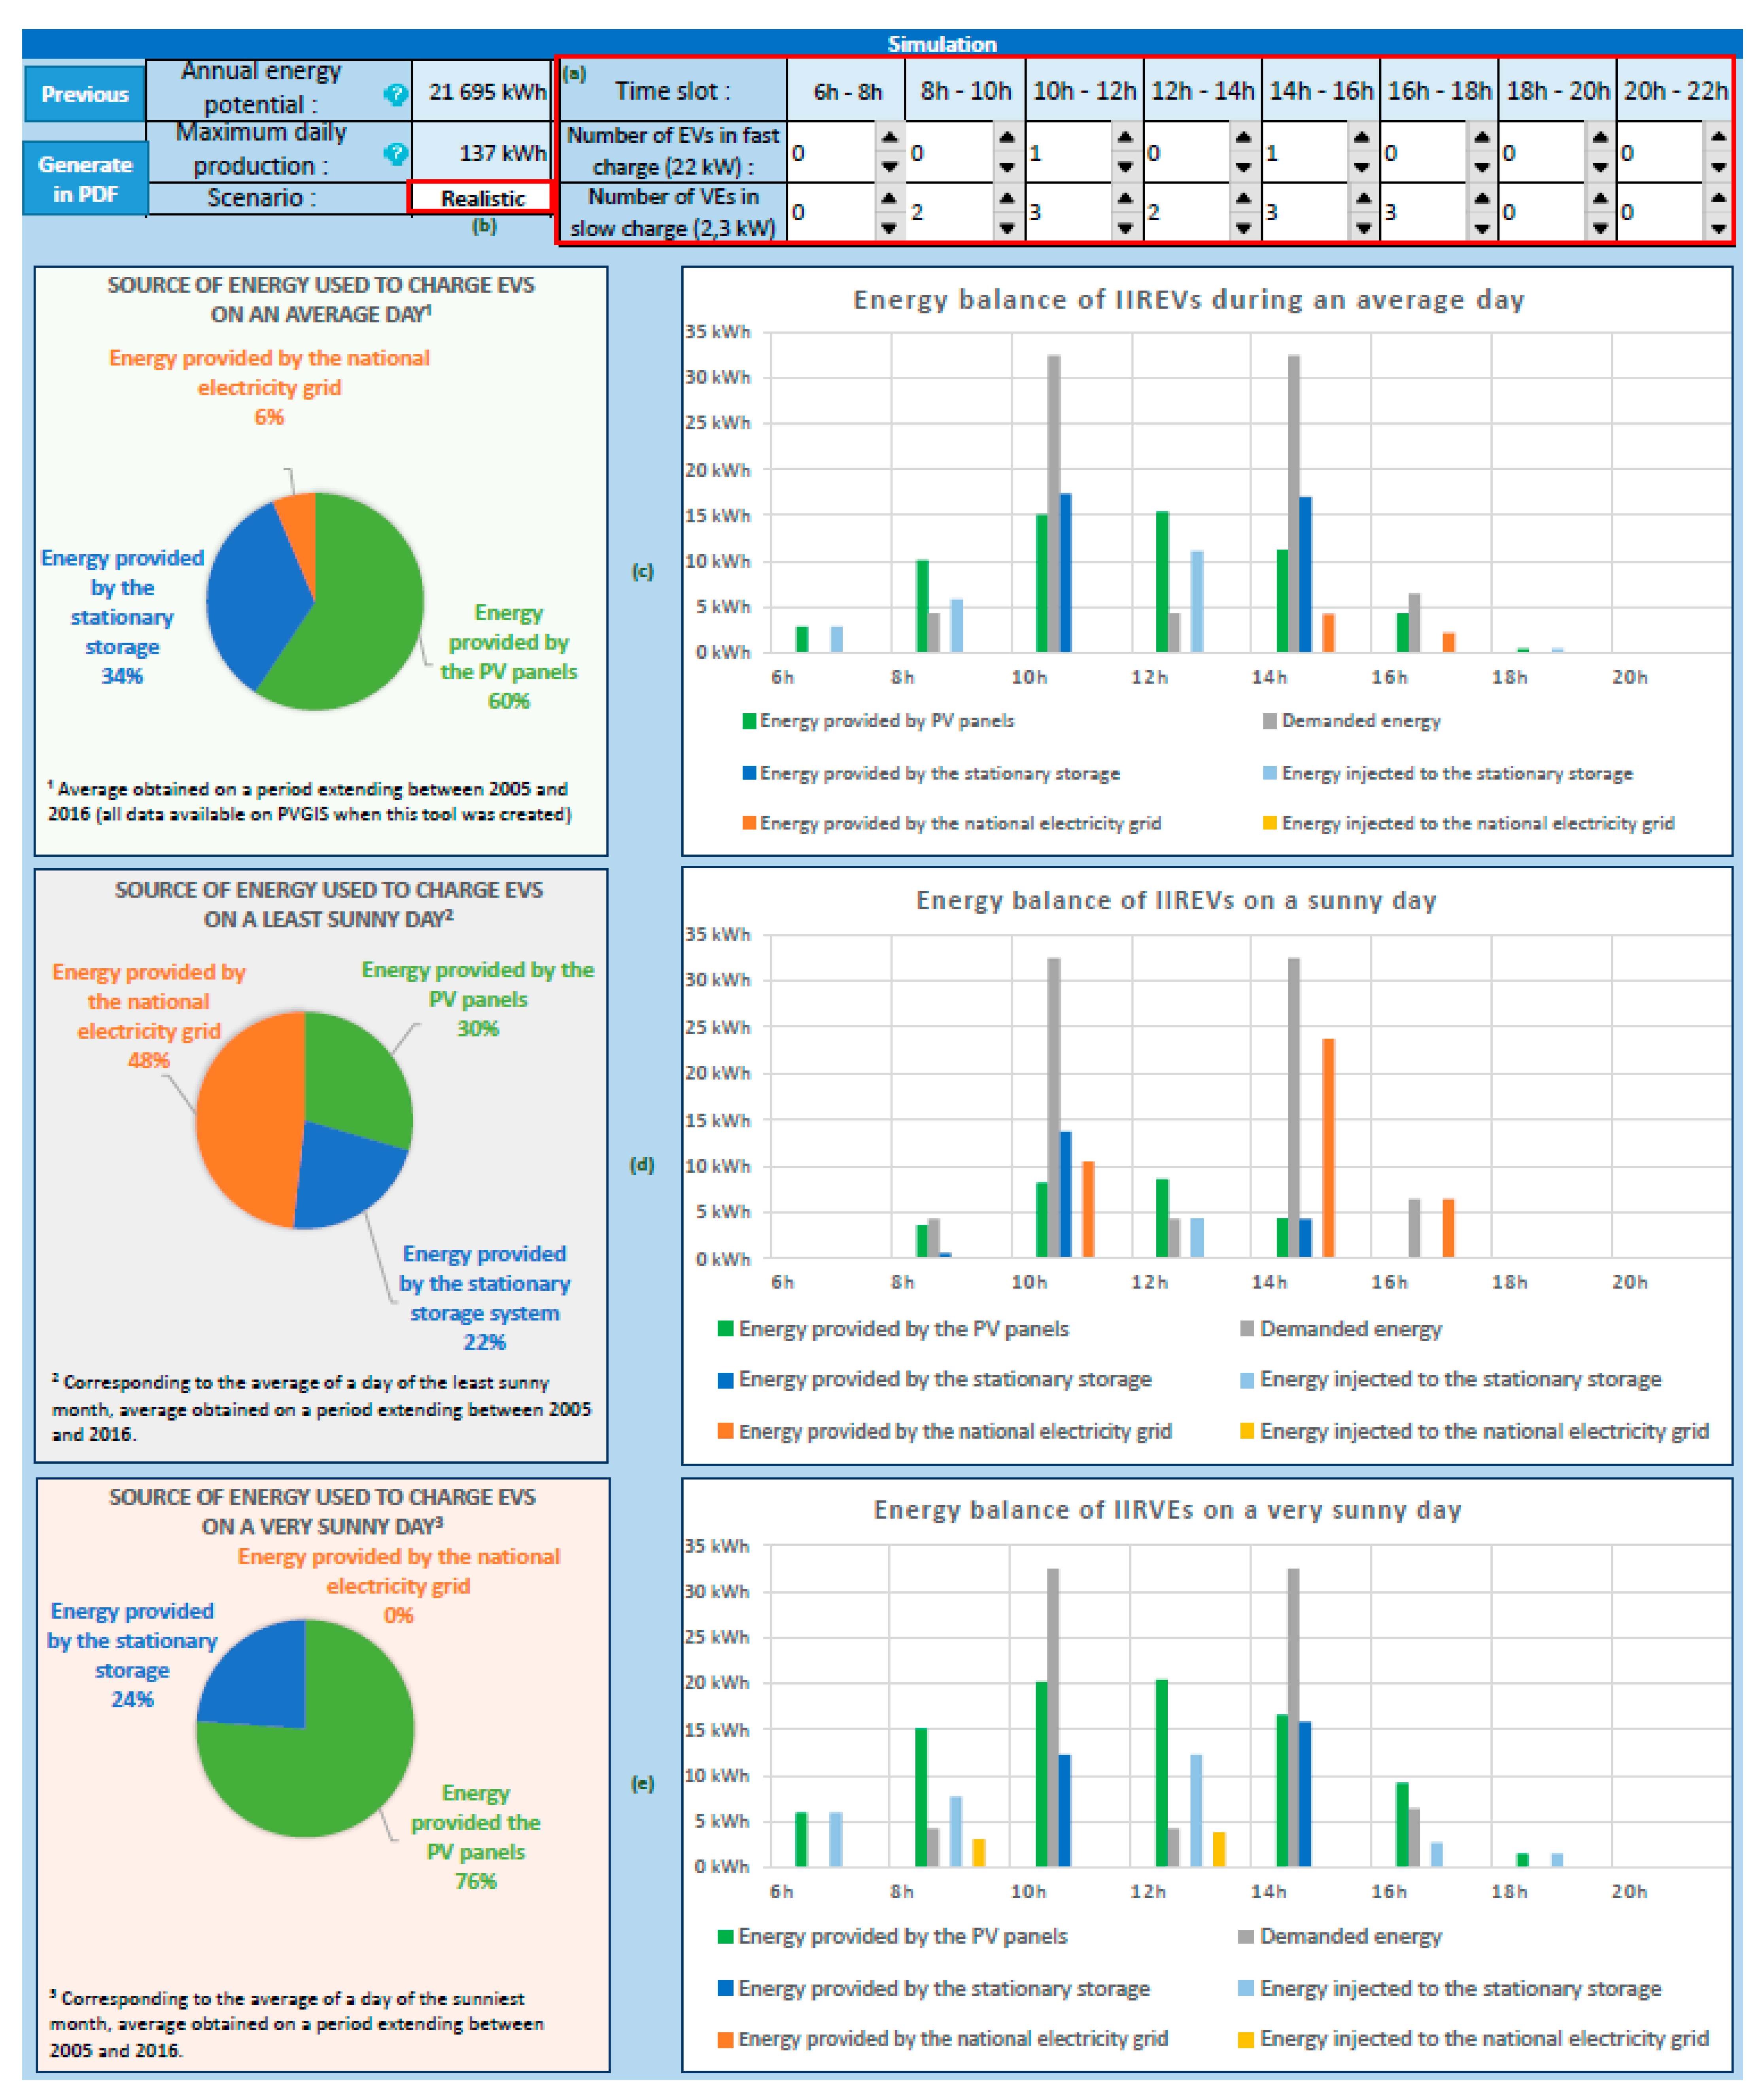
  • An average sunny day, resulting from an average obtained over a period extending between 2005 and 2016 (Figure 7c);
  • A poorly sunny day, corresponding to an average carried out over the least sunny month (Figure 7d);
  • A very sunny day, corresponding to an average carried out over the sunniest month (Figure 7e).
The results are available in two forms:
  • A circular diagram, representing the percentage of each energy source to ensure the recharging of EVs. It makes it possible to account for the distribution of energy from PVCS (energy from PV) and external energy (from power grid);
  • A histogram, allowing a more detailed analysis of the energy distribution per two-hour time slot.
If the scenario is changed, the results are updated automatically.
Figure 7 shows that, obviously, the participation of PV production in EV charging in-creases for the very sunny days than less sunny days. In this support tool, it is the user who chooses the charging mode (slow or fast) that suits him best (parking time, electricity bill, etc.). For slow charging mode, the level of the delivered power is low, which enables PV and stationary storage system to share the requested charging power of the EVs, without the need to the public grid (histogram of Figure 7c during time slot 16 h to 18 h). Whereas, in fast charging mode, the level of the delivered power is high. Therefore, EVs are charged mainly with the public grid and small portion with PV, because the stationary storage system will reach rapidly its minimum limit, and PV production is not sufficient for charging (histogram of Figure 7c during time slot 14 h to 16 h).
In conclusion, the slow charging mode improves the PV benefits, where EVs are charged mainly with PV energy. In addition, this charging mode can not only improve PV benefits but reduce the impact on the electricity distribution network, and the user can charge EVs with the lowest cost.
This study does not include optimization elements such as analysis of the maximization of the number of EVs charging stations at the expense of the power available for individual EV or minimizing the charging time so that as many EVs as possible can be charged in one day. The work presented in this article was carried out following [17] results where some optimization elements are introduced. Nevertheless, further investigations will be necessary.

3. Conclusions

This study aims to improve the management of energy within the growth of PV benefits, to which contributes the development of a technical-economic tool intended for the local stakeholders, giving them the main characteristics necessary for the installation of a PVCS. The development of such methodology was translated by an algorithm, resulting, phase by phase, in the constitution of the techno-economic tool, which was coded on an easy-to-use interface.
Through the results, concerning the implementation of a PVCS, the proposed methodology allows the tool to fulfill its function of supporting local stakeholders and authorities, by facilitating the decision-making on the deployment of PV-powered charging stations. Indeed, the user of the tool, by entering an easily accessible dataset, obtains the pre-sizing of the infrastructure, a budget associated with this sizing that can be adjusted and finally a qualitative evaluation simulating the ecological character of its infrastructure thus dimensioned. To sum up, due to the tool’s manageability and simplicity compared to alternative calculation software, the tool is adjusted to be suitable for a wide spectrum of target groups, including experts and non-experts.
The charging mode can influence the PV benefits, and the EVs can depend more/less on PV and on public grid. With slow charging mode, the EVs can be charged mainly with PV energy and stationary storage system. Whereas, in fast charging mode, EVs can be charged mainly with the public grid. The fast-charging mode can not only reduce PV benefits but also have an impact on the power grid and increase the electricity bills.
If in its current state, the tool considers only EVs charging, however, it could subsequently integrate the charging of other kind of EVs. Additionally, future studies will concentrate on improving the tool by integrating other parameters such as CO2 emissions and the total levelized cost of energy, which integrates lifespan cost of the PV installation, replacement cost of the stationary storage system during the project lifetime, maintenance cost of the PV system and the storage system, as well as the annual degradation of the PV production. In addition, optimization elements, such as maximizing the number of EV charging stations, minimizing charging time or even EVs’ rotation in order to take full advantage of PVCS, have to be considered in further research work. Furthermore, the forecast of PV production must be conducted for the optimization of sizing and management of PVCS. The purpose of PV forecasting is to respect the production program and therefore reduce the total levelized cost of energy.

Author Contributions

Conceptualization, Y.K., M.S. and F.L.; methodology, Y.K., M.S. and F.L.; software, Y.K., M.S. and F.L.; validation, Y.K., M.S. and F.L.; formal analysis, Y.K., M.S. and F.L.; investigation, Y.K., M.S. and F.L.; resources, Y.K., M.S. and F.L.; data curation, Y.K., M.S. and F.L.; writing—original draft preparation, Y.K.; writing—review and editing, M.S. and F.L.; visualization, Y.K., M.S. and F.L.; supervision, M.S.; project administration, M.S.; funding acquisition, M.S. All authors have read and agreed to the published version of the manuscript.

Funding

This research was funded by ADEME France, project PV2E_Mobility, grant number #1905C0043.

Institutional Review Board Statement

Not applicable.

Informed Consent Statement

Not applicable.

Data Availability Statement

Not applicable.

Acknowledgments

The authors thank engineering students of Urban Engineering Department of Université de Technologie de Compiègne for the technical support and the provided case study data.

Conflicts of Interest

The authors declare no conflict of interest.

Abbreviations

AGMAbsorbed glass mat
EVElectric Vehicle
HOMERHybrid Optimization Model for Multiple Energy Resources
OROccupancy Rates
PVPhotovoltaic
PVCSPV-powered Charging Stations
PVGISPhotovoltaic Geographical Information System
SOCState of Charge
STCStandard Test Conditions
Parameters
A Available area
A p Conventional surface of a parking spot
A p v Area of one PV panel
A P V Area of all PV panels
α PV panels inclination
C max Maximum capacity of stationary storage (batteries)
C Stationary storage capacity (batteries)
E B e s t d a y Total energy produced during the best sunny day
E g r e e n d a y Energy required for charging an EV with the green profile
E r e c r e d Energy required for charging an EV with the red profile
G Solar irradiation
G Corrected solar irradiation
N p Number of parking spots
N P V m a x Maximum number of PV panels
N P V Number of PV panels
N t e r m i n a l g r e e n Number of terminals used per 2-hours’ time slot
N t e r m i n a l r e d Number of fast charging terminals
N t e r m i n a l u s e d Number of slow charging terminals
N T m a x Theoretical maximum number of charging terminals
N T m a x Real maximum number of charging terminals
N t e r m i n a l s Number of terminals
η PV conversion efficiency
ϒ PV panels orientation
P PV power of panels
P d e m a n d   Total demanded power
P d i f f   Difference between the power requested by all the used terminals and the power supplied by the PV panels
P G   Available maximum public grid power
P p   Total peak power of PVCS
P S T C   PV panel power at standard test conditions
P s   Power exchanged with storage system or power grid
P T Maximum power delivered by each terminal
P T g r e e n Maximum power of the slow charge
P T r e d Maximum power of the fast charge
t r e c g r e e n EV charging time for the green profile
t r e c r e d EV charging time for the red profile

References

  1. International Energy Agency; International REA; United Nations Statistics Division; World Health Organization. Tracking SDG 7: The Energy Progress Report 2019; The World Bank Group: Washington, DC, USA, 2019; pp. 1–176. [Google Scholar]
  2. Orhan, E.; Celal, H.C.; Çetin, B.G. Sizing of a solar-wind hybrid electric vehicle charging station by using HOMER software. J. Clean. Prod. 2021, 279, 123615. [Google Scholar]
  3. Santos, G.; Davies, H. Incentives for quick penetration of electric vehicles in five European countries: Perceptions from experts and stakeholders. Transp. Res. Part A Policy Pract. 2020, 137, 326–342. [Google Scholar] [CrossRef]
  4. Regulation (EU). 2018/1999 of the European Parliament and of the Council on the Governance of the Energy Union and Climate Action. 11 December 2018. Available online: https://www.europeansources.info/record/regulation-eu-2018-1999-on-the-governance-of-the-energy-union-and-climate-action/ (accessed on 9 April 2021).
  5. Regulation (EU). 2019/631 of the European Parliament and of the Council of Setting CO2 Emission Performance Standards for New Passenger Cars and For New Light Commercial Vehicles. 17 April 2019. Available online: https://www.europeansources.info/record/regulation-eu-2019-631-setting-co2-emission-performance-standards-for-new-passenger-cars-and-for-new-light-commercial-vehicles/ (accessed on 9 April 2021).
  6. Heitel, S.; Seddig, K.; Vilchez, J.J.G.; Jochem, P. Global electric car market deployment considering endogenous battery price development. In Technological Learning in the Transition to a Low-Carbon Energy System; Academic Press: Cambridge, MA, USA, 2020; pp. 281–305. [Google Scholar]
  7. Xu, R.; Zhu, Q.; Xu, Z.; Feng, Y.; Wei, X. PLZST antiferroelectric ceramics with promising energy storage and discharge performance for high power applications. J. Am. Ceram. Soc. 2020, 103, 1831–1838. [Google Scholar] [CrossRef]
  8. Oliver, D.; Tobias, B.; Dirk, N. Combining analytics and simulation methods to assess the impact of shared, autonomous electric vehicles on sustainable urban mobility. Inf. Manag. 2020, 103285. [Google Scholar] [CrossRef]
  9. Fedele, R. Smart Road Infrastructures Through Vibro-Acoustic Signature Analyses. New Metropolitan Perspectives. NMP 2020. Smart Innov. Syst. Technol. 2021, 178, 1481–1490. [Google Scholar] [CrossRef]
  10. Salvatore, T.; Alessandro, S.; Salvatore, C.; Fabio, A.; Giovanni, P. Smart Roads: An Overview of What Future Mobility Will Look Like. Infrastructures 2020, 5, 107. [Google Scholar] [CrossRef]
  11. Global EV Outlook 2020–Analysis. Available online: https://www.iea.org/reports/global-ev-outlook-2020 (accessed on 30 October 2020).
  12. Wang, D.; Sechilariu, M.; Locment, F. PV-Powered Charging Station for Electric Vehicles: Power Management with Integrated V2G. Appl. Sci. 2020, 10, 6500. [Google Scholar] [CrossRef]
  13. Zhou, J.; Wu, Y.; Wu, C.; He, F.; Zhang, B.; Liu, F. A geographical information system based multi-criteria decision-making approach for location analysis and evaluation of urban photovoltaic charging station: A case study in Beijing. Energy Convers. Manag. 2020, 205, 112340. [Google Scholar] [CrossRef]
  14. Tulpule, P.J.; Marano, V.; Yurkovich, S.; Rizzoni, G. Economic and environmental impacts of a PV powered workplace parking garage charging station. Appl. Energy 2013, 108, 323–332. [Google Scholar] [CrossRef]
  15. Han, X.; Liang, Y.; Ai, Y.; Li, J. Economic evaluation of a PV combined energy storage charging station based on cost estimation of second-use batteries. Energy 2018, 165, 326–339. [Google Scholar] [CrossRef]
  16. Mouli, G.R.C.; Bauer, P. Optimal System Design for a Solar Powered EV Charging Station. In Proceedings of the IEEE Transportation Electrification Conference and Expo (ITEC), Long Beach, CA, USA, 13–15 June 2018. [Google Scholar] [CrossRef] [Green Version]
  17. Cheikh-Mohamad, S.; Sechilariu, M.; Locment, F.; Krim, Y. PV-Powered Electric Vehicle Charging Stations: Preliminary Requirements and Feasibility conditions. Appl. Sci. 2021, 11, 1770. [Google Scholar] [CrossRef]
  18. Alonzo, S.; Cihan, G.; Karst, G.; Angèle, R. Technical, Financial, and Environmental Feasibility Analysis of Photovoltaic EV Charging Stations With Energy Storage in China and the United States. IEEE J. Photovolt. 2020, 10, 1892–1899. [Google Scholar]
  19. Hao, Y.; Dong, L.; Liang, J.; Liao, X.; Wang, L.; Shi, L. Power forecasting-based coordination dispatch of PV power generation and electric vehicles charging in microgrid. Renew. Energy 2020, 155, 1191–1210. [Google Scholar] [CrossRef]
  20. Lee, S.; Iyengar, S.; Irwin, D.; Shenoy, P. Shared solar-powered EV charging stations: Feasibility and benefits. In Proceedings of the 2016 Seventh International Green and Sustainable Computing Conference (IGSC), Hangzhou, China, 7–9 November 2016; pp. 1–8. [Google Scholar]
  21. Simon, S.; José, B. Development of an Efficient Tool for Solar Charging Station Management for Electric Vehicles. Energies 2020, 13, 2979. [Google Scholar]
  22. Minh, P.V.; Le Quang, S.; Pham, M.-H. Technical Economic Analysis of Photovoltaic-Powered Electric Vehicle Charging Stations under Different Solar Irradiation Conditions in Vietnam. Sustainability 2021, 13, 3528. [Google Scholar] [CrossRef]
  23. Luis, S.; Azuara, G.; Imene, Y.; Santiago, A.G. Energetic, economic and environmental viability of off-grid PV-BESS for charging electric vehicles: Case study of Spain. Sustain. Cities Soc. 2018, 37, 519–529. [Google Scholar]
  24. Alyona, I.; David, C.; Jose, A.; Curran, C.; Ned, D. Techno-economic feasibility of a photovoltaicequipped plug-in electric vehicle public parking lot with coordinated charging. IET Energy Syst. Integr. 2020, 2, 261–272. [Google Scholar]
  25. Kobashi, T.; Say, K.; Wang, J.; Yarime, M.; Wang, D.; Yoshida, T.; Yamagata, Y. Techno-economic assessment of photovoltaics plus electric vehicles towards household-sector decarbonization in Kyoto and Shenzhen by the year 2030. J. Clean. Prod. 2020, 253, 119933. [Google Scholar] [CrossRef]
  26. Zhang, J.; Yan, J.; Liu, Y.; Zhang, H.; Lv, G. Daily electric vehicle charging load profiles considering demographics of vehicle users. Appl. Energy 2020, 274, 115063. [Google Scholar] [CrossRef]
  27. PVGIS Software. Available online: https://ec.europa.eu/jrc/en/pvgis (accessed on 9 April 2021).
  28. Sechilariu, M.; Molines, N.; Richard, G.; Martell-Flores, H.; Locment, F.; Baert, J. Electromobility Framework 592 Study: Infrastructure and Urban Planning for EV Charging Station Empowered by PV-based Microgrid. IET Electr. Syst. Transp. 2019, 9, 176–185. [Google Scholar] [CrossRef]
  29. Ghotge, R.; Snow, Y.; Farahani, S.; Lukszo, Z.; Wijk, A.V. Optimized Scheduling of EV Charging in Solar Parking Lots for Local Peak Reduction under EV Demand Uncertainty. Energies 2020, 13, 1275. [Google Scholar] [CrossRef] [Green Version]
Figure 1. Flow chart of phase 1.
Applsci 11 04127 g001
Figure 2. Interface for input data entry (numerical values for the maximum sizing).
Applsci 11 04127 g002
Figure 3. Interface for the maximum sizing in the first phase.
Applsci 11 04127 g003
Figure 4. Flow chart of phase 2.
Applsci 11 04127 g004
Figure 5. Interface for adjustment of the total PVCS cost.
Applsci 11 04127 g005
Figure 6. Flow chart of phase 3.
Applsci 11 04127 g006
Figure 7. Interface for PVCS energy: realistic scenario (a), number and type of terminals occupied per time slot (b), results for average sunny day (c), results for poorly sunny day (d), and results for very sunny day (e).
Applsci 11 04127 g007
Table 1. Correction factor of the solar irradiation [27].
Inclination α30°60°90°
Orientation Υ
East0.930.900.780.55
South-East0.930.960.880.66
South0.931.000.910.68
South-West0.930.960.880.66
West0.930.900.780.55
Table 2. Infrastructure costs excluding tax for PV panels installed on the roof of houses/buildings.
Peak Power RangeCost Range
<3 kW at STC2.2 to 2.5 €/W at STC
3 to 9 kW at STC1.8 to 2.2 €/W at STC
9 to 36 kW at STC1.2 to 1.8 €/W at STC
36 to 100 kW at STC1 to 1.2 €/W at STC
100 to 500 kW at STC0.9 to 1 €/W at STC
>500 kW at STC< 0.85 €/W at STC
Table 3. Infrastructure costs excluding tax for PV panels installed on the car parking shade.
Peak Power RangeCost Range
<100 kW at STC1.2 to 1.4 €/W at STC
100 to 500 kW at STC1.05 to 1.2 €/W at STC
>500 kW at STC0.95 to 1.05 €/W at STC
Table 4. Batteries cost in €/kWh depending on the type of battery.
Battery TypeCost Range
High-range lithium batteries (e.g., LG chem,
Tesla Powerwall 13, Mercedez Benz)
500 to 1200 €/kWh
Absorbed glass mat (AGM) solar batteries200 to 250 €/kWh
Gel solar batteries200 to 300 €/kWh
Lead-acid solar batteries100 to 300 €/kWh
Table 5. User profiles of the PVCS.
ProfileDrive ModeCharging TypeMaximum Charging PowerEstimated Consumption
GreenEco-driveSlow charging2.3 kW10 kWh/100 km
RedNormal driveFast charging22 kW15 kWh/100 km
Publisher’s Note: MDPI stays neutral with regard to jurisdictional claims in published maps and institutional affiliations.

