Article

Comparison of Economic Performance of Lead-Acid and Li-Ion Batteries in Standalone Photovoltaic Energy Systems

by
Javier Carroquino
1,2,*,
Cristina Escriche-Martínez
1,
Luis Valiño
3 and
Rodolfo Dufo-López
4
1
Intergia Energía Sostenible S.L., María de Luna 11, Nave 19, 50018 Zaragoza, Spain
2
Universidad San Jorge, Villanueva de Gállego, 50830 Zaragoza, Spain
3
LIFTEC, CSIC-Universidad de Zaragoza, María de Luna 10, 50018 Zaragoza, Spain
4
Departamento de Ingeniería Eléctrica, Universidad de Zaragoza, C/María de Luna 3, 50018 Zaragoza, Spain
*
Author to whom correspondence should be addressed.
Appl. Sci. 2021, 11(8), 3587; https://doi.org/10.3390/app11083587
Submission received: 31 March 2021 / Revised: 12 April 2021 / Accepted: 14 April 2021 / Published: 16 April 2021
(This article belongs to the Special Issue Standalone Renewable Energy System—Modeling and Controlling - Ⅱ)

Abstract

:

Featured Application

This work addresses the choice of the economically optimal type of battery (lead-acid or Li-ion) to be used in photovoltaic or hybrid standalone energy systems. Factors that encourage one or the other type of battery are identified.

Abstract

Standalone renewable energy systems usually incorporate batteries to get a steady energy supply. Currently, Li-ion batteries are gradually displacing lead-acid ones. In practice, the choice is made without previous comparison of its profitability in each case. This work compares the economic performance of both types of battery, in five real case studies with different demand profiles. For each case, two sets of simulations are carried out. In one of the sets, the energy demand is supplied by a standalone photovoltaic system and, in the other one, by a standalone hybrid photovoltaic-diesel system. Through optimization processes, the economic optimum solutions are obtained. In addition, sensitivity analyses on various parameters have been carried out, seeking the influence in favor of one or another type of battery. The results show that if the type of battery is changed, to achieve the economic optimum the entire system must be resized. In some cases, the economic optimum is reached with Li-ion and in others with lead-acid batteries, depending on the demand profiles. Thus, both types of batteries can be profitable options in standalone energy systems, with a greater tendency to lead-acid in fully photovoltaic systems and to Li-ion in hybrids. The price reductions that would make Li-ion the only choice is quantified.

Graphical Abstract

1. Introduction

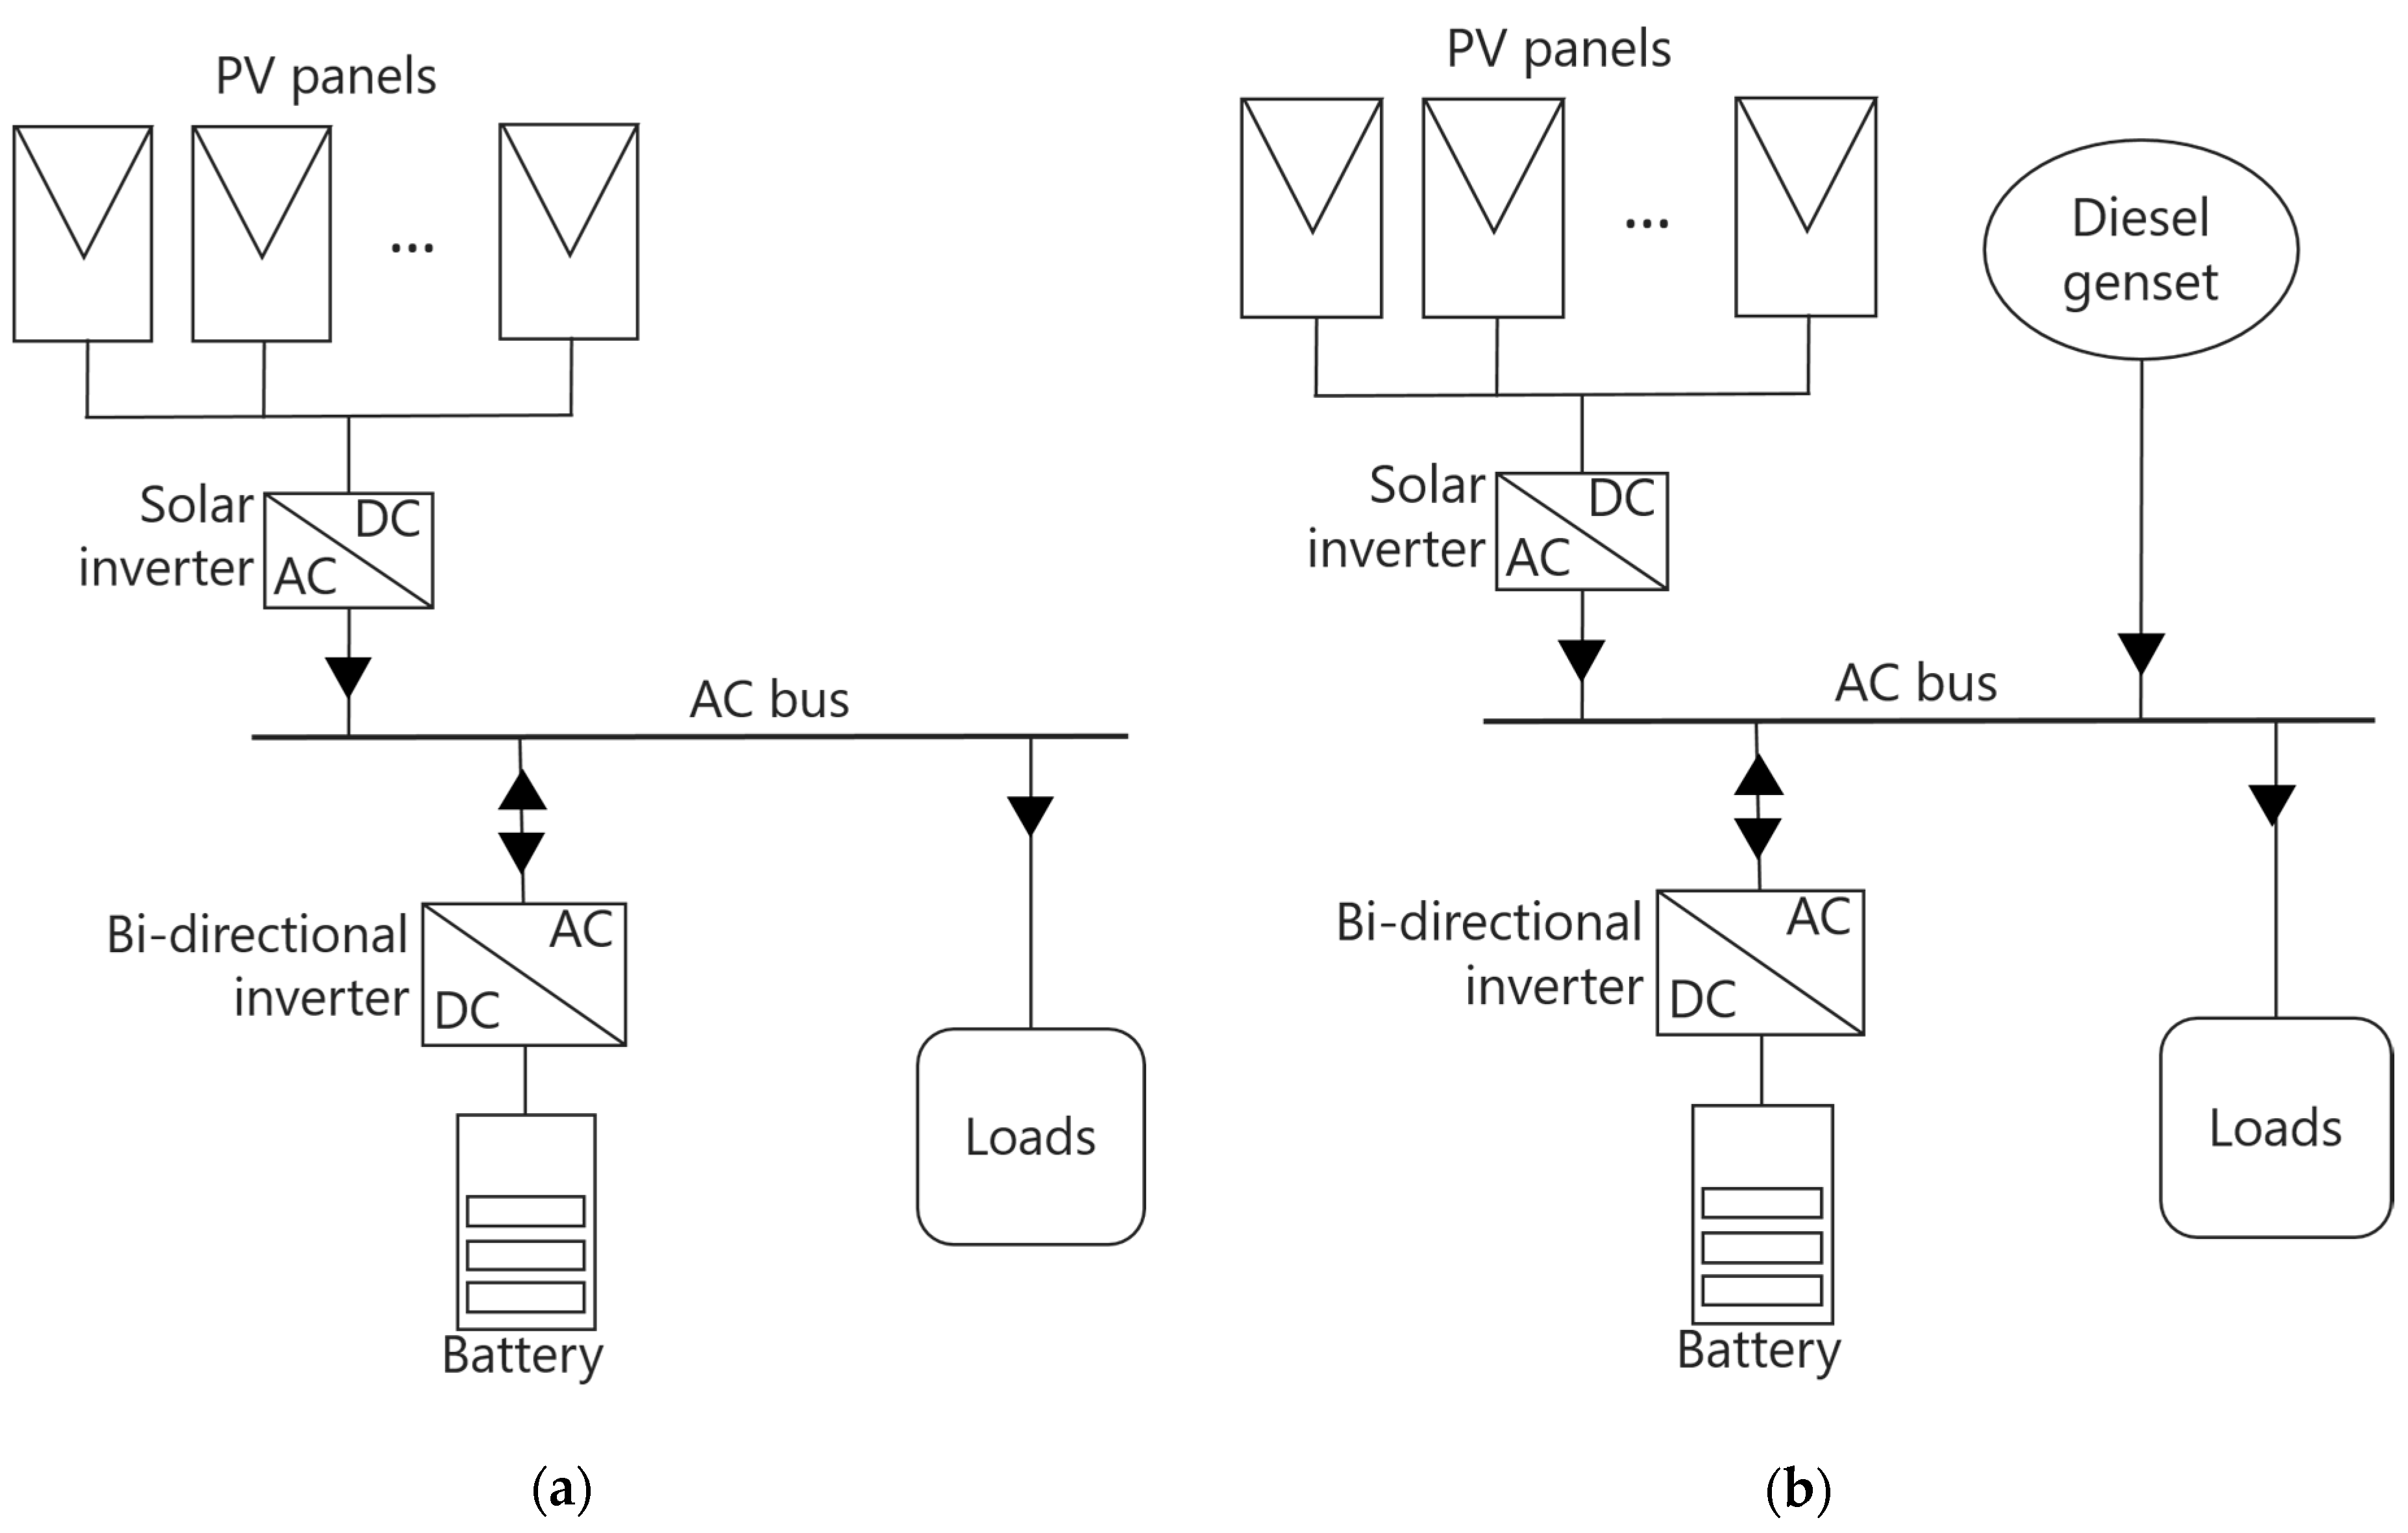
On-site renewable electricity generation is widely used in rural areas, where the electrical grid is weak, or it does not exist. Standalone energy systems usually include a PV (photovoltaic) generator and battery storage. Wind turbines are used in places with high wind speed during the whole year. In many cases, a hybrid system including PV, a fossil fuel genset (diesel or gasoline) and battery storage can be the optimal solution. Auxiliary components as the battery charge controller and inverter are required. The charge controller avoids the overcharge of the battery, preventing from premature failure. It also controls the battery discharge, preventing the over-discharge. Generally, the load is AC (alternating current) type while the battery is DC (direct current), so an inverter (DC/AC converter) is needed. Inverters used in standalone systems include battery over-discharge protection. If the system includes a fossil fuel genset, then a battery charger (rectifier, AC/DC converter) is used to charge the batteries. In many cases, the inverter and the battery charger are a single device called inverter-charger or bi-directional inverter [1]. Regarding storage in standalone systems, lead-acid batteries have been widely used [2], although Li-ion batteries can be competitive in some cases [3] as their cost have been reduced recently. Standalone systems can be DC or AC coupled. DC coupled are usual in low power systems, while AC coupled are used in middle and large power systems.
The sizing of a standalone renewable energy system is a critical process for the stability of the supply. It includes the choice of the suitable components from both technical and economic points of view. Choosing the economically optimal battery is one of the results that can be obtained from a simulation and optimization process. However, the simulation and optimization of hybrid standalone energy systems is a complex task, due to the high number of variables, the time-dependence and the non-linearity of the components [4]. Heuristic optimization techniques, such as genetic algorithms, particle swarm optimization, etc. have been used by different researchers [5]. Multiple optimization objectives have been used [4,6], but the most common are the minimization of the cost and the minimization of emissions [7]. Usually, a mono-objective optimization is performed, where the unique objective is the minimization of the net present cost (NPC) or the Levelized Cost of Energy (LCOE). Specific software tools are used for the simulation and optimization of hybrid standalone systems [4,8].
The mono-objective economical optimization is usually done by simulating the performance of different combinations of components and control strategies, looking for the combination of lowest NPC or LCOE. After the simulation of each combination, if it meets all the constraints, NPC is calculated [5], including the acquisition cost of all the components, the replacement cost at the end of the components lifetime and the O&M (operation and maintenance) cost.
The battery total cost (including its replacement during the system lifetime) is frequently the highest cost in the NPC of the hybrid system. Therefore, in optimization processes for hybrid standalone systems, the accurate estimation of the battery lifetime is one of the most important issues. Great errors in the prediction of battery lifetime would lead to great errors in the estimation of the NPC, making the optimization process unreliable.
The aging factors of lead-acid batteries are charge and discharge rates, charge (Ah) throughput, time between full charges, time at low state of charge (SOC), and partial cycling. Several researchers have analyzed them [9,10]. Classical models widely used by researchers to estimate the battery lifetime are the “equivalent full cycles model” and the “rainflow model” [11]. The first one counts the charge (Ah throughput) cycled by the battery since the start of its lifetime; when this value reaches the charge, the battery can cycle (considering the cycle life shown in the manufacturer datasheet, obtained in standard tests), the end of the battery lifetime is reached. The second model includes the effect of the depth of discharge (DOD). Nevertheless, real operating conditions (current rate, temperature, DOD, SOC, etc.) are commonly different from the laboratory conditions of the cycles shown by the manufacturer datasheet, so a great error in lifetime prediction can be expected. In some of these cases, especially in full PV systems, the lifetime estimation can be two or three times greater than real lifetime [11]. A much more accurate lead-acid aging model (and also more complex and with higher computational effort) is described by Schiffer et al. [12], called “weighted Ah throughput model”. It is used by iHOGA software [13]. This model includes Shepherd model [14] to calculate the battery voltage and Lander model [15] for the estimation of corrosion depending on voltage and temperature. The model is based on the application of weighting factors for the charge throughput of the battery to estimate the lost capacity (considering the different stress factors for cycling and corrosion).
Regarding Li-ion batteries [16,17,18], they have higher cycle life, energy density and energy efficiency, and lower maintenance compared to lead-acid batteries. LiFePO4 type is the most used in off-grid systems. The most significant aging external factors of Li-ion batteries are temperature, charge and discharge rate, and DOD [19]. In optimization of hybrid standalone systems, Li-ion cell level aging models [20] are commonly used, due to their simplicity. Electrochemical models are usually very complex, even the most simplified ones [19,21,22], thus they cannot be used in optimization due to excessive calculation times [23]. “Calendar” aging occurs when a battery is not being used while “cycle” aging occurs when the battery is under charge or discharge current [23]. Cycle aging is affected by the total charge (Ah) throughput from the start of battery lifetime, the current, the ambient temperature, and the SOC. Calendar aging main factors are temperature and SOC [20]. Arrhenius kinetic-based aging models [20] are the most used cycle aging models. For example, Wang et al. [24] model was obtained by doing many accelerated cycling tests to commercial LiFePO4 cells, obtaining a capacity fade model which takes into account the Ah throughput and temperature for different charge/discharge rates. Calendar aging has been modelled by different researchers [20]. For example, Petit et al. [25] use an expression based on Arrhenius law, considering temperature, time, and SOC. In this work, researchers consider a condition to switch between calendar and cycle mode, assuming that cycle aging only occurs when the battery is in charge mode and the current is above a given threshold current. A recent study [26] proposed to use the model of Schiffer et al. [12] for lead-acid batteries and, for Li-ion batteries, the model of Wang et al. [24] combined with the calendar aging model of Petit et al. [25].
Lifetime aside, there are other characteristics of Li-ion batteries that outperform lead-acid ones, such as lower maintenance costs, higher cycling efficiency, and greater allowed depth of discharge. Against these advantages there is the fact that currently, its acquisition price is higher. Therefore, the question is to determine in which cases it is profitable to pay its highest price. In the context of standalone energy systems, this has been addressed for specific cases in several studies, mainly located on geographical latitudes with very high solar resource. Limiting the review to recent studies, the best results are equally divided between Li-ion and lead-acid batteries, i.e., currently it is a match virtually tied. In [3], the simulation of a hybrid microgrid located in Colombia obtained lower NPC and LCOE with Li-ion batteries. In [27], the redesign of an existing rural microgrid located in a small island in Thailand was addressed, proposing and comparing three hybrid solutions with Li-ion batteries and one with lead-acid battery. The lowest cost was obtained with Li-ion batteries, although at the expense of higher fuel consumption. In [28], the case study is located in Tanzania and in the home solar system, Li-ion batteries obtained a lower LCOE. In [29], the case corresponds to a small DC load located in India and the study resulted in the use of a Li-ion battery. The four case studies of [30] are also located in India, where for both types of battery, the proposed systems included the same generation power. Therefore, the effect of battery type on system size was not considered. In [31], a case study in North Korea offered better economic results with lead-acid batteries, although close to those of Li-ion batteries. In [32], the case study is located in Malaysia and a lead-acid battery proved to be the most profitable option.
In addition to standalone PV systems, the combined use of PV generation and batteries is frequent in microgrids. A microgrid is a small energy distribution system with generation, storage, loads and usually an EMS (Energy Management System), which depending on its architecture and mode of operation can work connected to the network or disconnected from it [33]. When it operates in islanded mode, the function and requirements of its batteries are similar to those of standalone systems. Moreover, stationary lead-acid or Li-ion batteries can operate as a buffer in those cases where it is necessary to charge the Li-ion batteries of electric vehicles taking advantage of the stored energy of PV origin [34]. It is well known that in electric vehicles, the characteristics of Li-ion batteries are much more suitable than those of lead-acid ones but, in stationary systems, lead-acid batteries could be used if its technical and economic performance is considered adequate. Another characteristic that differentiates both types of batteries is the greater management complexity of Li-ion batteries, which require additional electronics and management algorithms [35,36]. This can lead to incompatibilities between batteries from different manufacturers and raise the design and maintenance costs of the systems. The additional circuitry also drains small currents that increase self-discharge.
In summary, more than a controversy, currently the choice of one battery type or another depends on each case that is addressed, and the criteria applied to make the decision. In the absence of detailed studies, in practice general criteria or preferences are applied that do not ensure the best choice, since both technologies offer acceptable results in PV standalone systems. In fact, both lead-acid and Li-ion batteries are being installed in new standalone renewable energy systems. The general expectation is that Li-ion batteries will lower their prices and prevail. However, despite the increase towards mass production, the price reduction of Li-ion batteries is not guaranteed. Its characteristics make it the option for electric vehicles, which can dramatically increase its demand and hinder price reductions. For this reason, it cannot be ruled out that in standalone renewable energy systems, lead-acid batteries still have a future. As an alternative, the use of Li-ion batteries recycled for a second life is also being considered in standalone systems [37] and other stationary applications [38].
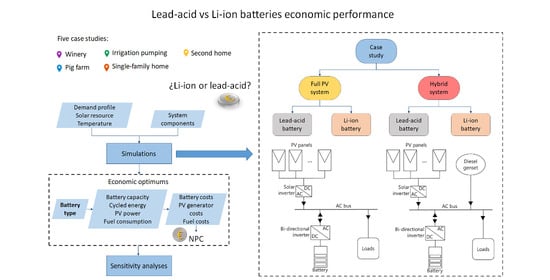
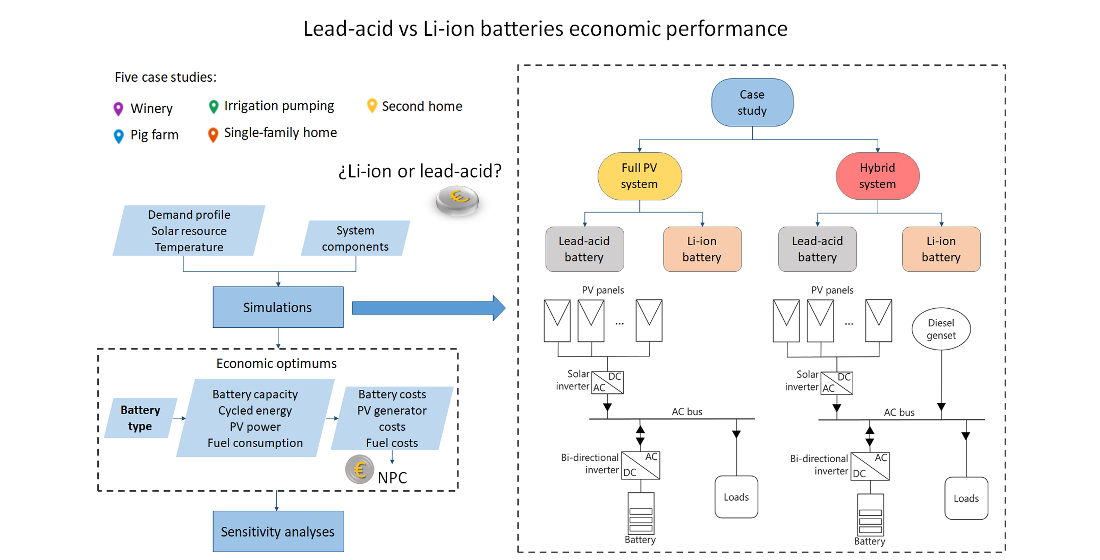
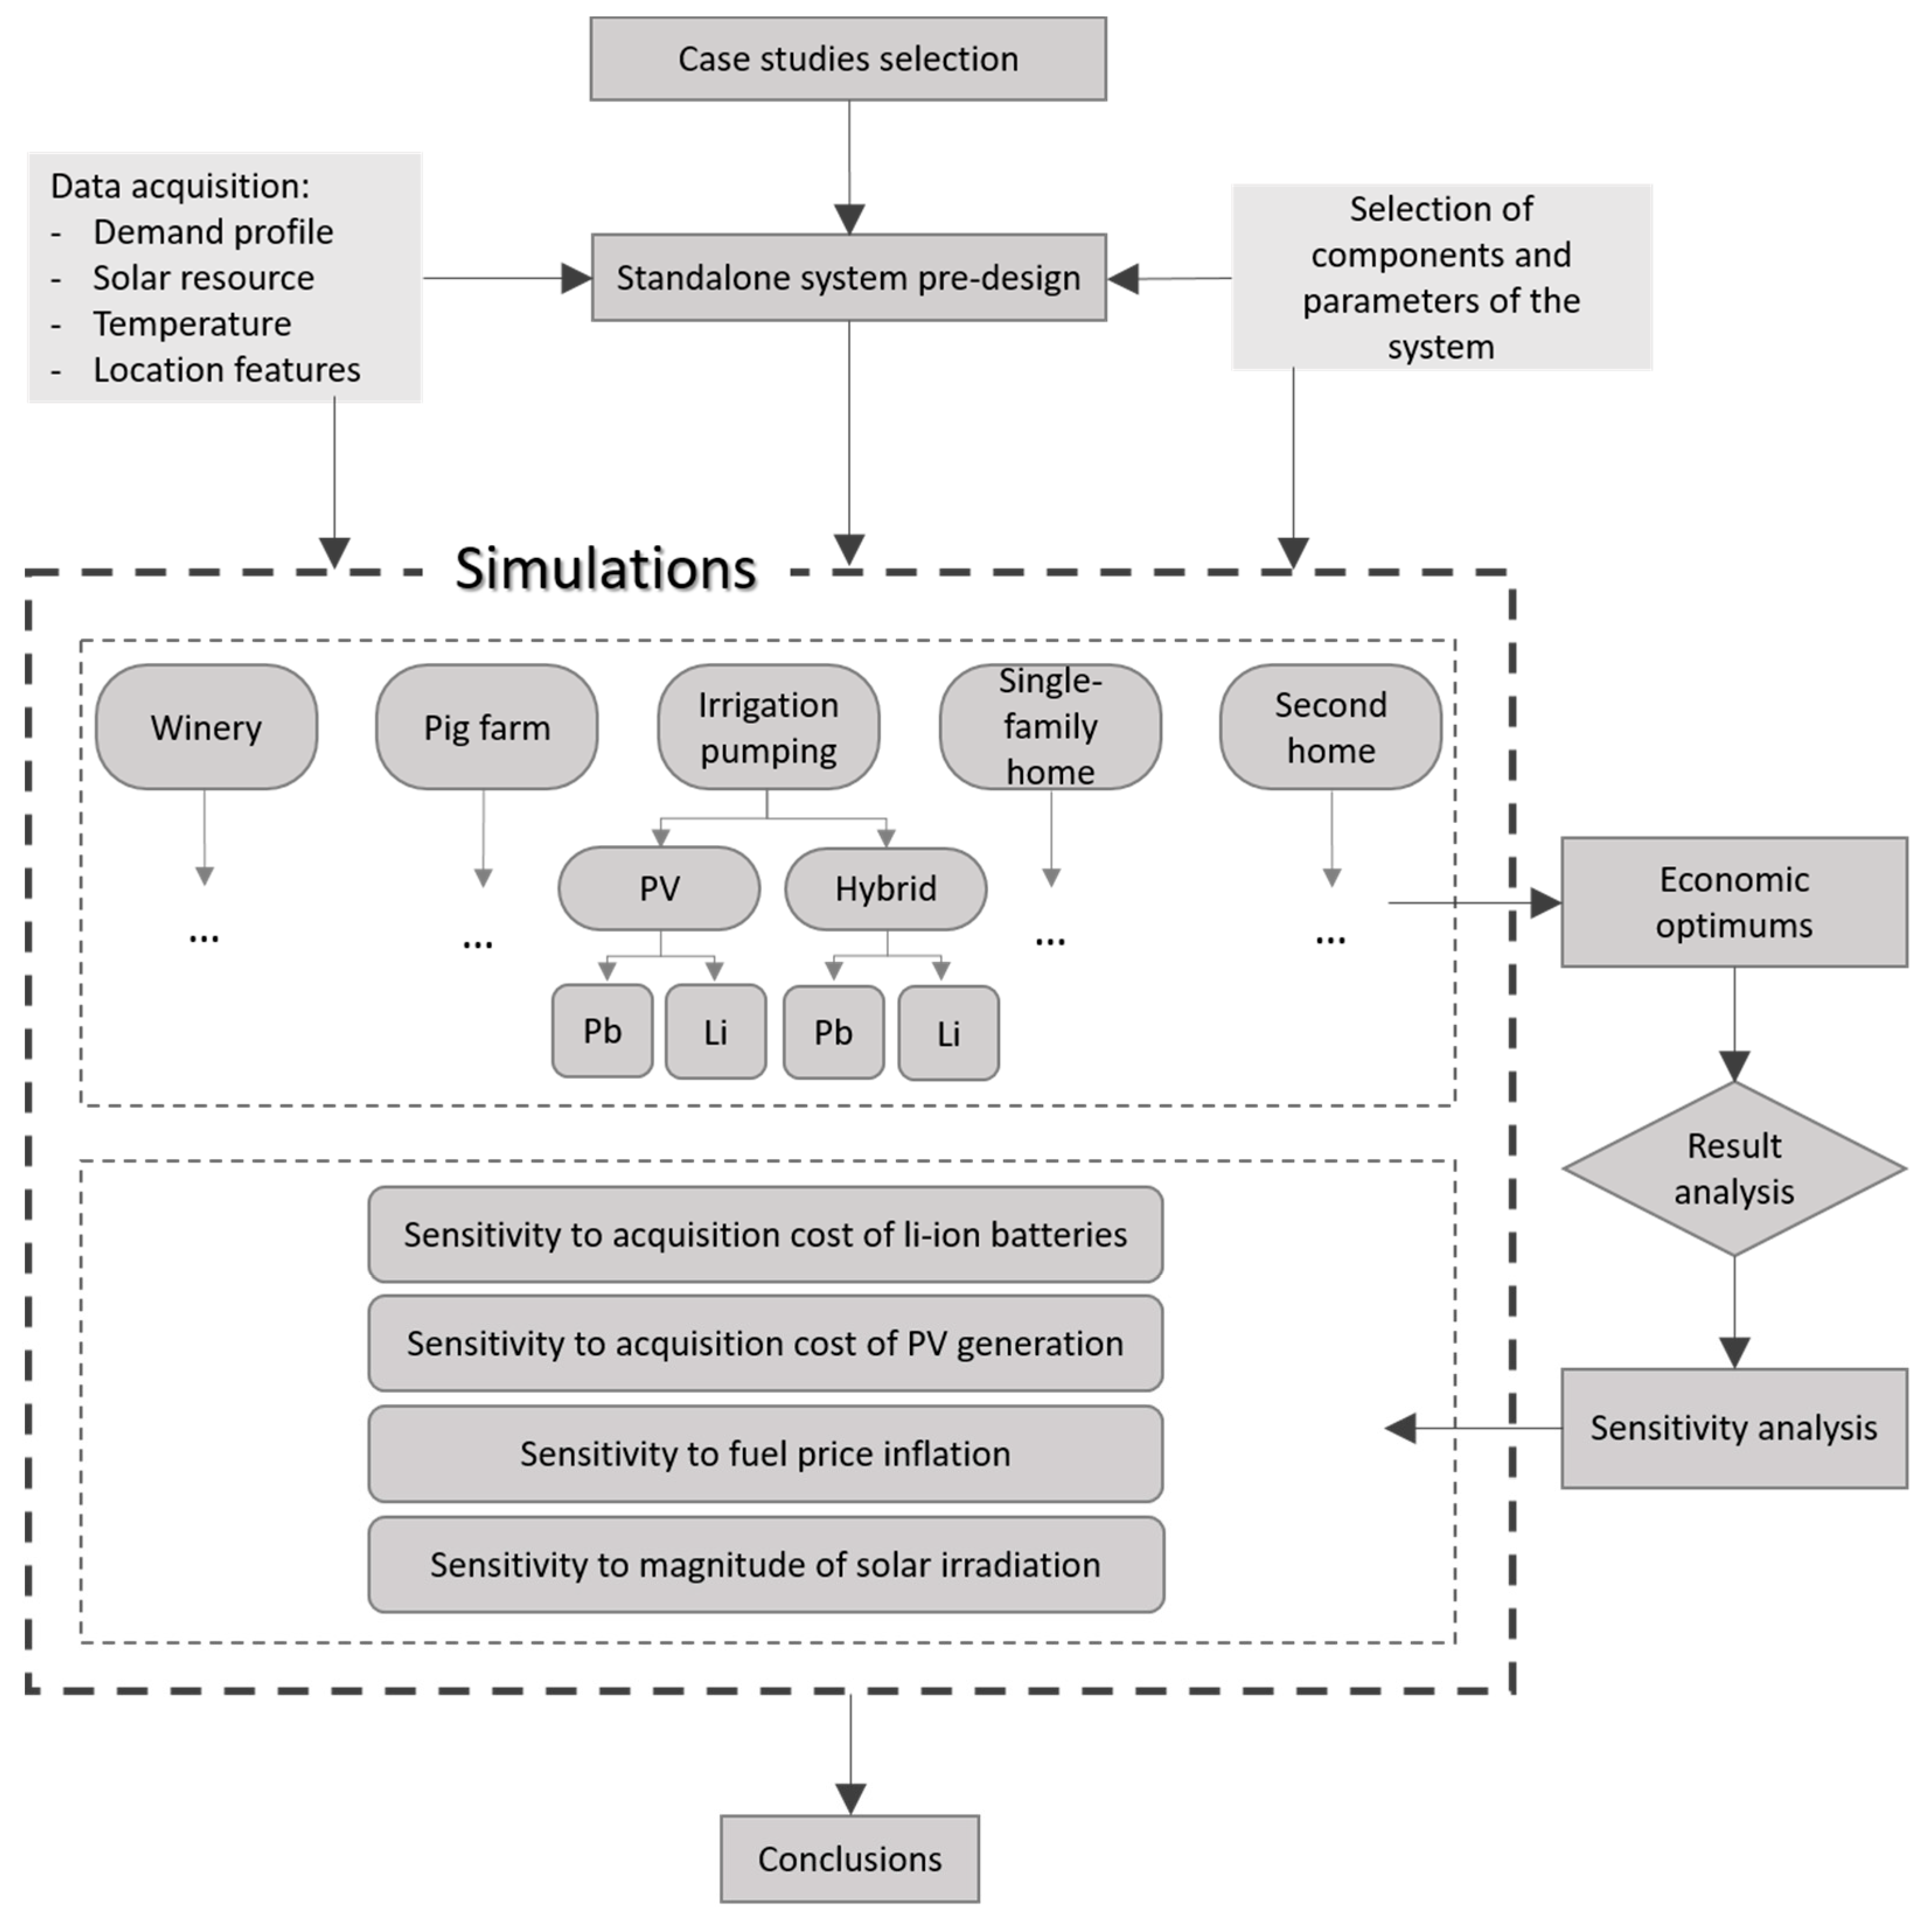
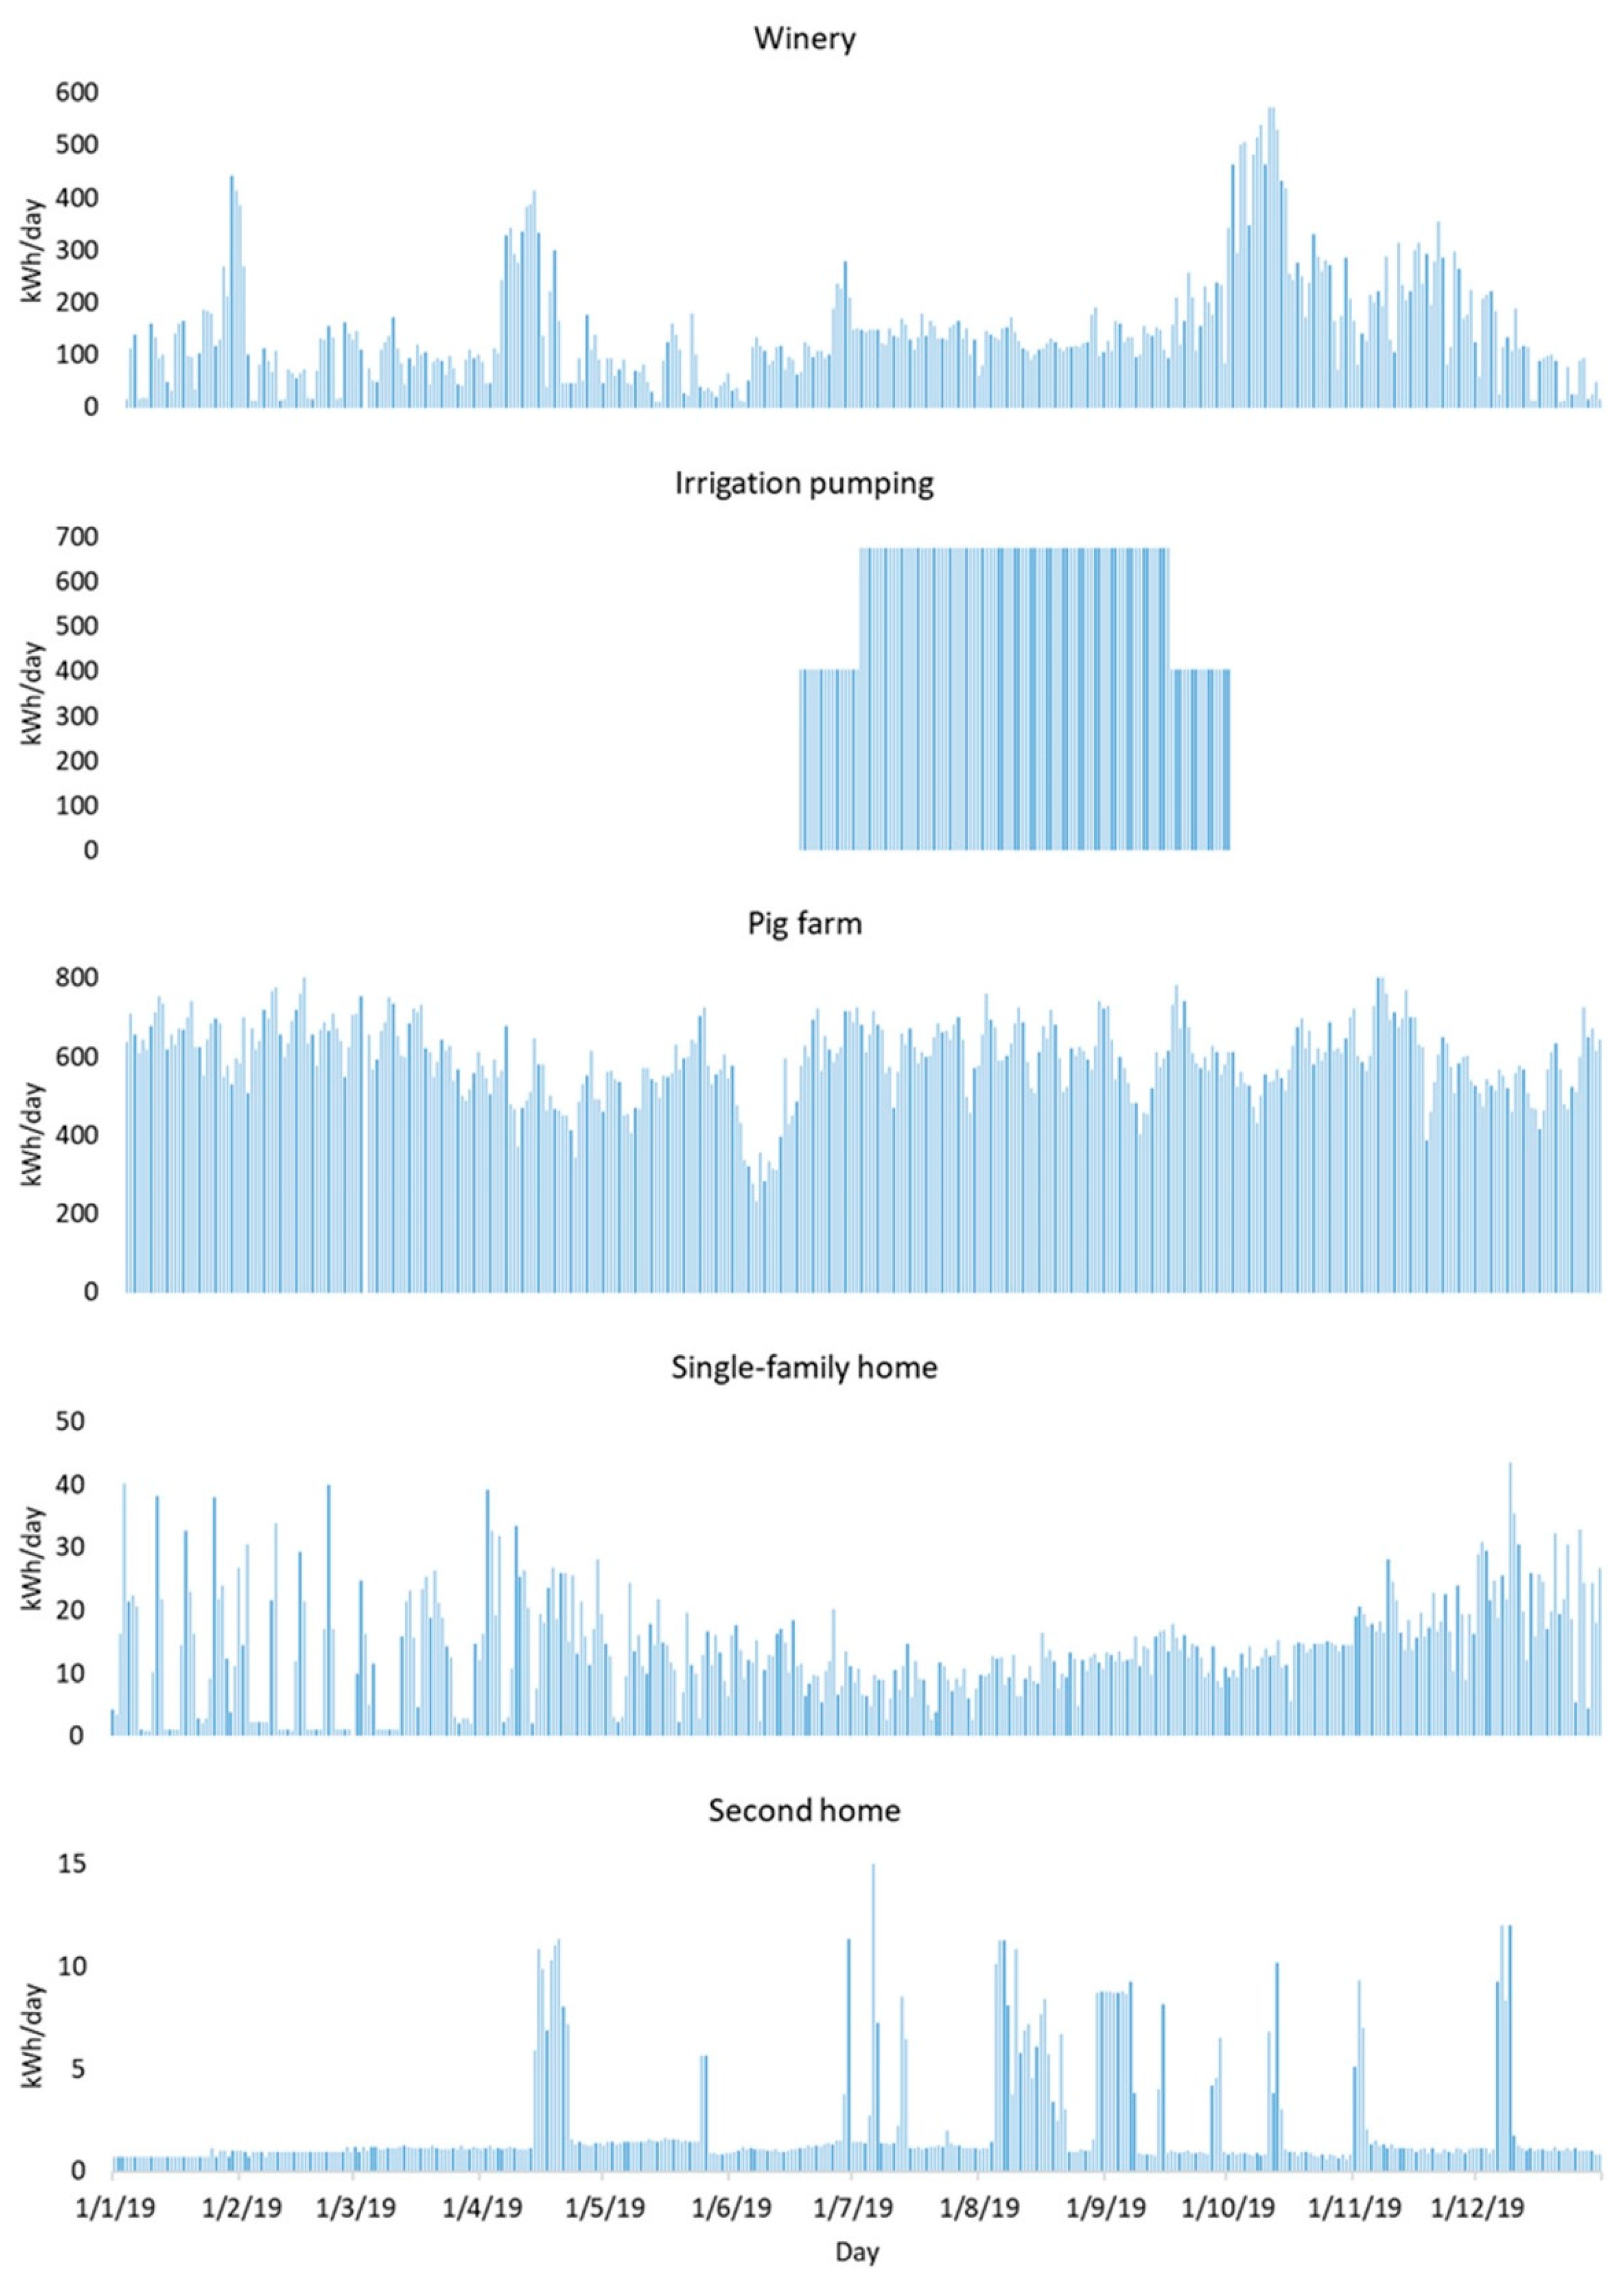
This work seeks to better understand the technical and, above all, economic implications of using Li-ion batteries instead of lead-acid in standalone renewable energy systems. With this objective, the study presents various novelties. First, it focuses on the simultaneous study of five cases whose main difference is the consumption profile. Unlike previous studies, the cases include agricultural, agro-food, and residential activities located on an intermediate geographical latitude and, therefore, with a solar resource of medium magnitude. Their locations are close together, with similar irradiation and temperature profiles. The results show that currently both types of batteries are competitive and, depending on the case (and therefore the demand profile), the most profitable choice is different. Second, it has been identified how the type of battery affects the sizing of the optimal system, including the capacity of battery, the power of PV generator and, in hybrid systems, fuel consumption. Thirdly, different behaviors are identified depending on the generation system, whether it is full PV or hybrid. Finally, the sensitivity analyses show, among other things, what reduction in the acquisition cost of Li-ion batteries would be necessary to displace lead-acid batteries as the economically optimal solution in all cases studied.

2. Materials and Methods

Figure 1 shows the graph of the methodology used in the study. Its description is detailed in the following sections: Section 2.1 Case studies and Section 2.2 Simulation, optimization, and sensitivity analysis.

2.1. Case Studies

Five case studies of existing electricity consuming facilities with different demand profiles were selected. The five cases correspond to a winery, an irrigation pumping in a vineyard, a pig farm, a single-family home and a second home for vacations. From each of them, real data were obtained on their electricity consumption for 2019. Four of the five cases are actually powered by the electricity grid, so the consumption records of their respective remote-managed meters were obtained. The case of irrigation pumping is actually powered by a diesel genset, so its consumption data were obtained from the irrigation history of 2019. All data were obtained on an hourly basis. The basic consumption data of the five cases are shown in Table 1. In summary, although none of the five cases is currently being powered by a standalone PV generation system, their consumption data are representative of their energy demand, and suitable to be used in simulations throughout this study.
The geographic locations (Figure 2) of the five cases are at a similar latitude and not very distant, all of them in the continental Mediterranean climate zone of Spain, so their profiles of solar resource and temperature are similar (Table 1). The solar resource and temperature data, on an hourly basis, were obtained from PVGIS [39].
Figure 3 shows the graphs of demand throughout the year, for each of the five cases. Case 1 (winery) presents a seasonal demand with its maximum in October (the harvest season). Case 2 (irrigation pumping) presents demand only from June to September (the irrigation season). The stability throughout this season is due to the fact that the pumping was activated the same number of hours each day, except at the beginning and end of the season, with a smaller number of hours. Case 3 (pig farm) shows a stable demand throughout the year. Case 4 (single-family home) presents a seasonal demand, greater during the cold season, due to the use of electric heating. Case 5 (second home) presents a very low demand, except for some weekends and holiday periods when it was inhabited.

2.2. Simulation, Optimization, and Sensitivity Analysis

For each one of the five cases, two sets of simulations were carried out for its supply by a standalone system. One set incorporated PV generation and storage in batteries. The other set incorporated hybrid PV-diesel generation and storage in batteries. This made a total of 10 groups of simulations, 5 with fully PV systems and 5 with hybrid systems.
The simulation and optimization processes were carried out with iHOGA software (improved Hybrid Optimization by Genetic Algorithms) [7,13]. This software simulates the technical and economic operation of the possible solutions of the system. Each possible solution is a combination of the various elements that make up the PV or hybrid system. Once the necessary information is entered, iHOGA simulates all possible combinations of components. Among them, it discards those that do not meet the technical conditions, such as the satisfaction of demand. Among the technically acceptable solutions, economic optimization consists of the search for the one that obtains the minimum NPC (Net Present Cost) (1).
N P C = n = 0 N C n ( 1 + d ) n
where NPC: Net Present Cost [€]; Cn: cost in period n (investment, O&M, replacement, and fuel costs) [€]; N: analysis period; d: annual discount rate.
The Levelized Cost of Energy (LCOE) (2) is also calculated, to compare the energy production costs.
L C O E = N P C / { n = 1 N [ Q n / ( 1 + d ) n ] }
where LCOE: Levelized Cost of Energy [€/kWh]; Qn: energy in year n [kWh].
For each case study, iHOGA was provided with data on energy demand, ambient temperature, and solar irradiation, all of them over a year, on an hourly basis. To calculate the irradiation on the plane of the PV panels, the available surfaces in each case study were taken into account (Table 2). Thus, the installation of the panels in coplanar mounting on the roofs of the winery, the pig farm, and the two houses were simulated, with their actual azimuths and tilts. In the case of irrigation pumping, the mounting on a fixed structure on the ground was simulated, so the calculation of azimuth and tilt was included in the optimization of the case itself.
In addition to the specific data of each case, iHOGA was supplied with technical data and economic parameters. The technical data consist of the characteristics of the elements that will be allowed to use to compose the systems. This includes PV panels, inverters, batteries, diesel generators, etc. For each element, its electrical characteristics, efficiency, lifespan, acquisition cost, operation, and maintenance costs, etc. were incorporated. All of them correspond to commercially available elements, with the characteristics provided by their manufacturers and the market prices in Spain in December 2020. These data are shown in Table 3, Table 4, and Appendix A. The costs assumed by the owner of the installation, which are higher than the price of the components, were used. They are shown in Table 3. Regarding the acquisition cost intervals indicated for batteries, the lowest prices per kWh correspond to the larger batteries, while the highest prices correspond to the batteries of smaller capacity, which are those used in domestic systems (cases of single-family home and second home). These data constitute a conservative scenario, in whose election various reports were considered, for PV panels [40,41] and batteries [42,43]. The considered price of diesel is 0.7 €/L and its annual variation of +1.5%.
Regarding batteries, the operating parameters are indicated in Table 4, according to their data sheets and the assigned design criteria. For the simulations of PV systems, it was imposed that 100% of the demand must be satisfied and that the autonomy of the system must be at least one day. This limited autonomy was chosen to intraday storage will be the main function of the battery in the system, leaving aside in this study medium- and long-term storage. In simulations of hybrid systems, the minimum autonomy condition was not necessary, due to the presence of a diesel genset. The economic parameters, based on the European Monetary Policy [44], for the simulation are shown in Table 5.
All the loads are single-phase AC in the homes and three-phase AC in the winery, pumping, and pig farm. In all cases, the architecture of the energy systems corresponds to an AC bus, to which all the elements are directly or indirectly connected. Thus, the PV panels are connected through a solar inverter and the battery through a battery bi-directional inverter. In the simulations of hybrid systems, the diesel generator is connected directly to the AC bus. Figure 4 shows the block diagram of PV systems and hybrid systems.
The battery inverters are responsible for maintaining the parameters of the AC bus, i.e., 230 V 50 Hz in single-phase or 400 V 50 Hz in three-phase. For three-phase, a cluster formed by three synchronized inverters with 120° phase shifts between them is used. They also manage the flow of power from the 48 V DC battery, charging or discharging it.
The PV modules are PERC (passivated emitter and rear cell) technology [45] and polycrystalline silicon cells. The output of the PV strings, of DC with variable voltage and current, is connected to the AC bus through a single-phase or three-phase solar inverter, which incorporates a maximum power point tracker (MPPT).
For lead-acid batteries, individual 2 V cells of the OPzS type (vented tubular plate flooded cells) were used. Each battery consists of 24 identical cells connected in series. The simulation software chooses cells of higher or lower capacity. For Li-ion batteries (LiFePO4), 48 V modules were used that can be connected in parallel. Regarding battery degradation, the model described by Schiffer et al. [12] was used for lead-acid batteries, because it was identified as the most accurate in a study [11] prior to this one. For Li-ion batteries, the models of Wang et al. for cycle aging [24] and Petit et al. for calendar aging [25] were used.
Finally, for each one of the five cases, the simulation processes were carried out and the optimal configuration was found for the two modalities, PV and hybrid systems. In this way, it was identified, for each of the 10 systems, if the battery that is part of the economically optimal solution was lead-acid or Li-ion, as well as the difference between the NPCs and LCOEs obtained by both.
Beyond the results of the 10 optimal systems, several sensitivity analyses were performed in front of various parameters. This allowed identifying the possible influence of other scenarios on the baseline results. Among the parameters chosen for these analyses were acquisition cost of Li-ion batteries, acquisition cost of PV generation, fuel price inflation, and solar irradiation.

3. Results

This section is organized in the following subsections: Section 3.1 Economic Optimum Systems of the Five Cases and Section 3.2 Results of Sensitivity Analyses.

3.1. Economic Optimum Systems of the Five Cases

For each case study, two economic optimum PV systems were obtained, one of them using a lead-acid battery and the other using a Li-ion battery. The one with the lowest NPC is the absolute optimum, i.e., the type of battery it uses is the most profitable choice.
This section is organized as follows: Section 3.1.1 focuses on the components of the optimal systems, Section 3.1.2 focuses on their energy balance and Section 3.1.3 focuses on their costs.

3.1.1. Components of the Economic Optimum Systems

Table 6 shows the main technical characteristics of the economic optimum PV systems for the five cases: battery lifetime, battery capacity, and PV generator power. For each case, the first row shows the data of the optimum with lead-acid battery and the second row shows those of the optimum with Li-ion battery.
Table 7 shows the main technical characteristics of the economic optimum hybrid systems for the five case studies. As these systems include a diesel genset, the yearly fuel consumption is added.
In both PV and hybrid systems, the choice of the type of battery affected their economic optimum, including not only the lifetime of the battery, but also its capacity and the size of the PV generator. In hybrid systems, it also affected their fuel consumption.
Figure 5 shows the battery lifetimes of the optimum systems, both PV (a) and hybrid (b). In all cases, the Li-ion batteries presented a lifetime of 15 years, which corresponds to the design life specified by the manufacturer and, therefore, iHOGA took it as the maximum limit before its replacement. Despite having a longer design life, lead-acid batteries had a shorter lifetime, which differed in the five cases. As a result, the lifetime of Li-ion batteries was superior in all cases, from +18% to +113%. However, comparing the PV and hybrid systems for each case, the behavior was very similar. The cases in which lead-acid batteries had shorter lifetimes were the two homes and the pig farm.
It is noteworthy that a change in the type of battery resulted in a different size of the components of the system, affecting both storage and generation, On the one hand, the Li-ion battery had a lower capacity than the lead-acid battery in all cases. Differences were between −7% and −67% in PV systems and between −21% and −92% in hybrid systems. Therefore, the variations in storage when the battery type changed showed similar behaviors in the optimal PV and hybrid systems, although they reached a greater magnitude in the latter. In this sense, it must be taken into account that in PV systems, the battery must be able to supply all nighttime consumption. This is a lower limit for the battery capacity. In contrast, the presence of diesel generation makes that limit non-existent in hybrid systems, allowing more flexibility to use a smaller battery.
On the other hand, as shown in Figure 6a, in the PV optimum systems with Li-ion battery, the PV generator had a higher size than that of the optimum with lead-acid, in four of the five cases (+8% to +87%). The only case in which it decreased is the one (single-family home) in which the battery reduction was the least. It must be taken into account that the DOD of 90% allowed in the simulations of Li-ion batteries made their useful capacity greater than in lead-acid batteries whose allowed DOD was 80%. Moreover, the higher cycling efficiency of the Li-ion battery (95%) compared to the lead-acid (85%) played in favor of the lower need for PV production. Both characteristics are shown in Table 4. In consequence, the decrease in useful storage capacity was less than nominal. As a result, the reduction in nominal capacity by 6.5% had not required an increase in PV generation, but had even allowed its reduction.
Regarding the optimal hybrid systems, Figure 6b shows that the diesel gensets assumed the change in production, while the PV generators barely changed (0% to −11%). Thus, in four of the five cases, the fuel consumption increased (+15% to +108%). In the same way that in the optimal PV systems, in the case where the reduction in the nominal capacity of the battery is the smallest (this time, the second home) there was no increase in production, i.e., its PV generation did not vary, and fuel consumption decreased (−6%).
In summary, the effects of changing the battery type from lead-acid to Li-ion on the size of the optimal system components were similar in PV and hybrid systems, despite the latter requiring less storage capacity. This included a reduction in the nominal capacity of the battery. If the higher DOD and the higher cycling efficiency of Li-ion batteries were not enough to compensate for the lower storage, the production of energy increased from PV or diesel origin. It was also observed that the five case studies presented quantitatively different behaviors in front of the change of type of battery. However, each case presented a similar trend in optimal PV and hybrid system.

3.1.2. Energy Balance of the Economic Optimum Systems

To interpret the different battery capacity reductions in each case, it may be useful to observe the changes in the internal energy balance of the system. Different internal energy flows correspond to the different size of components of the lead-acid or Li-ion battery optimal systems. This section pays attention to two relevant quantities in standalone systems with storage and renewable generation: the energy cycled in the battery and the excess energy. Due to the variability of the solar resource, in standalone PV systems, storage is necessary to satisfy the demand of the loads at times when there is not enough PV production. Thus, a part of the energy supplied to the loads comes from the battery, where it has been cycled. When the solar resource is practically zero, all the energy must be supplied from the battery. However, when the solar resource is present, the energy comes to a greater or lesser extent from the PV generator, and can be complemented by that from the battery. In addition, long-term storage in batteries is hardly feasible. Because of all this, standalone PV systems often have a high amount of excess energy. When sizing a standalone PV system, many different combinations of PV production and storage are possible, among which there is an economically optimal one. When changing the technical characteristics and/or the costs of the components of the system, as in this comparison with the battery, the economic optimum varies. Consequently, the amounts of cycled energy and excess energy are also affected. Organized in a similar way to the previous tables, Table 8 and Table 9 show these significant parameters of the internal energy balance in the optimal PV systems and hybrid systems for the five case studies.
Figure 7 shows the percentage differences in battery capacity and energy cycled in the battery in the system, between the economic optimum systems with Li-ion and lead-acid batteries. As shown in Figure 7a, in PV systems, relatively big variations in battery capacity corresponded to proportionally small variations in cycled energy. Even with capacity reductions, two of the cases showed slight increases in cycled energy. In four of the five cases of hybrid systems, as shown in Figure 7b, the variations in energy cycled were also relatively small, in comparison with the variations in the battery size. However, in the case of irrigation pumping, the cycled energy was strongly reduced (−84%) but also to a lesser extent than the battery capacity (−92%).
Figure 8 shows the percentage differences in energy cycled in the battery and in excess energy in the system, between the economic optimum systems with Li-ion and lead-acid batteries. As shown in Figure 8a, in PV systems, small variations in cycled energy corresponded to proportionally large variations in excess energy. On the contrary, in hybrid systems there were no large variations in excess energy, as shown in Figure 8b. This was because when reducing the battery capacity, there were periods when stored energy was not available and had to be compensated with more power generation. Although in hybrid systems this energy could come on demand from a manageable source (the diesel genset), in PV systems it was required to increase the power of the PV generator, which means that there was excess of energy the rest of the time.

3.1.3. Costs (NPCs) of the Economic Optimum Systems

Table 10 shows the costs, in terms of NPC, of the optimal PV systems for the five case studies. The total cost of the system is the sum of the costs of the battery, the PV generator, and others (including ancillary items and financial costs). The latter are not shown in the table, since they hardly varied and are not significant in this study. Table 11 shows the costs of the optimal hybrid systems. It includes one more column with those of diesel generation (diesel genset, O&M and fuel). A comparison of Table 6, Table 7, Table 10 and Table 11 shows that in PV systems the battery capacity was greater than in hybrid systems, with a greater weight in the NPC of the system.
Figure 9 shows the NPCs of the optimal systems, both PV (a) and hybrids (b). They are ordered in terms of their extra costs in PV systems when using a Li-ion battery compared to using a lead-acid battery. Thus, in the pig farm, the NPC of the system had the greatest increase, being more profitable to use a lead-acid battery. On the contrary, in the second home, the NPC of the system had the greatest decrease, being more profitable to use a Li-ion battery. This order is maintained in the graph of hybrid systems (b), although the case of irrigation pumping would actually go from being the second to the third. This is related to the fact that by far the largest reduction of Li-ion battery size was achieved in the hybrid system of the irrigation pumping.
In the optimal PV systems, as shown in Figure 9a, the differences in system NPCs ranged from −16% to +22%, and only in one case was the Li-ion battery the most profitable. In the optimal hybrid systems, as shown in Figure 9b, the differences in system NPCs ranged from −7.2% to +5.9%, and in two cases was the Li-ion battery the most profitable.
All these NPC costs of the systems are the result of the combination of differences in battery and generation costs, which contribute to the NPC of the system as a whole. In summary, from the point of view of cost, again the five cases showed different behaviors by changing the type of battery.
On the one hand, Li-ion battery systems used lower capacity batteries that also had a longer lifetime, as shown in the previous section. Thus, as shown in Figure 9a for the PV systems, the NPCs resulting from these batteries was close to or even lesser than that of lead-acid, with differences between −40% to +17%. On the other hand, the costs (NPC) of PV generators increased (+8% to +84%) due to their higher power, except in the case of single-family home, whose PV power and NPC decreased (−21%), as already seen. Finally, only in the case of the second house, the absolute optimal PV system included a Li-ion battery, due to the combination of the largest reduction in the battery NPC and a small increase in the PV generator NPC.
In the same way that in PV systems, in hybrid systems Li-ion batteries had lower capacity and longer lifetime, obtaining NPC differences from +9.9% to −83%. As for the generation, since the size of the PV generators is maintained in three cases or decreased in two cases, with NPC differences from 0% to −11%. On the contrary, in four of the five cases, the higher fuel consumption by diesel genset caused their NPCs to increase, between +33% and +72%. As an exception, for the reasons already explained, in the second home the diesel NPC decreased slightly (−2.8%). Finally, in two of the five cases (single-family home and second home), the absolute optimal hybrid system included a Li-ion battery.

3.2. Results of Sensitivity Analyses

To know the influence of some parameters on the results, the corresponding sensitivity analyses were carried out. In addition to the price of Li-ion batteries, which is likely to change in the near future, it was intended to identify whether other parameters influence the comparative profitability of the two types of battery studied. Specifically, analyses were made regarding acquisition cost of Li-ion batteries, acquisition cost of PV generation, fuel price inflation, and magnitude of solar irradiation.

3.2.1. Sensitivity to Acquisition Cost of Li-Ion Batteries

For this analysis, the acquisition cost of Li-ion batteries was multiplied by factors from 0.1 to 2, while the cost of lead-acid batteries was unchanged. Figure 10a shows the results of the optimal PV system and Figure 10b that of the hybrid system, both for the winery case. As expected, below a certain factor where the lines cross, the absolute optimal systems contain a Li-ion battery, while above that factor, they include a lead-acid battery. In the five case studies, the slope of the line of the NPC (with Li-ion battery) of the optimal PV system is greater than that of the optimal hybrid system.
The value of the factor with which both types of battery obtained the same NPC of the optimal system was different depending on the case study and the type of system (PV or hybrid). These values are shown in Table 12. In the five case studies, this value was higher for the hybrid system than for the PV. Consequently, the reduction in the acquisition cost of Li-ion batteries necessary for their entry into the absolute optimum of hybrid systems was less than that of PV systems.
Regarding the size of the battery, in the five cases, both PV and hybrid, the acquisition cost of Li-ion batteries influenced their size (their capacity) in the optimal system. Figure 11 shows the graphs corresponding to the winery case. In both PV (a) and hybrid (b) systems, as the acquisition cost of Li-ion batteries decreased, the capacity of the battery increased. In addition, the decrease in capacity with the increase in cost tended to a limit, especially in PV systems.
Variations in Li-ion battery acquisition cost were accompanied by variations in various elements of the system. Figure 12a shows a graph corresponding to the PV system of the winery case. The reduction in battery capacity, motivated by its increase in cost, was accompanied by an increase in the power of the PV generator. On the contrary, the higher the battery capacity, the lower the PV generation power. Thus, a lower production of the PV generator was compensated by taking advantage of a part of the surplus energy, through a battery with a higher capacity.
By contrast, in the hybrid system of the same case (the winery), as shown in Figure 12b, the reduction in battery capacity shown in Figure 11b was accompanied by a reduction in the power of the PV generator, while the increase in energy production was assumed by the diesel genset. In other words, the increased production of the diesel genset compensated for both the lower capacity of the battery and the lower power of the PV generator.
All these behaviors occurred in all case studies, to a greater or lesser extent. In PV systems, these variations were limited, since a minimum of accumulation was required for the operation of the system. Unlike PV systems, the presence of dispatchable generation allowed greater flexibility to hybrid systems.

3.2.2. Sensitivity to Acquisition Cost of PV Generation

For this analysis, the acquisition costs of the elements of PV generation, such as panels and inverters, were multiplied by factors from 0.1 to 2. As expected, in all cases, the higher cost of the elements, the higher cost of the system.
Regarding PV systems, Figure 13a shows that in the irrigation pumping case, the NPC line of optimal system with Li-ion batteries has a greater slope than that with lead-acid ones, even crossing it, i.e., the system with Li-ion batteries was more sensitive to variations in the acquisition cost of PV generation. Thus, in this case and in the interval studied, lower acquisition cost for PV elements (panels and inverters) favored the presence of Li-ion batteries over lead-acid batteries in the absolute optimum, and vice versa. However, Figure 13b shows that in the case of the winery, this behavior was very attenuated, both lines being virtually parallel, i.e., the acquisition costs of the PV elements (panels and inverters) did not affect the type of battery present in the absolute optimum system of the case and in the interval studied. The rest of the cases showed intermediate behaviors between the two described. In none of the cases, the reduction in cost of PV elements favored lead-acid batteries.
With respect to hybrid systems, Figure 14a shows that in the irrigation pumping case, both lines are virtually superimposed, keeping very little distance between them. In fact, their NPCs in the base case differ only by 0.97%. Figure 14b refers to the case of the Single-family home, where both lines are also virtually parallel. All other cases had the same behavior. Thus, unlike optimal PV systems, in hybrid systems the type of battery (lead-acid or Li-ion) present in the absolute optimum was not affected by the acquisition costs of the PV generator.
Regarding the elements of the optimal systems, in the five cases both PV and hybrid, the variation in the acquisition cost of the PV generator influenced their size. Figure 15 shows the graphs corresponding to the winery case, both PV (a) and hybrid (b), with Li-ion batteries. The behaviors presented some similarities to those observed in the sensitivity analysis on the cost of Li-ion batteries. In the PV system (a), as the acquisition cost of the PV generator increased, its size tended to decrease and that of the battery to increase. Again, a lower production of the PV generator was compensated by taking advantage of part of the surplus energy, through a battery with a higher capacity.
However, as shown in Figure 15b, in the hybrid system, the decrease in the power of PV generation was proportionally greater than in the PV system. Again, a higher output from the diesel genset compensated for the lower output from the PV generator.

3.2.3. Sensitivity to Fuel Price Inflation

In the base scenario of the simulations, the inflation considered for the price of diesel was 4%. For this analysis, scenarios from 0% to 8% were considered. This analysis only makes sense on hybrid systems.
Figure 16 shows that in both pig farm (a) and winery (b) cases, the NPC line of optimal systems with Li-ion batteries has a slightly greater slope than that with lead-acid ones, i.e., the system with Li-ion batteries was a little more sensitive to variations in the inflation of diesel price. The rest of the cases showed similar behaviors. In none of the cases, the reduction in cost of PV elements favored lead-acid batteries. Thus, in all cases and in the interval studied, lower inflation of diesel price slightly favored the presence of Li-ion batteries over lead-acid batteries in the absolute optimum, and vice versa.
Figure 17a corresponds to the case of the winery and shows that the higher the inflation of the fuel price, the higher the battery capacity in both the lead-acid and Li-ion systems. As expected, the higher the cost of the fuel, the lower the consumption, which was compensated by the higher power of the PV generator, as shown in Figure 17b. All other cases had the same behavior.

3.2.4. Sensitivity to Magnitude of Solar Irradiation

For this analysis, the solar irradiation on the surface of the PV panels was multiplied by factors from 0.6 to 1.4.
Figure 18a shows the NPC of the PV optimal systems for the pig farm case. In it, the line corresponding to the system with Li-ion batteries has a greater slope than that with lead-acid batteries, i.e., the system with Li-ion batteries was more sensitive to variations in the solar irradiation. Thus, in this case and in the interval studied, higher solar irradiation favored the presence of Li-ion batteries over lead-acid batteries in the absolute optimum, and vice versa. On the contrary, Figure 18b shows that in the hybrid systems, higher solar irradiation favored the presence of lead-acid batteries. However, the sensitivity to the variation of solar irradiation was not very high, so that in the interval studied, neither the crossing of the lines nor the consequent change in the type of battery present in the absolute optimum occurs. All other cases had the same behavior. This sensitivity analysis bears some similarity to that of the acquisition cost of the elements of the PV generator, since both affect the cost of the PV generator necessary for a given energy production. However, their magnitudes and ranges are different.

4. Discussion

Five real cases with different consumption profiles have been studied, from an economic point of view, through simulations of standalone energy systems. The results show that in both 100% PV and PV-diesel hybrid systems, the use of lead-acid or Li-ion batteries results in different sizing of the economic optimum system. In other words, if the type of battery is changed, to achieve the economic optimum the entire system must be resized. This different size of the system elements affects the capacity of the battery, the power of the PV generator and, in hybrid systems, the fuel consumption. Consequently, for each case, the optimum system (and its NPC) is different for each type of battery. A lower NPC means a lower cost of the system throughout its lifetime, i.e., a higher profitability. Thus, of both optimum systems, with a lead-acid or Li-ion battery, the one that presents the lowest NPC should be considered the absolute optimum and the type of battery that it includes is the best option from an economic point of view.
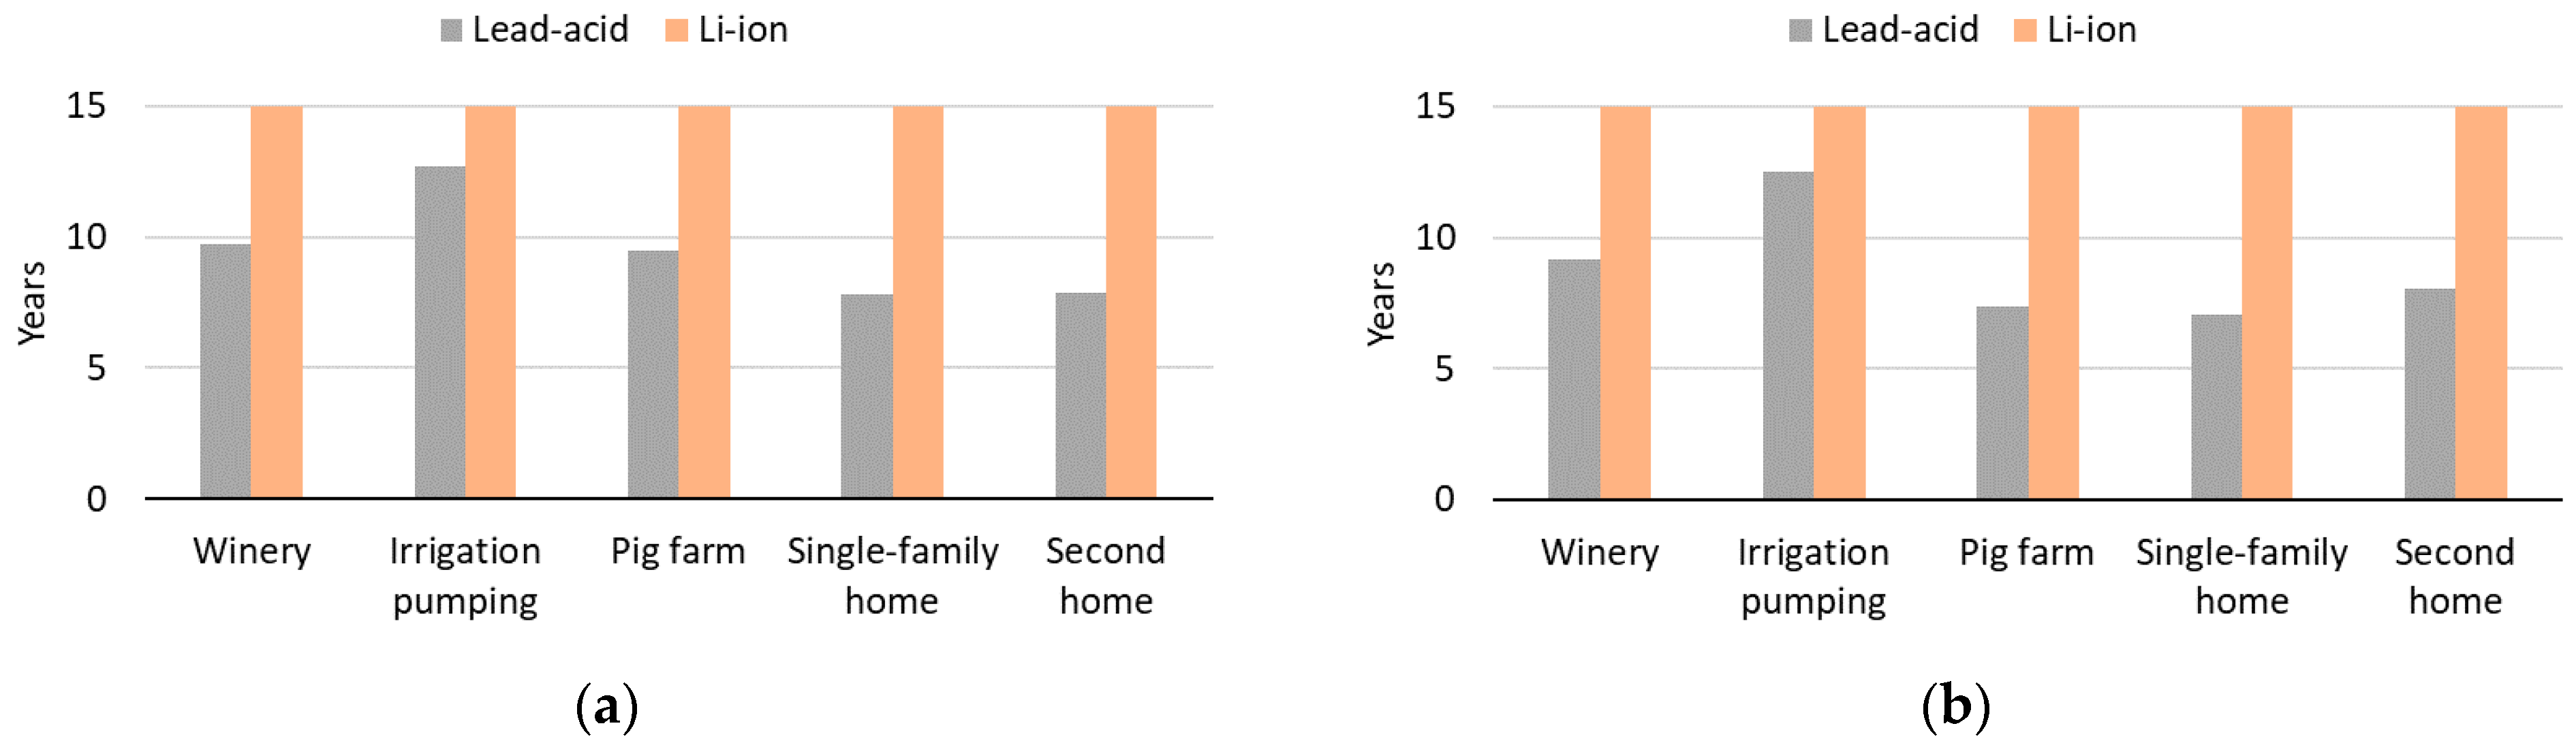
In all cases of this study, Li-ion batteries have shown a longer lifetime, between +18% and +113% over lead-acid ones. This result is consistent with the estimate [26] that lithium-ion battery lifetime can double that of lead-acid batteries. The cases in which lead-acid batteries have shown a shorter useful life are both homes (single-family home and second home), in accordance with the results of a previous study focused on their aging [11]. Consequently, it is in them where the improvement in terms of lifetime is greater when changing to a Li-ion battery.
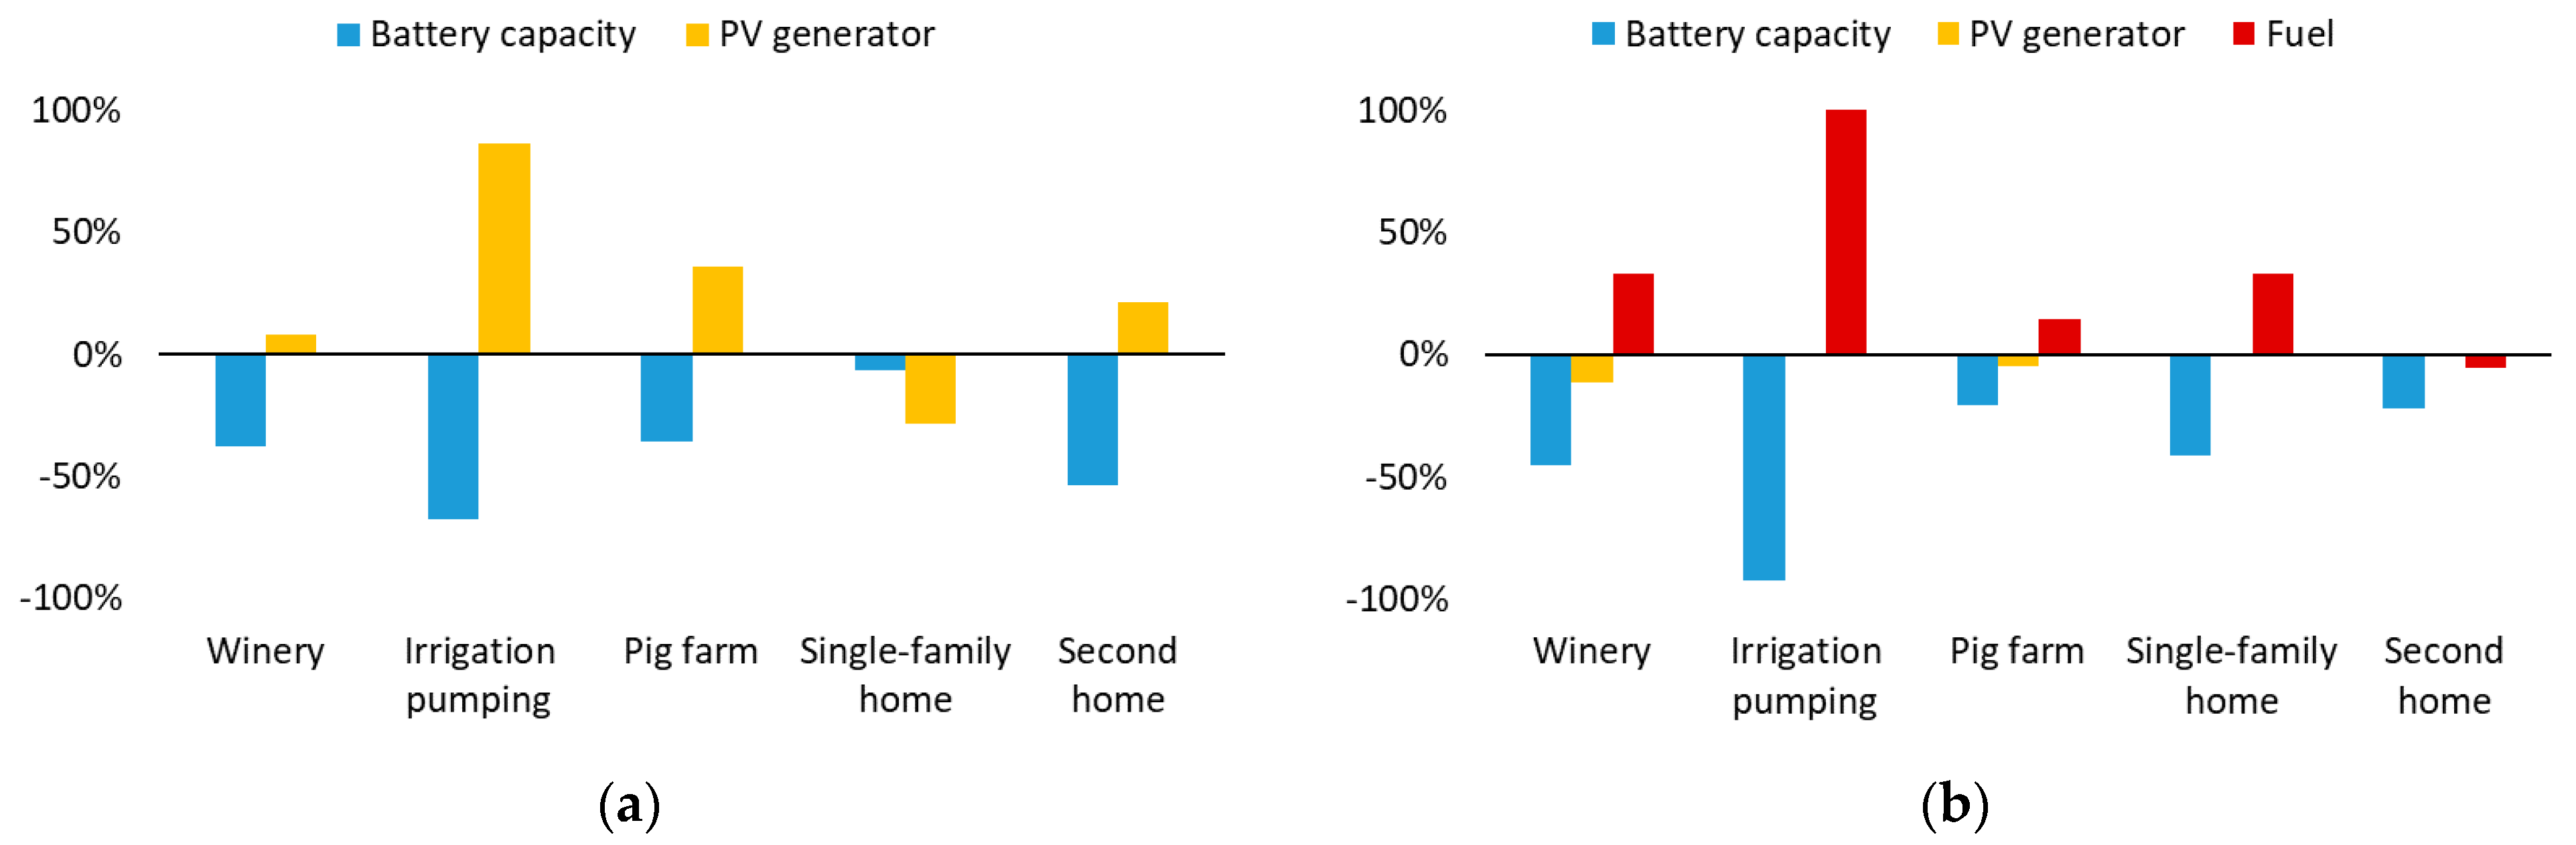
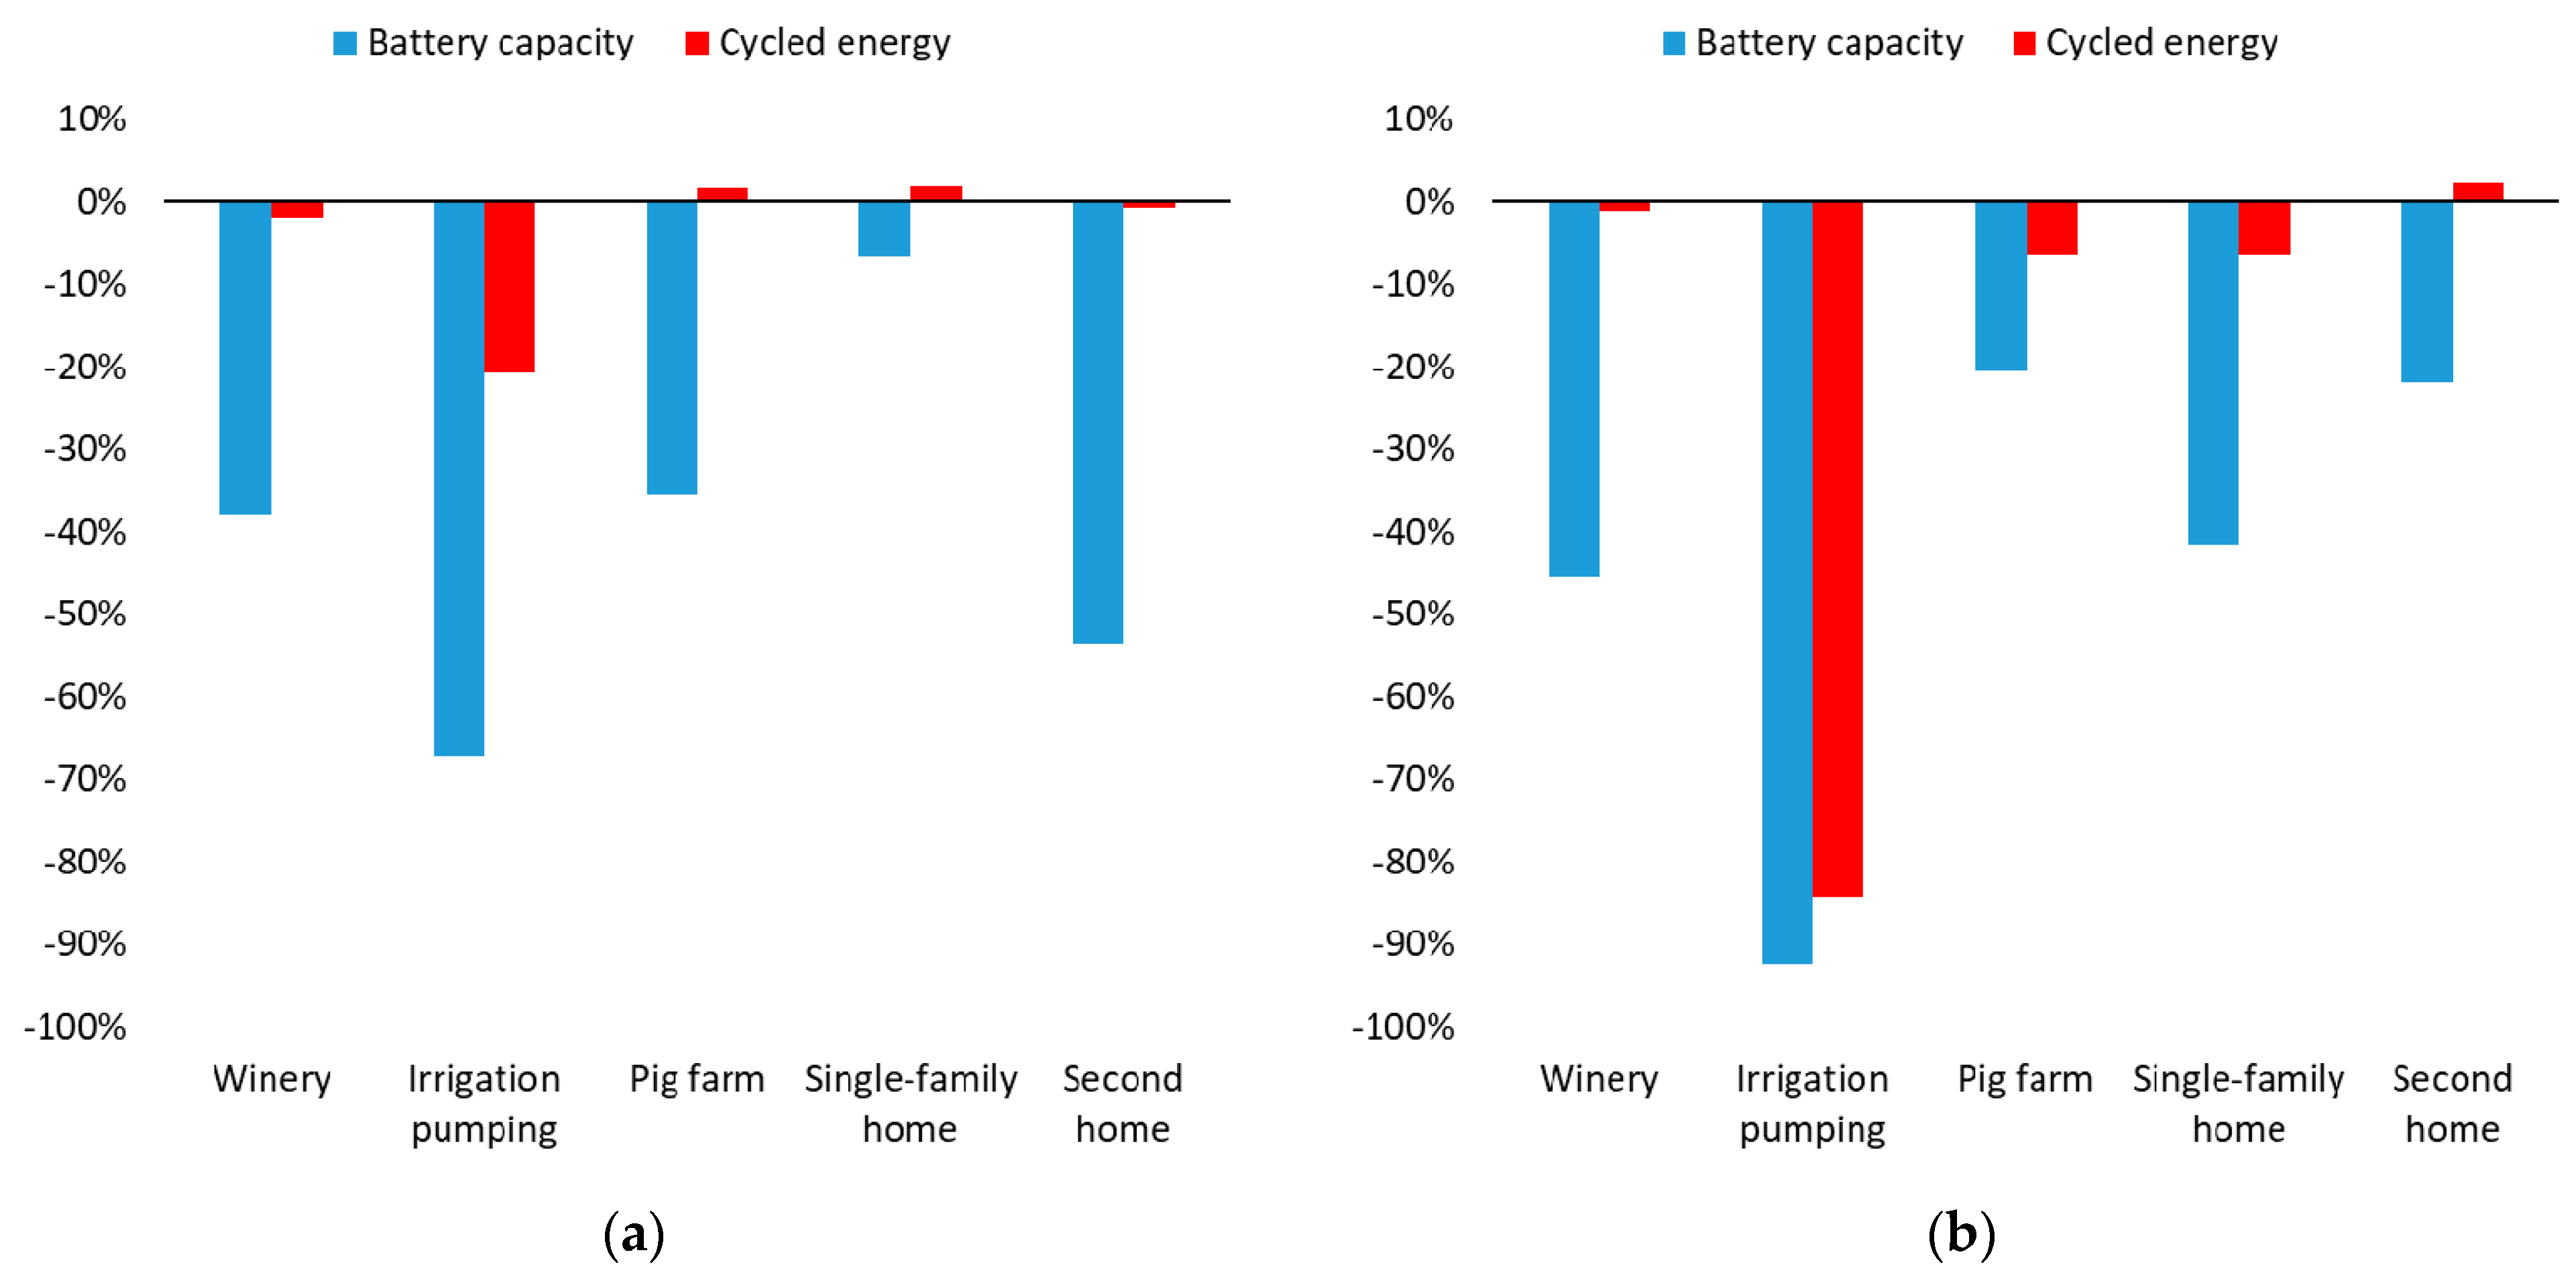
Furthermore, in all cases, the Li-ion battery has lower capacity than the lead-acid battery in their optimum systems. This result is in accordance with a previous study [2] based on the charge and discharge characteristics of both battery types. Differences in capacity range between −7% and −92%. Both longer lifetime and less capacity, play in favor of its profitability. However, in the cases studied, it has not been found that the increase in lifetime or the reduction in capacity is enough for Li-ion batteries to displace lead-acid ones. Moreover, its use entails differences in other costs of the system.
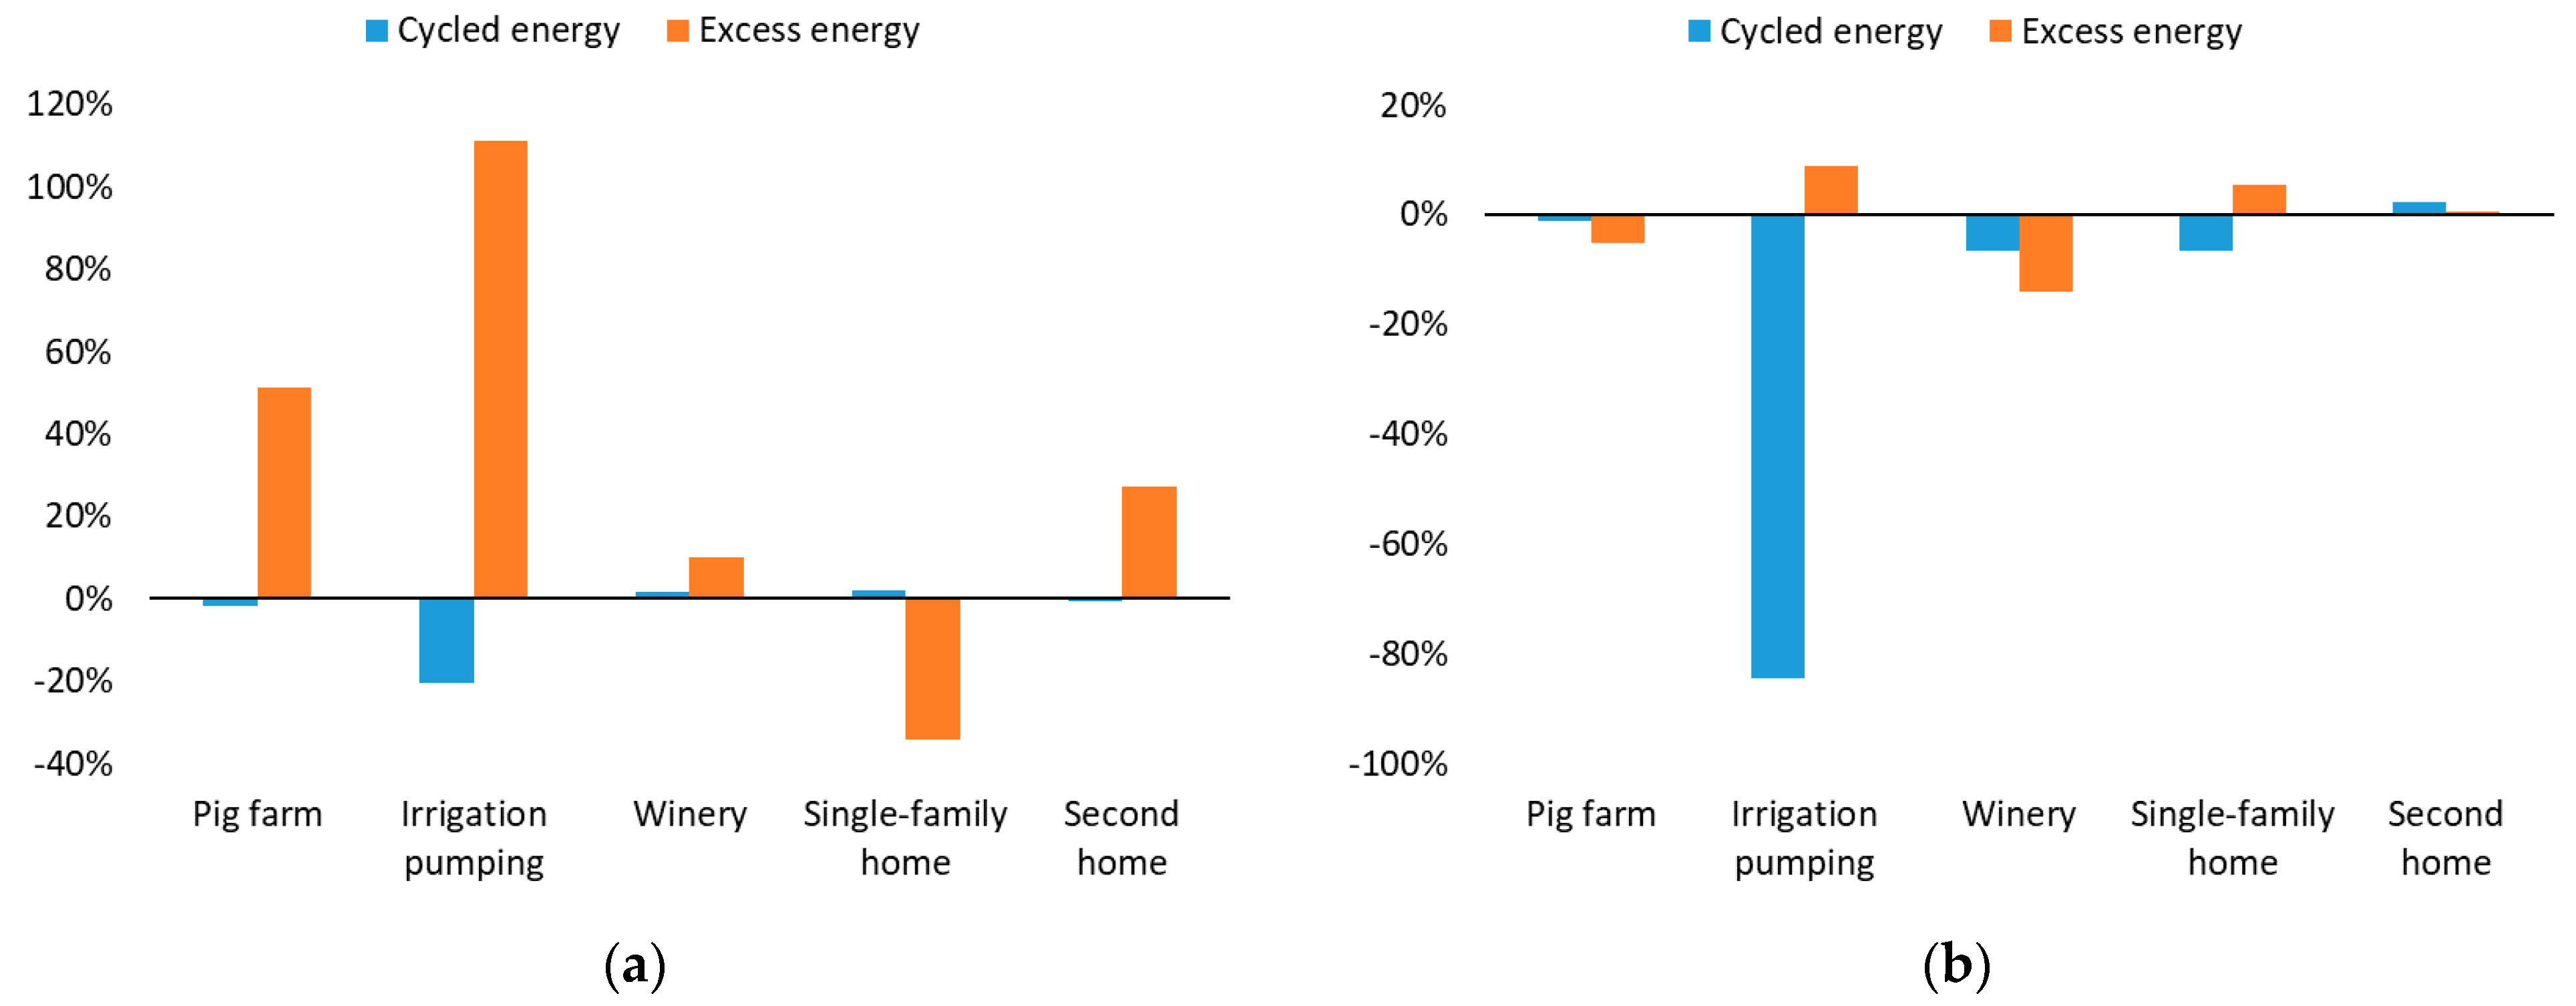
The behaviors observed in PV and hybrid systems show similarities, but relevant differences. In PV systems the battery capacity reductions due to incorporating Li-ion are between −7% and −67%, while in hybrid systems they are between −21% and −92%. These battery capacity reductions are accompanied by changes in generation. In PV systems, the power of PV generator changes, resulting in large changes in the amount of excess energy. On the contrary, in hybrid systems the fuel consumption changes, while the power of the PV generator and the excess energy hardly vary. It should be noted that generation is not always higher when using Li-ion batteries, since in some of the study cases reductions in the power of the PV generator or in fuel consumption have been observed. Furthermore, in four of the five case studies, both in PV and hybrid systems, the amount of energy cycled in the battery has barely changed, despite the changes in battery capacity and generation.
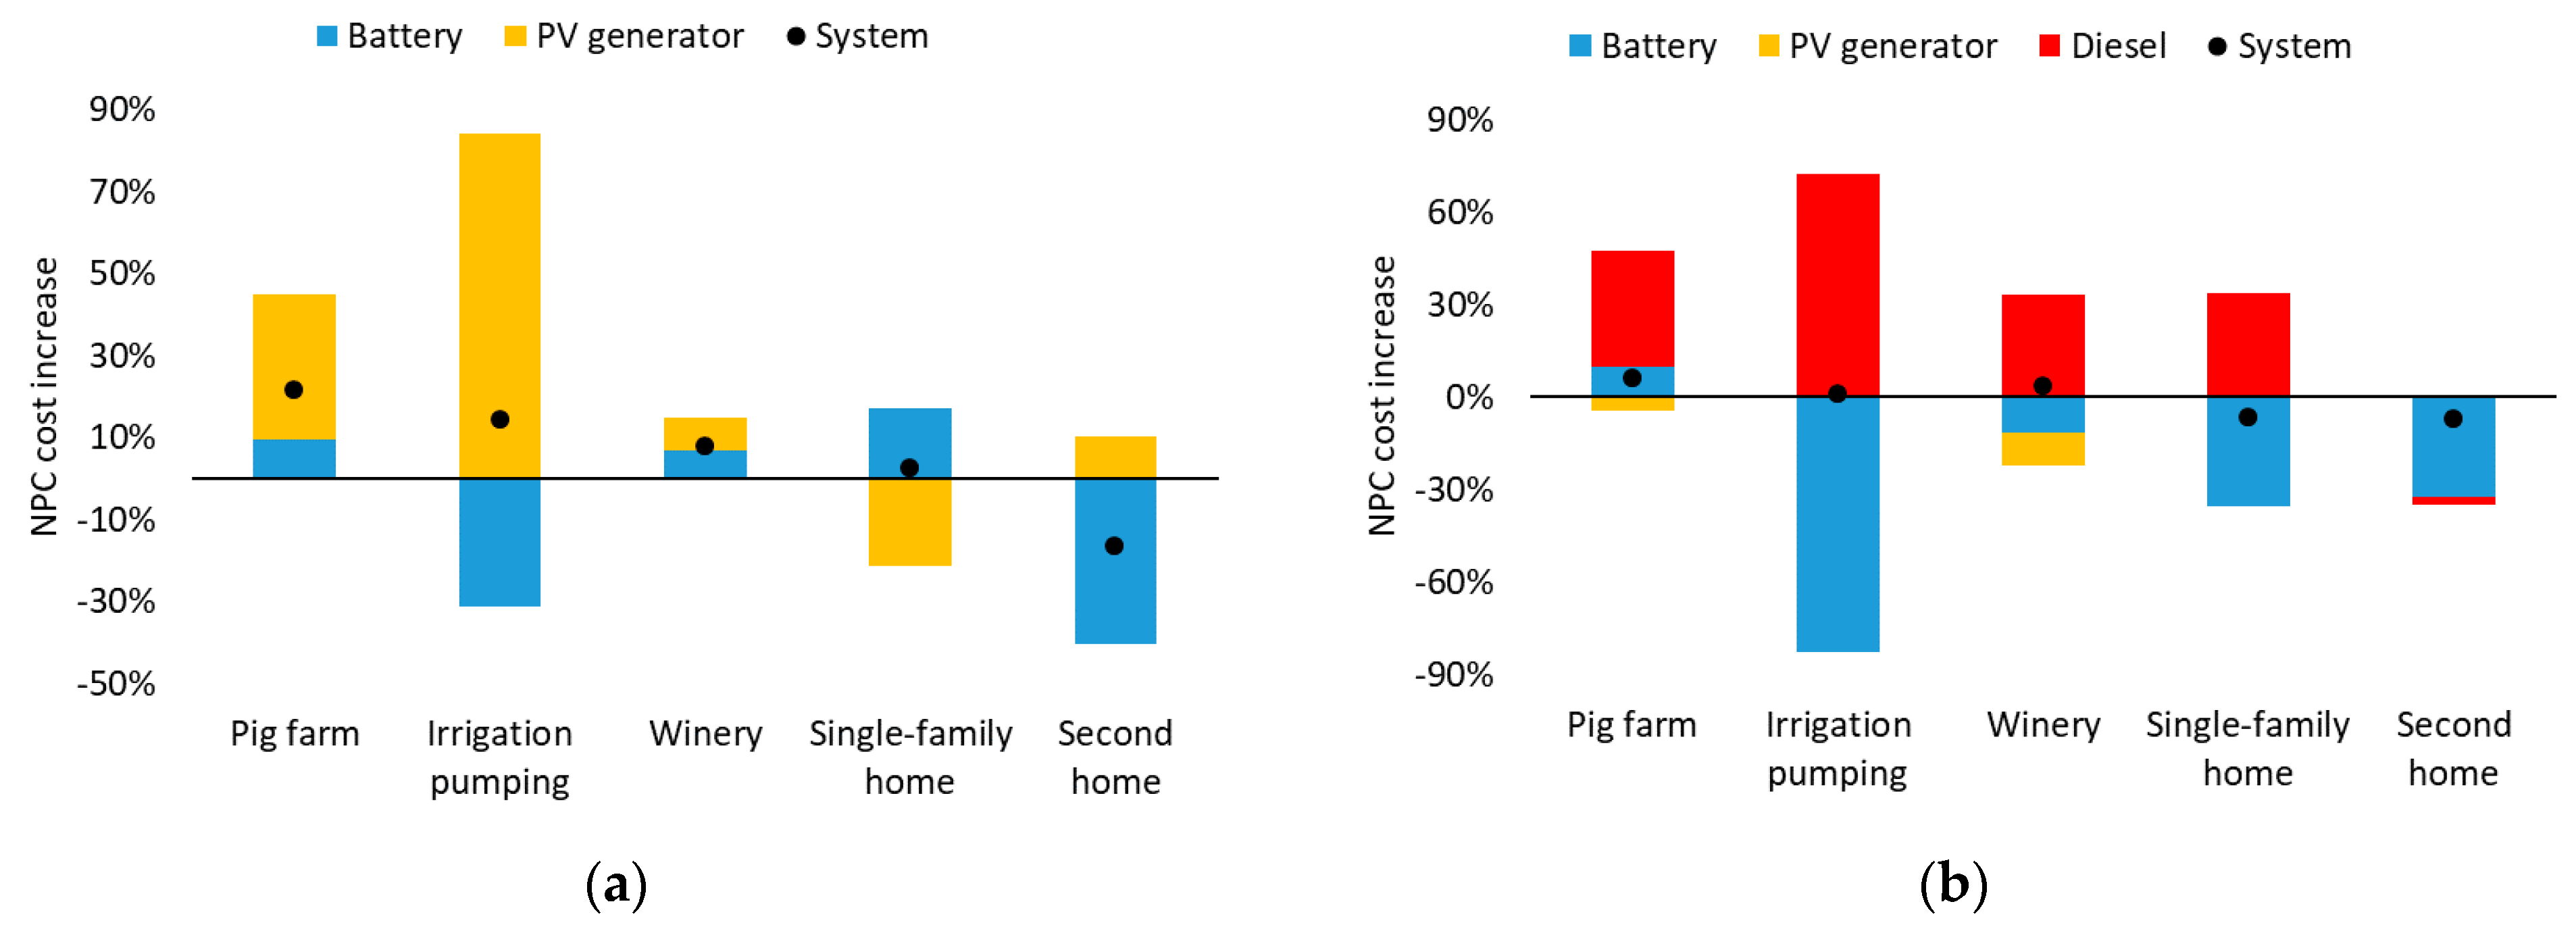
With respect to the economic comparison of the optimum systems with both types of battery in each case, differences are found between the studied cases. In PV systems the differences in NPC range between −16% and + 22%, with the Li-ion battery being the most profitable in one case. This corresponds to the second home. In hybrid systems, the differences in NPC range from −7.2% to + 5.9%, with the Li-ion battery being the most profitable in two cases. These correspond to the two homes studied, the second home and the single-family home. In this sense, new studies are needed on how the demand profile influences the economic performance of both types of battery. To sum up, in terms of cost effectiveness, no single option has been found, as the two types of batteries currently compete closely in standalone renewable energy systems. This is in accordance with other recent studies, taken as a whole, refs. [3,27,28,29,30,31,32] and it poses tougher competition than just three years ago, when Li-ion batteries were too expensive for power supply systems [17].
Regarding differences between PV and hybrid systems, in every one of the study cases, in the hybrid system a more favorable bias has been obtained for the Li-ion battery than in the PV system.
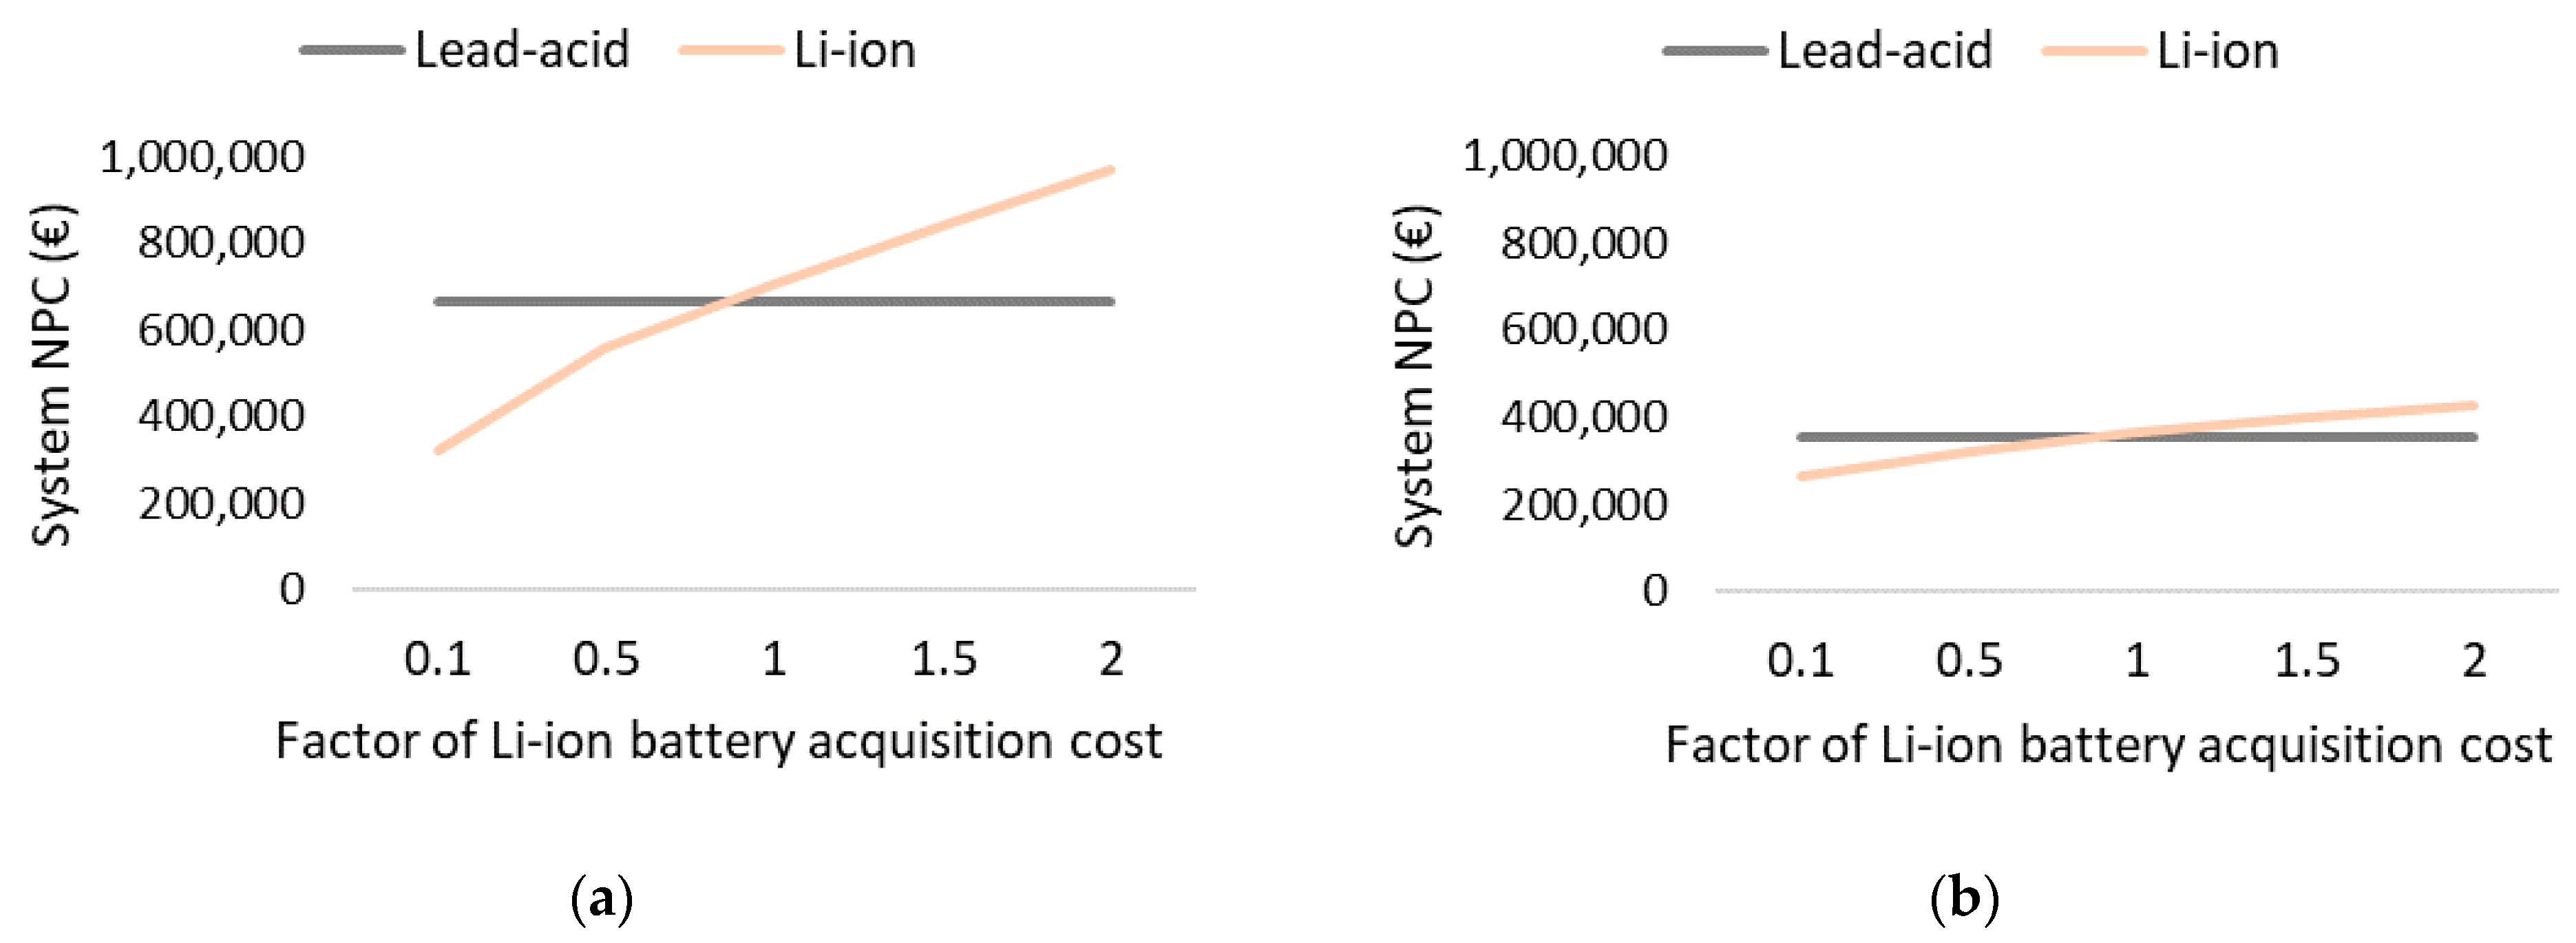
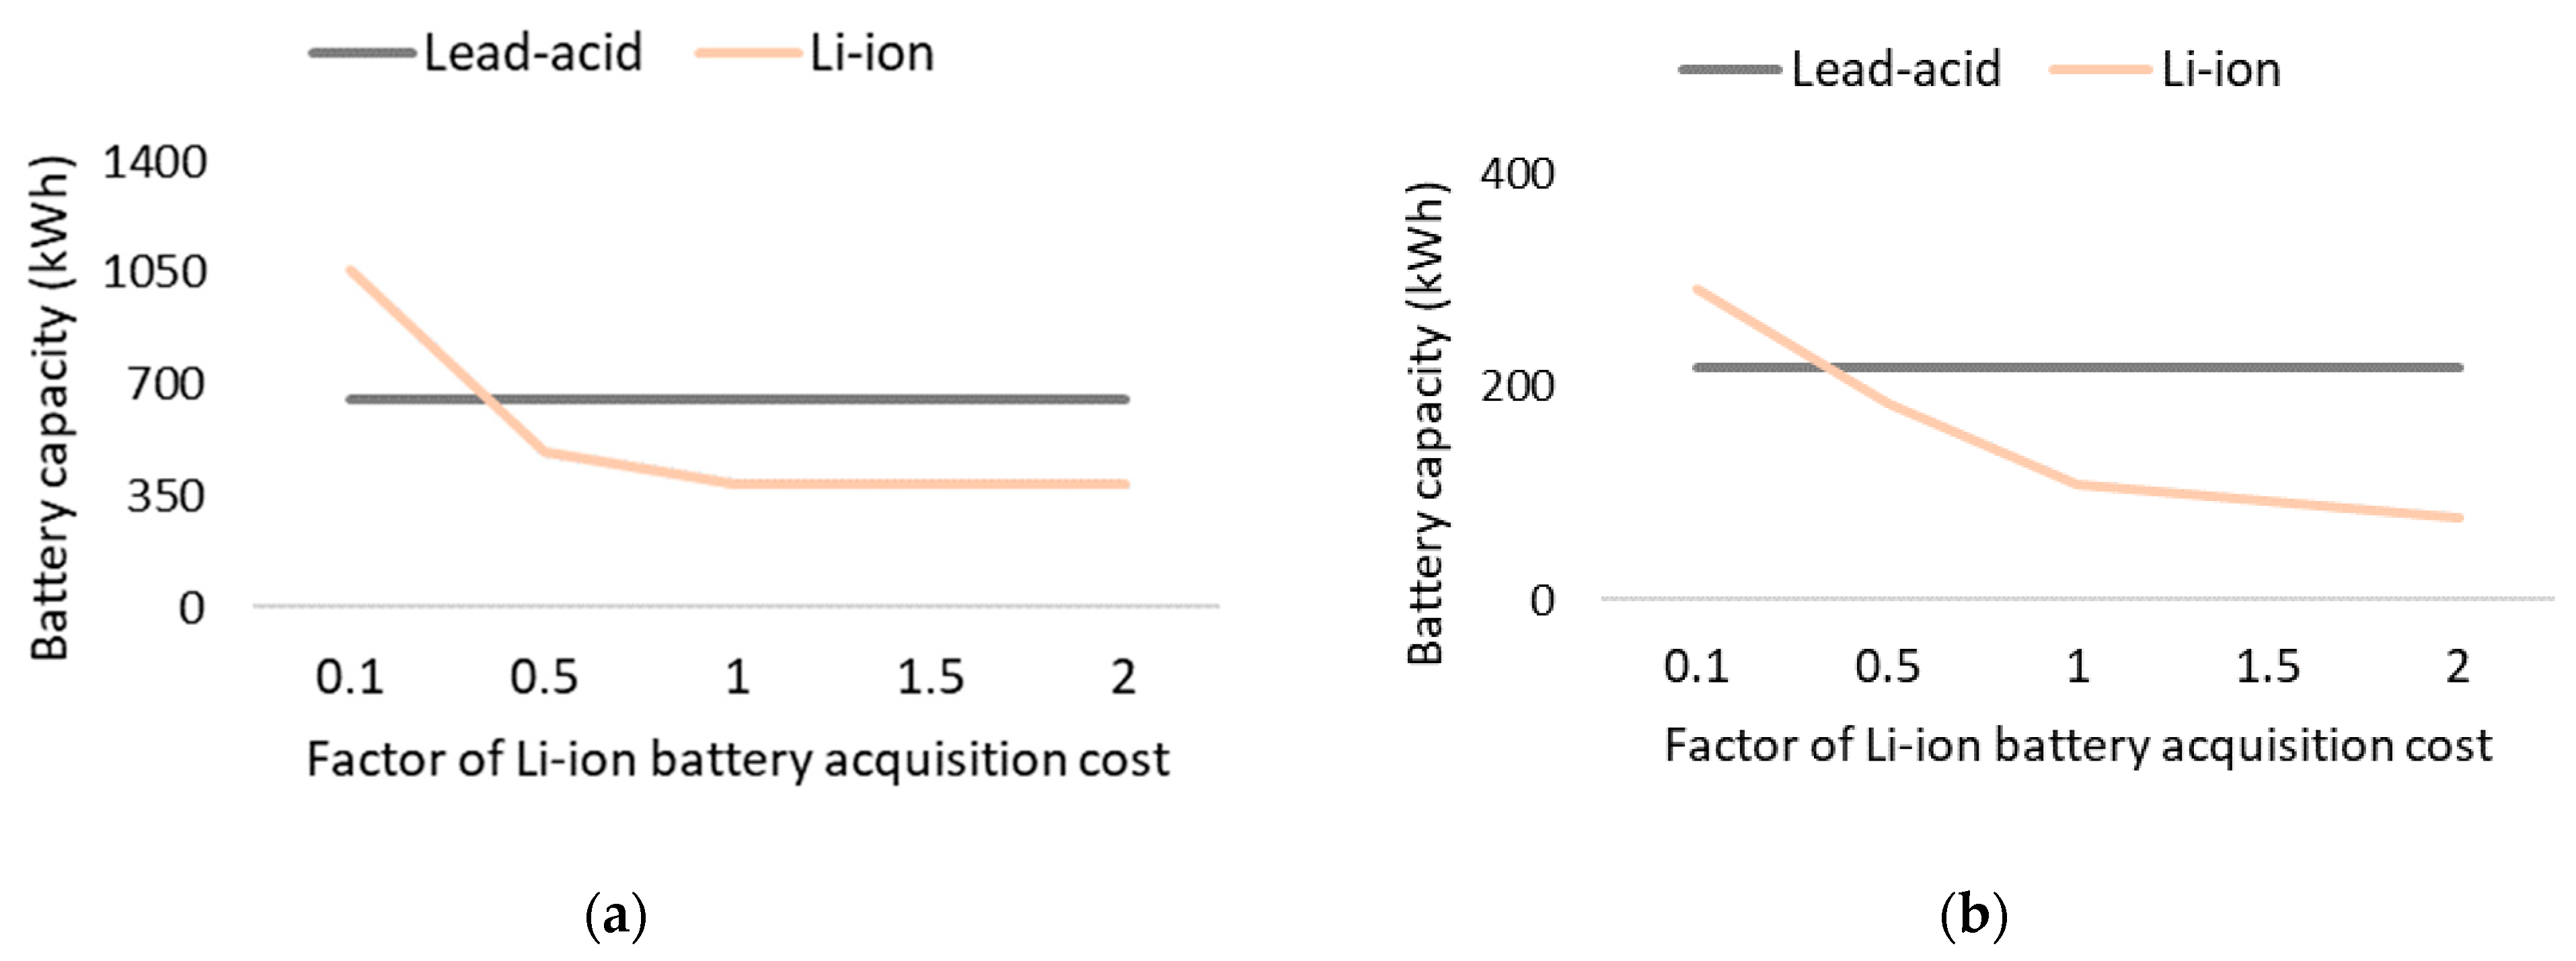
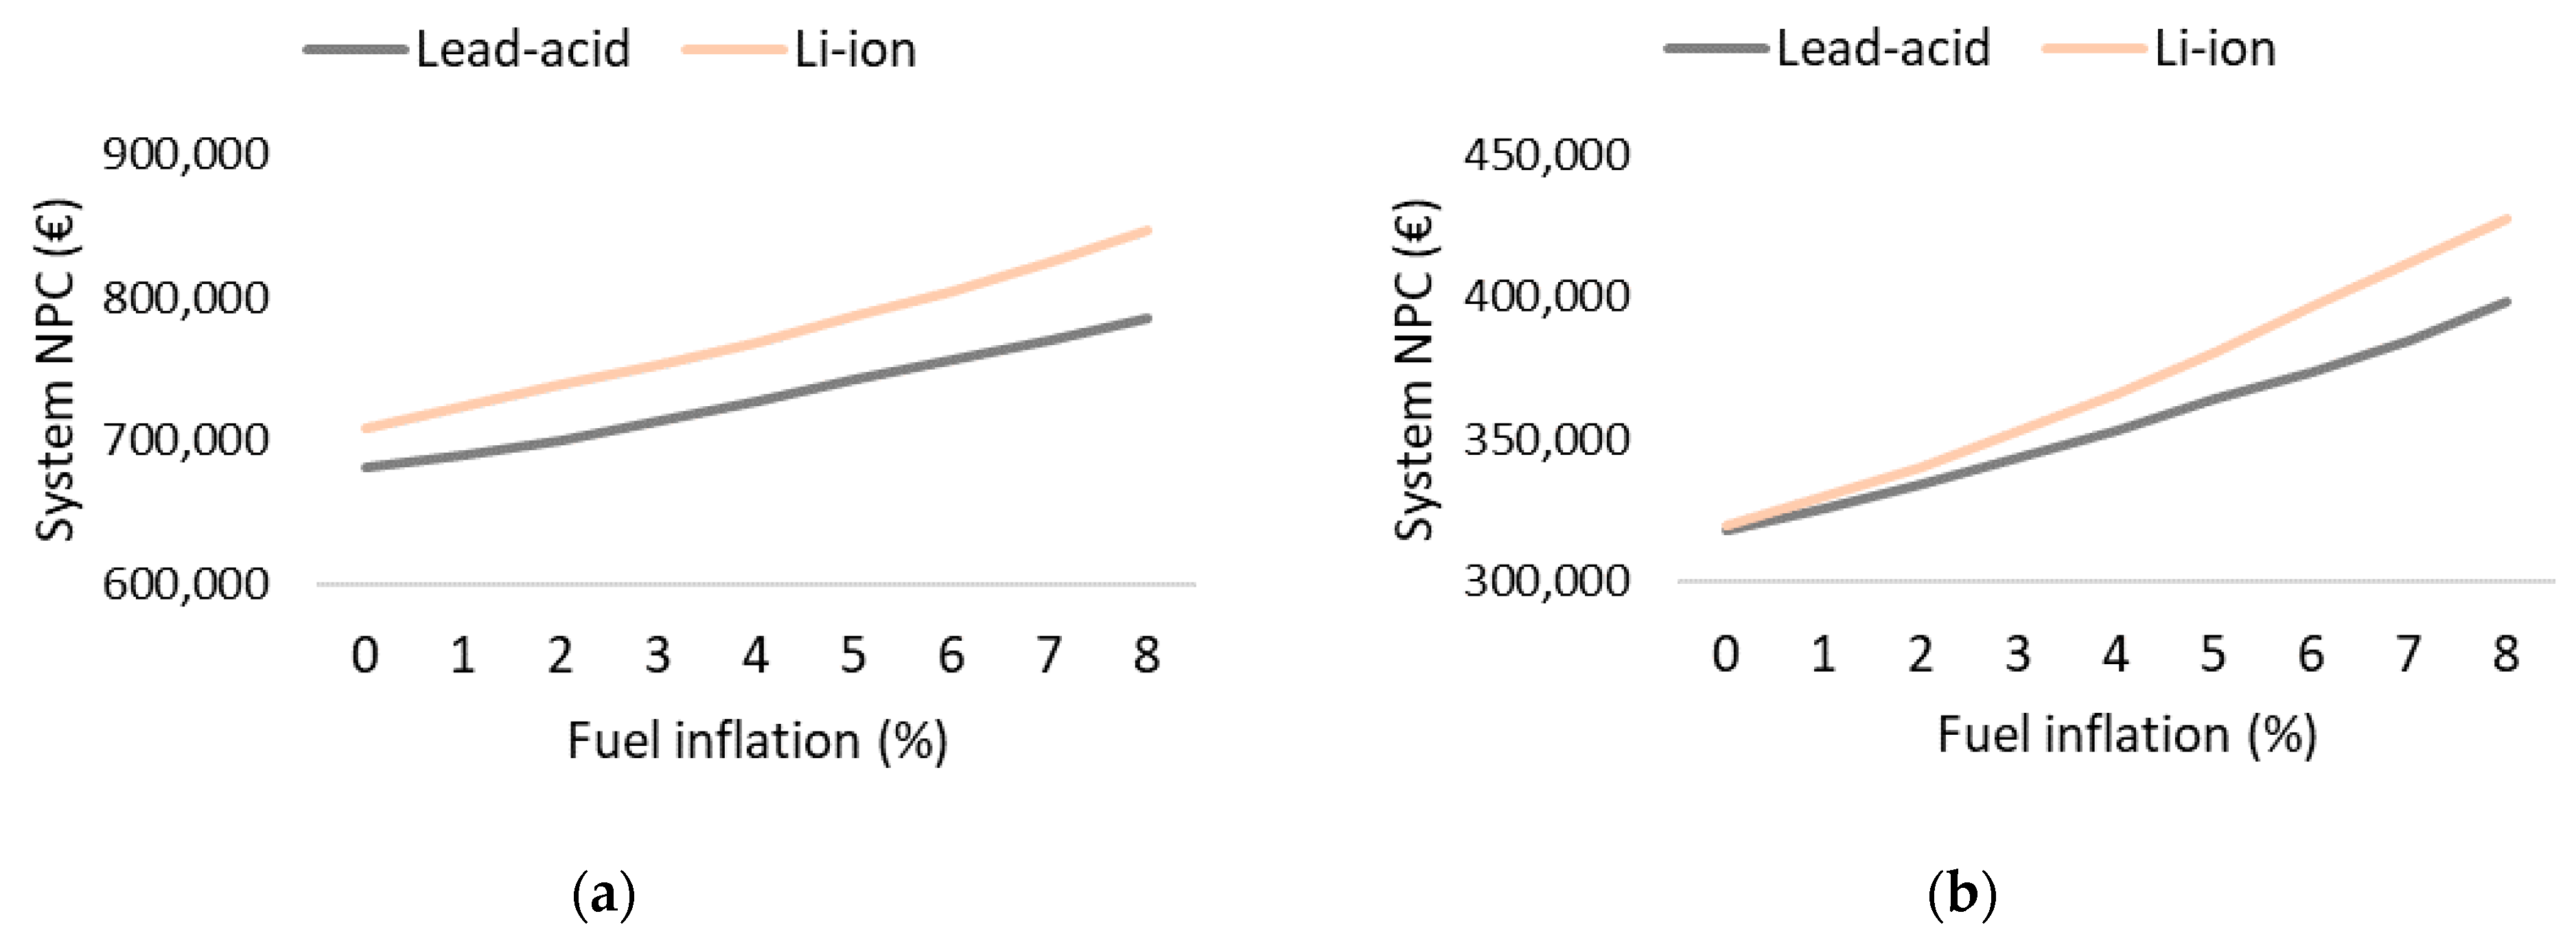
One of the questions of interest is how possible variations in the price of Li-ion batteries are going to affect their profitability, displacing or not lead-acid batteries in standalone renewable energy systems. With the base prices of the study, which correspond to the current market, Li-ion batteries are the option with the lowest NPC in one of the five cases of the PV systems and in two of the hybrid systems, all of them being houses. The analysis has shown a strong sensitivity to the acquisition cost of Li-ion batteries, which with a variation of −21% would be the economically optimal choice (in terms of system NPC) in all hybrid systems studied and with a −36% in all PV systems.
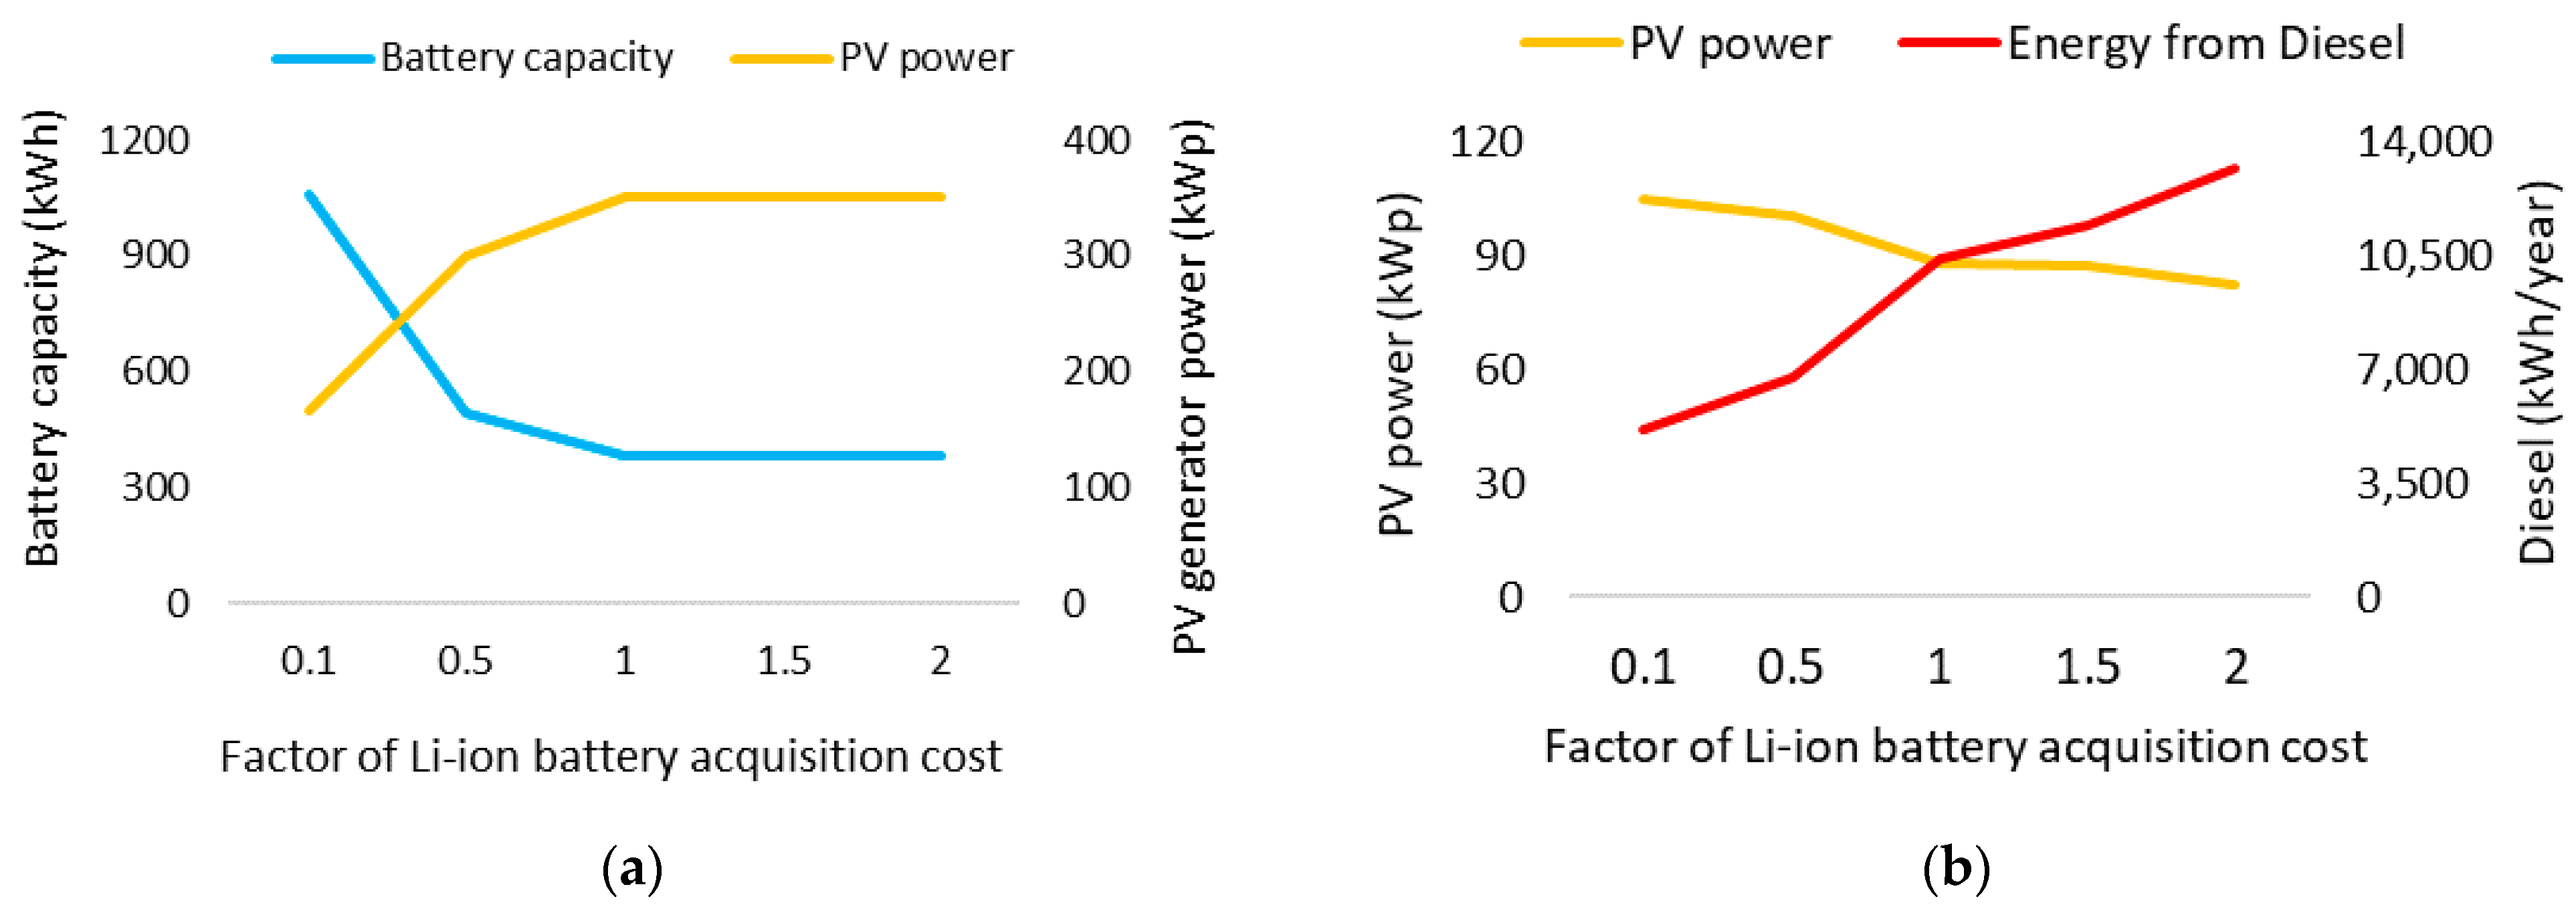
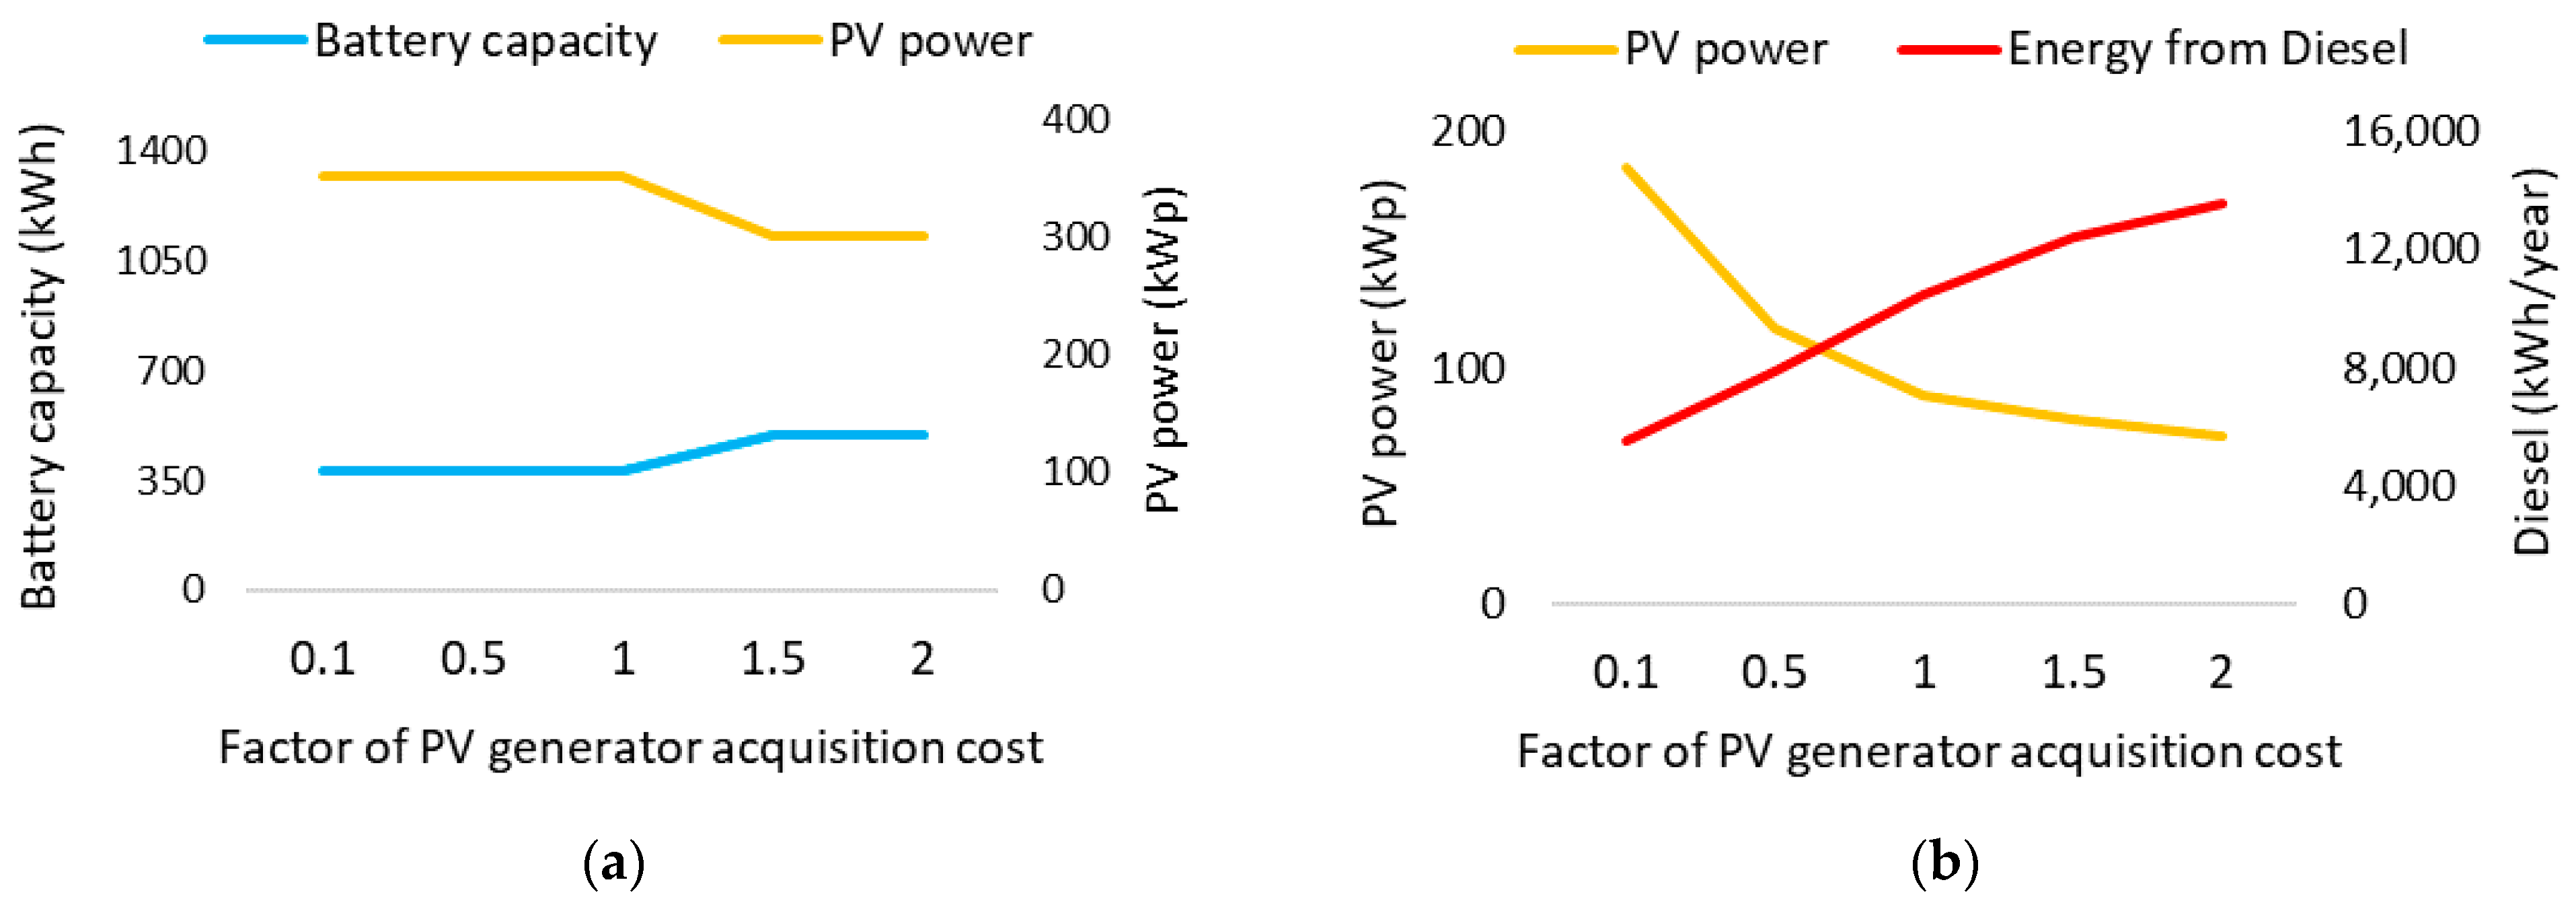
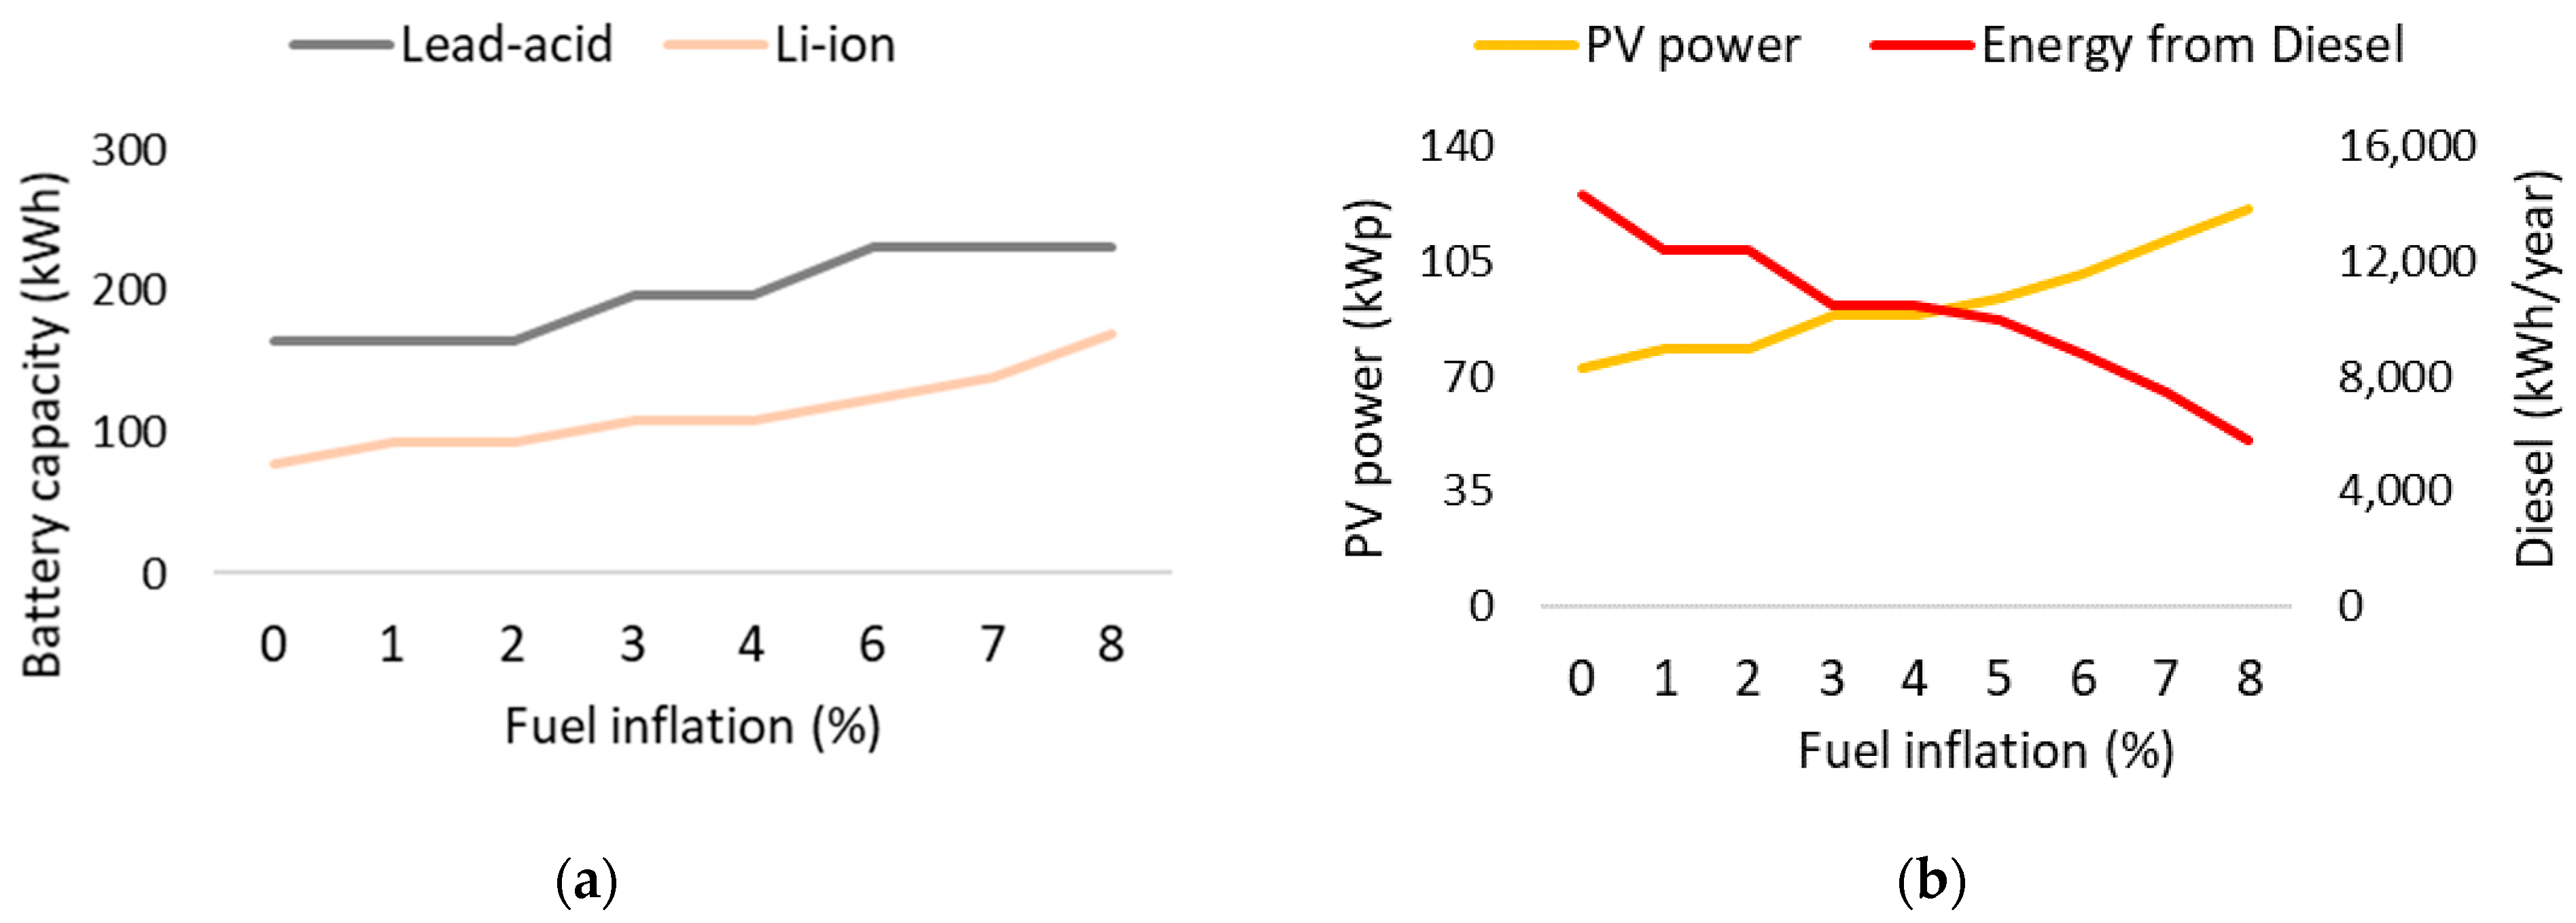
Regarding how variations in the acquisition cost of Li-ion batteries affect the sizing of the economic optimum system, some changes have been observed. In both PV and hybrid systems, the lower the price of Li-ion batteries, the greater the battery capacity. In addition, in optimal PV systems, the lower the price of Li-ion batteries, the lower the power of the PV generator. On the contrary, in optimal hybrid systems, faced with reductions in the price of Li-ion batteries, the power of the PV generator increases slightly while the fuel consumption decreases strongly.
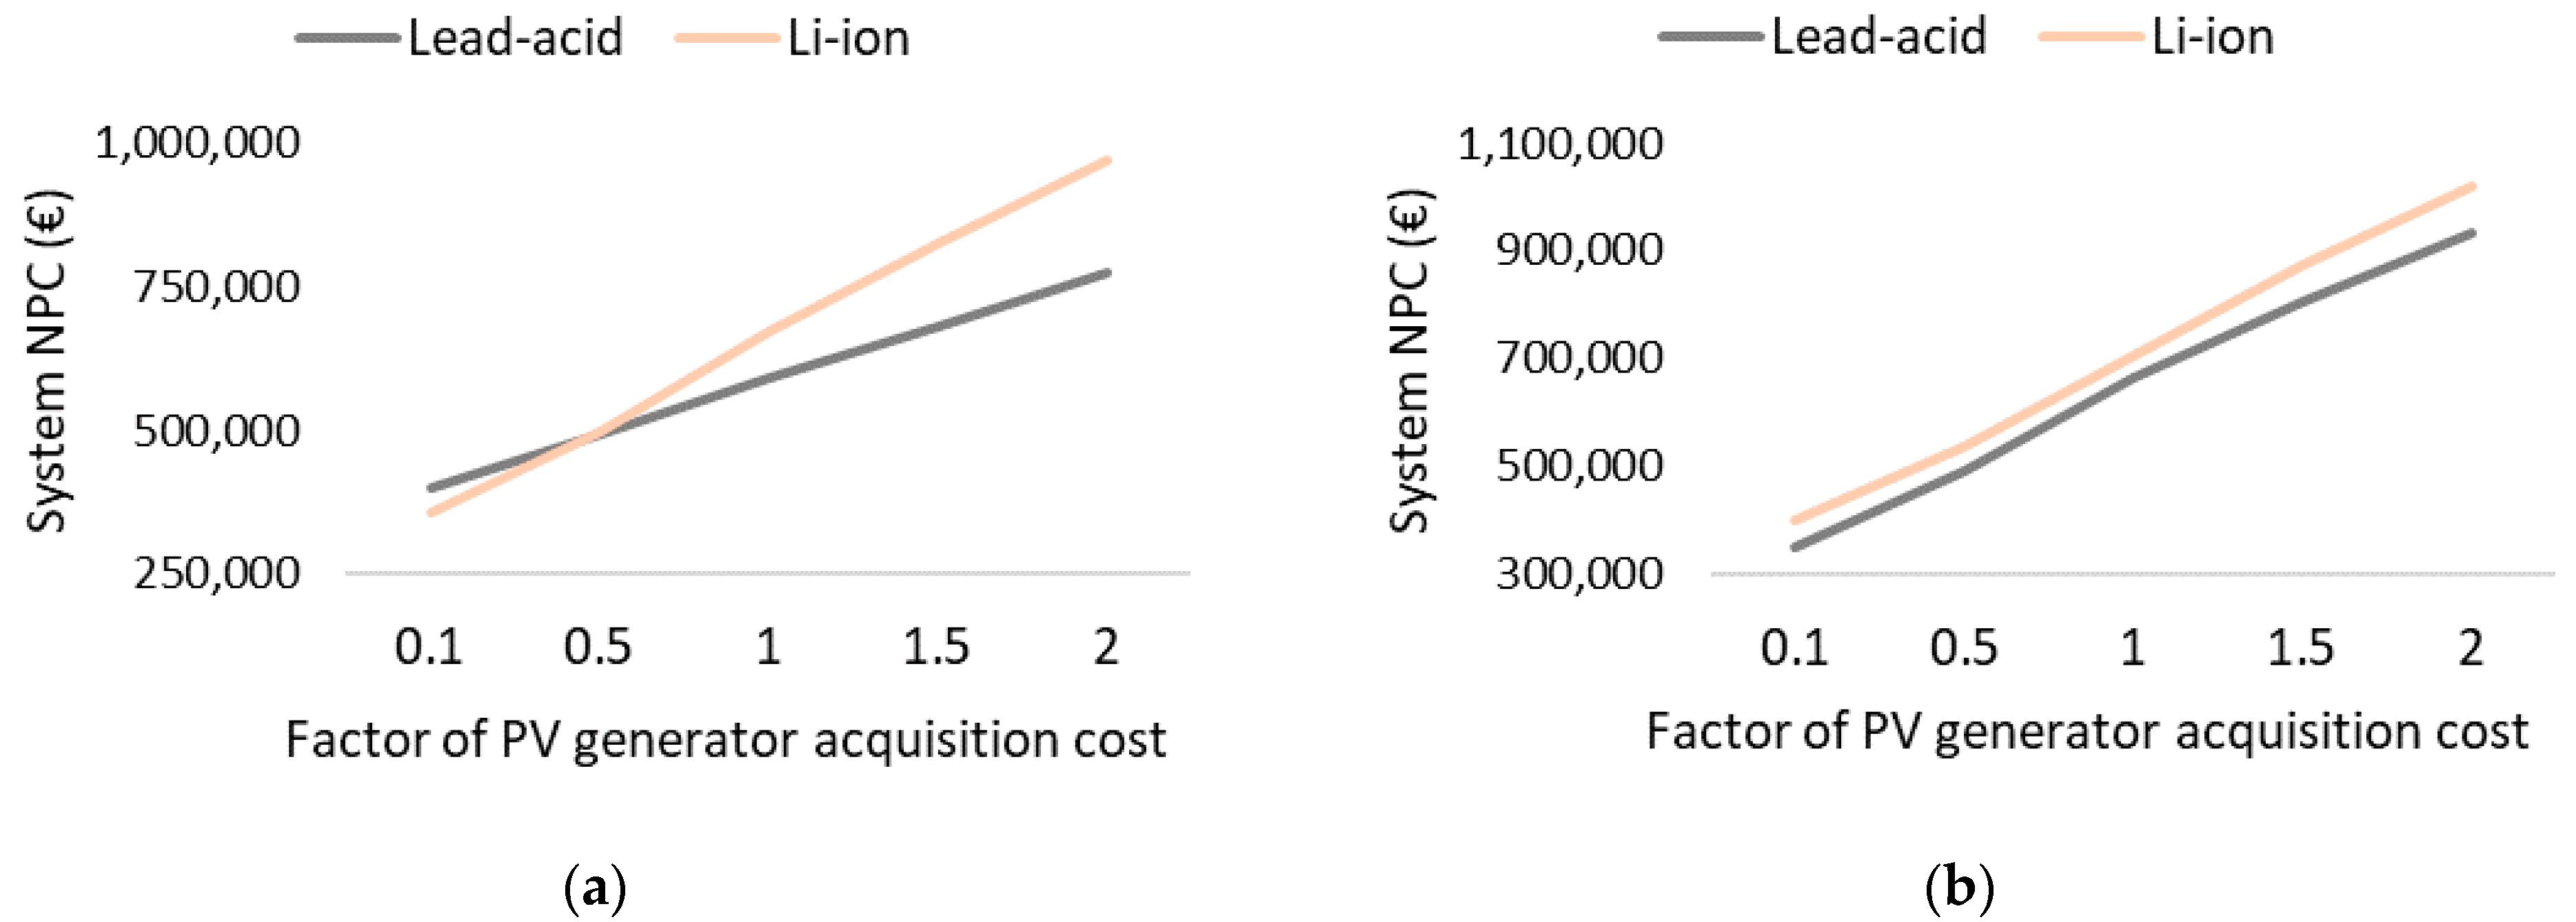
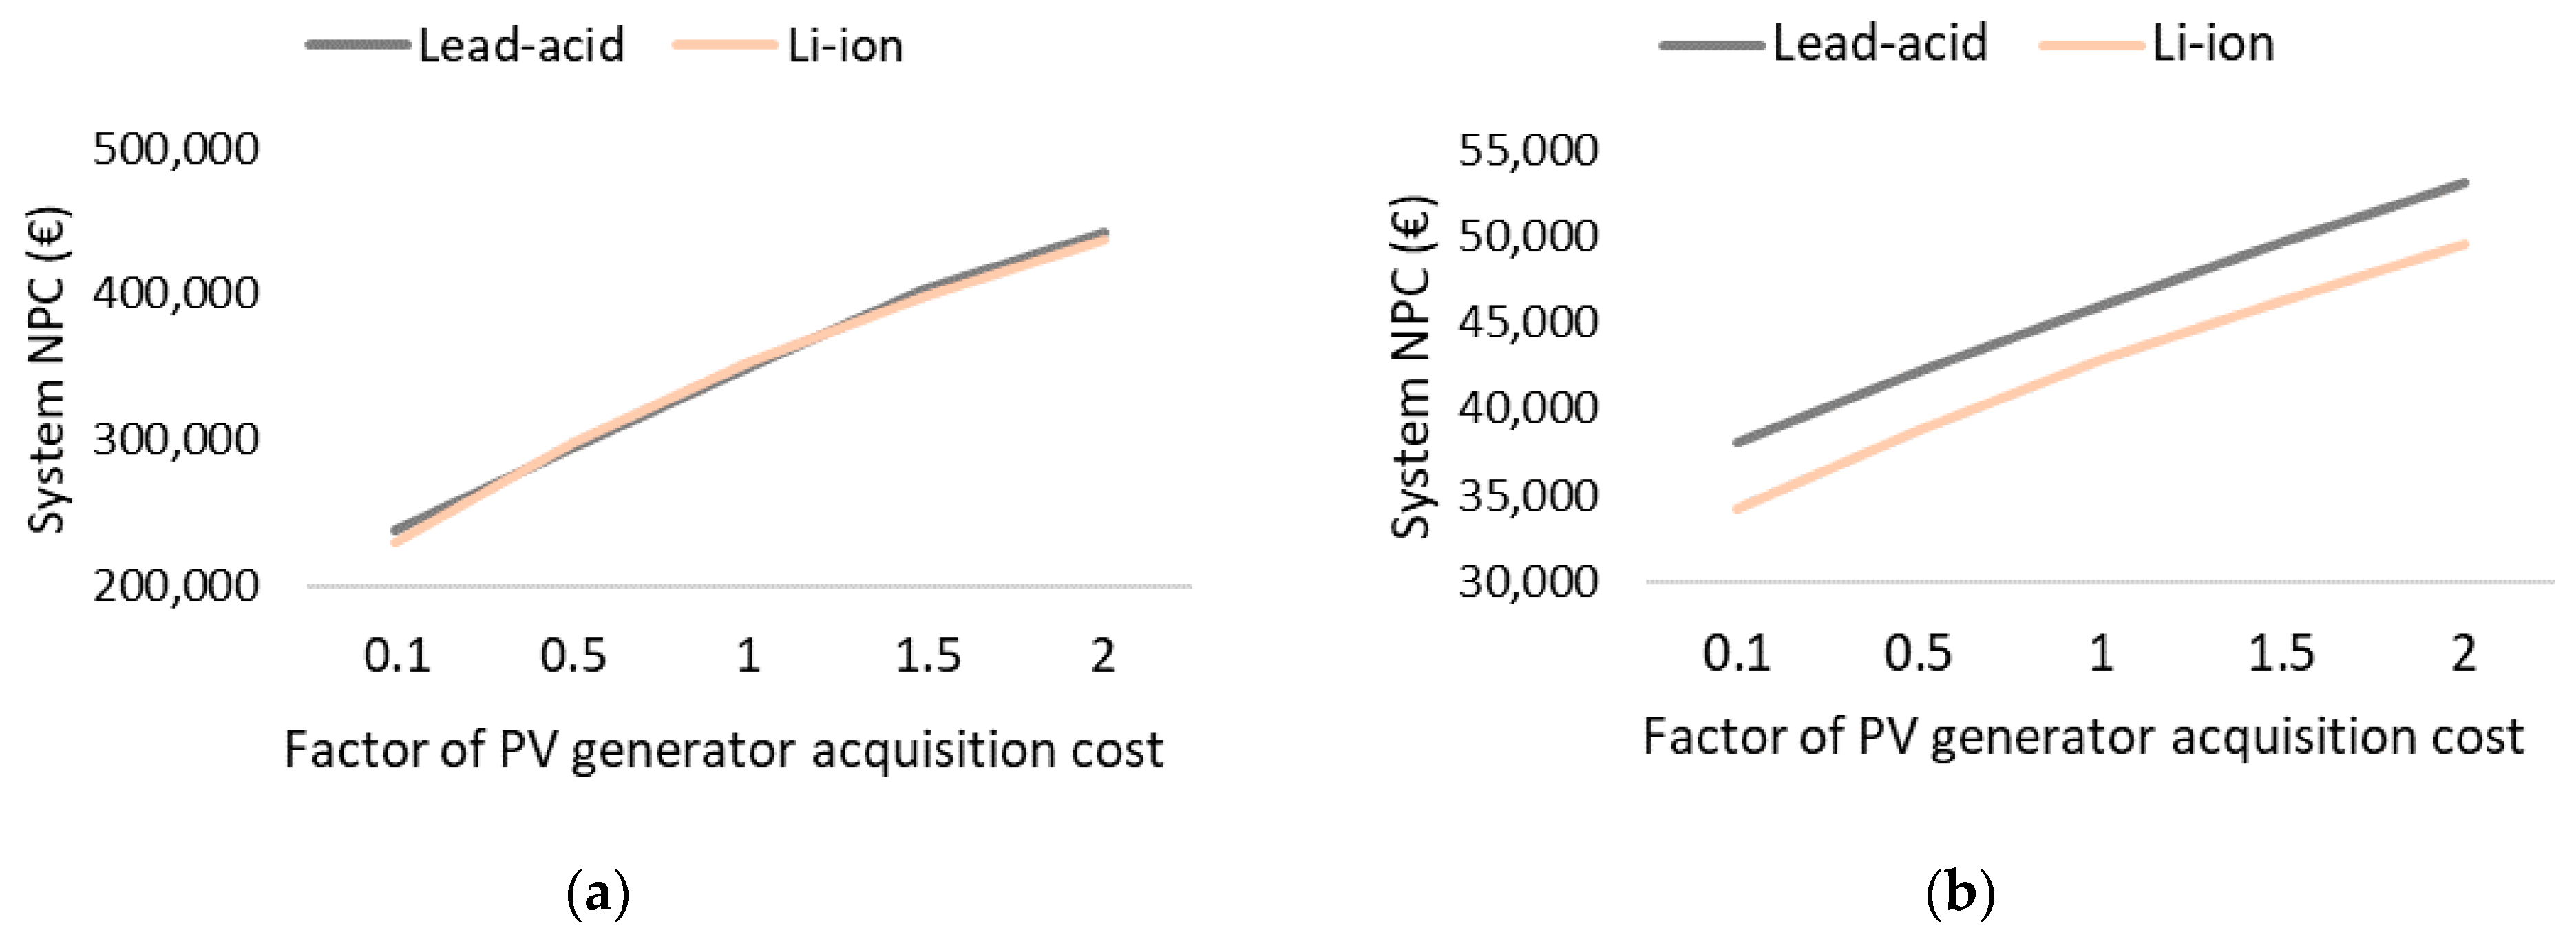
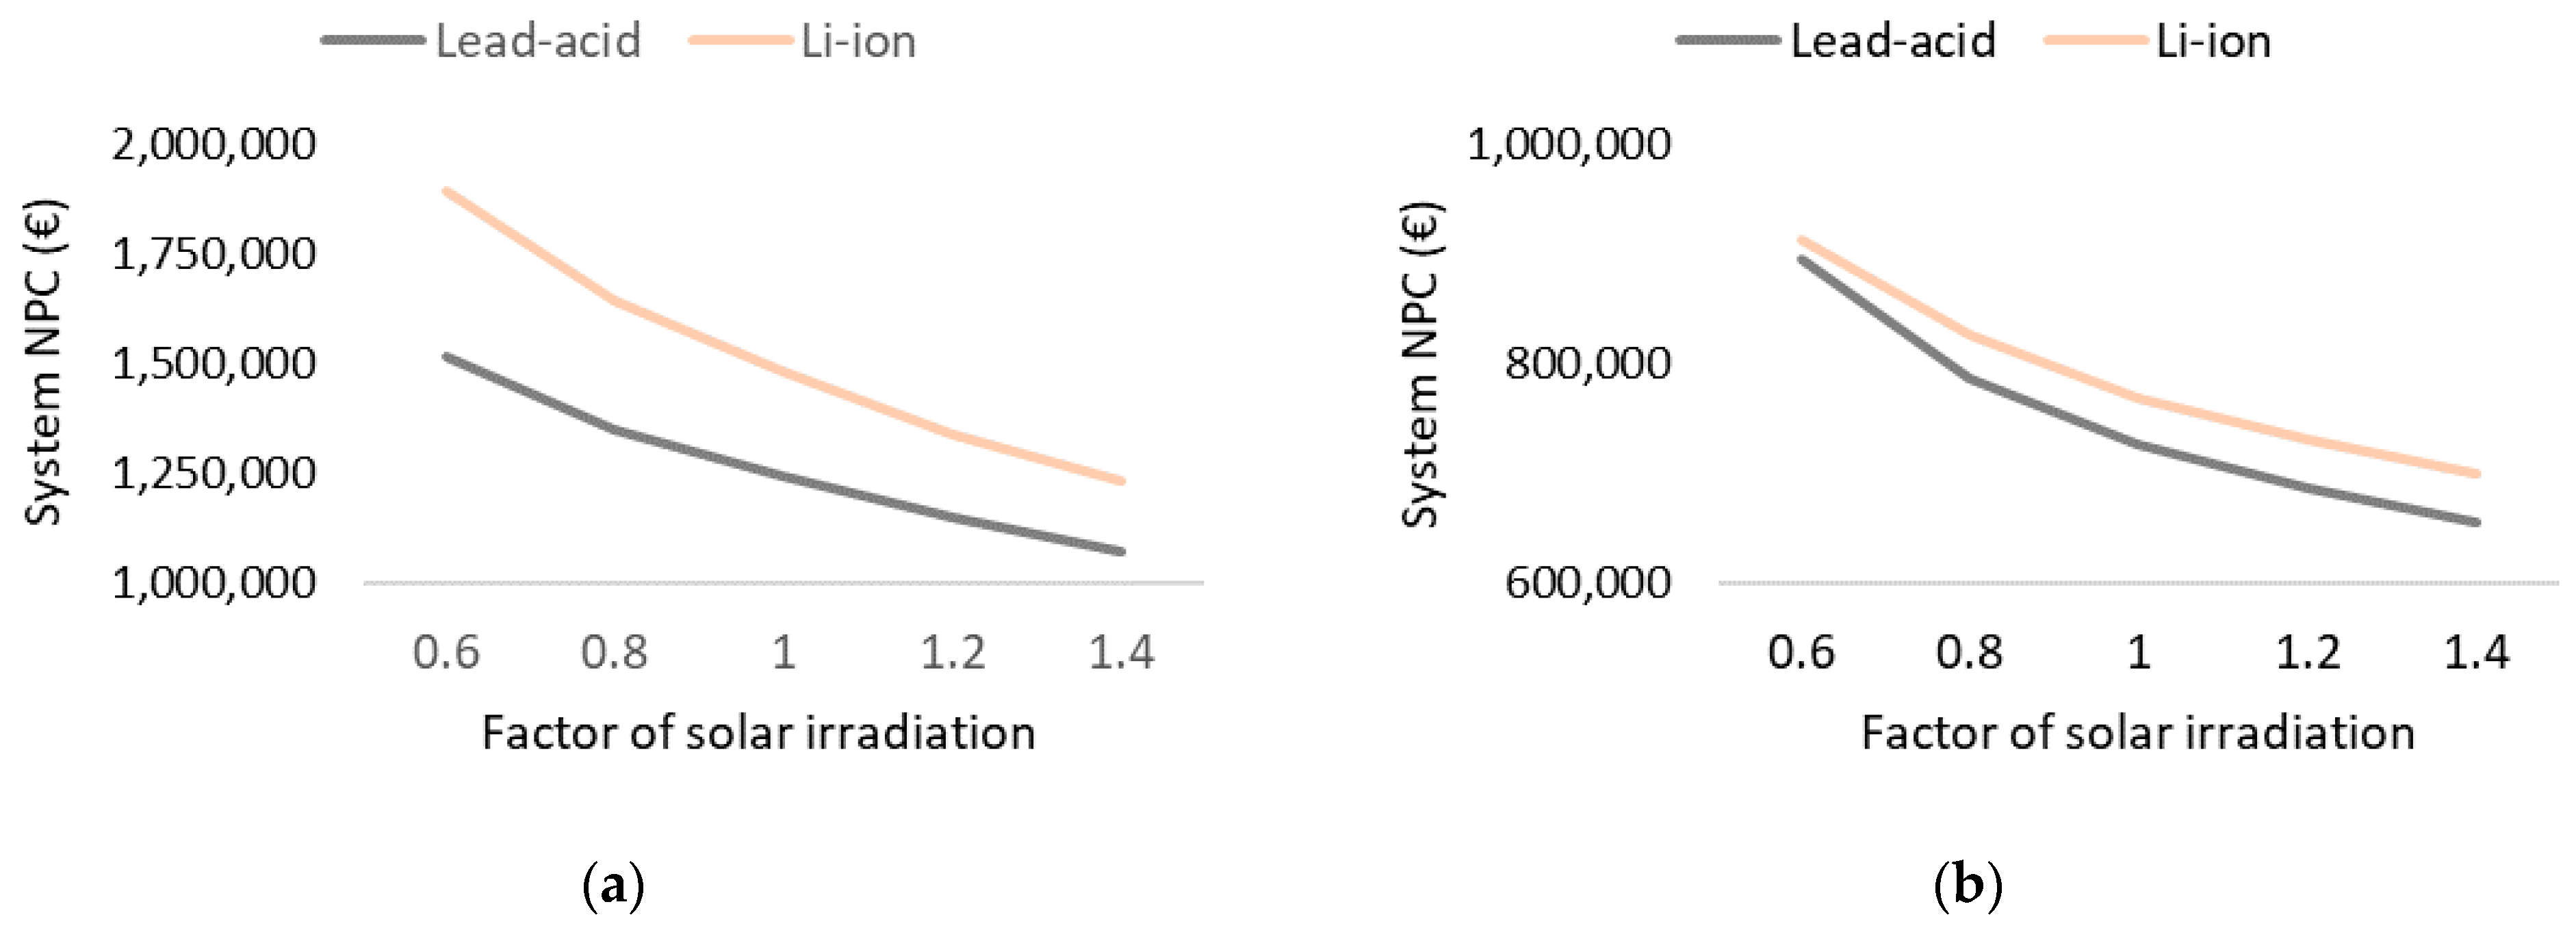
Sensitivity analysis on the acquisition cost of the PV generator elements has shown that its reduction favors profitability of Li-ion batteries in PV systems and practically has no effect over hybrid systems. In these, lower inflation in the fuel price favors profitability of Li-ion batteries. Both reductions in the cost of the source of energy (PV or diesel) cause slight reductions in battery capacity of the optimum systems.

5. Conclusions

This study has addressed the comparison of economic performance of lead-acid and Li-ion batteries in standalone renewable energy systems. For five real case studies, their energy supply has been simulated with a 100% PV system and with another PV-diesel hybrid. The economic optimum in terms of NPC have been sought and sensitivity analyses have been carried out on various parameters.
The results show that for each case, the use of a lead-acid or Li-ion battery results in different dimensions of the economic optimum system. Battery capacity, PV generator power and fuel consumption (in hybrid systems) are affected. As these changes also affect the NPC of the system, the economic studies must consider them.
Regarding the economic comparison, of the ten systems studied (five PV and five hybrids), in three of them the absolute optimum is obtained with Li-ion batteries and in seven with lead-acid batteries. In two of the latter, the differences in NPC are less than or equal to 2%. The differences in system NPC range from −16% to +22% in PV systems and from −7.2% to +5.9% in hybrid systems. On the one hand, the result of the comparison as a whole is virtually a tie. On the other hand, the five case studies produce different results. Furthermore, the results of each case keep similarities between both systems, PV and hybrid, although attenuated by the presence in the latter of a dispatchable generation (the diesel genset), i.e., currently, both lead-acid and Li-ion batteries compete for economic profitability in standalone renewable energy systems. The best choice depends on each case. Possible changes in the acquisition price can cause one or the other type to displace the other in terms of profitability, in a generalized way.
The economic performance of Li-ion batteries, compared to lead-acid ones, is relatively better in hybrid systems than in PV. Greater solar irradiation favors Li-ion batteries in PV systems, but harms them in hybrid systems. In these, it would be favored by lower inflation in fuel prices. Finally, a 21% reduction in the price of Li-ion batteries would make them the economically optimal option in all hybrid cases and if 36% is reached in all PV cases studied.
The limitations of the present study derive from the number of cases studied and their nearby locations. Sensitivity analysis to the magnitude of solar irradiation can be useful in this regard, but other effects of change of location are lacking, such as different temperature data.
More studies are needed to advance in the identification and quantification of the characteristics of each case that influence the economic performance of both types of battery. Models should also be studied to in depth determine the maximum lifetime of Li-ion batteries in standalone renewable energy systems, beyond the design life indicated by the manufacturers.

Author Contributions

Conceptualization, J.C.; methodology, J.C. and C.E.-M.; software, R.D.-L.; validation, L.V. and R.D.-L.; formal analysis, L.V.; investigation, J.C. and C.E.-M.; resources, J.C. and C.E.-M.; data curation, C.E.-M.; writing—original draft preparation, J.C. and R.D.-L.; writing—review and editing, J.C.; visualization, C.E.-M.; supervision, J.C.; project administration, J.C. All authors have read and agreed to the published version of the manuscript.

Funding

This research received no external funding.

Institutional Review Board Statement

Not applicable.

Informed Consent Statement

Not applicable.

Data Availability Statement

Not applicable.

Acknowledgments

The authors thank the owners of the facilities corresponding to the five case studies for allowing access to consumption data.

Conflicts of Interest

The authors declare no conflict of interest.

Appendix A. Components Data

Table A1. PV panel: General characteristics.
ManufacturerModelEfficiencyLifespan
CanadianSolarCS3W18.11%25 year
Table A2. PV panel: STC (Standard Test Conditions) electric parameters.
PmaxVmpImpVocIscNOCTTemp. Coefficient
400 W38.7 V10.34 A47.2 V10.90 A42 °C−0.37%/°C
Table A3. Lead-acid batteries: general characteristics.
ManufacturerModelPositive PlateElectrolyteCapacity RangeSelf-Discharge
HoppeckeOPzSTubularH2SO4 liquid106–3220 Ah3%/month
Table A4. Lead-acid batteries: Lifetime in cycles vs. DOD.
DOD10%20%30%40%50%60%70%80%90%
Cycles13,00075005000380030002500200015001400
Table A5. Li-Ion batteries: general characteristics.
ManufacturerModelCathodeModule CapacitySelf-Discharge [46]
BYDLVSLiFePO43.84 kWh2%/month
LVL15.36 kWh
Table A6. Li-Ion batteries: Lifetime in cycles vs. DOD.
DOD10%20%30%40%50%60%70%80%90%
Cycles48,00024,00016,00012,00096008000686060004500
Table A7. Battery inverters (by-directional): general characteristics.
ManufacturerModelPhaseNominal PowerLifespanCharge Efficiency
SMASI 4.4I3.3 kVA15 year98%
SI 6.0I4.6 kVA
SI 8.0I6.0 kVA
SI 8.0 clusterIII18 kVA
SI 8.0 multiclusterIII36–90 kVA
Table A8. Battery inverters (by-directional): inverter efficiency vs. power output.
Power (%)02345102030405060708090100
Efficiency (%)103050708593949494949393939292
Table A9. AC Generators: general characteristics.
ManufacturerNominal PowerCostO&M CostA 1B 1Lifespan
Generic1.9–82 kVA800–14,000 € 0.14–0.42 €/h0.2460.0814510,000 h
1 Fuel consumption (L/h) = Nominal power × B + Output power × A.

References

  1. Salas, V.; Suponthana, W.; Salas, R.A.A. Overview of the off-grid photovoltaic diesel batteries systems with AC loads. Appl. Energy 2015, 157, 195–216. [Google Scholar] [CrossRef]
  2. Krieger, E.M.; Cannarella, J.; Arnold, C.B. A comparison of lead-acid and lithium-based battery behavior and capacity fade in off-grid renewable charging applications. Energy 2013, 60, 492–500. [Google Scholar] [CrossRef]
  3. García-Vera, Y.E.; Dufo-López, R.; Bernal-Agustín, J.L. Optimization of isolated hybrid microgrids with renewable energy based on different battery models and technologies. Energies 2020, 13, 581. [Google Scholar] [CrossRef] [Green Version]
  4. Anoune, K.; Bouya, M.; Astito, A.; Abdellah, A. Ben Sizing methods and optimization techniques for PV-wind based hybrid renewable energy system: A review. Renew. Sustain. Energy Rev. 2018, 93, 652–673. [Google Scholar] [CrossRef]
  5. Sinha, S.; Chandel, S.S. Review of recent trends in optimization techniques for solar photovoltaic-wind based hybrid energy systems. Renew. Sustain. Energy Rev. 2015, 50, 755–769. [Google Scholar] [CrossRef]
  6. Eriksson, E.L.V.; Gray, E.M.A. Optimization of renewable hybrid energy systems—A multi-objective approach. Renew. Energy 2019, 133, 971–999. [Google Scholar] [CrossRef]
  7. Dufo-López, R.; Bernal-Agustín, J.L.; Yusta-Loyo, J.M.; Domínguez-Navarro, J.A.; Ramírez-Rosado, I.J.; Lujano, J.; Aso, I.; Lujano-Rojas, J.M.; Aso, I.; Lujano, J.; et al. Multi-objective optimization minimizing cost and life cycle emissions of stand-alone PV-wind-diesel systems with batteries storage. Appl. Energy 2011, 88, 4033–4041. [Google Scholar] [CrossRef]
  8. Sinha, S.; Chandel, S.S. Review of software tools for hybrid renewable energy systems. Renew. Sustain. Energy Rev. 2014, 32, 192–205. [Google Scholar] [CrossRef]
  9. Svoboda, V.; Wenzl, H.; Kaiser, R.; Jossen, A.; Baring-Gould, I.; Manwell, J.; Lundsager, P.; Bindner, H.; Cronin, T.; Nørgård, P.; et al. Operating conditions of batteries in off-grid renewable energy systems. Sol. Energy 2007, 81, 1409–1425. [Google Scholar] [CrossRef]
  10. Lujano-Rojas, J.M.; Dufo-López, R.; Atencio-Guerra, J.L.; Rodrigues, E.M.G.; Bernal-Agustín, J.L.; Catalão, J.P.S. Operating conditions of lead-acid batteries in the optimization of hybrid energy systems and microgrids. Appl. Energy 2016, 179, 590–600. [Google Scholar] [CrossRef]
  11. Dufo-López, R.; Lujano-Rojas, J.M.; Bernal-Agustín, J.L. Comparison of different lead–acid battery lifetime prediction models for use in simulation of stand-alone photovoltaic systems. Appl. Energy 2014, 115, 242–253. [Google Scholar] [CrossRef]
  12. Schiffer, J.; Sauer, D.U.; Bindner, H.; Cronin, T.; Lundsager, P.; Kaiser, R. Model prediction for ranking lead-acid batteries according to expected lifetime in renewable energy systems and autonomous power-supply systems. J. Power Sources 2007, 168, 66–78. [Google Scholar] [CrossRef]
  13. Dufo-López, R. iHOGA (Improved Hybrid Optimization by Genetic Algorithms) Software. Available online: https://ihoga.unizar.es/en/ (accessed on 28 July 2018).
  14. Shepherd, C.M. Design of primary and secondary cells II. An equation describing battery discharge. J. Electrochem. Soc. 1965, 112, 657. [Google Scholar] [CrossRef]
  15. Lander, J. Further studies on the anodic corrosion of lead in H2SO4 solutions. J. Electrochem. Soc. 1956, 103, 1–8. [Google Scholar] [CrossRef]
  16. Armand, M.; Axmann, P.; Bresser, D.; Copley, M.; Edström, K.; Ekberg, C.; Guyomard, D.; Lestriez, B.; Novák, P.; Petranikova, M.; et al. Lithium-ion batteries—Current state of the art and anticipated developments. J. Power Sources 2020, 479, 228708. [Google Scholar] [CrossRef]
  17. Zubi, G.; Dufo-López, R.; Carvalho, M.; Pasaoglu, G. The lithium-ion battery: State of the art and future perspectives. Renew. Sustain. Energy Rev. 2018, 89, 292–308. [Google Scholar] [CrossRef]
  18. Argyrou, M.C.; Christodoulides, P.; Kalogirou, S.A. Energy storage for electricity generation and related processes: Technologies appraisal and grid scale applications. Renew. Sustain. Energy Rev. 2018, 94, 804–821. [Google Scholar] [CrossRef]
  19. Astaneh, M.; Roshandel, R.; Dufo-López, R.; Bernal-Agustín, J.L. A novel framework for optimization of size and control strategy of lithium-ion battery based off-grid renewable energy systems. Energy Convers. Manag. 2018, 175, 99–111. [Google Scholar] [CrossRef]
  20. Jafari, M.; Khan, K.; Gauchia, L. Deterministic models of Li-ion battery aging: It is a matter of scale. J. Energy Storage 2018, 20, 67–77. [Google Scholar] [CrossRef]
  21. Astaneh, M.; Dufo-López, R.; Roshandel, R.; Bernal-Agustin, J.L. A novel lifetime prediction method for lithium-ion batteries in the case of stand-alone renewable energy systems. Int. J. Electr. Power Energy Syst. 2018, 103, 115–126. [Google Scholar] [CrossRef]
  22. Rechkemmer, S.K.; Zang, X.; Zhang, W.; Sawodny, O. Empirical Li-ion aging model derived from single particle model. J. Energy Storage 2019, 21, 773–786. [Google Scholar] [CrossRef]
  23. Cortés-Arcos, T.; Dufo-López, R.; Bernal-Agustín, J.L. Estimating degradation costs for non-cyclic usage of lithium-ion batteries. Appl. Sci. 2020, 10, 5330. [Google Scholar] [CrossRef]
  24. Wang, J.; Liu, P.; Hicks-Garner, J.; Sherman, E.; Soukiazian, S.; Verbrugge, M.; Tataria, H.; Musser, J.; Finamore, P. Cycle-life model for graphite-LiFePO4 cells. J. Power Sources 2011, 196, 3942–3948. [Google Scholar] [CrossRef]
  25. Petit, M.; Prada, E.; Sauvant-Moynot, V. Development of an empirical aging model for Li-ion batteries and application to assess the impact of Vehicle-to-Grid strategies on battery lifetime. Appl. Energy 2016, 172, 398–407. [Google Scholar] [CrossRef]
  26. Dufo-López, R.; Cortés-Arcos, T.; Artal-Sevil, J.S.; Bernal-Agustín, J.L. Comparison of lead-acid and li-ion batteries lifetime prediction models in stand-alone photovoltaic systems. Appl. Sci. 2021, 11, 1099. [Google Scholar] [CrossRef]
  27. Veilleux, G.; Potisat, T.; Pezim, D.; Ribback, C.; Ling, J.; Krysztofiński, A.; Ahmed, A.; Papenheim, J.; Pineda, A.M.; Sembian, S.; et al. Techno-economic analysis of microgrid projects for rural electrification: A systematic approach to the redesign of Koh Jik off-grid case study. Energy Sustain. Dev. 2020, 54, 1–13. [Google Scholar] [CrossRef]
  28. Paul Ayeng’o, S.; Schirmer, T.; Kairies, K.P.; Axelsen, H.; Uwe Sauer, D. Comparison of off-grid power supply systems using lead-acid and lithium-ion batteries. Sol. Energy 2018, 162, 140–152. [Google Scholar] [CrossRef]
  29. Alam, M.; Kumar, K.; Dutta, V. Analysis of solar photovoltaic-battery system for off-grid DC load application. Int. Trans. Electr. Energy Syst. 2021, 31, e12707. [Google Scholar] [CrossRef]
  30. Dhundhara, S.; Verma, Y.P.; Williams, A. Techno-economic analysis of the lithium-ion and lead-acid battery in microgrid systems. Energy Convers. Manag. 2018, 177, 122–142. [Google Scholar] [CrossRef]
  31. Kang, D.; Jung, T.Y. Renewable energy options for a rural village in North Korea. Sustainability 2020, 12, 2452. [Google Scholar] [CrossRef] [Green Version]
  32. Ridha, H.M.; Gomes, C.; Hazim, H.; Ahmadipour, M. Sizing and implementing off-grid stand-alone photovoltaic/battery systems based on multi-objective optimization and techno-economic (MADE) analysis. Energy 2020, 207, 118163. [Google Scholar] [CrossRef]
  33. Cagnano, A.; De Tuglie, E.; Mancarella, P. Microgrids: Overview and guidelines for practical implementations and operation. Appl. Energy 2020, 258, 114039. [Google Scholar] [CrossRef]
  34. Torres-Moreno, J.L.; Gimenez-Fernandez, A.; Perez-Garcia, M.; Rodriguez, F. Energy management strategy for micro-grids with PV-battery systems and electric vehicles. Energies 2018, 11, 522. [Google Scholar] [CrossRef] [Green Version]
  35. González, I.; Calderón, A.J.; Portalo, J.M. Innovative multi-layered architecture for heterogeneous automation and monitoring systems: Application case of a photovoltaic smart microgrid. Sustainability 2021, 13, 2234. [Google Scholar] [CrossRef]
  36. Lezynski, P.; Szczesniak, P.; Waskowicz, B.; Smolenski, R.; Drozdz, W. Design and Implementation of a Fully Controllable Cyber-Physical System for Testing Energy Storage Systems. IEEE Access 2019, 7, 47259–47272. [Google Scholar] [CrossRef]
  37. Falk, J.; Nedjalkov, A.; Angelmahr, M.; Schade, W. Applying Lithium-Ion Second Life Batteries for Off-Grid Solar Powered System—A Socio-Economic Case Study for Rural DevelopmentLithium-Ionen-Batterien in zweiter Lebensdauer für netzunabhängige Solaranlagen—Eine sozioökonomische Fallstudie für die ländliche Entwicklung. Zeitschrift für Energiewirtschaft 2020, 44, 47–60. [Google Scholar]
  38. Rallo, H.; Canals Casals, L.; De La Torre, D.; Reinhardt, R.; Marchante, C.; Amante, B. Lithium-ion battery 2nd life used as a stationary energy storage system: Ageing and economic analysis in two real cases. J. Clean. Prod. 2020, 272, 122584. [Google Scholar] [CrossRef]
  39. Huld, T.; Müller, R.; Gambardella, A. A new solar radiation database for estimating PV performance in Europe and Africa. Sol. Energy 2012, 86, 1803–1815. [Google Scholar] [CrossRef]
  40. IRENA. Renewable Power Generation Costs in 2019; IRENA: Abu Dhabi, United Arab Emirates, 2020. [Google Scholar]
  41. Stubbe, R. New Energy Outlook 2019 | Bloomberg New Energy Finance | Bloomberg Finance LP. Available online: https://www.bnef.com/insights/20917/view (accessed on 15 November 2020).
  42. IRENA. Electricity Storage and Renewables: Costs and Markets to 2030; IRENA: Abu Dhabi, United Arab Emirates, 2017; ISBN 978-92-9260-038-9. [Google Scholar]
  43. Tsiropoulos, I.; Tarvydas, D.; Lebedeva, N. Li-Ion Batteries for Mobility and Stationary Storage Applications—Scenarios for Costs and Market Growth; Publications Office of the European Union: Luxembourg, 2018. [Google Scholar]
  44. European Central Bank Monetary Policy. Available online: https://www.ecb.europa.eu/mopo/html/index.en.html (accessed on 12 January 2021).
  45. Blakers, A. Development of the PERC Solar Cell. IEEE J. Photovolt. 2019, 9, 629–635. [Google Scholar] [CrossRef]
  46. Redondo-Iglesias, E.; Venet, P.; Pelissier, S. Measuring Reversible and Irreversible Capacity Losses on Lithium-Ion Batteries. In Proceedings of the 2016 IEEE Vehicle Power and Propulsion Conference, VPPC 2016, Hangzhou, China, 17–20 October 2016. [Google Scholar]
Figure 1. Graph of the methodology used in the study.
Applsci 11 03587 g001
Figure 2. Location of the five case studies.
Applsci 11 03587 g002
Figure 3. Annual profile of the energy demand of the five cases.
Applsci 11 03587 g003
Figure 4. Block diagrams: (a) PV systems; (b) hybrid systems.
Applsci 11 03587 g004
Figure 5. Lifetime of batteries of the economic optimum systems: (a) PV systems; (b) hybrid systems.
Applsci 11 03587 g005
Figure 6. Differences in size of battery, PV generator and fuel consumption in the economic optimum systems with Li-ion in relation to lead-acid battery: (a) PV systems; (b) hybrid systems.
Applsci 11 03587 g006
Figure 7. Differences in battery capacity and cycled energy in the economic optimum systems with Li-ion in relation to lead-acid battery: (a) PV systems; (b) hybrid systems.
Applsci 11 03587 g007
Figure 8. Differences in cycled energy and excess energy in the economic optimum systems with Li-ion in relation to lead-acid battery: (a) PV systems; (b) hybrid systems.
Applsci 11 03587 g008
Figure 9. Variations of NPC of the systems and their components in the economic optimum systems with Li-ion in relation to lead-acid battery: (a) PV systems; (b) hybrid.
Applsci 11 03587 g009
Figure 10. Sensitivity analysis on the NPC of the optimal systems with lead-acid and Li-ion batteries for the winery case, based on the acquisition cost of Li-ion batteries: (a) PV system; (b) Hybrid system.
Applsci 11 03587 g010
Figure 11. Sensitivity analysis on the battery capacity in optimal systems for the winery case, based on the acquisition cost of Li-ion batteries: (a) PV system; (b) Hybrid system.
Applsci 11 03587 g011
Figure 12. Sensitivity analysis on elements in optimal systems for the winery case, based on the acquisition cost of Li-ion batteries: (a) PV power and battery capacity in the PV system; (b) PV power and energy from diesel in the hybrid system.
Applsci 11 03587 g012
Figure 13. Sensitivity analysis of the NPC of the optimal PV systems with lead-acid and Li-ion batteries, based on the acquisition cost of PV generation: (a) Irrigation pumping case; (b) Winery case.
Applsci 11 03587 g013
Figure 14. Sensitivity analysis of the NPC of the optimal hybrid systems with lead-acid and Li-ion batteries, based on the acquisition cost of PV generation: (a) Irrigation pumping case; (b) Single-family home case.
Applsci 11 03587 g014
Figure 15. Sensitivity analysis in optimal systems with Li-ion batteries for the winery case, based on the acquisition cost of the elements of PV generation: (a) PV power and battery capacity in the PV system; (b) PV power and energy from diesel in the hybrid system.
Applsci 11 03587 g015
Figure 16. Sensitivity analysis of the NPC of the optimal hybrid systems with lead-acid and Li-ion batteries, based on the inflation of diesel: (a) Pig farm case; (b) Winery case.
Applsci 11 03587 g016
Figure 17. Sensitivity analysis on optimal hybrid systems for winery case, based on the inflation of diesel: (a) Battery capacity; (b) PV power and energy from diesel in the Li-ion system.
Applsci 11 03587 g017
Figure 18. Sensitivity analysis on the NPC of the optimal systems with lead-acid and Li-ion batteries for the pig farm case, based on the solar irradiation: (a) PV system; (b) Hybrid system.
Applsci 11 03587 g018
Table 1. Main characteristics of the five case studies.
WineryIrrigation PumpingPig FarmSingle-Family HomeSecond Home
Annual consumption (kWh)53,34564,125216,4465036799
Maximum power 1 (kW)41,07345,00059,00036442474
Annual irradiation 2 (kWh/m2)16331656173417031674
Average annual temperature (°C)10.910.413.713.511.3
1 One-hour interval. 2 On horizontal plane.
Table 2. Orientation of the PV panels.
WineryIrrigation PumpingPig FarmSingle-Family HomeSecond Home
MountingOn the roofOn the groundOn the roofOn the roofOn the roof
OrientationCoplanarOptimalCoplanarCoplanarCoplanar
Azimuth−45° and 135°−5°−90° and 90°
Tilt20°25°20°20°20°
Table 3. Economic parameters of the main components of the systems.
PV PanelsLead-Acid BatteriesLi-ion Batteries
Acquisition cost 1900 €/kWp 2189–297 €/kWh 3483–500 €/kWh 3
Annual variation of price−2.5%−2%−3%
Maximum price variation−30%−25%−50%
Variable O&M cost by year1 €/kWp0.5 €/kWh0.2 €/kWh
1 Including price, transport and assembly; 2 PV panels also includes the proportional part of the fixing structure and solar inverters; 3 Depending on the size of battery.
Table 4. Operating parameters of the batteries.
Lead-AcidLi-Ion
Maximum DOD allowed80%90%
Cycling efficiency85%95%
Design life20 year15 year
Table 5. Economic parameters.
Study PeriodNominal Interest RateDiscount RateAmount of LoanLoan InterestDuration of Loan
25 years3%1.48%80%5%7 years
Table 6. Main characteristics of the economic optimum PV systems.
CaseBattery TypeBattery Lifetime (Years)Battery Capacity (kWh)PV Field (kWp)
WineryLead-acid9.74618.2324
Li-ion15384351.2
Irrigation pumpingLead-acid12.7986.4192.4
Li-ion15322.5359.2
Pig farmLead-acid9.51545.6494
Li-ion15998.4671.2
Single-family homeLead-acid7.7965.818.4
Li-ion1561.413.2
Second homeLead-acid7.932.95.6
Li-ion1515.36.8
Table 7. Main characteristics of the economic optimum hybrid systems.
CaseBattery TypeBattery Lifetime (Years)Battery Capacity (kWh)PV Field (kWp)Fuel Consumption L/Year
WineryLead-acid9.15197.299.63963.4
Li-ion15107.588.45280.1
Irrigation pumpingLead-acid12.52631123200.3
Li-ion1519.91126640.1
Pig farmLead-acid7.34540.9232.85612.2
Li-ion15430222.46425
Single-family homeLead-acid7.0526.27.6250.6
Li-ion1515.37.6333.6
Second homeLead-acid8.0354.464.7
Li-ion153.94.461.1
Table 8. Energy cycled and excess energy in economic optimum PV systems.
CaseBattery TypeEnergy Cycled (kWh)Excess Energy (kWh)
WineryLead-acid26,862368,503
Li-ion26,727405,595
Irrigation pumpingLead-acid15,163242,476
Li-ion12,033511,890
Pig farmLead-acid107,863576,442
Li-ion105,798871,075
Single-family homeLead-acid329023,881
Li-ion335315,667
Second homeLead-acid8926318
Li-ion8868044
Table 9. Energy cycled and excess energy in economic optimum hybrid systems.
CaseBattery TypeEnergy Cycled (kWh)Excess Energy (kWh)
WineryLead-acid24,80179,101
Li-ion23,19968,080
Irrigation pumpingLead-acid11,312122,509
Li-ion1769133,489
Pig farmLead-acid103,249159,843
Li-ion102,120151,833
Single-family homeLead-acid30786983
Li-ion28777366
Second homeLead-acid8204833
Li-ion8404866
Table 10. NPCs of the economic optimum PV systems.
CaseBattery TypeSystem
NPC (€)
Battery
NPC (€)
PV Generator
NPC (€)
WineryLead-acid 1656,293232,418331,488
Li-ion707,095248,228358,794
Irrigation pumpingLead-acid 1590,150302,244199,378
Li-ion673,719208,677366,824
Pig farmLead-acid 11,223,833587,058502,147
Li-ion1,487,218643,730680,034
Single-family homeLead-acid 168,07734,68124,704
Li-ion69,67940,58919,484
Second homeLead-acid36,67018,24111,854
Li-ion 130,68710,92613,059
1 Absolute optimum.
Table 11. NPCs of the economic optimum hybrid systems.
CaseBattery TypeSystem
NPC (€)
Battery
NPC (€)
PV Generator
NPC (€)
Diesel NPC (€)
WineryLead-acid 1353,23379,278106,21897,688
Li-ion365,81770,25294,975130,200
Irrigation pumpingLead-acid 1350,18082,788118,66776,717
Li-ion353,57414,377118,667132,072
Pig farmLead-acid 1726,707252,836239,935111,629
Li-ion769,218277,890229,494153,535
Single-family homeLead-acid 146,07016,92713,8627953
Li-ion42,89310,92613,86210,653
Second homeLead-acid25,189546510,6502951
Li-ion 123,386370610,6502867
1 Absolute optimum.
Table 12. Factor applied to the acquisition costs of Li-ion batteries below which they entered into the absolute optimal systems.
CasePV SystemHybrid System
Winery0.810.83
Irrigation pumping0.690.79
Pig farm0.640.86
Single-family home0.961.30
Second home1.591.60
Publisher’s Note: MDPI stays neutral with regard to jurisdictional claims in published maps and institutional affiliations.

