Article

A Mixed-Integer Convex Model for the Optimal Placement and Sizing of Distributed Generators in Power Distribution Networks

by
Walter Gil-González
1,*,
Alejandro Garces
2,
Oscar Danilo Montoya
3,4 and
Jesus C. Hernández
5,*
1
Grupo GIIEN, Facultad de Ingeniería, Institución Universitaria Pascual Bravo, Campus Robledo, Medellín 050036, Colombia
2
Programa de Ingeniería Eléctrica, Universidad Tecnológica de Pereira, AA: 97, Pereira 660003, Colombia
3
Facultad de Ingeniería, Universidad Distrital Francisco José de Caldas, Bogotá 11021, Colombia
4
Laboratorio Inteligente de Energía, Universidad Tecnológica de Bolívar, Cartagena 131001, Colombia
5
Department of Electrical Engineering, University of Jaén, Campus Lagunillas s/n, Edificio A3, 23071 Jaén, Spain
*
Authors to whom correspondence should be addressed.
Appl. Sci. 2021, 11(2), 627; https://doi.org/10.3390/app11020627
Submission received: 12 December 2020 / Revised: 7 January 2021 / Accepted: 8 January 2021 / Published: 11 January 2021
(This article belongs to the Special Issue Standalone Renewable Energy System—Modeling and Controlling - Ⅱ)

Abstract

:
The optimal placement and sizing of distributed generators is a classical problem in power distribution networks that is usually solved using heuristic algorithms due to its high complexity. This paper proposes a different approach based on a mixed-integer second-order cone programming (MI-SOCP) model that ensures the global optimum of the relaxed optimization model. Second-order cone programming (SOCP) has demonstrated to be an efficient alternative to cope with the non-convexity of the power flow equations in power distribution networks. Of relatively new interest to the power systems community is the extension to MI-SOCP models. The proposed model is an approximation. However, numerical validations in the IEEE 33-bus and IEEE 69-bus test systems for unity and variable power factor confirm that the proposed MI-SOCP finds the best solutions reported in the literature. Being an exact technique, the proposed model allows minimum processing times and zero standard deviation, i.e., the same optimum is guaranteed at each time that the MI-SOCP model is solved (a significant advantage in comparison to metaheuristics). Additionally, load and photovoltaic generation curves for the IEEE 69-node test system are included to demonstrate the applicability of the proposed MI-SOCP to solve the problem of the optimal location and sizing of renewable generators using the multi-period optimal power flow formulation. Therefore, the proposed MI-SOCP also guarantees the global optimum finding, in contrast to local solutions achieved with mixed-integer nonlinear programming solvers available in the GAMS optimization software. All the simulations were carried out via MATLAB software with the CVX package and Gurobi solver.

1. Introduction

Distributed energy resources (DERs) are an attractive technology to install in power distribution networks due to their technical, economic, and environmental benefits [1]. In general, a DER is a small power plant that can employ different kinds of energy source such as small-hydro, micro-turbine, fuel cell, methane-generating bioreactors, gas-turbine, and renewable distributed generation (wind and solar power). Typically, DERs are located close to the customers in a distribution network, which has allowed decreasing power losses associated with transmission lines and improving the voltage profiles [2,3]. However, DER can generate adverse effects in electrical distribution networks, such as dis-coordination of protection schemes, increased current fault level, bidirectional power flows, transmission line overload, and voltage profile deterioration [4] if these are not correctly placed and sized. An optimization model for the optimal location and sizing of DERs is required to avoid these possible problems.
This problem has been extensively studied in the literature with several mathematical formulations and methodologies. The problem is complicated to solve since its formulation combines discrete and continuous variables with nonlinear/non-convex constraints. Therefore, the global optimum cannot be guaranteed [5]. The problem has been typically solved using master-slave strategies [6]. The master strategy chooses the DERs placement and size, while the slave strategy solves an optimal power flow problem. For the master strategy, metaheuristic optimization techniques have been commonly implemented, such as Chu–Beasley genetic algorithms [7], tabu search algorithms [8], simulated annealing methods [9], ant-lion optimizers [10], whale optimization algorithm [11], krill herd algorithms [12], teaching-based learning optimizers [13], population-based incremental learning [6], imperialist competitive algorithms [14], harmonic search algorithms [15], and bat and firefly algorithms [16], among others. Although these optimization techniques ensure good solutions, none of them can guarantee the optimal solution, and some are not well justified mathematically [17]. These techniques include some degree of randomness, which leads to slightly different solutions from one execution to another. In addition, they contain many adjustment parameters that make them highly dependent on the programmer, adding to the fact that statistical analysis must be required to determine their reproducible capacities [18,19,20].
Recent approaches have combined heuristic methods with second-order cone programming (SOCP) models to solve the problem of the optimal location and sizing of DERs in distribution networks as the case of the discrete version of the sine-cosine algorithm reported in [21] and the genetic algorithm proposed in [22] however, these approaches only ensures the optimal solution for the continuous part of the problem, i.e., the DERs’ sizing problem, while for the integer part, i.e., the DERs location problem, it is not possible due to the heuristic nature of the discrete algorithms. The heuristic nature of the the integer part does not allow for ensuring the global optimum reaching, which implies that statistical test are required to verify their efficiency [19].
Unlike heuristics, this paper proposes an exact formulation based on recent advances in convex optimization for power systems applications [23]. The optimal placement and sizing of DERs are transformed into a mixed-integer second-order cone programming (MI-SOCP) model. The problem is solved via the Branch & Bound method, which guarantees optimal global optimization if each sub-problem of optimization is convex. For this purpose, the optimal power flow becomes a convex problem through a relation. Thus, the main contributions of this work are summarized below:
  • A reformulation of the classical model represents the problem of the optimal location and sizing of DERs in power distribution networks by using an MI-SOCP model. This model guarantees the global optimum of the relaxed problem, being indeed a suitable solution to the problem for practical purposes;
  • The application of the proposed MI-SOCP model to the optimal sizing and location of DERs considering the unity power factor and variable one is analyzed. Its numerical results confirm that for the unity power factor found in the best solutions reported in scientific literature and the case variable power factor, better solutions are found when compared to the literature reports. In both simulation cases, with minimal computation efforts and reproducible results, i.e., with the assurance of finding the same optimum solution at each simulation run.
The remainder of the paper is organized as follows: Section 2 describes the mathematical model for the optimal placement and sizing of DERs in power distribution networks. Section 3 presents the optimal power flow convex model based on the SOCP approximation. Section 4 describes the MI-SOCP convex model based on the Branch & Bound method and SOCP approximation. In Section 5, the configurations of the IEEE 33-bus and IEEE 69-bus system and simulation cases are presented. Section 6 shows the MI-SOCP convex model’s numerical results compared to multiples strategies previously reported. Finally, some conclusions are drawn in Section 7.

2. General Mathematical Model

The mathematical model for the optimal placement and sizing of DERs in electrical distribution networks is a mixed-integer nonlinear problem. This implies that it is composed of integers and continuous variables. The grid is represented as an oriented graph G = N , E , where N = 1 , 2 , , n represents the set of nodes of the power distribution network and ε N × N the set of branches. Without loss of generality, the slack node is assumed to be k = 1 . For a compact representation, all variables are presented in the set complex, considering that they can be separated into real and imaginary parts. The location or not of the DERs in the network shape the integer (binary) variables, while the continuous variables are defined in the optimal power flow formulation. The optimal problem tackled in this paper is described in Nomenclature.

2.1. Objective Function

The main objective of the optimal placement and sizing of DERs in electrical distribution network is to minimize the active power loss function, which is given by (1),
min p L = real k N m N y k m v m v k ,
where p L represents the power loss of the network, y k m is entry k m of the line admittance matrix Y bus , and ( · ) denotes the complex conjugate; and v k and v k are the voltages phasor at nodes k and m, respectively. This objective function constitutes a convex quadratic form as will be demonstrated in Section 2.3.

2.2. Constraints

The main constraint of the model is given by the set of power flow equations that are given by (2):
s k + s k new d k v k = m N y k m v m , k N ,
where s k , is the apparent power generated at node k by a existing generators, s k new is the apparent power generated by new DERs at node k, and d k is the apparent power demanded at node k. Notice this constraint constitutes a set of 2 n non-affine equality equations (n for the real part and n for the imaginary part) which make the problem non-convex.
The voltage in the slack node (substation) is supposed to be v 1 = 1 + j 0 ; the rest of voltages are limited as follows:
V nom δ v k V nom + δ , k N ,
where V nom is rated voltage of the system and δ is the maximum deviation given by the grid code (usually δ is a constant between 0.05 pu to 0.1 pu). The left-hand side of this constraint is non-convex, however, the right hand side is.
Flows in the distribution lines are limited by the following box constrain which is, of course, convex:
s k m s k m ¯ , ( k m ) ε ,
where s k m is the power flow through line k m and s k m ¯ is the maximum apparent power flow allowed.
Capacity of generators, both existing and new are considered as follows:
s k s ¯ k , k N ,
s k new z k s ¯ new , k N ,
where s ¯ k is the maximum apparent power generated at node k by a existing generators, s ¯ new is the maximum apparent power generated by new DERs at node k, and
z k 0 , 1 , k N
which denotes the binary variable of the problem, which has a value of 1 if a DER is installed at node k or 0 otherwise. There is a limit of DERs to be installed in the system, given by (8),
k N z k n T .
For the sake of completeness, the entire model is presented below:
min p L = real k N m N y k m v m v k ( s k + s k new d k ) = m N y k m v m v k , k N V nom δ v k V nom + δ , k N s k m s k m ¯ , ( k m ) E s k s ¯ k , k N s k new z k s ¯ new , k N k N z k n T z k B , k N
Model (9) is a non-convex non-linear integer programming problem. These problems are highly complex, hence the need to use approximate techniques for their solution. However, some constraints are convex and may be used to generate a tractable problem.

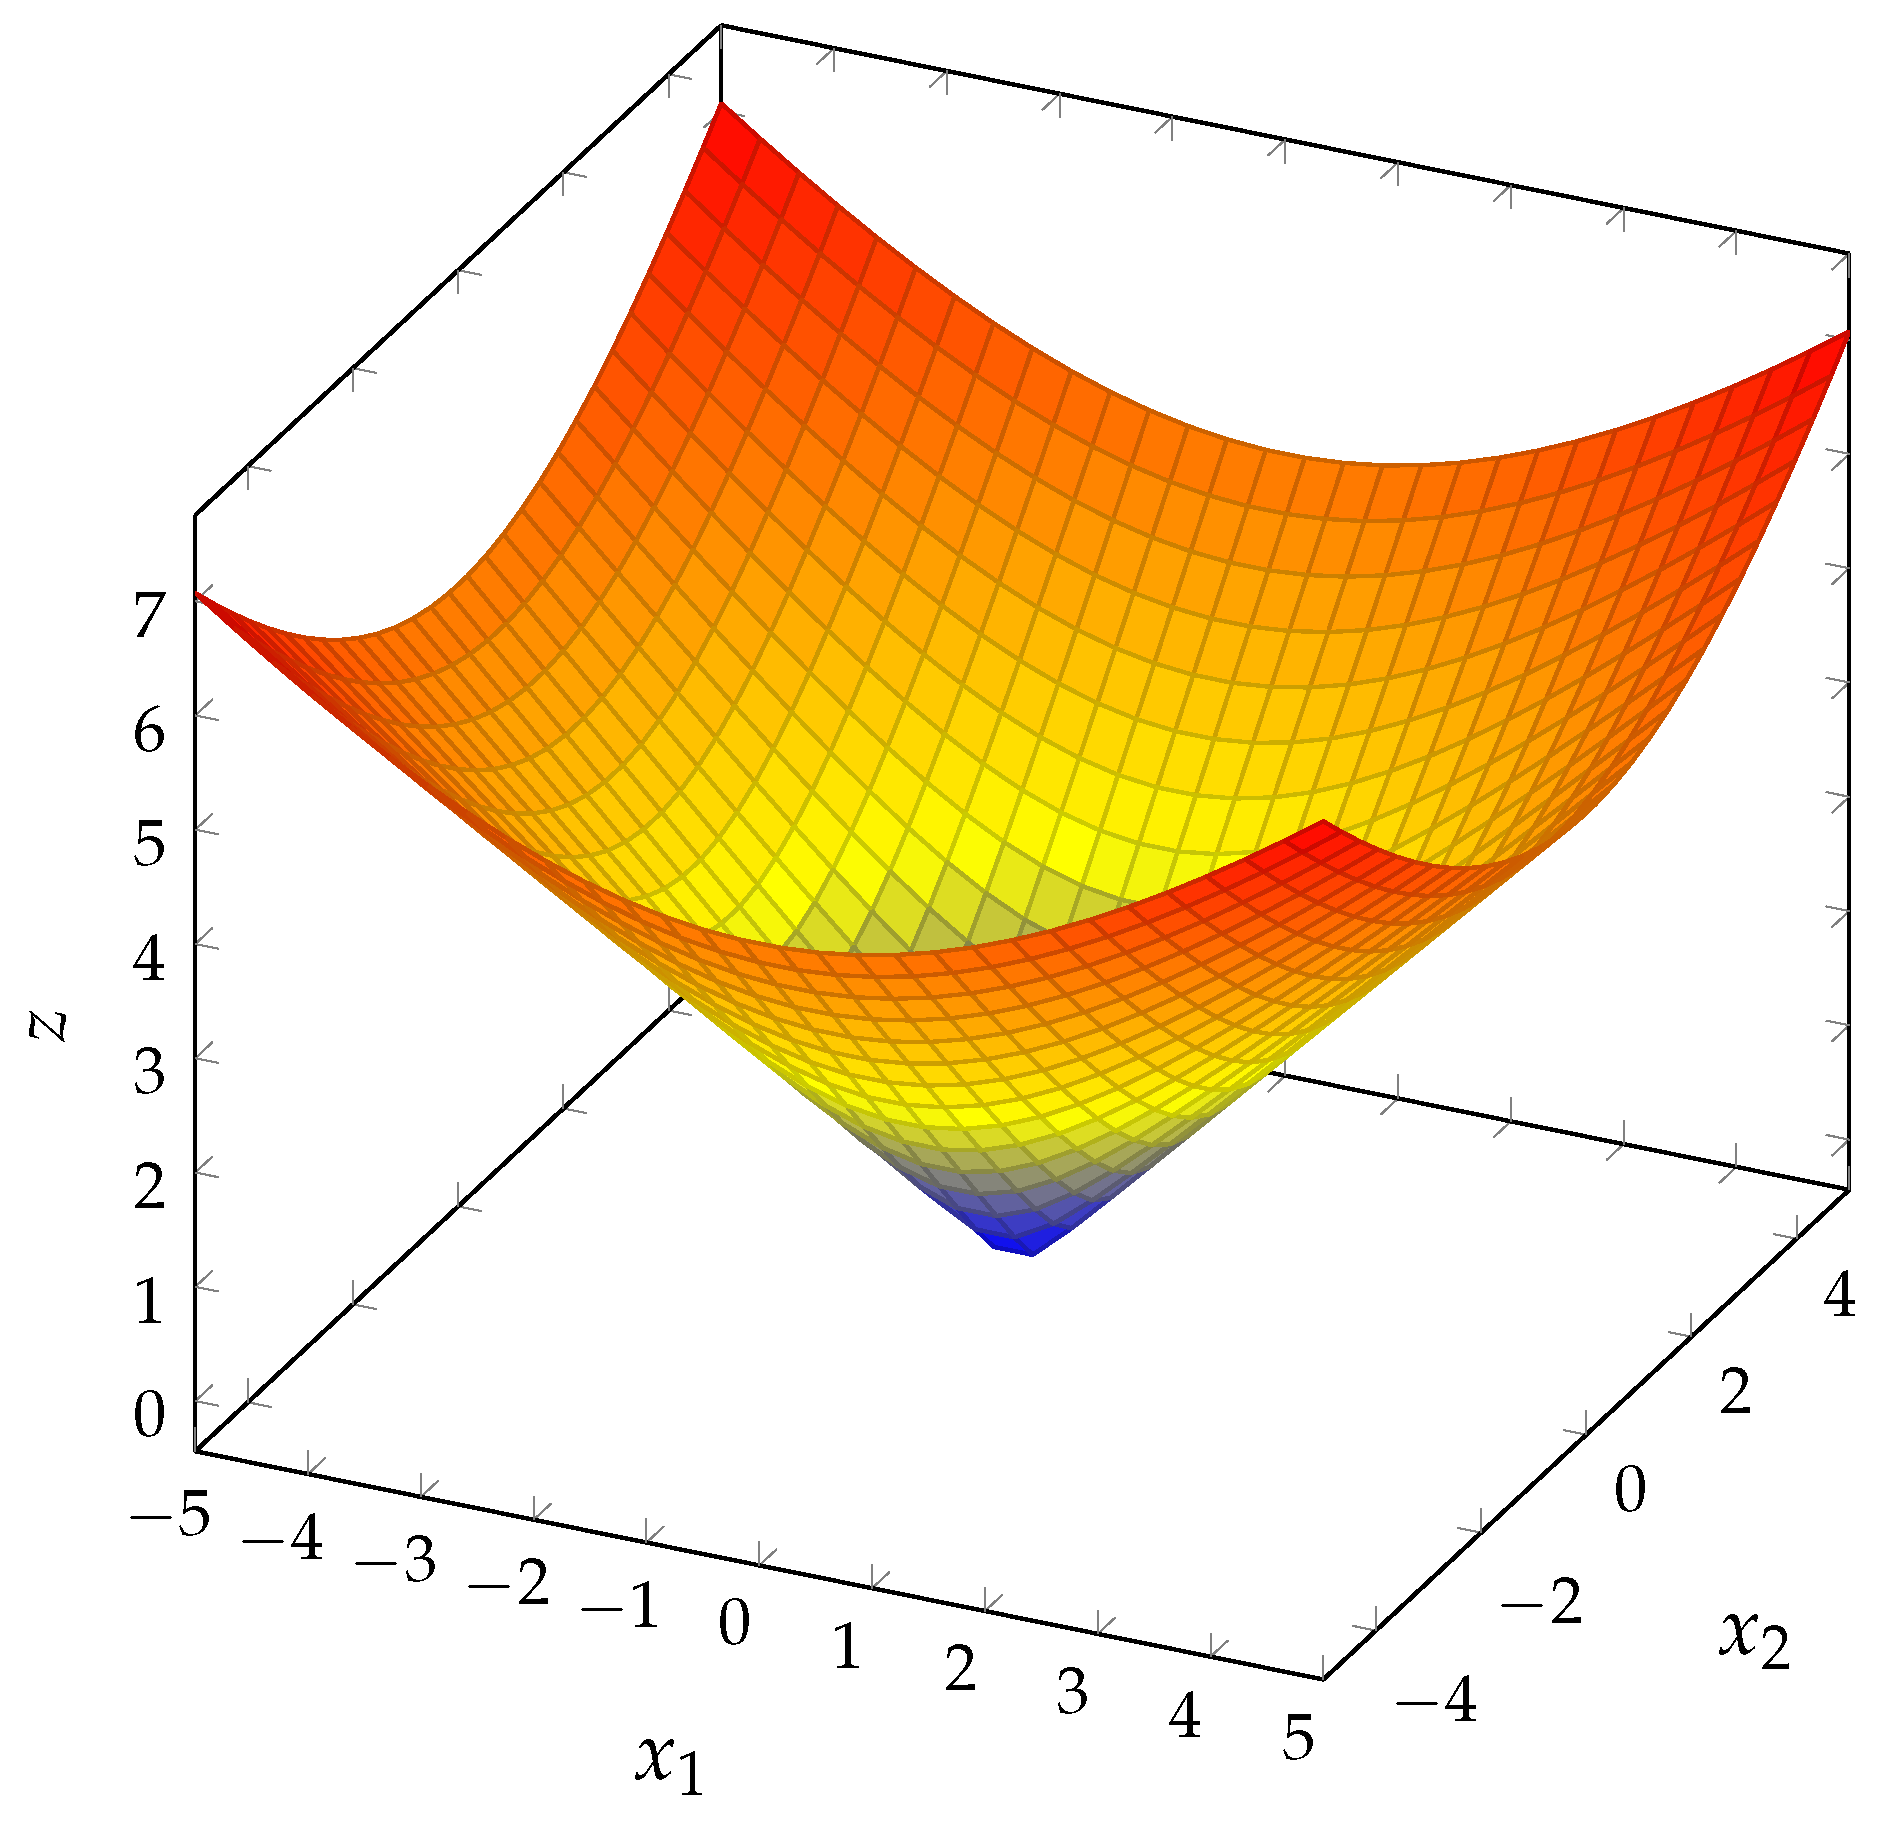
2.3. Identification of Model Properties

The model for the optimal placement and sizing of DERs in power distribution networks is highly complex, hence the use of heuristic algorithms. However, some parts of the model exhibit suitable properties to be included in a convex optimization model. Table 1 shows this properties.
Notice the objective function can be represented in a real domain by splitting y k m = g k m + j b k m and v = v real + j v imag , resulting in the following equivalent expression:
p L = k N m N g k m ( v k real v m real + v k imag v m imag ) .
Since G = [ g k m ] R n × n is positive semidefinite (note that G can be calculated as G = A G p A , where A is the incidence matrix and G p is a diagonal matrix with the resisting effect of each branch), then p L is a convex function. Most of the constraints are also convex. Therefore, the main source of complexity is the power flow equations and the binary nature of variables z. A suitable approximation is required in order to obtain a tractable model, as presented in the following section.

3. SOCP Optimization

The second order cone programming (SOCP) is sub-field of convex optimization that deals with an optimization model with an affine linear and second order cones constraints [24]. Tailored algorithms exist for these type of problems that efficiently solve large SOCP models in only microseconds. A second order cone is a convex set defined by the following constraint:
x z
where x R n and z R . x is the norm-2 of the vector x (hence it is also called a Euclidean cone). Figure 1 shows a second order cone in R 3 , clearly a convex set. For further details about optimization convex, see [25].

3.1. SOCP Approximation for the Power Flow Equations

The main idea behind the SOCP of the power flow is to transform non-convex (bilinear) constraints into second order cone constraints. The formulation allows transforming the power flow equations, that are a nonlinear/non-convex problem, into a series of convex constraints. The proposed SOCP model is built on the approximation proposed by Low in [26]. A new matrix W = [ w k m ] C n × n is defined, as follows:
w k m = v k v m .
Therefore, power flow equations (2) can be represented as the following equivalent equation:
s k + s k new d k = m N y k m w k m , k N .
Note (11) is affine and the non-convexity appears in (10), which in turns implies the following expression:
w k m 2 = v k 2 v m 2 .
A new vector U R n is defined, with entries u k = v k 2 , then (12) is transformed into (13):
w k m 2 = u k u m .
Being a complex number, w k m stores information related to the angle of the voltages whereas u k , u m stores information related to the magnitude. We use the following hyperbolic representation for the right hand side of (13):
u k u m = 1 4 ( u k + u m ) 2 1 4 ( u k u m ) 2 .
Resulting in the following equivalent expression:
w k m 2 + 1 4 ( u k u m ) 2 = 1 4 ( u k + u m ) 2 .
At this point, the problem is still not-convex, however, (14) relaxed and transformed into the following constraint:
4 w k m 2 + ( u k u m ) 2 ( u k + u m ) 2 .
Notice that (15) represents a second order cone, namely:
2 w k m u k u m u k + u m
where the term inside the norm in the left hand side of the inequality is a vector in C 2 (square (16) to demonstrate it is equivalent to (15)). The problem is now convex and tractable, except for the binary constraints given by (7). The problem must be solved in the framework of MI-SOCP.
The new decision variables u k allow also to transform (3) into the following convex constraint:
( 1 δ ) 2 u k ( 1 + δ ) 2 .
This constraint is equivalent to (3) since 1 δ 0 and therefore the inequality holds even if it is squared (i.e., (17) is not an approximation but an equivalent constraint).
The objective function (1) although already convex, is transformed into a simpler affine equation using the new variables w k m :
min p L = real ( y k m w k m )
remember that both y k m and w k m are represented as complex variables but the objective p L is a real function. In theory, these variables are separated in real and imaginary parts. However, the convex representation is more compact and can be directly implemented in practice using languages such as Matlab and/or Python.
Combining all the aforementioned considerations, the MI-SOCP model is obtained:
min p L = real ( y k m w k m ) s k + s k new d k = m N y k m w k m , k N 2 w k m u k u m u k + u m , k N ( 1 δ ) 2 u k ( 1 + δ ) 2 s k m s k m ¯ , ( k m ) ε s k s ¯ k , k N s k new z k s ¯ new , k N k N z k n T s k m C , ( k m ) ε s k m new C , ( k m ) ε s k C , k N w k m C , ( k m ) ε u k R , k N z k B , k N
Notice the model is now a SOCP except for the last constraint that is binary, leading to a MI-SOCP model.

3.2. Return to the Original Variables

The model for the SOC approximation is given as a function of w k m and u k instead of the voltages v k . However, it is possible to approximate the original voltages by the following two-step procedure: First, the magnitude of the voltages is computed as v k = u k . This value exists and is real since u k 0 and second, the angle of the voltages is calculated from θ k m = ang ( w k m ) in a forward iteration, starting from θ 1 = 0 . Therefore, a power flow calculation is not required after the optimization problem is solved.

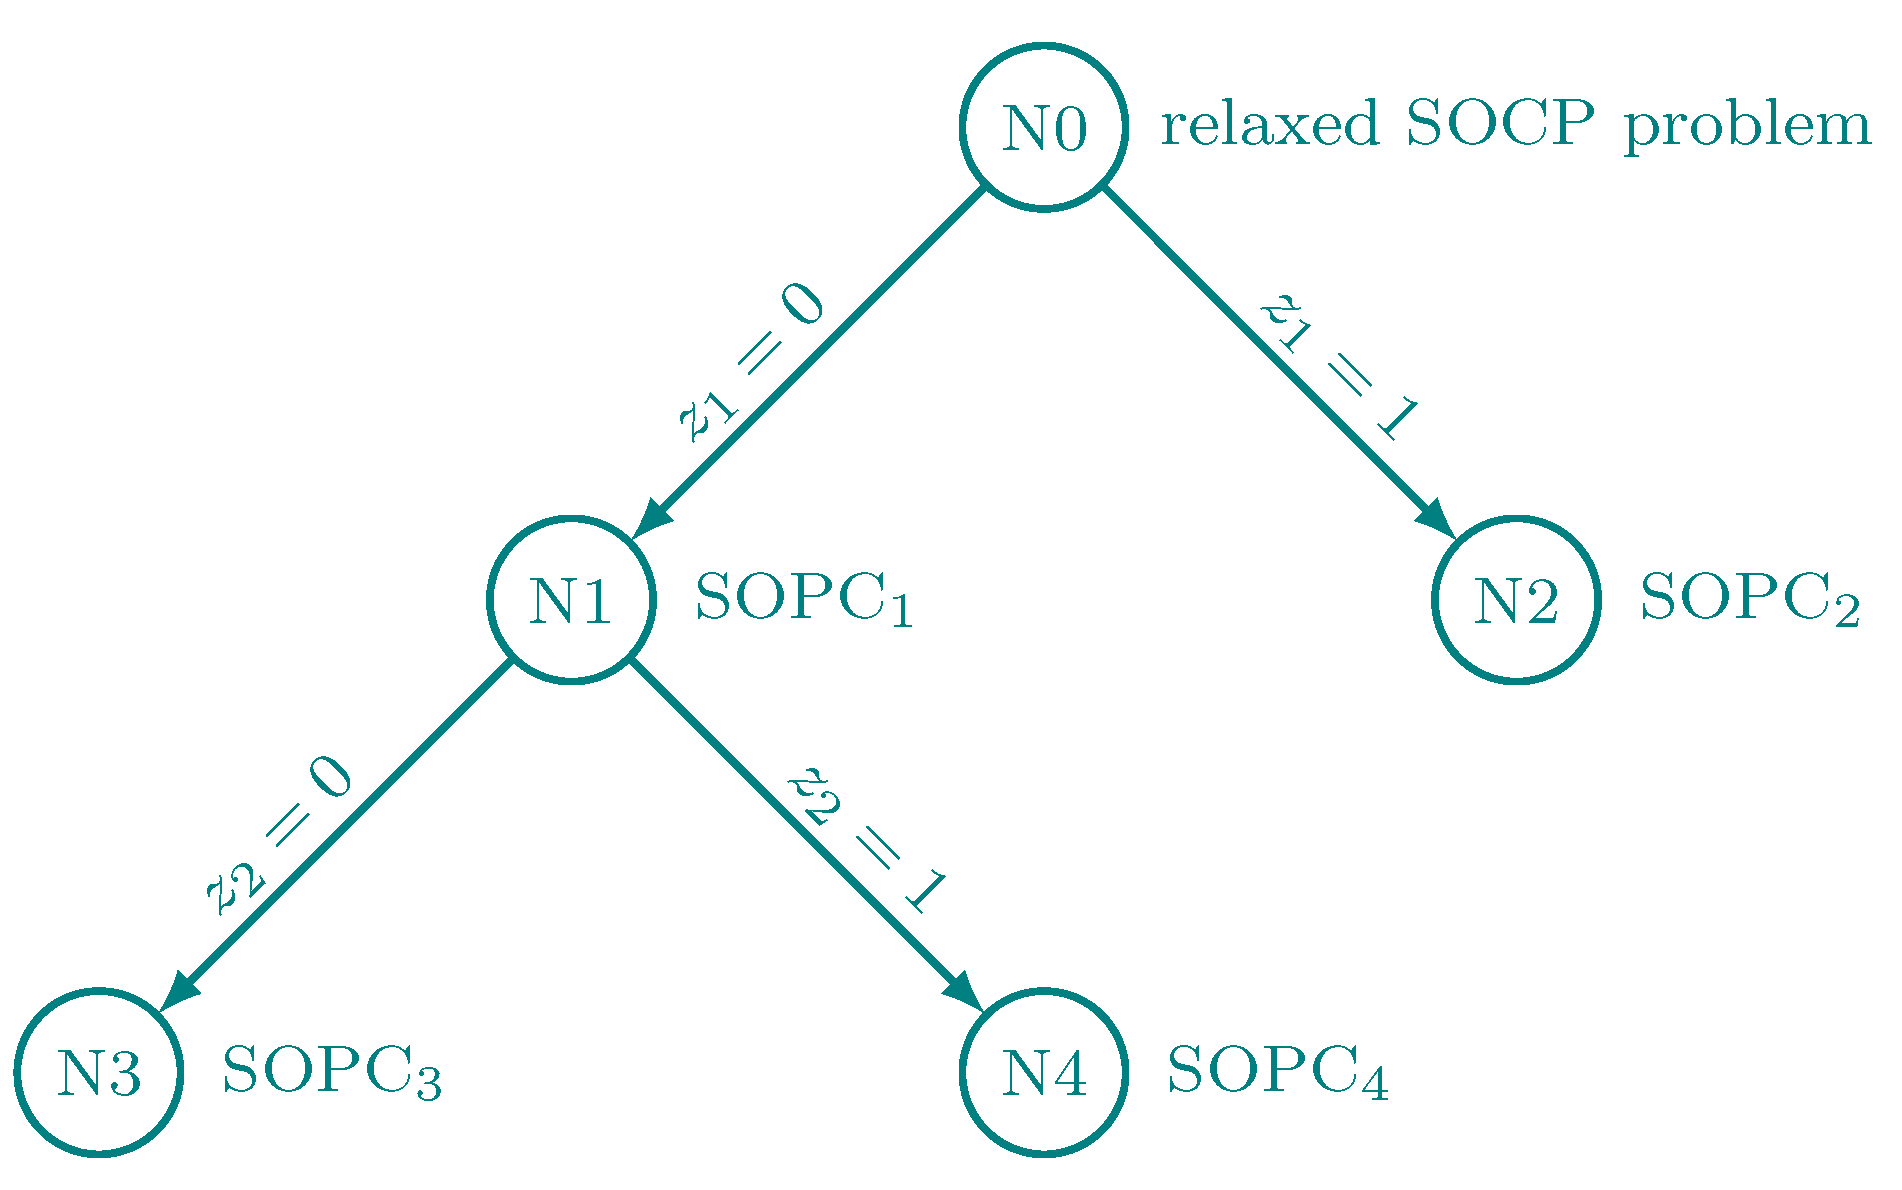
4. Solution of the MI-SOCP Model

Mixed-integer second-order cone programming (MI-SOCP) are problems that includes the following type of constraints:
A k x + b k α k x + β k z k + γ k ,
where decision variables include continuous x and binary variables z; A k are real matrices, b k , α k , β k are real vectors, and γ k are constants for each constraint k.
Like most of the integer programming problems, an MI-SOCP can be solved using a modified version of Branch & Bound (B&B), as shown in Figure 2. At each iteration, the B&B solves a SOCP problem that uses an interior point method, specially designed for this type of problem [24]. The method is benefited for the properties of the SOCP problems concerning convexity and fast convergence of the interior point methods [27].
There are different versions of the interior point method for convex optimization problems. In general, these methods can be classified into two groups: Primal and primal-dual methods. Primal methods are based on the seminal paper of Karmarkar [28], which can be straightforwardly extended to SOCP problems. Primal-dual requires more effort to be applied. However, numerical experiments have demonstrated advantages in terms of convergence [29].
The B&B method departs from a solution of a SOCP problem where the variables z k [ 0 , 1 ] are considered continuous. This solution is named as N 0 and constitutes a lower bound for the MI-SOCP problem. Next, a series of SOCP optimization problems are solved for integer partitions of z k , as depicted in Figure 2. Each SOCP problem has continuous variables, and hence it can be solved efficiently despite having a high amount of variables. The method continues until a binary solution is obtained. Other approaches, such as outer approximation, cutting-plane methods, and generalized benders decomposition, can be used to solve MI-SOCP (see [27] and the references therein for a complete review of MI-SOCP). However, most of the solvers that allow solving MI-SOCP use B&B. Since our approach is application-oriented, we will rely on the solution given by these solvers.

5. Test Systems and Simulation Cases

The MI-SOCP formulation is validated in two widely-used test systems for the problem of optimal location and sizing of DERs in power distribution networks. The test systems are the IEEE 33- and 69-bus systems. The most relevant information about these test systems is presented below.

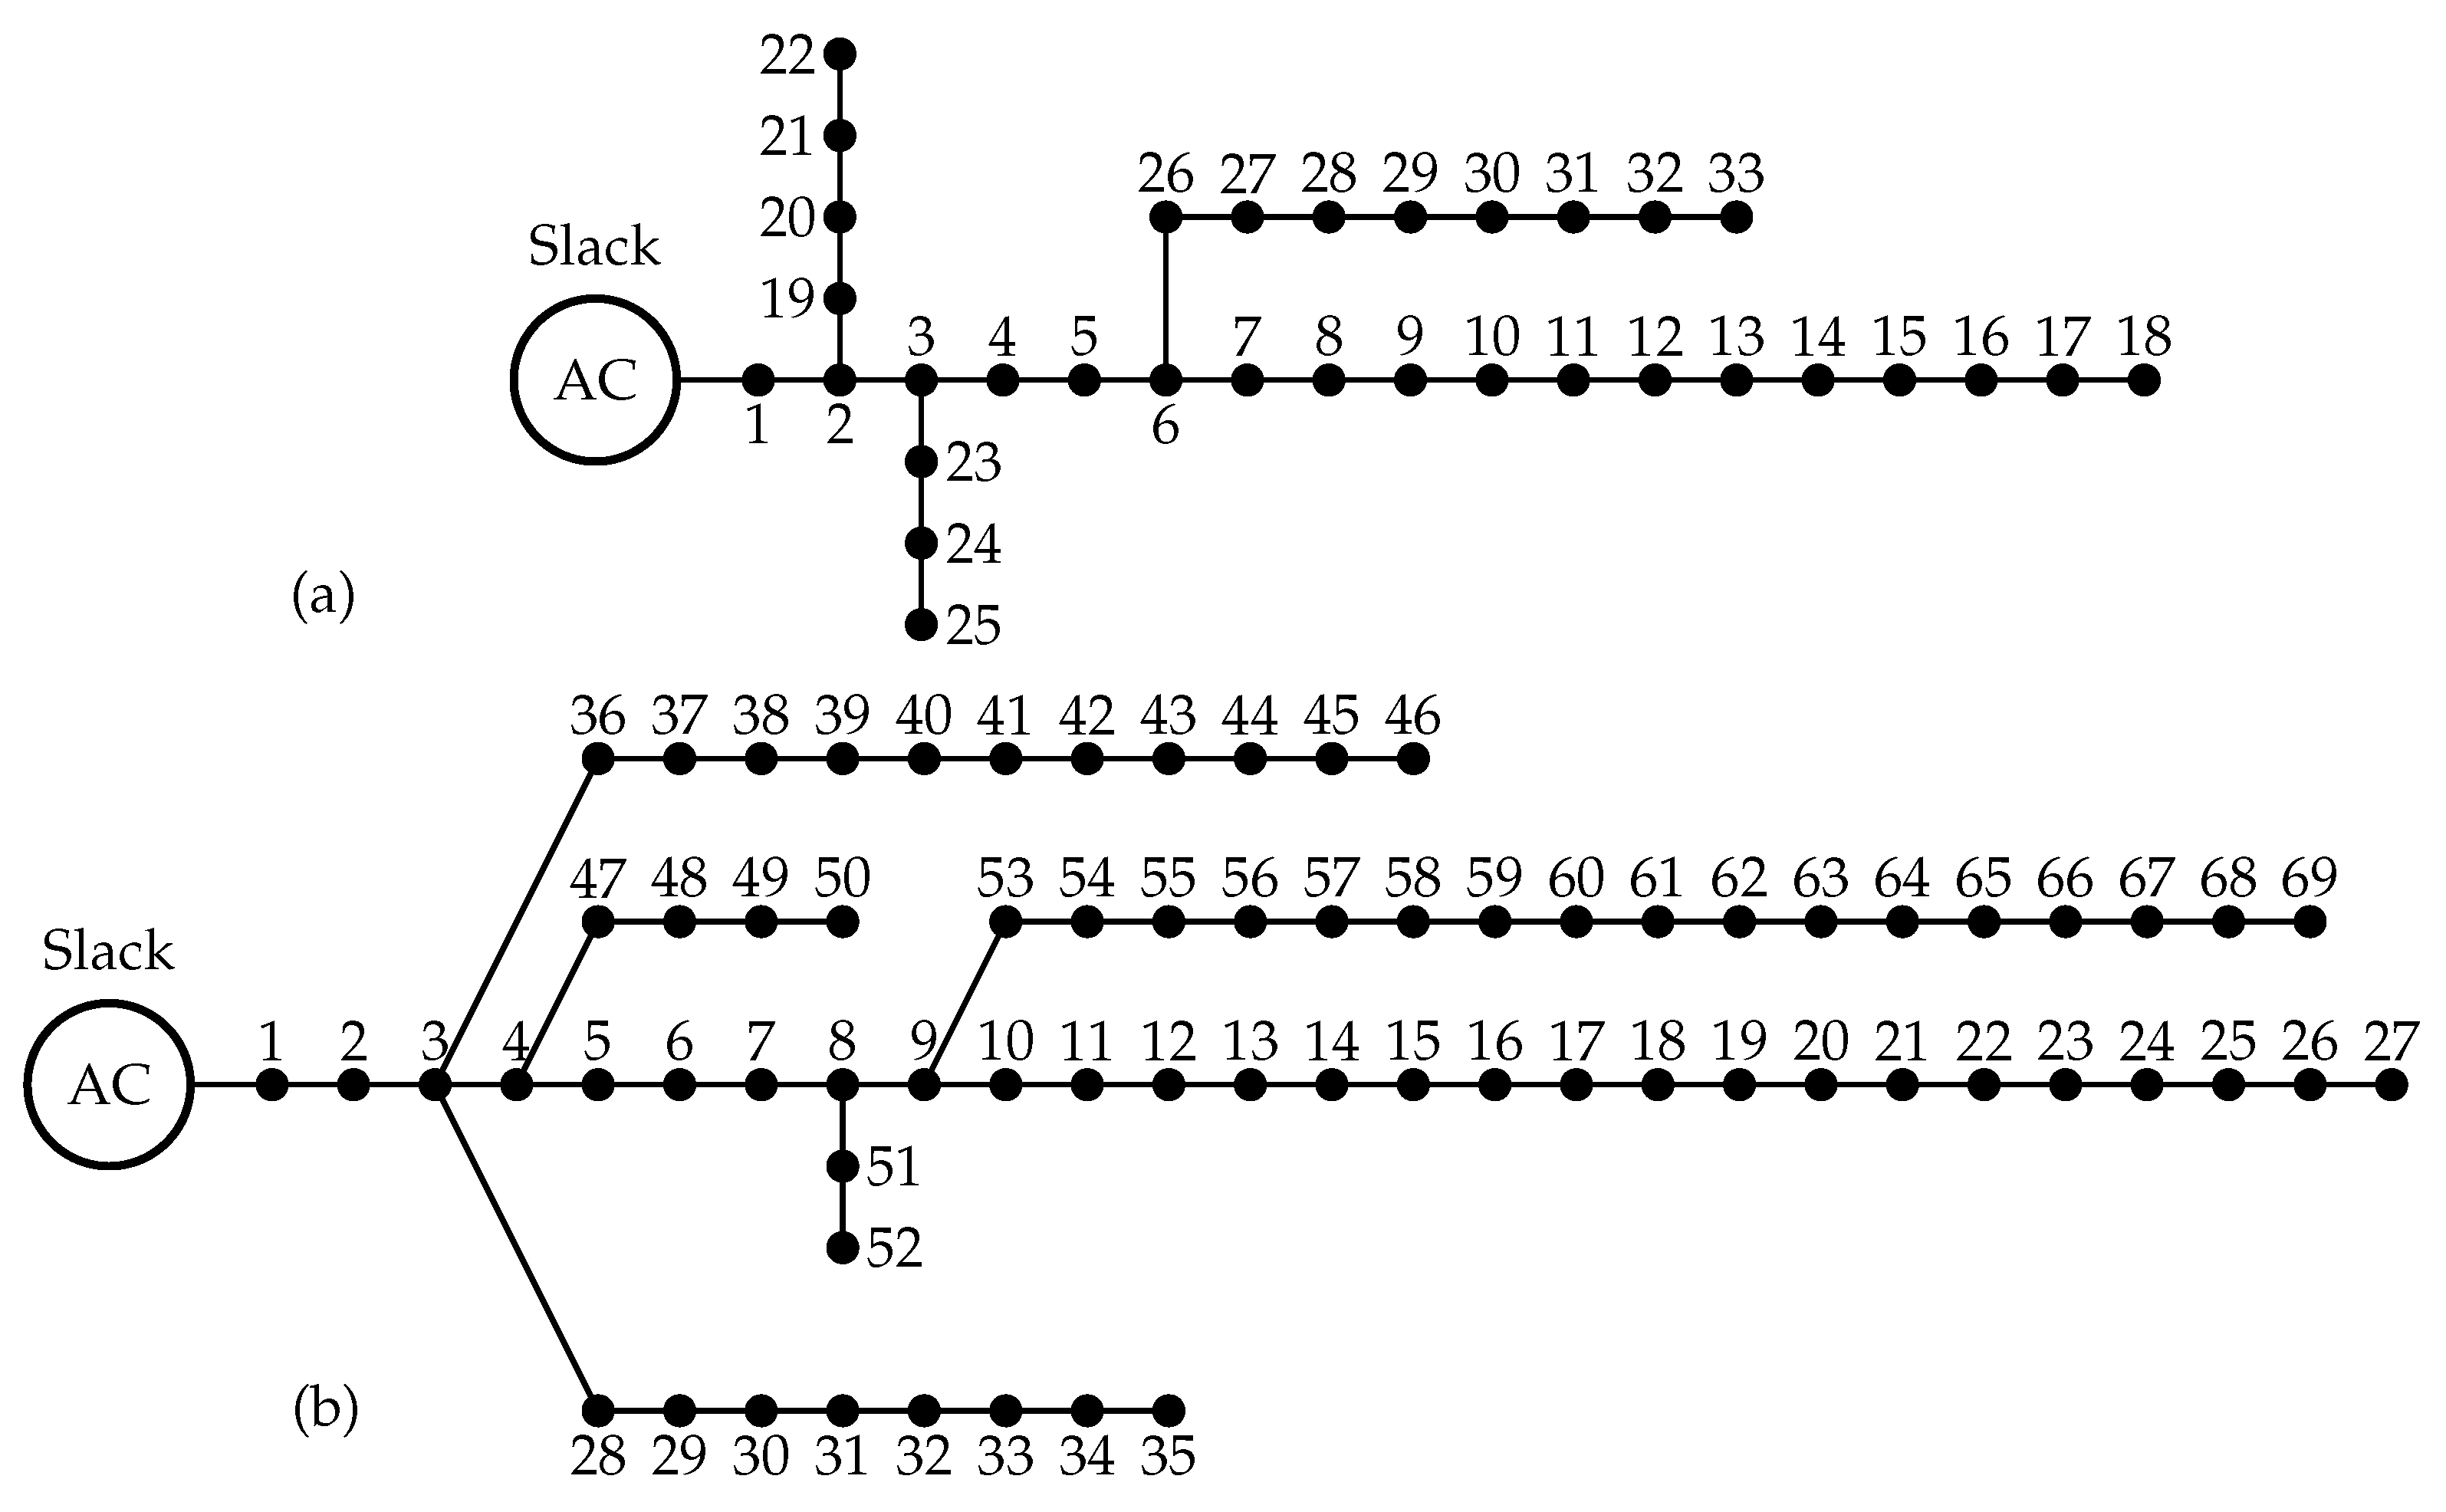
5.1. IEEE 33-Bus System

This test system operates at 12.66 kV and consists of 33 nodes, 32 branches, and a unique slack node located at node 1. The configuration of this feeder is depicted in Figure 3a, and its parameters can be found in [3]. Its initial active power losses are equal to 210.9876 kW. The total active and reactive power demands of this system are 3715 kW and 2300 kVAr, respectively. The voltage and power base values considered are 12.66 kV and 1 MW, respectively.

5.2. IEEE 69-Bus System

This test system works at 12.66 kV, which is composed of 69 nodes, 68 branches, and a unique slack node located at node 1. The configuration of this feeder is shown in Figure 3b, and its parameters can be consulted in [3]. Its initial active power losses are equal to 224.9520 kW. The total active and reactive power demands of this system are 3890.7 kW and 2693.6 kVAr, respectively. The voltage and power base values chosen are 12.66 kV and 1 MW, respectively.

5.3. Simulation Cases

To validate the effectiveness and robustness of the proposed MI-SOCP model, we consider two simulation cases as follows:
  • Case-1: This case considers the possibility of installing three DERs. For the IEEE 33-bus system, the capacity of DERs is from 0 kW to 1.2 MW for each one. While for the IEEE 69-bus system, the capacity of DERs is from 0 kW to 2 MW for each one. In addition, each DER is assumed to operate with a unit power factor;
  • Case-2: This case also considers the possibility of installing three DERs with the capacity to generate reactive power, i.e., variable power factor.

6. Results

The MI-SOCP convex model has been solved using CVX, and Gurobi [30]. It has been implemented in MATLAB software version 2019b on a desktop computer with an INTEL(R) Core(TM) i7−7700 2.8-GHz processor and 16.0 GB of RAM running on a 64-bit version of Microsoft Windows 10 Home. The robustness and efficiency of the proposed methodology for placement and sizing of DERs in distribution networks are compared with solutions previously reported.
It is important to mention that the solution MI-SOCP model shown in the results is a solution recovery in original variables using the exact power flow model presented in Section 2.

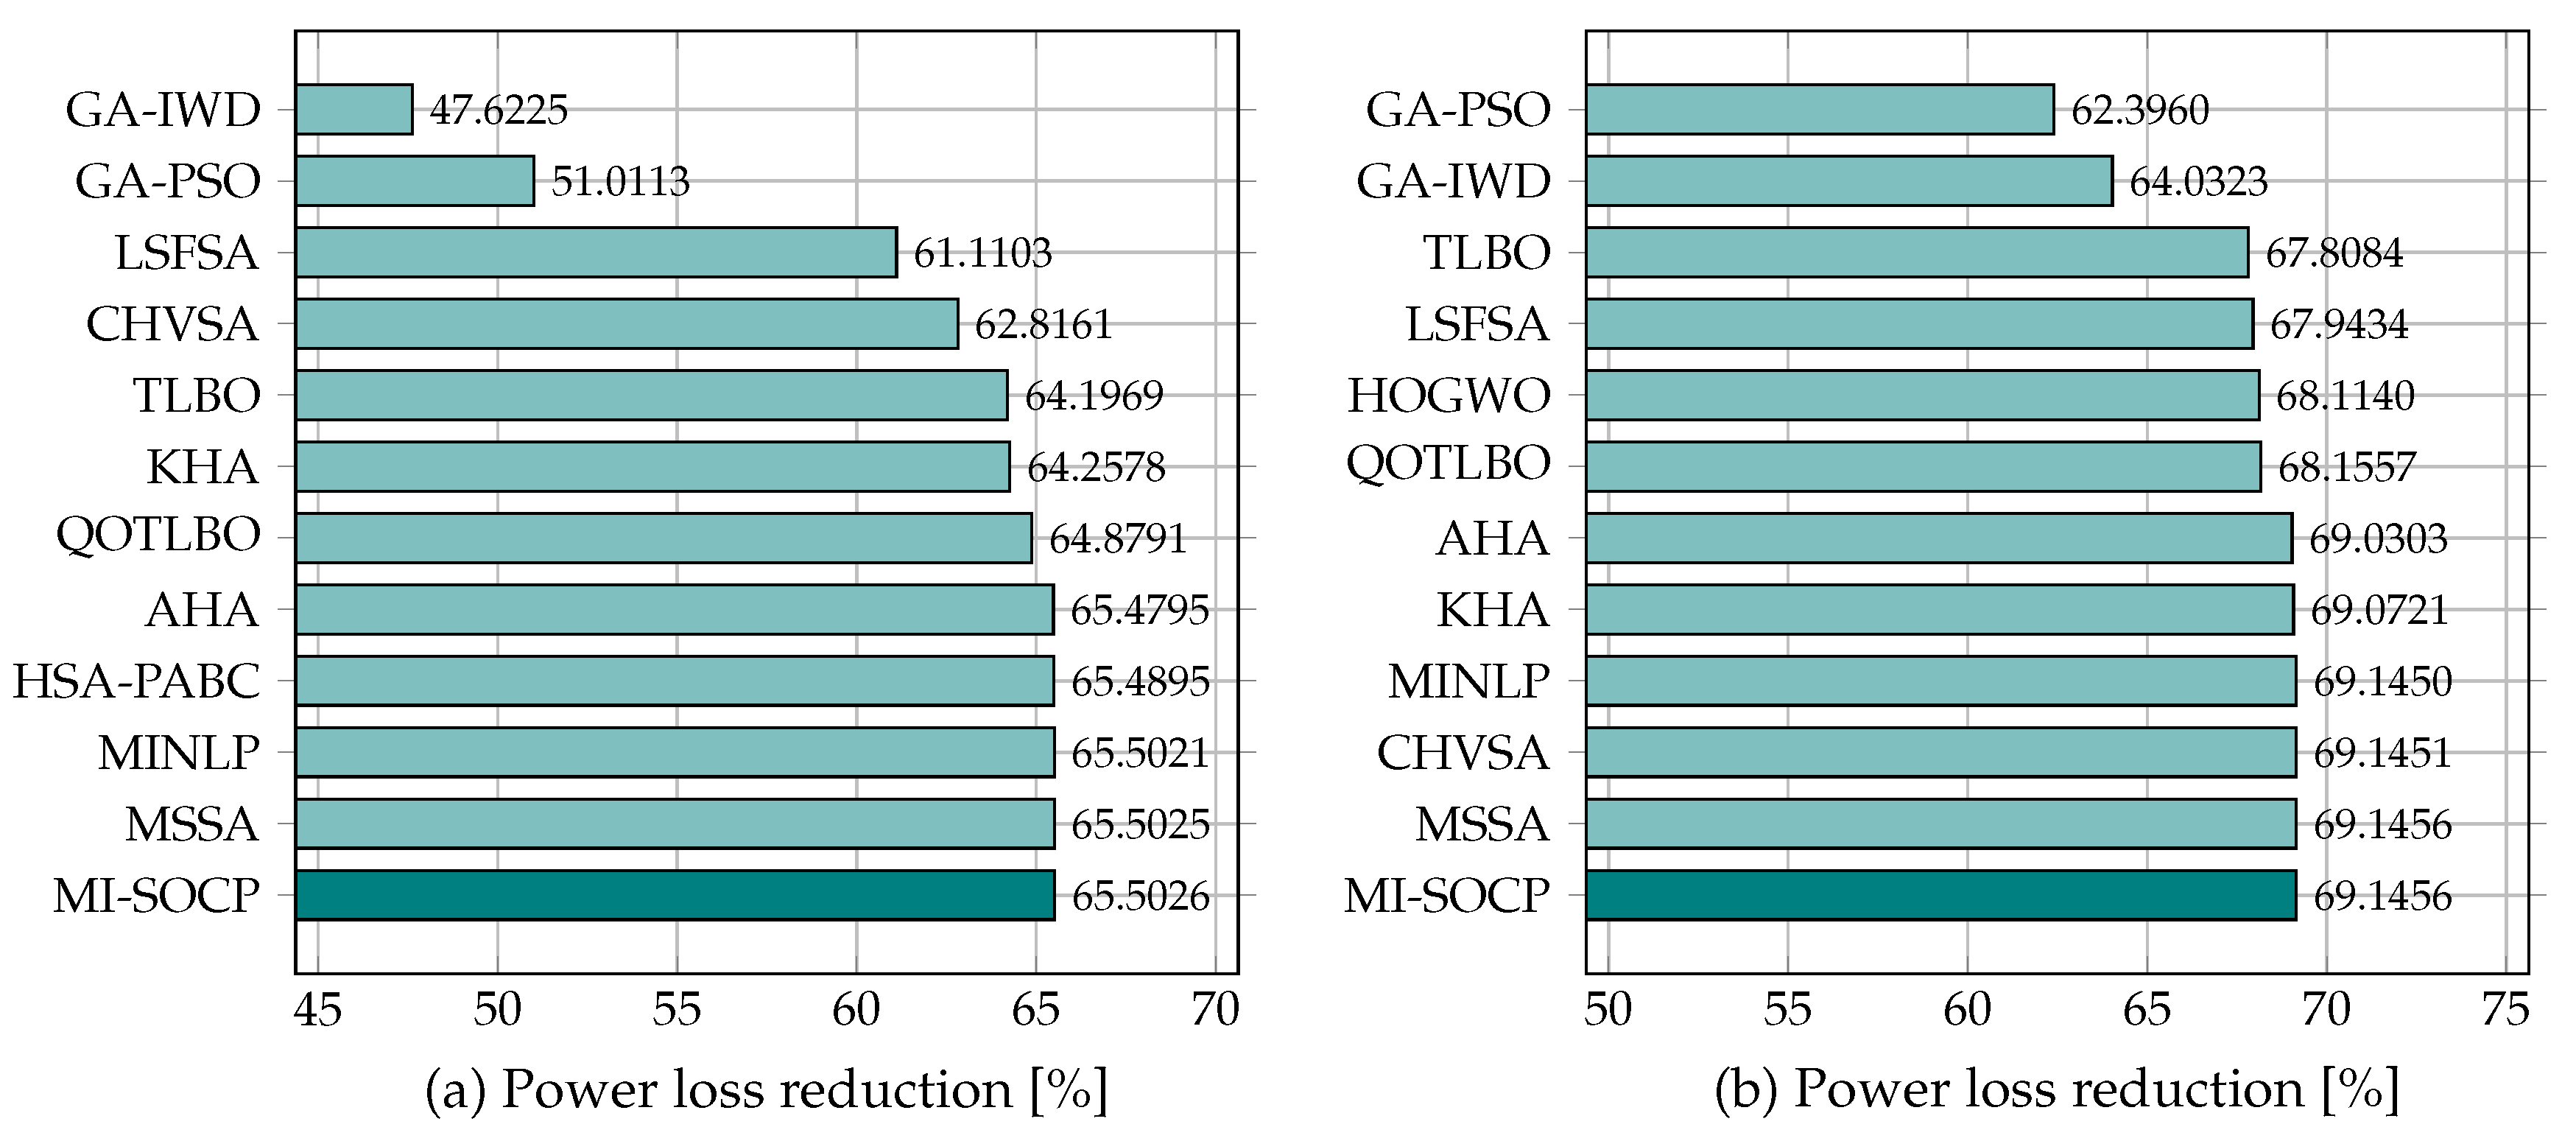
6.1. Results of Case-1

The proposed methodology for the IEEE 33-bus system is to multiples strategies presented in the literature, such as hybrid intelligent water drops and GA (GA-IWD) [31], mixed genetic algorithm with particle swarm optimization (GA-PSO) [32], loss sensitivity factor simulated annealing (LSFSA) [12], constructive heuristic vortex search algorithm (CHVSA) [33], teaching-learning based optimization (TLBO) [34], krill herd algorithm (KHA) [12], quasi-oppositional teaching-learning-based optimization (QOTLBO) [34], heuristic approach (AHA) [35], harmony search algorithm with particle swarm optimization (PSO) embedded artificial bee colony (HSA-PABC) [36], MINLP model [37], and mutated salp swarm algorithm (MSSA) [38]. For the IEEE 69-bus system, the proposed methodology is also compared to the same literature reported for Case-1 with the exception of the HSA-PABC approach since it did not report any information for this feeder. In addition, the hybrid teaching-learning-based optimization-grey wolf optimizer (HOGWO) reported by [39] has been included.
Remark 1.
The comparative shown for the distributed generators’ optimal locations and sizes have been taken from the original reports. This research’s main interest is to present an effective and robust optimization methodology via MI-SOCP to place and size DGs guaranteeing the global optimum finding when this is compared with the most classical and well-known metaheuristic approaches.
Table 2 presents the results for the optimal placement and sizing of DERs of the proposed convex model and those reported in the literature.
From Table 2, we can conclude that:
  • The proposed MI-SOCP model reaches the optimal solution of the relaxed convex model, which is indeed the optimal solution of the exact nonlinear model with final power losses of around 72.7853 kW and 69.4077 kW for the IEEE 33-bus and IEEE 69-bus systems, respectively. These results are the global optimum of the minimum of the studied problem;
  • In the literature, multiple methodologies have identified the same combination of buses for the optimal location of DERs. Nevertheless, the final generated active power by DERs is not equal to the output provided by the proposed MI-SOCP convex model. This entails that the difference lies in implementing optimal power flow since the SOCP model can ensure the global optimum of the problem;
  • The solution of the proposed MI-SOCP model can ensure that it is the optimal global solution for the IEEE 33-bus and IEEE 69-bus systems. This is because it has evaluated all the possible nodal combinations by using an exhaustive search combined with a classical optimal power flow (OPF) model solved via interior point methods.
Figure 4 depicts the power loss reductions reached for each methodology presented in Table 2. Note that the proposed convex model achieves the greatest reduction in power losses for the IEEE 33-bus system (see Figure 4a). While the IEEE 69-bus system, the MI-SOCP, and MSSA methodologies present the same power loss reduction (see Table 2), even their DERs sizing are different. This indicates that there are multiple global optima for this system, and there may be other sizes of DERs that reach the same power losses. The processing time for the IEEE 33- and 69-bus systems is 6.2 s and 49.7 s, respectively.

6.2. Results of Case-2

In Case-2, the proposed convex model is compared to improved analytical (IA) [40], particle swarm optimization (PSO) [41], and MINLP. Table 3 shows the results for IEEE 33-buses and IEEE 69-buses systems for the optimal placement and sizing of DERs.
Note in Table 3 that the MI-SOCP convex model proposed has a superior performance for placement and sizing of multiple DERs for both test systems with real and reactive power capability when compared with the other three methodologies. In addition, it can also be observed that the MI-SOCP and MINLP present the same placement for the DERs in the IEEE 33-bus system, but the proposed convex model achieves a better solution than the MINLP model. This is because the MINLP model can not guarantee the global optimum. While for the IEEE 69-bus system, none of the other methodologies could find the combination of buses for the location of the DERs. The power loss reduction in Table 3 confirms that the MI-SOCP convex model gives a maximum reduction of power losses. However, the total DERs power for the proposed convex model in the IEEE 33-bus system is slightly higher than the MINLP model. While for the IEEE 33-bus system, the total DERs power is slightly lower in the MI-SOCP convex model. Finally, the IEEE 33- and 69-bus systems’ processing time is 11.8 s and 75.1 s, respectively.

6.3. Comparison with a Hybrid Optimization Approach

To demonstrate the effectiveness and robustness of the proposed MI-SOCP model to determine the optimal location and sizing of renewable DGs in AC distribution networks, here, we present a comparison with hybrid optimization approaches that combines a discrete metaheuristic with a SOCP formulation to locate and size DGs in electrical distribution grids. This approach was initially presented in [21], and it works with the discrete version of the sine-cosine algorithm to determine the nodes where DGs will be located, while the SOCP is used to determine their optimal sizes (this approach is named DSCA-SOCP). In addition, we include comparisons with MINLP solvers available in the GAMS optimization tool. The renewable energy resources correspond to photovoltaic (PV) sources considering a typically daily generation curve and a daily load curve. These curves are presented in Figure 5. This comparison is considered the IEEE 69 node test feeder since these are more complex than the IEEE 33 node test feeder. Furthermore, the test feeder has about 50,116 possible combinations to locate three PV sources.
In the case of MINLP solvers, we consider the following optimization tools available in GAMS: Solvers BONMIN, COUENNE, and DICOPT, respectively. The complete comparison of the proposed MI-SOCP model with the DSCA-SOCP and the GAMS solvers is reported in Table 4.
The results in Table 4 demonstrate that: (i) With the location of three photovoltaic sources, the proposed approach, i.e., the proposed MI-SOCP and the DSCA-SOCP approaches, reduces the daily energy loss per day to about 638.1187 kWh/day, i.e., 23.93 % ; while the best GAMS approach using the COUENNE solver reach a reduction about 23.84 % . The solutions found by the different MINLP solvers in GAMS demonstrate that these stuck in optimal local solutions when compared with the optimal solution found by the MI-SOCP and the DSCA-SOCP methodologies, and (ii) in all the solutions presented in Table 4 nodes higher than 60 show the high power injection regarding PV penetration, which allows observing that these nodes are more sensitive to power injections when compared with the remainder of buses.
It is worth motioning that even if the DSCA-SOCP reach the same optimal solution of the proposed MI-SOCP approach, these methodologies are not comparable due to:
The DSCA-SOCP approach being a metaheuristic approach that requires a statistical test based on multiple evaluations to determine its capability of finding the global optimum. In this sense, after 100 consecutive evaluations, the DSCA-SOCP methodology reach the solution reported in Table 4 only 5 times, i.e., an efficiency of 5%, while the proposed MI-SOCP finds the same solution at each running, due to the convex structure of the solution space that guarantees the global optimum finding without recurring to statistical tests;
Each evaluation of the DSCA-SOCP approach (i.e., one complete evaluation) takes about 16,747.35 s with the main problem being that it is not possible to ensure the finding of the optimal solution while the proposed MI-SOCP only takes 315.60 s to determine the global optimal solution. These processing times show that our proposal is about 53 times more efficient than the DSCA-SOCP approach.

7. Conclusions

The problem in the optimal location and sizing of DERs in electrical AC distribution networks was addressed in this paper, from the exact mathematical optimization point of view. To solve the location problem, the classical and well-known Branch & Bound method was employed and in the case of the sizing problem, it was proposed as second-order cone relaxation of the optimal power flow problem. The combination of both approaches generated the MI-SOCP method proposed. The main advantages of our optimization proposal regarding current literature were: (i) The guarantee of finding the global optimum for each binary variable combination explored in the Branch & Bound stage since each node in this problem has a convex structure. (ii) The non-dependency of parametric adjustments since the MI-SOCP model is an exact approach that only requires an adequate representation of the optimal power flow problem, which allows repeatability in the solution at each simulation run. (iii) The easy extension of the proposed model from the unity power factor case to the variable one allows sizing the apparent power required in the DERs for minimizing the total grid power losses. Numerical results in the IEEE 33- and 69-bus systems demonstrated that for the unity power factor case were found too be the best solutions reported in the literature. While in the case of the variable power factor being improved, the best solutions in scientific research, in both cases with minimum computation efforts, i.e., low-processing times.
Numerical validations considering daily load and generation curves for photovoltaic sources demonstrated that the proposed MI-SOCP has the ability to achieve the global optimum, while hybrid metaheuristic approaches, i.e., the DSCA-SOCP, requires a statistical test to find the optimal solution without guaranteeing that these can be found. In addition, comparisons with MINLP solvers available for the GAMS optimization package demonstrates that the non-convex structure of the problem create an issue of having them stuck in local optimal solutions.
In future works, we suggest applying the proposed MI-SOCP problem to the following issues: (i) Optimal location of fixed-step capacitor banks with continuous and discrete capacities. (ii) The extension of the convex power flow to the optimal operation of battery packages in AC distribution networks, as well as in exploring their optimal locations and sizes, and (iii) the reformulation of the phase-balancing problem for AC networks from the convex point of view to minimize grid power losses with the guarantee of global convergence.

Author Contributions

Conceptualization, W.G.-G., A.G., and O.D.M.; Methodology, W.G.-G., A.G., and O.D.M.; Investigation, W.G.-G., A.G., and O.D.M.; Writing—review and editing, W.G.-G., A.G., O.D.M., and J.C.H.; All authors have read and agreed to the published version of the manuscript.

Funding

This research was funded by the Agencia Estatal de Investigación, Spain (AEI) and the Fondo Europeo de Desarrollo Regional (FEDER) aimed at the Challenges of Society (grant No. ENE 2017-83860-R “Nuevos servicios de red para microredes renovables inteligentes. Contribución a la generación distribuida residencial”).

Institutional Review Board Statement

Not applicable.

Informed Consent Statement

Not applicable.

Data Availability Statement

No new data were created or analyzed in this study. Data sharing is not applicable to this article.

Acknowledgments

This work was supported in part by the Centro de Investigación y Desarrollo Científico de la Universidad Distrital Francisco José de Caldas under grant 1643-12-2020 associated with the project: “Desarrollo de una metodología de optimización para la gestión óptima de recursos energéticos distribuidos en redes de distribución de energía eléctrica.” and in part by the Dirección de Investigaciones de la Universidad Tecnológica de Bolívar under grant PS2020002 associated with the project: “Ubicación óptima de bancos de capacitores de paso fijo en redes eléctricas de distribución para reducción de costos y pérdidas de energía: Aplicación de métodos exactos y metaheurísticos.”

Conflicts of Interest

The authors declare no conflict of interest.

Nomenclature

δ maximum deviation of the voltages (V).
B set of binary numbers.
C set of complex numbers.
ε set of branches.
N set of nodes.
x ̲ , x ¯ limits minimum and maximum of the corresponding variable x (VA).
d k load at node k (VA).
n T number of total DERs to be placed in the grid.
p L total power loss (W).
s k apparent power of existing generators at node k (VA).
s k new apparent power of new distributed resources at node k (VA).
s k m load flow in the line k m (VA).
u k , u m magnitude of voltages squared (V2).
V nom rated voltage of network (V).
v k , v n nodal voltages (V).
w k m entries of auxiliary matrix (V2).
y k m entries of the Y bus ( Ω ).
z k binary variable that indicates placement of DERs in node k.

References

  1. Kefayat, M.; Ara, A.L.; Niaki, S.N. A hybrid of ant colony optimization and artificial bee colony algorithm for probabilistic optimal placement and sizing of distributed energy resources. Energy Convers. Manag. 2015, 92, 149–161. [Google Scholar] [CrossRef]
  2. Montoya, O.D.; Gil-González, W.; Grisales-Noreña, L. Relaxed convex model for optimal location and sizing of DGs in DC grids using sequential quadratic programming and random hyperplane approaches. Int. J. Electr. Power Energy Syst. 2020, 115, 105442. [Google Scholar] [CrossRef]
  3. Montoya, O.D.; Gil-González, W.; Grisales-Noreña, L. An exact MINLP model for optimal location and sizing of DGs in distribution networks: A general algebraic modeling system approach. Ain Shams Eng. J. 2020, 11, 409–418. [Google Scholar] [CrossRef]
  4. Katyara, S.; Staszewski, L.; Leonowicz, Z. Protection coordination of properly sized and placed distributed generations–methods, applications and future scope. Energies 2018, 11, 2672. [Google Scholar] [CrossRef] [Green Version]
  5. Floudas, C.A.; Pardalos, P.M. (Eds.) Encyclopedia of Optimization; Springer: Berlin/Heidelberg, Germany, 2009. [Google Scholar] [CrossRef]
  6. Grisales-Noreña, L.F.; Gonzalez-Montoya, D.; Ramos-Paja, C.A. Optimal Sizing and Location of Distributed Generators Based on PBIL and PSO Techniques. Energies 2018, 11, 1018. [Google Scholar] [CrossRef] [Green Version]
  7. Prado, I.; Garces, L. Chu-Beasley genetic algorithm applied to the allocation of distributed generation. In Proceedings of the 2013 IEEE PES Conference on Innovative Smart Grid Technologies (ISGT Latin America), Sao Paulo, Brazil, 15–17 April 2013; pp. 1–7. [Google Scholar]
  8. Gandomkar, M.; Vakilian, M.; Ehsan, M. A genetic–based tabu search algorithm for optimal DG allocation in distribution networks. Electr. Power Compon. Syst. 2005, 33, 1351–1362. [Google Scholar] [CrossRef]
  9. Injeti, S.K.; Kumar, N.P. A novel approach to identify optimal access point and capacity of multiple DGs in a small, medium and large scale radial distribution systems. Int. J. Electr. Power Energy Syst. 2013, 45, 142–151. [Google Scholar] [CrossRef]
  10. Vc, V.R. Ant Lion optimization algorithm for optimal sizing of renewable energy resources for loss reduction in distribution systems. J. Electr. Syst. Inf. Technol. 2018, 5, 663–680. [Google Scholar]
  11. Reddy, P.D.P.; Reddy, V.V.; Manohar, T.G. Whale optimization algorithm for optimal sizing of renewable resources for loss reduction in distribution systems. Renew. Wind Water Sol. 2017, 4, 3. [Google Scholar] [CrossRef] [Green Version]
  12. Sultana, S.; Roy, P.K. Krill herd algorithm for optimal location of distributed generator in radial distribution system. Appl. Soft Comput. 2016, 40, 391–404. [Google Scholar] [CrossRef]
  13. Mohanty, B.; Tripathy, S. A teaching learning based optimization technique for optimal location and size of DG in distribution network. J. Electr. Syst. Inf. Technol. 2016, 3, 33–44. [Google Scholar] [CrossRef] [Green Version]
  14. HassanzadehFard, H.; Jalilian, A. A novel objective function for optimal DG allocation in distribution systems using meta-heuristic algorithms. Int. J. Green Energy 2016, 13, 1615–1625. [Google Scholar] [CrossRef]
  15. Nekooei, K.; Farsangi, M.M.; Nezamabadi-Pour, H.; Lee, K.Y. An improved multi-objective harmony search for optimal placement of DGs in distribution systems. IEEE Trans. Smart Grid 2013, 4, 557–567. [Google Scholar] [CrossRef]
  16. Othman, M.; El-Khattam, W.; Hegazy, Y.; Abdelaziz, A.Y. Optimal placement and sizing of voltage controlled distributed generators in unbalanced distribution networks using supervised firefly algorithm. Int. J. Electr. Power Energy Syst. 2016, 82, 105–113. [Google Scholar] [CrossRef]
  17. Sorensen, K. Metaheuristics—The metaphor exposed. Int. Trans. Oper. Res. 2015, 22, 3–18. [Google Scholar] [CrossRef]
  18. Heliodore, F.; Nakib, A.; Ismail, B.; Ouchraa, S.; Schmitt, L. Performance Evaluation of Metaheuristics. In Metaheuristics for Intelligent Electrical Networks; John Wiley & Sons Inc.: Hoboken, NJ, USA, 2017; pp. 43–58. [Google Scholar] [CrossRef]
  19. Eftimov, T.; Korošec, P. A novel statistical approach for comparing meta-heuristic stochastic optimization algorithms according to the distribution of solutions in the search space. Inf. Sci. 2019, 489, 255–273. [Google Scholar] [CrossRef]
  20. Xu, X.; Li, J.; Xu, Z.; Zhao, J.; Lai, C.S. Enhancing photovoltaic hosting capacity—A stochastic approach to optimal planning of static var compensator devices in distribution networks. Appl. Energy 2019, 238, 952–962. [Google Scholar] [CrossRef] [Green Version]
  21. Montoya, O.D.; Molina-Cabrera, A.; Chamorro, H.R.; Alvarado-Barrios, L.; Rivas-Trujillo, E. A Hybrid Approach Based on SOCP and the Discrete Version of the SCA for Optimal Placement and Sizing DGs in AC Distribution Networks. Electronics 2020, 10, 26. [Google Scholar] [CrossRef]
  22. Montoya, O.D.; Gil-González, W.; Grisales-Noreña, L.F. Hybrid GA-SOCP Approach for Placement and Sizing of Distributed Generators in DC Networks. Appl. Sci. 2020, 10, 8616. [Google Scholar] [CrossRef]
  23. Molzahn, D.K.; Hiskens, I.A. A Survey of Relaxations and Approximations of the Power Flow Equations. Found. Trends Electr. Energy Syst. 2019, 4. [Google Scholar] [CrossRef] [Green Version]
  24. Alizadeh, F.; Goldfarb, D. Second-order cone programming. Math. Program. 2003, 95, 3–51. [Google Scholar] [CrossRef]
  25. Boyd, S.; Boyd, S.P.; Vandenberghe, L. Convex Optimization; Cambridge University Press: Cambridge, UK, 2004. [Google Scholar]
  26. Low, S.H. Convex Relaxation of Optimal Power Flow—Part I: Formulations and Equivalence. IEEE Trans. Control Netw. Syst. 2014, 1, 15–27. [Google Scholar] [CrossRef] [Green Version]
  27. Benson, H.Y.; Saglam, U. Mixed Integer Second Order Cone Programming: A Survey. In Theory Driven by Influential Applications; INFORMS: Catonsville, MD, USA, 2014; Chapter 2; pp. 13–36. [Google Scholar] [CrossRef] [Green Version]
  28. Karmarkar, N. A new polynomial-time algorithm for linear programming. Combinatorica 1984, 4, 373–395. [Google Scholar] [CrossRef]
  29. Atamturk, A.; Gómez, A. Submodularity in Conic Quadratic Mixed 0–1 Optimization. Oper. Res. 2020, 68, 609–630. [Google Scholar] [CrossRef] [Green Version]
  30. Grant, M.; Boyd, S. CVX: Matlab Software for Disciplined Convex Programming, Version 2.1. 2014. Available online: http://cvxr.com/cvx (accessed on 3 July 2020).
  31. Moradi, M.; Abedini, M. A novel method for optimal DG units capacity and location in Microgrids. Int. J. Electr. Power Energy Syst. 2016, 75, 236–244. [Google Scholar] [CrossRef]
  32. Moradi, M.; Abedini, M. A combination of genetic algorithm and particle swarm optimization for optimal DG location and sizing in distribution systems. Int. J. Electr. Power Energy Syst. 2012, 34, 66–74. [Google Scholar] [CrossRef]
  33. Bocanegra, S.Y.; Montoya, O.D. Heuristic Approach for Optimal Location and Sizing of Distributed Generators in AC Distribution Networks. Wseas Trans. Power Syst. 2019, 14, 113–121. [Google Scholar]
  34. Sultana, S.; Roy, P.K. Multi-objective quasi-oppositional teaching learning based optimization for optimal location of distributed generator in radial distribution systems. Int. J. Electr. Power Energy Syst. 2014, 63, 534–545. [Google Scholar] [CrossRef]
  35. Bayat, A.; Bagheri, A. Optimal active and reactive power allocation in distribution networks using a novel heuristic approach. Appl. Energy 2019, 233-234, 71–85. [Google Scholar] [CrossRef]
  36. Muthukumar, K.; Jayalalitha, S. Optimal placement and sizing of distributed generators and shunt capacitors for power loss minimization in radial distribution networks using hybrid heuristic search optimization technique. Int. J. Electr. Power Energy Syst. 2016, 78, 299–319. [Google Scholar] [CrossRef]
  37. Kaur, S.; Kumbhar, G.; Sharma, J. A MINLP technique for optimal placement of multiple DG units in distribution systems. Int. J. Electr. Power Energy Syst. 2014, 63, 609–617. [Google Scholar] [CrossRef]
  38. Gholami, K.; Parvaneh, M.H. A mutated salp swarm algorithm for optimum allocation of active and reactive power sources in radial distribution systems. Appl. Soft Comput. 2019, 85, 105833. [Google Scholar] [CrossRef]
  39. Nowdeh, S.A.; Davoudkhani, I.F.; Moghaddam, M.H.; Najmi, E.S.; Abdelaziz, A.; Ahmadi, A.; Razavi, S.; Gandoman, F. Fuzzy multi-objective placement of renewable energy sources in distribution system with objective of loss reduction and reliability improvement using a novel hybrid method. Appl. Soft Comput. 2019, 77, 761–779. [Google Scholar] [CrossRef]
  40. Hung, D.Q.; Mithulananthan, N. Multiple distributed generator placement in primary distribution networks for loss reduction. IEEE Trans. Ind. Electron. 2011, 60, 1700–1708. [Google Scholar] [CrossRef]
  41. Jain, N.; Singh, S.; Srivastava, S. A generalized approach for DG planning and viability analysis under market scenario. IEEE Trans. Ind. Electron. 2012, 60, 5075–5085. [Google Scholar] [CrossRef]
Figure 1. Representation of the second order cone Ω = x z . with x R 2 and z R .
Applsci 11 00627 g001
Figure 2. Schematic representation of the branch and bound method for mixed-integer second-order cone programming (MI-SOCP) problems.
Applsci 11 00627 g002
Figure 3. Electrical configuration of the test systems: (a) IEEE 33-bus system and (b) IEEE 69-bus system.
Applsci 11 00627 g003
Figure 4. Power loss reduction for Case-1: (a) IEEE 33-bus system and (b) IEEE 69-bus system.
Applsci 11 00627 g004
Figure 5. Behavior of the photovoltaic (PV) generation and the demand during a typically operation day [21].
Applsci 11 00627 g005
Table 1. Identification of model properties.
EquationProperty
(1)convex objective (quadratic-convex form)
(2)non-convex
(3)non-convex
(4)convex (SOCP constraint)
(5)convex (box constraint)
()convex (box constraint)
(8)convex (affine inequality constraint)
(7)binary constraint
Table 2. Comparative results for the optimal placement and sizing of distributed energy resources (DERs) for the IEEE 33-bus and IEEE 69-bus systems for Case-1.
MethodLoss [kW]Location (Node)Size [MW]
IEEE 33-bus system
GA-IWD [31]110.5100{11,16,32}{1.2214,0.6833,1.2135}
GA-PSO [32]103.3600{11,16,32}{0.9250,0.8630,1.2000}
LSFSA [12]82.0525{6,18,30}{1.1124,0.4874,0.8679}
CHVSA [33]78.4534{6,14,31}{1.1846,0.6468,0.6881}
TLBO [34]75.5400{10,24,31}{0.8246,1.0311,0.8862}
KHA  [12]75.4116{13,25,30}{0.8107,0.8368,0.8410}
QOTLBO  [34]74.1008{12,24,29}{0.8808,1.0592,1.0714}
AHA [35]72.8340{13,24,30}{0.7920,1.0680,1.0270}
HSA-PABC [36]72.8129{14,24,30}{0.7550,1.0730,1.0680}
MINLP [37]72.7862{13,24,30}{0.8000,1.0900,1.0500}
MSSA [38]72.7854{13,24,30}{0.8010,1.0910,1.0530}
MI-SOCP72.7853{13,24,30}{0.8018,1.0913,1.0536}
IEEE 69-bus system
GA-PSO [32]84.5909{21,61,63}{0.9105,1.1926,0.8849}
GA-IWD [31]80.9100{20,61,64}{0.9115,1.3926,0.8059}
TLBO [34]72.4157{15,61,63}{0.5919,0.8188,0.9003}
LSFSA [12]72.1120{18,60,65}{0.4204,1.3311,0.4298}
HOGWO [39]71.7281{18,61,62}{0.5330,1.0000,0.7730}
QOTLBO  [34]71.6345{18,61,63}{0.5334,1.1986,0.5672}
AHA [35]69.6669{12,21,61}{0.4710,0.3120,1.6890}
KHA  [12]69.5730{12,22,61}{0.4962,0.3113,1.7354}
MINLP [37]69.4090{11,17,61}{0.5300,0.3800,1.7200}
CHVSA [33]69.4088{11,17,61}{0.5284,0.3794,1.7186}
MSSA [38]69.4077{11,18,61}{0.5260,0.3800,1.7180}
MI-SOCP69.4077{11,18,61}{0.5268,0.3801,1.7190}
Table 3. Comparative results for the optimal placement and sizing of DERs for the IEEE 33-bus and IEEE 69-bus systems for Case-2.
MethodLoss [kW]Location (Node)Size [MW]Size [MVAr]DER Power [MVA]Loss Red. [%]
IEEE 33-bus system
IA [40]23.05{06,14,30}{1.0590,0.7410,1.0590}{0.6563,0.4592,0.6563}2.85989.09
PSO [41]15.00{13,24,30}{0.7640,1.0680,1.0160}{0.5350,0.6130,0.6910}3.39592.89
MINLP [37]12.74{13,24,30}{0.7660,1.0440,1.1460}{0.4110,0.5520,0.8590}3.48192.89
MI-SOCP11.7401{13,24,30}{0.7939,1.0700,1.0297}{0.3734,0.5171,1.0115}3.50994.44
IEEE 69-bus system
IA [40]5.0839{17,50,61}{0.6300,0.9000,0.9000}{0.3900,0.5570,0.5570}3.52497.74
PSO [41]5.0839{18,50,61}{0.7640,1.0680,1.0160}{0.5350,0.6130,0.6910}3.54597.74
MINLP [37]4.2695{11,17,61}{0.7660,1.0440,1.1460}{0.4110,0.5520,0.8590}3.12398.1020
MI-SOCP4.2667{11,18,61}{0.4945,0.3783,1.6743}{0.3533,0.2510,1.1954}3.11998.1033
Table 4. Optimal placement and sizing of renewables considering daily curves in the IEEE 69-node test feeder.
MethodNodesActive Power (MW) E loss (kWh/day)
Base case2666.2860
GAMS-BONMIN 27 , 61 , 64 0.4366 , 1.6744 , 0.3253 2046.0656
GAMS-COUENNE 12 , 18 , 61 0.4990 , 0.3808 , 1.9254 2030.5272
GAMS-DICOPT 11 , 17 , 64 0.6900 , 0.4194 , 1.6626 2074.0086
DSCA-SOCP 11 , 18 , 61 0.5655 , 0.4197 , 1.9079 2028.1673
MI-SOCP 11 , 18 , 61 0.5655 , 0.4197 , 1.9079 2028.1673
Publisher’s Note: MDPI stays neutral with regard to jurisdictional claims in published maps and institutional affiliations.

