Article

The Modified Void Nucleation and Growth Model (MNAG) for Damage Evolution in BCC Ta

1
Materials Science in Radiation and Dynamic Extremes Group (MST-8), Materials Science and Technology Division, Los Alamos National Laboratory, Los Alamos, NM 87545, USA
2
The Fluid Dynamics and Solid Mechanics Group (T-3), Theoretical Division, Los Alamos National Laboratory, Los Alamos, NM 87545, USA
*
Author to whom correspondence should be addressed.
Appl. Sci. 2021, 11(8), 3378; https://doi.org/10.3390/app11083378
Submission received: 18 February 2021 / Revised: 3 April 2021 / Accepted: 4 April 2021 / Published: 9 April 2021
(This article belongs to the Special Issue Fracture Mechanics – Theory, Modeling and Applications)

Abstract

:
A void coalescence term was proposed as an addition to the original void nucleation and growth (NAG) model to accurately describe void evolution under dynamic loading. The new model, termed as modified void nucleation and growth model (MNAG model), incorporated analytic equations to explicitly account for the evolution of the void number density and the void volume fraction (damage) during void nucleation, growth, as well as the coalescence stage. The parameters in the MNAG model were fitted to molecular dynamics (MD) shock data for single-crystal and nanocrystalline Ta, and the corresponding nucleation, growth, and coalescence rates were extracted. The results suggested that void nucleation, growth, and coalescence rates were dependent on the orientation as well as grain size. Compared to other models, such as NAG, Cocks–Ashby, Tepla, and Tonks, which were only able to reproduce early or later stage damage evolution, the MNAG model was able to reproduce all stages associated with nucleation, growth, and coalescence. The MNAG model could provide the basis for hydrodynamic simulations to improve the fidelity of the damage nucleation and evolution in 3-D microstructures.

Graphical Abstract

1. Introduction

Under dynamic loading, ductile metals fail by nucleation of voids at weak regions in the microstructure followed by growth and coalescence of these voids until complete failure. In this process, many contributing factors, including the exact loading condition (which determines the stress history), the weak spots (heterogeneities such as pre-existing and as-nucleated defects and grain boundaries that act as void nucleation sites), as well as the required stress at which voids start to nucleate and grow, dictates where, when, and at what rate damage accumulates in the microstructure and the overall failure behavior. Understanding the micro-mechanisms and kinetics of the above processes is critical to predicting damage evolution in a given microstructure, as well as establishing guidelines for the design of damage-resistant microstructures. As a result, many efforts have been devoted to understanding damage nucleation and evolution under such loading conditions [1,2]. For example. Javier et al. investigated the orientation and size effects on void growth behavior in both single-crystal [3,4] as well as polycrystalline microstructures [5].
In this work, we focused on a special case of failure that occurs under uniaxial tensile strain and high strain rate, i.e., spall failure. Spall fracture is a dynamic failure process characterized by nucleation, growth, and coalescence of voids leading up to the complete failure of the material [6,7]. During spall failure, the generated strain rates in the material are typically in the order of 104–108 s−1, depending on the loading platform, resulting in damage initiation and growth in a very short time. The fine temporal and spatial resolution involved with measuring void nucleation and growth rates make it a challenging problem for measuring experimentally. For example, in laser-induced shock, under an average strain rate of 107–108 s−1, spallation takes place in a matter of a few nanoseconds [8]. While there had been work done for understanding the origins of void nucleation in metals [9,10,11,12], only a handful of works investigated the rate of void growth and coalescence as a function of microstructure under shock loading [13,14,15].
A number of theories have been proposed in the past few decades to hypothesize the mechanisms responsible for void growth under such loading. The majority of these models fell loosely into two categories: diffusion-transport-based models and dislocation-emission-based models. Cuitiño and Ortiz proposed a pipe-diffusion mechanism for void condensation to account for void growth [16]. It was shown that the above diffusion-transport-based models were only applicable under low to medium strain rate loading, such as the ones generated during creep deformation, as the typical time required for voids to grow to nanometer (nm) size through diffusion was in the order of microseconds to seconds [17]. Under high strain rate loading, such as laser-shock loading, which typically lasts for a few ns [18], there was not enough time for voids to grow to even nm size based on these diffusion models. Under such high strain rate loading, dislocation-emission-based models are used to describe void growth [19,20,21]. For example, Lubarda et al. [17] proposed the generation of geometrically necessary dislocations (prismatic and shear loops) to be responsible for void growth, which was reminiscent of the dislocation-emission-governed crack blunting mechanism proposed by Rice et al. [22]. In general, prismatic loops were generated at the surface of a void and transported material away from the void surface, leading to void growth, whereas shear-loops could lead to an octahedral shape of the void because they nucleated on the slip planes that intersected the void surface. The observation of slip bands emanating from void surfaces in Cu rendered support to the shear-loop-emission-governed void growth [23,24]. It was further shown that the critical stress required for dislocating emission from the surface of a void decreased with its radius [17,25], indicating that void growth governed by dislocation emission should proceed exponentially with time. Remington et al. showed that, under laser shock compression and release, spallation occurred primarily at the grain boundaries in poly- and ultra-fine-grained Ta and proposed a dislocation-emission-based model to explain the faster intergranular void growth rate [8]. Another dislocation-based crystal-plasticity-based model proposed by Thao et al. suggested that local stress concentration generated by elastic and plastic anisotropies across a Grain boundary (GB) was a dominant factor in determining its propensity to nucleate and grow voids at GBs [15]. Moreover, continuous void growth upon nucleation was governed by the retarding effects of dislocation kinetics and micro-inertia of the material, incorporated through dislocation-based plasticity and relativistic drag-based visco-plasticity, respectively [26]. For example, Wilkerson et al. proposed a dislocation-kinetics-based void growth model [27] that was able to reproduce the void size distribution in spall surfaces of laser-shocked Cu as observed experimentally [28]. In addition to these works, there were also efforts to combine the above two models to investigate both creep and ductile failure [29].
Based on these theories, a few analytical models were developed to explicitly address the kinetics of void nucleation and growth processes, thus allowing for the prediction of damage evolution over time. For example, Cocks and Ashby formulated evolution laws governing damage rate and strain rate, assuming void growth through the power-law creep mechanism [30]. However, the Cocks–Ashby model predicted void growth at low strain rates as the ones observed during creep only and did not deal with void nucleation kinetics. In general, Cocks–Ashby model was only applicable to the growth of a uniform dilute distribution of identical voids under low strain rate loading. Based on macroscopic observations of ductile fractures in Cu and Al during 1-D flyer-plate impact experiments, Seaman et al. proposed void nucleation and growth model (NAG model), wherein evolution laws for both nucleation and growth were incorporated based on a statistical treatment of void distribution, rather than a single void [31,32,33]. A newer model developed by Tonks [34] extended the Cocks–Ashby model for application to high strain rate loading, including a nucleation model and early void growth behavior intended to represent the dynamic stress release upon nucleation. Under a narrow set of stress states, the driving force for void growth behavior in this model was equivalent to the tensile plasticity (TEPLA) model introduced by Addessio and Johnson [35]. The latter model was an extension of the Gurson-based pore growth threshold surface to dynamic conditions [36]. Along the same lines, a few spallation models were proposed to predict the variation in spall strength with the strain rate based on void nucleation and growth dynamics [37,38]. Additionally, a variety of constitutive models were proposed to investigate the effect of void size and shape, stress triaxiality, and anisotropy on damage nucleation [39,40,41,42,43,44,45,46,47,48,49]. Most of these models were parameterized to specific experimental data to reproduce results in that narrow range of loading conditions only [50,51,52].
Efforts were also made to apply the aforementioned analytical models to void evolution data extracted from molecular dynamics (MD) simulations for Face Centered Cubic (FCC) metals such as Cu and Al. For example, Rawat et al. studied the temperature sensitivity of the NAG model parameters fitted to MD-predicted void evolution in single-crystal Cu under triaxial expansion [53]. Another study on void evolution in single-crystal and nanocrystalline Al under triaxial tension suggested, while the grain size could alter the number of voids, it did not alter the overall void volume fraction. In general, the void nucleation and growth threshold stresses obtained from the data fit the NAG model for nanocrystalline Al, which were lower than in single-crystal Al [54]. However, as the above models did not incorporate the dynamics of void coalescence, which is crucial to define the later stage damage accumulation under high strain-rate loading; the applicability of these models to the available experimental as well as MD dynamic loading data was rather limited.
The objectives of this work were:
(1)
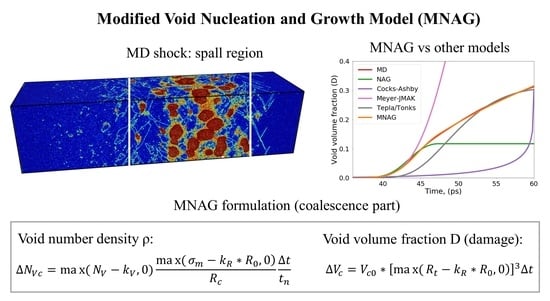
To propose a modified NAG model, which we term as the MNAG model, to better describe void evolution at later times through the addition of a term to describe void coalescence. This robustness of this new analytical form was tested against the other commonly used damage models by using void evolution data generated from MD simulations.
(2)
To evaluate and compare several widely utilized semi-analytical damage models in terms of how well they could describe the void evolution behavior, as extracted from MD shock loading simulations, using single-crystal and nanocrystalline Ta as model systems.
(3)
To utilize the extract parameters associated with void nucleation, growth, and coalescence rates from specific simulations and to provide insights into the role of crystal orientation and grain size in dictating damage, which remained a challenge under dynamic loading.
This paper is organized in the following manner: The computational methods are presented in Section 2. Description of the MNAG model, its application to Ta, comparison of MNAG model to other damage models, as well as the size effects are presented in Section 3. Finally, a brief conclusion is presented in Section 4.

2. Computational Methods

Molecular dynamics shock simulations were performed using the flyer-plate impact method wherein one-third of the system along the shock (Z) direction was chosen as the flyer and impacted against the rest of the system with a velocity of 1 km/s. The dimensions of the simulation cell used in this study were ~42 × ~42 × ~150 nm, containing ~15 million atoms. Additional details regarding the method can be found in [55]. Ta2 Embedded Atom Method (EAM) potential developed by Ravelo et al. [56] was used to define interatomic interactions. The MD simulations were carried out using the open-source software LAMMPS [57], with a time step of 2 fs. The atomic configurations generated were visualized with OVITO [58].
In order to calculate the void growth rate, it was important to first identify these voids. This was achieved by dividing the system into cubic voxels where a void was defined as a cluster of two or more continuous (interconnected) empty voxels [9,59], with an edge length of 4 Å. The region of interest here (spall region, shown in Figure 1) was the region where maximum tensile stress was achieved and contained nearly all the voids in the entire simulation cell. The evolution of the void number density and volume fraction was obtained from this spall region, which was found to be about one-third of the total length of the simulation cell along the shock direction. Here, we characterized the damage as the void volume fraction. In this paper, all future mentions of void number density and volume fraction referred strictly to the voids in the spall region only, rather than in the entire simulation cell.

3. Results and Discussion

3.1. The NAG Model

The NAG model, based on the Curran–Seaman–Shockey (CSS) theory [31,32], attributed the evolution of the total void volume in a system to void nucleation and growth [31,32]. Without loss of generality, the initial volume was assumed to be unity. At a given time interval t , the number density of voids due to the nucleation process, N V n , is expressed as:
N V n = 8 π t N o ˙ e x p max ( σ m σ n 0 ,   0 ) σ n ,   σ m > σ n 0
N V n = 0 ,   σ m < σ n 0
The void volume, V n , due to the void number density, N V n , is thus:
V n = N V n k V s R 0 3
where N o ˙ is the base void nucleation rate, σ m is the tensile stress, σ n 0 is the threshold stress beyond which voids start to nucleate, σ n is the reference stress for void nucleation, R 0 is the void nucleation radius, and k V s is a unitless scaling constant that we added here to account for the initial size of voids. It is important to note that this parameter was not present in the original NAG model. The void nucleation term contributed to a steady increase in the total damage at the initial stage where void nucleation was dominant.
The void volume due to the void growth process, V g , in the original NAG model is expressed as:
V g = V t e x p 3 4 m a x ( σ m σ g 0 ,   0 η t 1
where V t   is the current void volume, σ g 0 is the threshold stress beyond which voids start to grow, and   η is the material viscosity that dictates the void growth rate sensitivity. The void growth term contributed to the exponential growth of damage following void nucleation.
In the original NAG model, the change in the number density of voids, N V , was only due to void nucleation:
N V = N V n
And the total change in the void volume, V , was the sum of V n , V g :
V = V n + V g
The damage D, as characterized by the void volume fraction, at time t, is:
D = V t 1 + V t
where V t is the current void volume. Typically, the above parameters in the NAG model were obtained through calibration of the above equations to velocity-time data from experiments, for example, in the continuum damage model DFRACT package [61]. Although the NAG model provided a statistical treatment of void nucleation and growth process, it lacked an explicit treatment of void coalescence, which was a crucial contributor to later stages of damage accumulation. In addition, due to the lack of in-situ evolution of void number density and damage data obtained through experiments, there was no way to validate these parameters in terms of their capability to capture the full-time evolution of void number density and damage.

3.2. The MNAG Model

In the MNAG model, we kept the original void nucleation and growth terms as proposed in the NAG model but added the void coalescence term that accounted for the evolution of the void number density as well as damage primarily during the void coalescence stage. This model accounted for the long-term evolution of damage—a regime where most models did not perform well.

3.2.1. Void Coalescence Term

Void coalescence dominated at later times when voids that had grown substantially during the growth stage interacted with each other via the local stress fields [62]. The probability of such void coalescence events was directly related to the number density as well as the size of the voids. Here we assumed for simplicity that the change (reduction) in the number density of voids due to void coalescence was linearly dependent on the current void number density as well as the void radius at the growth stage. In addition, we introduced the concept of the characteristic void size, R t , as a measure of the ensemble average void size. At time interval t , the change in R t , can be expressed as:
R t = R t exp 1 4 max ( σ m σ g 0 ,   0 η t 1
This term is very similar in the analytical form to the void growth term in the original NAG model.
Assuming a critical number density, k V , and critical void radius k R R 0 beyond which void coalescence took place, the reduction in the void number density due to coalescence is:
N V c = max ( N V k V , 0 ) max R t k R R 0 ,   0 R c t t n
where N V is the current void number density, k V is the critical void number density above which coalescence occurs, R t is the current typical void radius, k R is a unitless scaling constant for the critical void radius,   R 0 is the void nucleation radius, R c is a void coalescence reference radius with the same unit as R t , and t n is a scaling constant for time and assumed to be 1 ps.
As we assumed spherical voids in this paper, the contribution to the void volume, V c , should be directly related to R t 3 and expressed as:
V c = V c 0 m a x ( R t k R R 0 ,   0 ) 3 t
where V c 0 is the base void coalescence rate (units m−3 ps−1). Hence, the change in the void number density, N V , due to void nucleation and coalescence in the MNAG model is:
N V = N V n N V c
Additionally, in the MNAG model, we proposed that the change in the total void volume, V , in a time interval t , should be:
V = V n + V g + V c
The damage D could still be calculated based on Equation (7).
There were other models like Tepla and Tonks that incorporated the void coalescence in their analytical forms (Tonks et al., 1999). Our results from the MNAG model were compared to these models in later sections.

3.2.2. Stress Evolution

To derive the damage evolution from Equations (1)–(12), it was necessary to measure the stress evolution as a function of time. Typically, the damage was modeled as a stress-dependent quantity [63]. Here, instead, we treated stress as an independently varying state and proposed the following expression to simulate the stress evolution observed in MD simulations:
σ m = σ s p a l l t d t t s t a r t t o f f s e t 2 + 1
where σ s p a l l is the spall strength calculated from the pull-back signal in the free surface velocity profile, t s t a r t is the time at which void nucleation starts, t o f f s e t is the delay in attaining peak tensile stress following void nucleation, and t d controls how fast the stress decays and is unitless in this form. It was set to be 0.04 based on Figure 2 (to match the modeling data). Figure 2 shows a simulated stress evolution vs. time as compared to the average stress in the spall region measured in MD simulations. The goal here was to use a general analytical form to obtain a faithful representation of the stress evolution in the system, based on data that was easily accessible from experiments or other platforms. It was noted here that the rate at which stress decays would depend on the loading rate, and hence, t d was specific to the loading condition used in the set of simulations in this work. In addition, while σ s p a l l was easily calculated from experiments, advanced experiments using diagnostics such as phase-contrast imaging will probably be required to get t s t a r t and   t o f f s e t .

3.3. Parameterization of the MNAG Model

In this section, we used some model molecular dynamics simulations to test the new analytical form of the MNAG model against the void evolution data obtained from these simulations. The MNAG model was also compared with other commonly used models later in the paper. It is important to note that the parameters in Table 1, Table 2 and Table 3 were specific to the simulation conditions used to obtain them. If the loading conditions were altered, there should be a change in a few of the parameters. The goal here was to check the robustness of the analytical form and not so much the specific values of the parameters. However, in order to check the robustness of the analytical form, we also attempted to interpret the physical meaning of the obtained parameters against the simulations and known damage mechanisms as a function of microstructure.

3.3.1. Single-Crystal Ta

Table 1 shows a set of parameters used as initial values for the MNAG model. With these initial values, the above equations were integrated over time to derive the full evolution of void number density and damage, allowing the adjustable parameters to vary in order to fit the MD data. Here, we fixed the base void nucleation rate N o ˙ at 1.5 × 10²² m−3 ps−1, void nucleation threshold σ n 0 at σ s p a l l × 0.7, material viscosity η at 20 GPa ps, and critical void number density k V at 1.5 × 1024 m−3. These parameters were derived based on a preliminary fitting of the model based on data from single-crystal Ta. In addition, the material viscosity chosen was close to the value reported in Ref. [64]. Such treatment reduced the number of fitting parameters and resolved the problem of multiple solutions during fitting. The fitting of the MNAG parameters was carried out using the Extended Kalman Filter (EKF; [65]), where, starting from the initial set of parameters in Table 1, the integration was performed with a time step to get the final damage and the errors were propagated backward to update the parameters until convergence was reached (as indicated by no appreciable change in the parameters). An integration time step of 0.2 ps was shown to be small enough to achieve convergence, as demonstrated in Figure S4 in the Supplementary Materials.
Thus, there were seven adjustable parameters remaining in the MNAG model (highlighted in bold in Table 1). There were two adjustable parameters for the void nucleation term: void nucleation reference stress σ n and void size scaling constant k V s ; one adjustable parameter for the void growth term: void growth threshold stress σ g 0 ; three adjustable parameters for the void coalescence term: critical void coalescence radius scaling constant k R , void coalescence reference radius R c , base void coalescence rate V c 0 ; and one adjustable parameter for stress evolution: offset time for peak stress t o f f s e t . Among all these parameters:
  • σ n most significantly affected the void number density and the resulting damage due to void nucleation: the lower the value of σ n , the higher the rate of void nucleation;
  • σ g 0 most significantly affected the growth of existing voids at tensile stress above σ g 0 : the lower the value of σ g 0 , the higher the rate of void growth;
  • V c 0   most significantly affected the slope of the quasi-linear growth during the void coalescence stage: the greater value of V c 0   led to a higher rate of void coalescence.
The fitted number density and damage in single-crystal Ta along the (001), (110), and (111) orientations are shown in Figure 3. Three stages of void evolution could be observed in these plots: SI, SII, and SIII. SI (35–42 ps): the void number density increased rapidly until it peaked; SII (42–45 ps): exponential growth of existing voids under high tensile stresses; SIII (from 45 ps on): multiple coalescence events due to a high number density of the voids (beyond the critical number density k V ), which experienced significant growth in SII. The contribution from void coalescence to the void volume increased smoothly until ~48 ps. However, when the stress dropped below σ n 0 and σ g 0 , the void nucleation and growth became negligible. As such, R t plateaus, and thus V c in Equation (10) was reduced to a quasi-linear contribution term, i.e., asymptotic growth of voids [38]. It was noted here that although we divided the void evolution into distinct stages, as discussed above, the void nucleation and growth took place in both SI and SII, and void coalescence took place in all stages, as could be observed from the right-hand panels in Figure 3. MD snapshots showing damage distribution at various stages were provided in Figure S3 in the Supplementary Materials.
Additionally, Figure 3 shows that the (001) orientation had a different time evolution for void nucleation/growth compared to the (110) and (111) orientations. As can be seen from Table 2, compared to the other two orientations, (001) had a (1) higher void nucleation stress σ n , which corresponded to a lower void nucleation rate; (2) lower void growth threshold stress σ g 0 , which corresponded to a higher void growth rate; and (3) higher base void coalescence rate V c 0 , which corresponded to a higher void coalescence rate. These observations were in line with the trends shown in the right-hand panels in Figure 3. These differences were also highlighted in Figure 4 that shows snapshots of the single-crystal Ta along the above three orientations at 50 ps. The average size of voids along the (001) orientation (Figure 4a) was observed to be larger than that along the other two orientations (Figure 4b,c). This arose from the void-growth-and-coalescence-dominated failure along with the (001) orientation, as compared to void-nucleation-dominated failure along the other two orientations. This had previously been linked to the propensity of each orientation to nucleate twins under shock, which could act as void nucleation sites [66]. Since the parameters were in line with the actual snapshots highlighting the physics of damage and failure in Ta, this example clearly showed that the parameters in the MNAG model could be used to obtain mechanistic information about the damage evolution and how it depended on the microstructure.

3.3.2. Nanocrystalline Ta

To further test the robustness of the MNAG model, additional shock simulations were performed on modified microstructures in Ta—in this case, nanocrystalline Ta with varying grain sizes. The fitted void number density and damage based on the MNAG model, compared to the MD data, are shown in Figure 5 for nanocrystalline Ta with grain sizes of 20 nm, 10 nm, and 5 nm. At the smaller grain size, there was a higher number density of voids due to a greater fraction of grain boundaries that served as void nucleation sites. However, the overall damage evolution did not show any significant variation in grain size. In addition, from the right-hand panels in Figure 5, it could be observed that void coalescence set in earlier in nanocrystalline Ta compared to the single-crystal Ta. This could be explained by the fact that most of the voids nucleated at grain boundaries and, as a result, coalesced relatively easily along the grain boundaries due to higher local stresses as well as faster matter transport at the grain boundaries [67].
The fitted set of MNAG parameters for these simulations are listed in Table 3. With the decrease in grain size, there was a decrease in the void nucleation stress σ n , which suggested a higher void nucleation rate due to a higher number of void nucleation sites at a smaller grain size. The void growth threshold σ g 0 was similar for a grain size of 20 nm and 10 nm but much higher for 5 nm suggesting arrested void growth at a small grain size of 5 nm. For all the grain sizes, the void coalescence coefficient, V c 0 , was similar suggesting that the void coalescence rate was insensitive to the grain size in the range of grain sizes considered here. Therefore, the spall failure was void-nucleation dominated at a smaller grain size of 5 nm, and void-growth dominated at a larger grain size of 10 nm and 20 nm, whereas the void coalescence rate was insensitive to the grain size. As a result, the final amount of damage was similar for all grain sizes, as shown in Figure 5.

3.4. The MNAG Model: Comparison to Other Models

To evaluate the robustness of the MNAG model, its performance was compared to a few commonly used damage models:
  • The original NAG model [31,32].
  • The Cocks–Ashby model based on the power-law creep [30,68].
  • The Meyer–JMAK treatment: the void growth model based on the Curran–Seaman–Shockey (CSS) theory [31,32] and the Johnson–Mehl–Avrami–Kolmogorov (JMAK) equations [8,69,70,71,72,73] proposed by Meyers et al. [8].
  • The Tepla model based on the Gurson model [35,41].
  • The Tonks model based on the pore growth solution proposed by Cocks [34,74].
The parameters for all of these models (that are described in detail in the Supplementary Materials) were obtained by fitting them to the same MD data for void nucleation, growth, and coalescence generated from the shock-loaded (001) single-crystal Ta.
Figure 6a shows the fitted results of the original NAG model compared to the current MD results. In general, the NAG model behaved similarly to the MNAG model during SI and SII in terms of both void number density and damage. However, it failed to reproduce the quasi-linear growth of voids at the later stage (SIII in Figure 6a), as void coalescence was not accounted for in the original model. Based on the original NAG model, when σ s dropped below both σ n 0 and σ g 0 , void growth ceased, and the damage showed a saturation instead of a quasi-linear growth in SIII. Additionally, the original NAG model incorrectly showed a continuous increase in the void number density in SII, which reached a steady state in SIII; yet the void number density should actually decrease as voids continue to grow and coalesce in SII and SIII. The Cocks–Ashby model in Figure 6b demonstrated a gradual increase in damage accumulation until it reached ~0.1 and then increased exponentially. This was different from the MD results that showed a steady increase in the damage following an initial exponential growth. The Meyer–JMAK treatment in Figure 6c described SI and SII quite well. Specifically, the damage evolution matched well with the MD results at N o ˙ = 7 × 10⁻⁷ m−3 s−1 until ~45 ps, after which void coalescence became significant resulting in a large discrepancy between the model and the MD results. Such behavior was similar to the original NAG model as they both were based on the Curran–Seaman–Shockey (CSS) theory.
Figure 6d shows the results for the Tepla and the Tonks models. These two models were shown to be identical for certain parameter constraints under purely hydrostatic loading and could be fitted to reproduce either the early-stage behavior (SI and SII in case 1) or the later stage (SIII in case 2) behavior, but not all stages simultaneously. The above comparison clearly demonstrated that the MNAG model performed well in terms of reproducing the damage evolution in all stages, unlike the other damage models that excelled in accurately representing damage only at early or late times. More detailed information on the above models can be found in the Supplementary Materials.

3.5. The MNAG Model: Size Effects

Additional simulations were performed to evaluate the sensitivity of the current results of the system size. These simulations involved the use of larger cell dimensions for the (001) single-crystal Ta and the re-fitting of the MNAG model parameters to the new MD results. The evolution of the number density and damage as a function of the system size is shown in Figure 7. This figure showed that the contribution from void nucleation, growth, and coalescence to total void volume decreased with increasing cell dimensions. This suggested that greater cell dimensions reduced the rate of all three stages of damage evolution due to the lower strain rate involved (the strain rate was a function of cell dimensions). The fitted void volume fraction was close to that of MD, although the fitted void number density showed minor deviations from MD at larger cell dimensions. However, the overall trends in void number density and damage did not change with the system size, even though there were changes in the quantitative values. Therefore, the analytical form of the MNAG model was general and could qualitatively represent damage evolution as a function of time.

4. Conclusions

The performance of a few common damage models was compared to the void number density and damage calculated from MD simulations using shock-loaded single-crystal and nanocrystalline Ta as model systems. Damage models including, the NAG and Meyer–JMAK treatment, performed well in reproducing the void nucleation and growth stages of damage evolution. However, due to the lack of explicit terms related to void coalescence, these models failed to accurately reproduce the long-time evolution of the void number density and damage. The Tepla and Tonks models were able to reproduce either the void nucleation and growth stag or the void coalescence stage alone but not all stages, without the addition of other physical insights. In light of this, a modified void nucleation and growth (MNAG) model was proposed, with the addition of a new term to represent void coalescence. The form of the MNAG model was able to represent all stages of the void evolution compared to the models shown above. It was important to note that the MNAG parameters listed in this paper were specific to the simulation data used to fit them. If the loading conditions or the materials were changed, it would alter the void nucleation stress and, eventually, the total damage evolution. In that case, the MNAG model would need to be reparametrized for those specific cases. In general, when the damage models were used in hydrocode simulations, they were specifically parameterized to represent a narrow set of data. There was no expectation that the same parameter sets could be used interchangeably, irrespective of loading conditions or materials. While there was much effort to develop more physics-based predictive damage models, current analytical models that were parameterized based on experimental and modeling data continue to be used widely to describe the damage in materials.

Supplementary Materials

The following are available online at https://www.mdpi.com/article/10.3390/app11083378/s1: Figure S1—Damage (void volume fraction) evolution based on Cocks-Ashby model with different choices of n, as compared to MD results for [001] single-crystal Ta; Figure S2—Damage (void volume fraction) evolution based on Meyer-JMAK treatment, with different choices of N o ˙ , as compared to MD results for [001] single-crystal Ta.; Figure S3—Snapshots of [001] single crystal Ta at different times.; Figure S4—Evolution of number density and volume fraction of voids for [001] single-crystal Ta.

Author Contributions

S.J.F., D.J.L. and J.C. conceptualized the idea, J.C. performed the simulations, analysis and wrote the paper. S.J.F. and D.J.L. secured funding, reviewed the work and helped edit the manuscript. All authors have read and agreed to the published version of the manuscript.

Funding

This work was supported by the US Department of Energy through the Los Alamos National Laboratory.

Institutional Review Board Statement

Not applicable.

Informed Consent Statement

Not applicable.

Data Availability Statement

This data can be obtained by emailing the corresponding author.

Acknowledgments

The MD simulations utilized resources provided by the LANL Institutional Computing Program. This work was supported by the US Department of Energy through the Los Alamos National Laboratory. The Los Alamos National Laboratory is operated by Triad National Security, LLC, for the National Nuclear Security Administration of U.S. Department of Energy (Contract No. 89233218CNA000001).

Conflicts of Interest

The authors declare no conflict of interest.

References

  1. Chang, H.J.; Segurado, J.; Rodríguez de la Fuente, O.; Pabón, B.M.; Llorca, J. Molecular Dynamics Modeling and Simulation of Void Growth in Two Dimensions. Model. Simul. Mater. Sci. Eng. 2013, 21, 075010. [Google Scholar] [CrossRef] [Green Version]
  2. Jing, P.; Yuan, L.; Shivpuri, R.; Xu, C.; Zhang, Y.; Shan, D.; Guo, B. Evolution of Spherical Nanovoids within Copper Polycrystals during Plastic Straining: Atomistic Investigation. Int. J. Plast. 2018, 100, 122–141. [Google Scholar] [CrossRef]
  3. Segurado, J.; Llorca, J. An Analysis of the Size Effect on Void Growth in Single Crystals Using Discrete Dislocation Dynamics. Acta Mater. 2009, 57, 1427–1436. [Google Scholar] [CrossRef]
  4. Segurado, J.; Llorca, J. Discrete Dislocation Dynamics Analysis of the Effect of Lattice Orientation on Void Growth in Single Crystals. Int. J. Plast. 2010, 26, 806–819. [Google Scholar] [CrossRef] [Green Version]
  5. Segurado, J.; Lebensohn, R.A.; Llorca, J.; Tomé, C.N. Multiscale Modeling of Plasticity Based on Embedding the Visco-plastic Self-consistent Formulation in Implicit Finite Elements. Int. J. Plast. 2012, 28, 124–140. [Google Scholar] [CrossRef]
  6. Kanel, G.I. Spall Fracture: Methodological Aspects, Mechanisms and Governing Factors. Int. J. Fract. 2010, 163, 173–191. [Google Scholar] [CrossRef]
  7. Meyers, M.A.; Aimone, C.T. Dynamic Fracture (Spalling) of Metals. Prog. Mater. Sci. 1983, 28, 1–96. [Google Scholar] [CrossRef]
  8. Remington, T.; Hahn, E.; Zhao, S.; Flanagan, R.; Mertens, J.; Sabbaghianrad, S.; Langdon, T.; Wehrenberg, C.; Maddox, B.; Swift, D.; et al. Spall Strength Dependence on Grain Size and Strain Rate in Tantalum. Acta Mater. 2018, 158, 313–329. [Google Scholar] [CrossRef] [Green Version]
  9. Dongare, A.M.; Rajendran, A.M.; LaMattina, B.; Zikry, M.A.; Brenner, D.W. Atomic Scale Simulations of Ductile Failure Micromechanisms in Nanocrystalline Cu at High Strain Rates. Phys. Rev. B 2009, 80, 104108. [Google Scholar] [CrossRef] [Green Version]
  10. Escobedo, J.P.; Dennis-Koller, D.; Cerreta, E.K.; Patterson, B.M.; Bronkhorst, C.A.; Hansen, B.L.; Tonks, D.; Lebensohn, R.A. Effects of Grain Size and Boundary Structure on the Dynamic Tensile Response of Copper. J. Appl. Phys. 2011, 110, 033513. [Google Scholar] [CrossRef] [Green Version]
  11. Fensin, S.; Escobedodiaz, J.P.; Brandl, C.; Cerreta, E.; Gray, G.; Germann, T.C.; Valone, S.M. Effect of Loading Direction on Grain Boundary Failure under Shock Loading. Acta Mater. 2014, 64, 113–122. [Google Scholar] [CrossRef]
  12. Minich, R.W.; Cazamias, J.U.; Kumar, M.; Schwartz, A.J. Effect of Microstructural Length Scales on Spall Behavior of Copper. Met. Mater. Trans. A 2004, 35, 2663–2673. [Google Scholar] [CrossRef]
  13. Moore, J.A.; Li, S.F.; Rhee, M.; Barton, N.R. Modeling the Effects of Grain and Porosity Structure on Copper Spall Response. J. Dyn. Behav. Mater. 2018, 4, 464–480. [Google Scholar] [CrossRef]
  14. Nguyen, T.; Luscher, D.; Wilkerson, J. A Dislocation-based Crystal Plasticity Framework for Dynamic Ductile Failure of Single Crystals. J. Mech. Phys. Solids 2017, 108, 1–29. [Google Scholar] [CrossRef]
  15. Nguyen, T.; Luscher, D.; Wilkerson, J. The Role of Elastic and Plastic Anisotropy in Intergranular Spall Failure. Acta Mater. 2019, 168, 1–12. [Google Scholar] [CrossRef]
  16. Cuitiño, A.; Ortiz, M. Ductile Fracture by Vacancy Condensation in fcc Single Crystals. Acta Mater. 1996, 44, 427–436. [Google Scholar] [CrossRef]
  17. Lubarda, V.; Schneider, M.; Kalantar, D.; Remington, B.; Meyers, M. Void Growth by Dislocation Emission. Acta Mater. 2004, 52, 1397–1408. [Google Scholar] [CrossRef]
  18. Remington, T.P.; Remington, B.A.; Hahn, E.N.; Meyers, M.A. Deformation and Failure in Extreme Regimes by High-energy Pulsed Lasers: A Review. Mater. Sci. Eng. A 2017, 688, 429–458. [Google Scholar] [CrossRef] [Green Version]
  19. Krasnikov, V.; Mayer, A. Plasticity Driven Growth of Nanovoids and Strength of Aluminum at High Rate Tension: Molecular Dynamics Simulations and Continuum Modeling. Int. J. Plast. 2015, 74, 75–91. [Google Scholar] [CrossRef]
  20. Shanthraj, P.; Zikry, M. Dislocation-density Mechanisms for Void Interactions in Crystalline Materials. Int. J. Plast. 2012, 34, 154–163. [Google Scholar] [CrossRef]
  21. Wilkerson, J. On the Micromechanics of Void Dynamics at Extreme Rates. Int. J. Plast. 2017, 95, 21–42. [Google Scholar] [CrossRef]
  22. Rice, J.R.; Thomson, R. Ductile vs. Brittle Behaviour of Crystals. Philos. Mag. 1974, 29, 73–97. [Google Scholar] [CrossRef]
  23. Meyers, M.A.; Traiviratana, S.; Lubarda, V.A.; Benson, D.J.; Bringa, E.M. The Role of Dislocations in the Growth of Nanosized Voids in Ductile Failure of Metals. Jom 2009, 61, 35. [Google Scholar] [CrossRef]
  24. Traiviratana, S.; Bringa, E.M.; Benson, D.J.; Meyers, M.A. Void Growth in Metals: Atomistic Calculations. Acta Mater. 2008, 56, 3874–3886. [Google Scholar] [CrossRef]
  25. Lubarda, V.A. Emission of Dislocations from Nanovoids under Combined Loading. Int. J. Plast. 2011, 27, 181–200. [Google Scholar] [CrossRef]
  26. Feng, C.; Cui, Z. A 3-D Model for Void Evolution in Viscous Materials under Large Compressive Deformation. Int. J. Plast. 2015, 74, 192–212. [Google Scholar] [CrossRef]
  27. Wilkerson, J.; Ramesh, K. A Dynamic Void Growth Model Governed by Dislocation Kinetics. J. Mech. Phys. Solids 2014, 70, 262–280. [Google Scholar] [CrossRef]
  28. Moshe, E.; Eliezer, S.; Dekel, E.; Ludmirsky, A.; Henis, Z.; Werdiger, M.; Goldberg, I.B.; Eliaz, N.; Eliezer, D. An Increase of the Spall Strength in Aluminum, Copper, and Metglas at Strain Rates Larger Than 107 s−1. J. Appl. Phys. 1998, 83, 4004–4011. [Google Scholar] [CrossRef] [Green Version]
  29. Besson, J. Damage of Ductile Materials Deforming under Multiple Plastic or Viscoplastic Mechanisms. Int. J. Plast. 2009, 25, 2204–2221. [Google Scholar] [CrossRef]
  30. Cocks, A.; Ashby, M. On Creep Fracture by Void Growth. Prog. Mater. Sci. 1982, 27, 189–244. [Google Scholar] [CrossRef]
  31. Curran, D.R.; Seaman, L.; Shockey, D.A. Dynamic Failure in Solids. Phys. Today 1977, 30, 46. [Google Scholar] [CrossRef]
  32. Seaman, L.; Curran, D.R.; Shockey, D.A. Computational Models for Ductile and Brittle Fracture. J. Appl. Phys. 1976, 47, 4814–4826. [Google Scholar] [CrossRef]
  33. Shockey, D.A.; Seaman, L.; Curran, D.R. The Micro-statistical Fracture Mechanics Approach to Dynamic Fracture Problems. Int. J. Fract. 1985, 27, 145–157. [Google Scholar] [CrossRef]
  34. Tonks, D.L.; Zurek, A.K.; Thissell, W.R.; Rivera, J.M.; Hixson, R.S. Importance of Deviatoric Stress in Modeling Void Growth in Ductile Fracture; Los Alamos National Lab.: Los Alamos, NM, USA, 1999. [Google Scholar]
  35. Addessio, F.L.; Johnson, J.N. Rate-dependent Ductile Failure Model. J. Appl. Phys. 1993, 74, 1640–1648. [Google Scholar] [CrossRef]
  36. Johnson, J.N. Dynamic Fracture and Spallation in Ductile Solids. J. Appl. Phys. 1981, 52, 2812–2825. [Google Scholar] [CrossRef] [Green Version]
  37. Dekel, E.; Eliezer, S.; Henis, Z.; Moshe, E.; Ludmirsky, A.; Goldberg, I.B. Spallation Model for the High Strain Rates Range. J. Appl. Phys. 1998, 84, 4851–4858. [Google Scholar] [CrossRef]
  38. Kuksin, A.Y.; Norman, G.E.; Pisarev, V.V.; Stegailov, V.V.; Yanilkin, A.V. Theory and Molecular Dynamics Modeling of Spall Fracture in Liquids. Phys. Rev. B 2010, 82, 174101. [Google Scholar] [CrossRef] [Green Version]
  39. Gao, X.; Zhang, T.; Hayden, M.; Roe, C. Effects of the Stress State on Plasticity and Ductile Failure of an Aluminum 5083 Alloy. Int. J. Plast. 2009, 25, 2366–2382. [Google Scholar] [CrossRef]
  40. Garajeu, M.; Michel, J.; Suquet, P. A Micromechanical Approach of Damage in Viscoplastic Materials by Evolution in Size, Shape and Distribution of Voids. Comput. Methods Appl. Mech. Eng. 2000, 183, 223–246. [Google Scholar] [CrossRef]
  41. Gurson, A.L. Continuum Theory of Ductile Rupture by Void Nucleation and Growth: Part I—Yield Criteria and Flow Rules for Porous Ductile Media. J. Eng. Mater. Technol. 1977, 99, 2–15. [Google Scholar] [CrossRef]
  42. Keralavarma, S.; Benzerga, A. A Constitutive Model for Plastically Anisotropic Solids with Non-spherical Voids. J. Mech. Phys. Solids 2010, 58, 874–901. [Google Scholar] [CrossRef]
  43. Keralavarma, S.; Hoelscher, S.; Benzerga, A. Void Growth and Coalescence in Anisotropic Plastic Solids. Int. J. Solids Struct. 2011, 48, 1696–1710. [Google Scholar] [CrossRef] [Green Version]
  44. Kim, J.; Gao, X.; Srivatsan, T.S. Modeling of Void Growth in Ductile Solids: Effects of Stress Triaxiality and Initial Porosity. Eng. Fract. Mech. 2004, 71, 379–400. [Google Scholar] [CrossRef]
  45. Lebensohn, R.A.; Escobedo, J.P.; Cerreta, E.K.; Dennis-Koller, D.; Bronkhorst, C.A.; Bingert, J.F. Modeling Void Growth in Polycrystalline Materials. Acta Mater. 2013, 61, 6918–6932. [Google Scholar] [CrossRef]
  46. Lecarme, L.; Tekog, L.C.; Pardoen, T. Void Growth and Coalescence in Ductile Solids with Stage III and Stage IV Strain Hardening. Int. J. Plast. 2011, 27, 1203–1223. [Google Scholar] [CrossRef]
  47. Ling, C.; Besson, J.; Forest, S.; Tanguy, B.; Latourte, F.; Bosso, E. An Elastoviscoplastic Model for Porous Single Crystals at Finite Strains and Its Assessment Based on Unit Cell Simulations. Int. J. Plast. 2016, 84, 58–87. [Google Scholar] [CrossRef]
  48. Pardoen, T.; Hutchinson, J. An Extended Model for Void Growth and Coalescence. J. Mech. Phys. Solids 2000, 48, 2467–2512. [Google Scholar] [CrossRef]
  49. Tvergaard, V. Material Failure by Void Growth to Coalescence. Adv. Appl. Mech. 1989, 27, 83–151. [Google Scholar]
  50. Molinari, A.; Wright, T. A Physical Model for Nucleation and Early Growth of Voids in Ductile Materials under Dynamic Loading. J. Mech. Phys. Solids 2005, 53, 1476–1504. [Google Scholar] [CrossRef]
  51. Wright, T.; Ramesh, K. Dynamic Void Nucleation and Growth in Solids: A Self-consistent Statistical Theory. J. Mech. Phys. Solids 2008, 56, 336–359. [Google Scholar] [CrossRef]
  52. Wright, T.; Ramesh, K. Statistically Informed Dynamics of Void Growth in Rate Dependent Materials. Int. J. Impact Eng. 2009, 36, 1242–1249. [Google Scholar] [CrossRef]
  53. Rawat, S.; Warrier, M.; Chaturvedi, S.; Chavan, V.M. Temperature Sensitivity of Void Nucleation and Growth Parameters for Single Crystal Copper: A Molecular Dynamics Study. Model. Simul. Mater. Sci. Eng. 2011, 19, 025007. [Google Scholar] [CrossRef]
  54. Yang, X.; Zeng, X.; Wang, J.; Wang, F.; Ding, J. Atomic-scale Modeling of the Void Nucleation, Growth, and Coalescence in Al at High Strain Rates. Mech. Mater. 2019, 135, 98–113. [Google Scholar] [CrossRef]
  55. Chen, J.; Hahn, E.N.; Dongare, A.M.; Fensin, S.J. Understanding and Predicting Damage and Failure at Grain Boundaries in BCC Ta. J. Appl. Phys. 2019, 126, 165902. [Google Scholar] [CrossRef]
  56. Ravelo, R.; Germann, T.C.; Guerrero, O.; An, Q.; Holian, B.L. Shock-induced Plasticity in Tantalum Single crystals: In-teratomic Potentials and Large-scale Molecular-dynamics Simulations. Phys. Rev. B 2013, 88, 134101. [Google Scholar] [CrossRef] [Green Version]
  57. Plimpton, S. Fast Parallel Algorithms for Short-Range Molecular Dynamics. J. Comput. Phys. 1995, 117, 1–19. [Google Scholar] [CrossRef] [Green Version]
  58. Alexander, S. Visualization and Analysis of Atomistic Simulation Data with OVITO–the Open Visualization Tool. Modell. Simul. Mater. Sci. Eng. 2010, 18, 015012. [Google Scholar]
  59. Dongare, A.; Rajendran, A.M.; LaMattina, B.; Zikry, M.A.; Brenner, D.W. Atomic Scale Studies of Spall Behavior in Nanocrystalline Cu. J. Appl. Phys. 2010, 108, 113518. [Google Scholar] [CrossRef]
  60. Kelchner, C.L.; Plimpton, S.J.; Hamilton, J.C. Dislocation Nucleation and Defect Structure during Surface Indentation. Phys. Rev. B 1998, 58, 11085–11088. [Google Scholar] [CrossRef]
  61. Jacobi, S.; Zaretsky, E.; Shvarts, D. Experimental Examination and Numerical NAG Model Analysis of Spall Sensitivity to Microstructure in Copper. Le J. Phys. Colloq. 2000, 10, 9–805. [Google Scholar] [CrossRef]
  62. Orsini, V.; Zikry, M. Void Growth and Interaction in Crystalline Materials. Int. J. Plast. 2001, 17, 1393–1417. [Google Scholar] [CrossRef]
  63. De Brauer, A.; Rai, N.; Nixon, M.; Udaykumar, H. Modeling Impact-induced Damage and Debonding Using Level Sets in a Sharp Interface Eulerian Framework. Int. J. Numer. Methods Eng. 2018, 115, 1108–1137. [Google Scholar] [CrossRef]
  64. Ishikawa, T.; Paradis, P.-F.; Okada, J.T.; Kumar, M.V.; Watanabe, Y. Viscosity of Molten Mo, Ta, Os, Re, and W Measured by Electrostatic Levitation. J. Chem. Thermodyn. 2013, 65, 1–6. [Google Scholar] [CrossRef]
  65. Watanabe, K.; Tzafestas, S.G. Learning Algorithms for Neural Networks with the Kalman Filters. J. Intell. Robot. Syst. 1990, 3, 305–319. [Google Scholar] [CrossRef]
  66. Hahn, E.N.; Fensin, S.J.; Germann, T.C.; Gray, G.T. Orientation Dependent Spall Strength of Tantalum Single Crystals. Acta Mater. 2018, 159, 241–248. [Google Scholar] [CrossRef]
  67. Bringa, E.M.; Traiviratana, S.; Meyers, M.A. Void Initiation in Fcc Metals: Effect of Loading Orientation and Nanocrystalline Effects. Acta Mater. 2010, 58, 4458–4477. [Google Scholar] [CrossRef]
  68. Cocks, A.C.F.; Ashby, M.F. Intergranular Fracture during Power-law Creep under Multiaxial Stresses. Met. Sci. 1980, 14, 395–402. [Google Scholar] [CrossRef]
  69. Johnson, W.A.; Mehl, R.F. Reaction Kinetics in Processes of Nucleation and Growth. Trans. Metall. Soc. AIME 1939, 135, 416–442. [Google Scholar]
  70. Avrami, M. Kinetics of Phase Change. I General Theory. J. Chem. Phys. 1939, 7, 1103–1112. [Google Scholar] [CrossRef]
  71. Avrami, M. Kinetics of Phase Change. II Transformation-Time Relations for Random Distribution of Nuclei. J. Chem. Phys. 1940, 8, 212–224. [Google Scholar] [CrossRef]
  72. Avrami, M. Granulation, Phase Change, and Microstructure Kinetics of Phase Change. III. J. Chem. Phys. 1941, 9, 177–184. [Google Scholar] [CrossRef]
  73. Kolmogorov, A.N. On the Statistical Theory of the Crystallization of Metals. Bull. Acad. Sci. USSR Math. Ser. 1937, 1, 355–359. [Google Scholar]
  74. Cocks, A. Inelastic Deformation of Porous Materials. J. Mech. Phys. Solids 1989, 37, 693–715. [Google Scholar] [CrossRef]
Figure 1. (a) Snapshot of (001) single-crystal Ta at the time associated with a maximum in void number where atoms are colored based on the centrosymmetric parameters [60], (b) distribution of the void volume fraction along the length of the simulation cell (Z direction).
Applsci 11 03378 g001
Figure 2. Stress evolution in (001) single-crystal Ta as a function of time under shock loading along with the simulated stress evolution.
Applsci 11 03378 g002
Figure 3. MNAG model fitted to single-crystal Ta along: (a) (001), (b) (110]), and (c) (111) orientation. The left-hand panels show the evolution of the void number density and damage based on MD and the MNAG model parameters, and the right-hand panels show the evolution of stress ( σ m ) and the contribution from void nucleation, growth, and coalescence terms over time based on the MNAG model.
Applsci 11 03378 g003
Figure 4. Snapshots of single-crystal Ta along (a) (001), (b) (110), and (c) (111) orientation at 50 ps. The atoms are colored based on centrosymmetric parameters [60].
Applsci 11 03378 g004
Figure 5. The MNAG model fitted to nanocrystalline Ta with different grain sizes: (a) 20 nm, (b) 10 nm, (c) 5 nm. The left-hand panels show the void number density and damage based on MD and MNAG model, and the right-hand panels show the contribution from void nucleation, growth, and coalescence term over time based on the MNAG model.
Applsci 11 03378 g005
Figure 6. Damage evolution based on (a) the NAG model, (b) the Cocks–Ashby model with different choices of the parameter n, (c) the Meyer–JMAK treatment with different choices of the parameter N o ˙ , (d) the Tepla and Tonks models compared to the MD results for (001) single-crystal Ta. The three distinct stages SI, SII, and SIII are marked with dashed lines.
Applsci 11 03378 g006
Figure 7. The MNAG model fitted to (001) single-crystal Ta with cell dimensions of: (a) 63 × 63 × 225 nm, (b) 95 × 95 × 338 nm. The left-hand panels show the evolution of the void number density and damage based on the MD and MNAG model, and the right-hand panels show the evolution of stress ( σ m ) and the contribution from void nucleation, growth and coalescence term over time based on MNAG model.
Applsci 11 03378 g007
Table 1. The initial parameters in the MNAG model obtained from shock simulations of single crystal Ta.
MNAG ParametersRegimeInitial ValueCalibrated
N o ˙ Void nucleation1.5 × 1022 m−3 ps−1No
σ n 0 Void nucleation P s p a l l × 0.7No
σ n Void nucleation5 GPaYes
k V s Void nucleation1Yes
σ g 0 Void growth5 GPaYes
η Void growth20 GPa psNo
k V Void coalescence1.5 × 1024 m−3No
k R Void coalescence1Yes
R c Void coalescence5 × 10−9 mYes
V c 0 Void coalescence1025 m−3 ps−1Yes
t o f f s e t Stress evolution3 psYes
Table 2. Fitted MNAG parameters for different orientations in shock loaded single-crystal Ta.
Parameters(001)(110)(111)
N o ˙ 1.5 × 10²² m−3 ps−11.5 × 10²² m−3 ps−11.5 × 10²² m−3 ps−1
σ n 0 14.32 GPa14.47 GPa15.24 GPa
σ n 4.38 GPa2.34 GPa2.72 GPa
k V s 2.392.052.06
σ g 0 6.32 GPa7.01 GPa7.44 GPa
η 20 GPa ps20 GPa ps20 GPa ps
k V 1.5 × 1024 m−31.5 × 1024 m−31.5 × 1024 m−3
k R 1.121.281.51
R c 4.63 × 10⁻⁹ m7.41 × 10−9 m8.23 × 10−9 m
V c 0 3.05 × 1025 m−3 ps−13.01 × 1025 m−3 ps−12.95 × 1025 m−3 ps−1
t o f f s e t 4 ps6.5 ps7.5 ps
Table 3. Fitted MNAG parameters for nanocrystalline Ta.
Parameters20 nm10 nm5 nm
N o ˙ 1.5 × 10²² m−3 ps−11.5 × 10²² m−3 ps−11.5 × 10²² m−3 ps−1
σ n 0 11.66 GPa12.24 GPa13.38 GPa
σ n 2.87 GPa2.46 GPa2.33 GPa
k V s 2.352.051.77
σ g 0 4.57 GPa4.57 GPa5.17 GPa
η 20 GPa ps20 GPa ps20 GPa ps
k V 1.5 × 1024 m−31.5 × 1024 m−31.5 × 1024 m−3
k R 0.640.620.79
R c 3.71 × 10⁻⁹ m4.52 × 10−9 m7.24 × 10−9 m
V c 0 3.15 × 1025 m−3 ps−13.18 × 1025 m−3 ps−13.16 × 1025 m−3 ps−1
t o f f s e t 3.5 ps2.5 ps2.5 ps
Publisher’s Note: MDPI stays neutral with regard to jurisdictional claims in published maps and institutional affiliations.

