1. Introduction
Manufacturing an accurate dental prosthesis requires an accurate impression to be obtained. Precision impression materials, such as polyether and polyvinyl siloxane, have traditionally been used to fabricate fixed prostheses, and these have been selected by many clinicians for decades due to their excellent volume stability and precision [
1]. However, the traditional method has inherent errors due to the shrinkage of the impression material during polymerization and expansion of the gypsum. The dimensional stability of the impression materials is also affected by the temperature, the time taken to make a model after taking the impression, the surface wettability of the gypsum, and the disinfection process [
2,
3,
4,
5,
6].
Taking an impression for an implant prosthesis requires accurately transferring the position and orientation of the implant fixture, as well as the relationship with surrounding structures, such as the adjacent teeth, onto the master cast. An inaccurate impression procedure may result in a poor fit of the prosthesis and biological and mechanical complications [
7]. In addition, errors on the occlusal and proximal sides of the resulting implant crown may occur, possibly lengthening the operating time for repairing the prosthesis or causing discomfort to the patient, or even requiring remanufacturing [
8].
The high accuracy of optical scanners allows digital impressions to be applied in various fields of dentistry, not only to produce inlays, onlays, crowns, and fixed partial dentures, but also to fabricate implant prostheses by capturing the three-dimensional (3D) position of the implant [
9,
10]. Digital impression-taking has the advantages of creating a virtual model using an optical method, easy standardization, and high interoperator repeatability [
11]. In particular, in the case of direct digitalization using an intraoral scanner, information in the oral cavity is acquired without the process of taking impressions and producing the work model. This makes the processing time efficient and also comfortable for the patient, particularly for those with a heightened gagging reflex [
12,
13].
In the digital implant impression process, instead of using an impression coping, an implant scan body (ISB) is connected to the implant fixture before performing the scanning process, and information, such as the depth or direction of the implant fixture placed in the alveolar bone, is obtained. ISBs have various sizes and shapes, and the scan region has an asymmetrical shape and contains important information about the angle and orientation of the implant [
14]. The position of the ISB in the dentition is recorded through optical scanning, and the library information for the ISB and the implant is used to reproduce the position of the implant fixture connected to each ISB and the abutment using CAD (Computer Aided Design) software. The reproduced data are then used in CAD software to design a prosthesis that is subsequently produced using CAM (Computer Aided Manufacturing) [
15].
Factors affecting the accuracy of digital implant impressions using intraoral scanners and ISBs include the angle and depth of the implant, the implant-to-implant distance, implant location, geometry variance, scanning method, and ISB materials and designs [
16,
17,
18,
19,
20,
21,
22,
23]. Most previous studies have investigated either complete or partial but multiple edentulous cases, and there have been very few studies on the accuracy of implant digital impressions according to the ISB orientation or scanning method in cases of single implants. One previous study found that the deficiency of the scanned image of the ISB affects the position of the virtual implant in the single implant case, but that study only considered a single oral scanner, and it simulated deficient scan images experimentally after completing the scanning procedure [
24].
According to the International Organization for Standardization, accuracy consists of trueness and precision [
25]. Trueness is the deviation of the test results from its reference value, whereas precision is the deviation between the test results. The methods of measuring the accuracy of the intraoral scanners have been either two-dimensional or three-dimensional, and the three-dimensional measuring method using superimposition is advantageous because it also evaluates local errors three-dimensionally [
26]. In order to evaluate the trueness in three dimensions, data obtained by industrial optical or desktop scanners are required as a reference. On the other hand, since precision measures the repeatability between test results, the reference is not required, and it is sufficient to measure the deviation between the test results.
The purpose of the present study was to compare the trueness of digital implant impressions in a single implant case according to two variables: the ISB orientation and the scanning method. This was achieved by evaluating prealignment data containing the ISB on the virtual model, and postalignment data containing a virtual abutment reconstructed using the implant library. The first null hypothesis was that the trueness of prealignment and postalignment data obtained by the intraoral scanner is not affected by the type of intraoral scanner, ISB orientation, or scanning method. The second null hypothesis was that the trueness of prealignment and postalignment data obtained by a laboratory scanner is not affected by the ISB orientation.
2. Materials and Methods
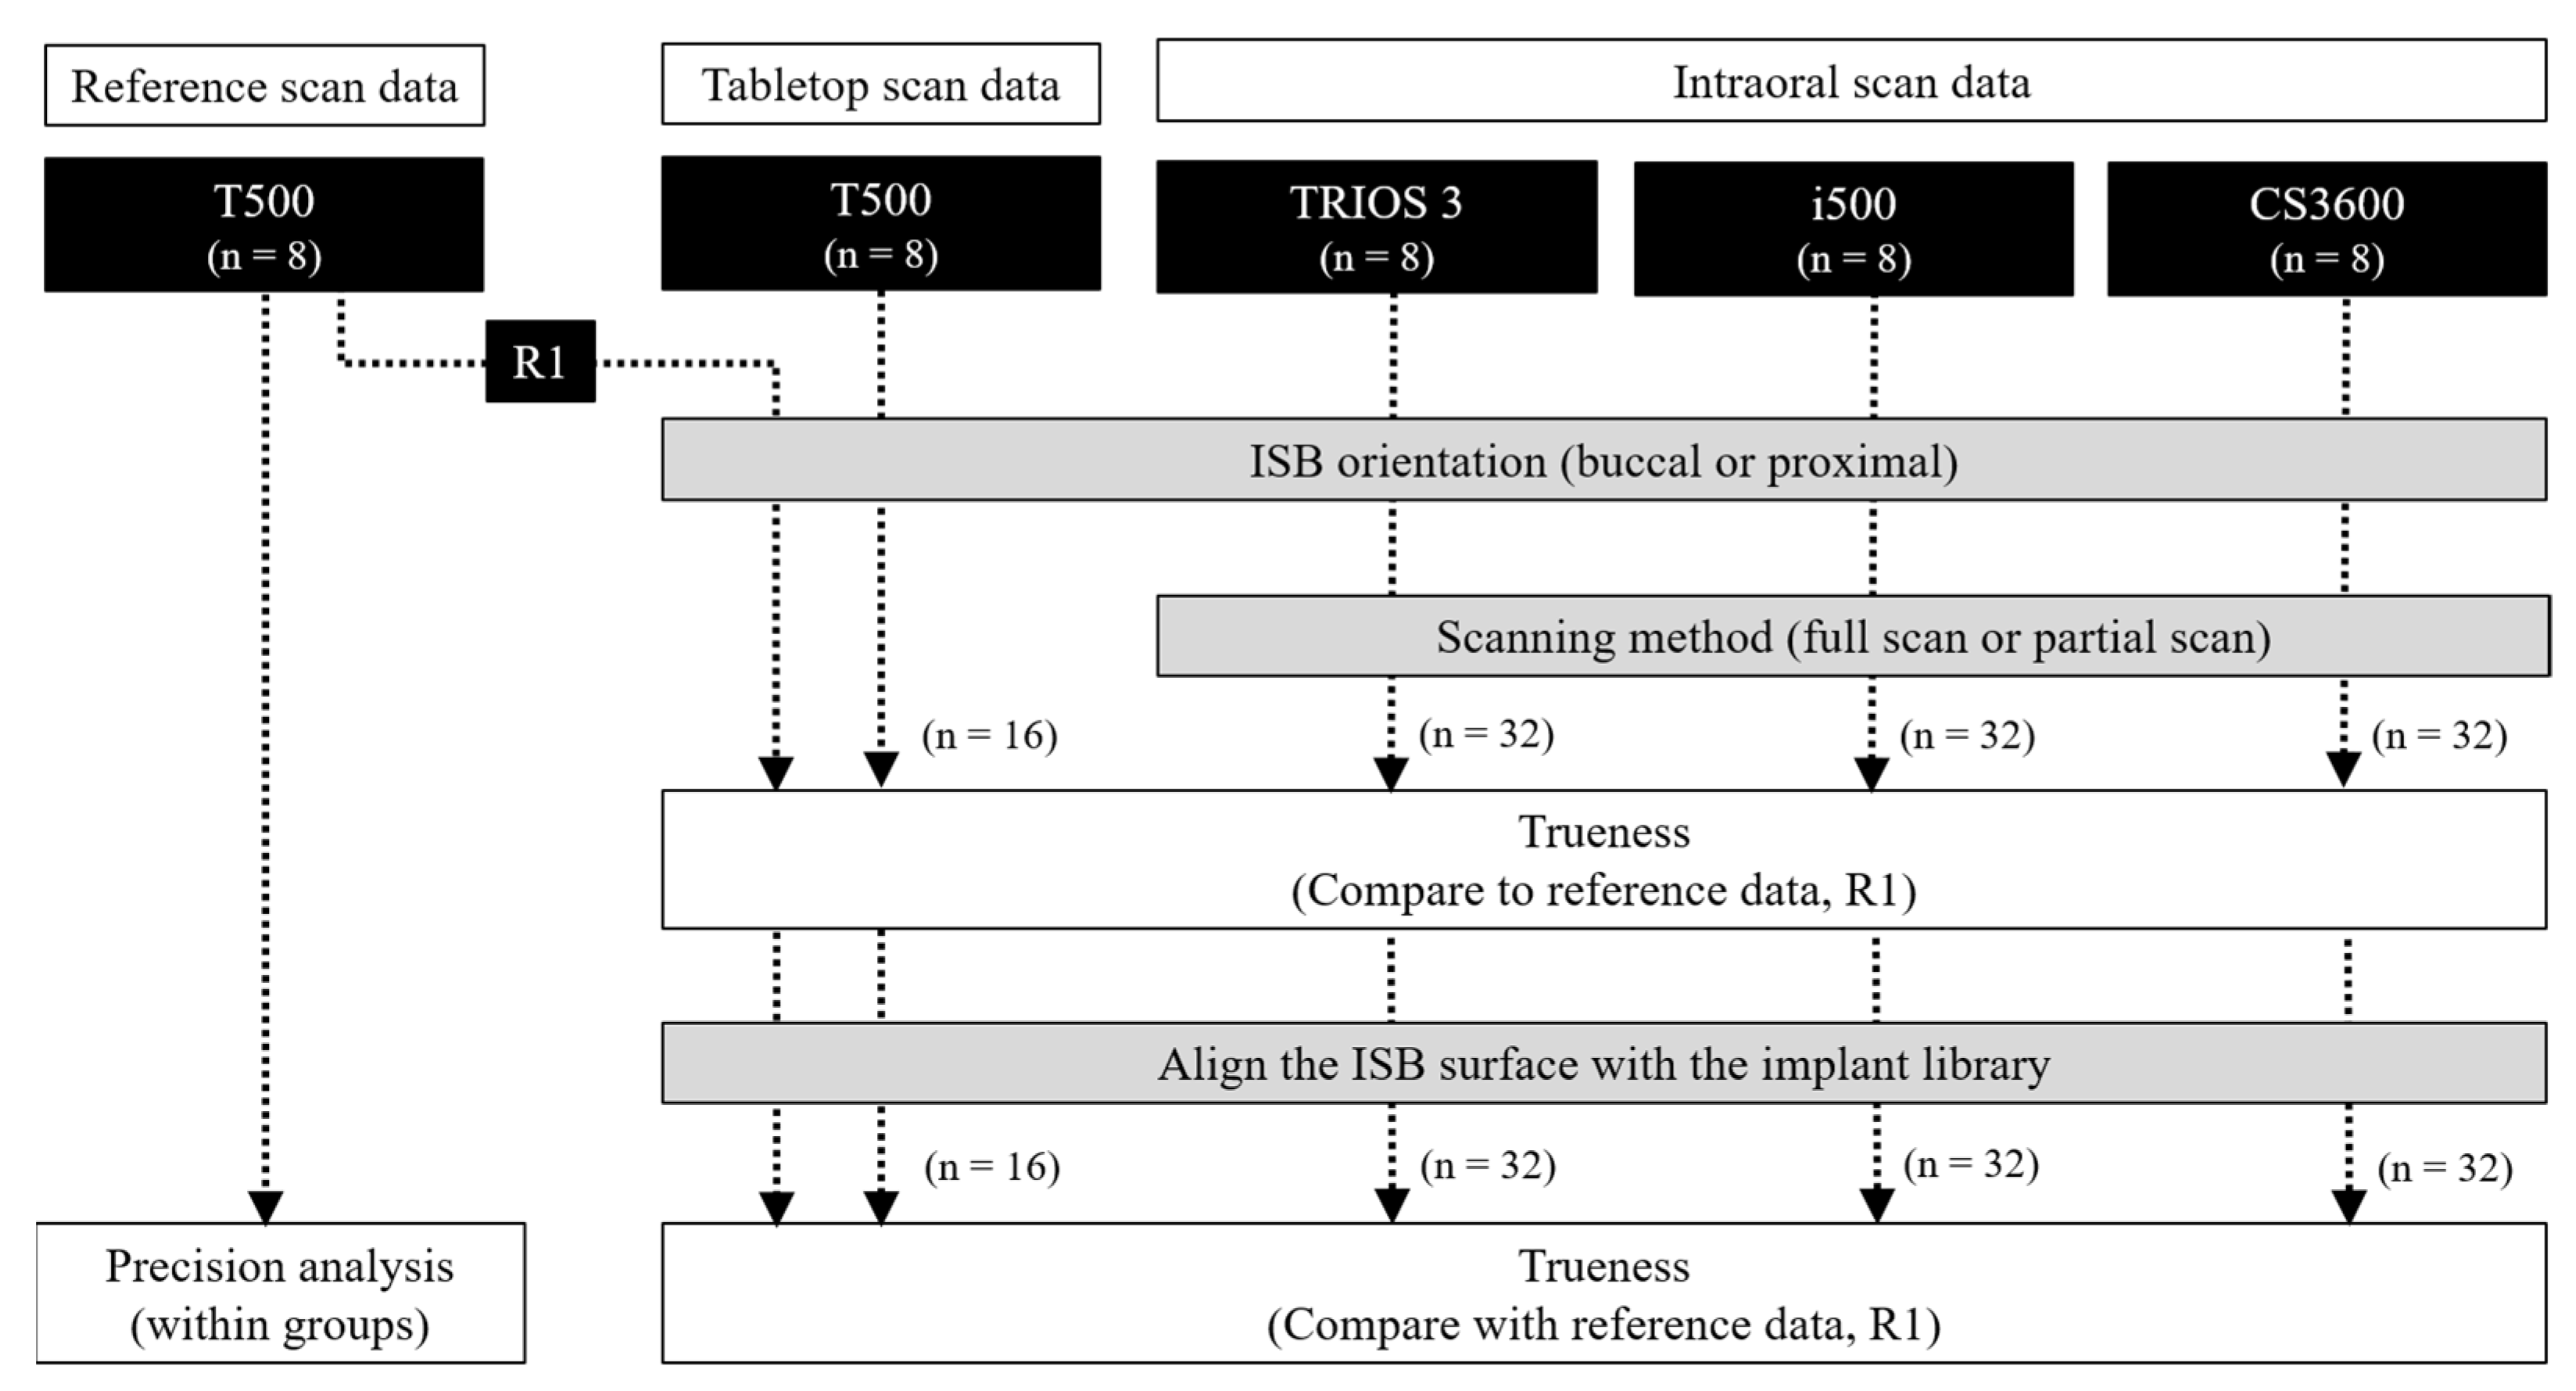
The overall experimental process is summarized in
Figure 1. The number of samples in each group was set to eight, and a post hoc sample power calculation was performed using the G-Power sample power calculator (University of Kiel, Kiel, Germany). The power of the sample with an effect size of 0.4 was determined to be 0.941 with an alpha of 0.05 [
27].
2.1. Master Model Production
A maxillary full-arch dentate dental model (Dentiform, Nissin Dental Products, Kyoto, Japan) was scanned using a tabletop scanner (T500, Medit, Seoul, Korea), and then a dental CAD software (DentalCAD, exocad, Darmstadt, Germany) was used to modify and design the experimental model digitally. The unilateral half was removed from the full-arch model; the lateral incisor, first premolar, and first molar teeth were deleted; and the model was then modified into an edentulous ridge shape. The designed file was exported to a file in Standard Tessellation Language (STL) format, and the model was printed on a 3D printer (Form 2, Formlabs, Somerville, MA, USA) using a photocurable resin (standard gray resin, Formlabs). Three screw-type implants (length 10 mm, ø4.1 mm; Straumann, Basel, Switzerland) with a quadrangular internal structure were placed on the three edentulous areas at the bone level, with the implants’ four antirotation (flat) surfaces facing in the buccal and proximal directions.
2.2. Implant Scan Body Connection and Scanning Procedure
2.2.1. Test Group Scanning with a Tabletop Scanner and Intraoral Scanners
This study used an ISB (SC-BLR, Geomedi, Gyeonggi-do, Korea) with a cylindrical shape and a flat surface, and one tabletop scanner (T500, Medit) and three oral scanners (CS3600, Carestream Dental, Atlanta, GA, USA; TRIOS 3, 3Shape, Copenhagen, Denmark; i500, Medit). Information about the scanners used in this study is provided in
Table 1, and the experimental group design is summarized in
Table 2.
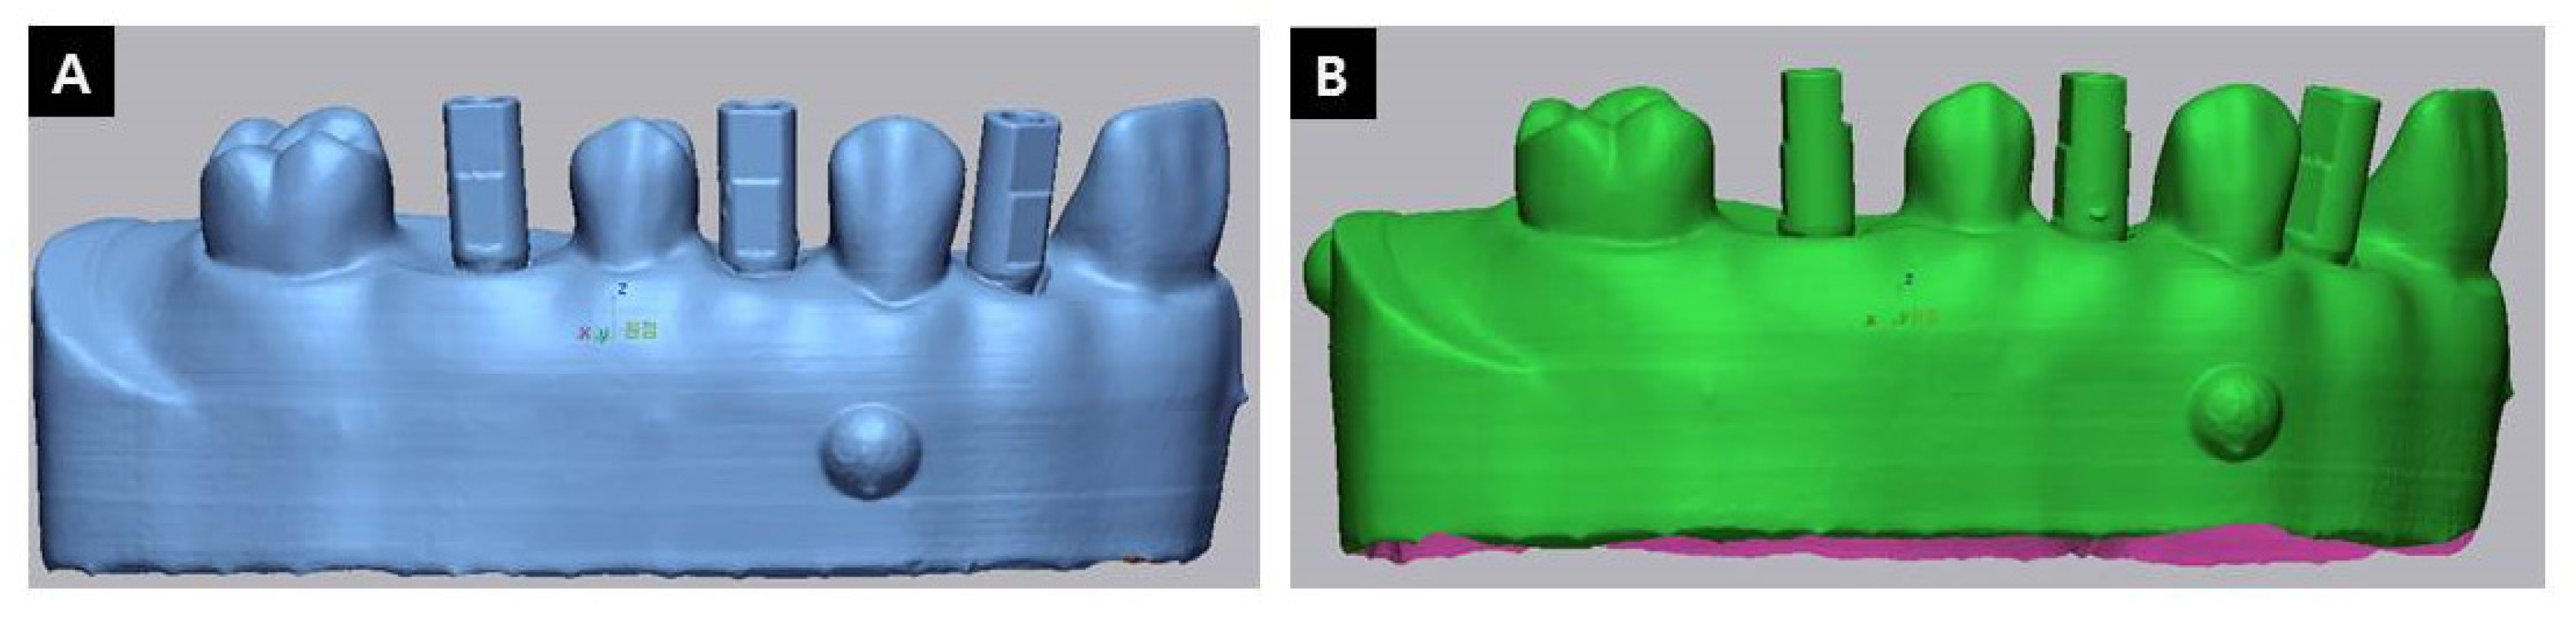
All scanners were calibrated according to the manufacturer’s instructions prior to starting the scans, and then the following experimental procedure was performed: The ISBs were connected to the fixtures at a torque of 15 Ncm and oriented so that their flat surfaces faced in the buccal direction (
Figure 2A). The teeth were scanned first, and then the ISB portions were scanned. Scanning using the tabletop scanner was performed in the automatic scan mode provided by the equipment’s own software (
n = 8), while that using the intraoral scanners was performed over the entire area (
n = 8) or only a partial area (
n = 8). Scanning the entire areas of the ISBs involved scanning all sides of the ISBs without any gaps, whereas scanning under the partial-area condition was performed mainly on the buccal and lingual surfaces. The connection direction of the ISBs was then changed so that their flat surfaces faced the proximal direction (
Figure 2B), and the same scanning procedure was repeated. Each set of prealignment data was then converted into postalignment data containing the virtual implants and the abutments.
2.2.2. Reference Scanning with Tabletop Scanner
After performing the test scans, the marginal gingival part of the model was ground to expose the ISBs completely, the ISBs were connected to the buccal or proximal surface, and eight scans were performed using the tabletop scanner in each orientation.
2.3. Data Processing and Assessment
In order to evaluate the trueness of each test group, the trueness of the prealignment and postalignment data were evaluated. The reference file and each test file were aligned with a best-fit algorithm in 3D analysis software (Geomagic Control X, 3D Systems, Morrisville, SC, USA) to perform superimposition. After alignment, ISB areas in the prealignment data and abutment areas in the postalignment data were extracted to obtain the root-mean-square error (RMSE) value calculated according to the following formula:
where
is the reference scan value at measurement point
,
is the evaluated scan value at measurement point
, and
n is the total number of measurement points in the analysis.
2.4. Statistical Analysis
Statistical analysis was performed using SPSS software (version 25.0, IBM SPSS Statistics, Chicago, IL, USA). All acquired data were subjected to Levene’s test to evaluate its homoscedasticity and to the Shapiro–Wilk test to test for normality (α = 0.05). Three-way ANOVA was used to evaluate the prealignment and postalignment data, and the effects of the type of oral scanner, the ISB orientation, and the scanning method and their interactions on the RMSE values were analyzed (α = 0.05). One-way ANOVA and post hoc Bonferroni testing were performed to analyze the effects of combinations of ISB orientation and the scanning method for each scanner on the RMSE (α = 0.05). The comparative analysis of the RMSE according to the ISB orientation of the T500 scan data was performed using a Student’s t-test (α = 0.05).
3. Results
The precision of the reference scan was 7.23 ± 0.34 μm (mean ± SD) when the flat surface of the ISB faced the buccal direction, and 6.84 ± 0.34 μm when it faced the proximal direction. One of these data was randomly selected as the reference data for the trueness evaluation of the test data.
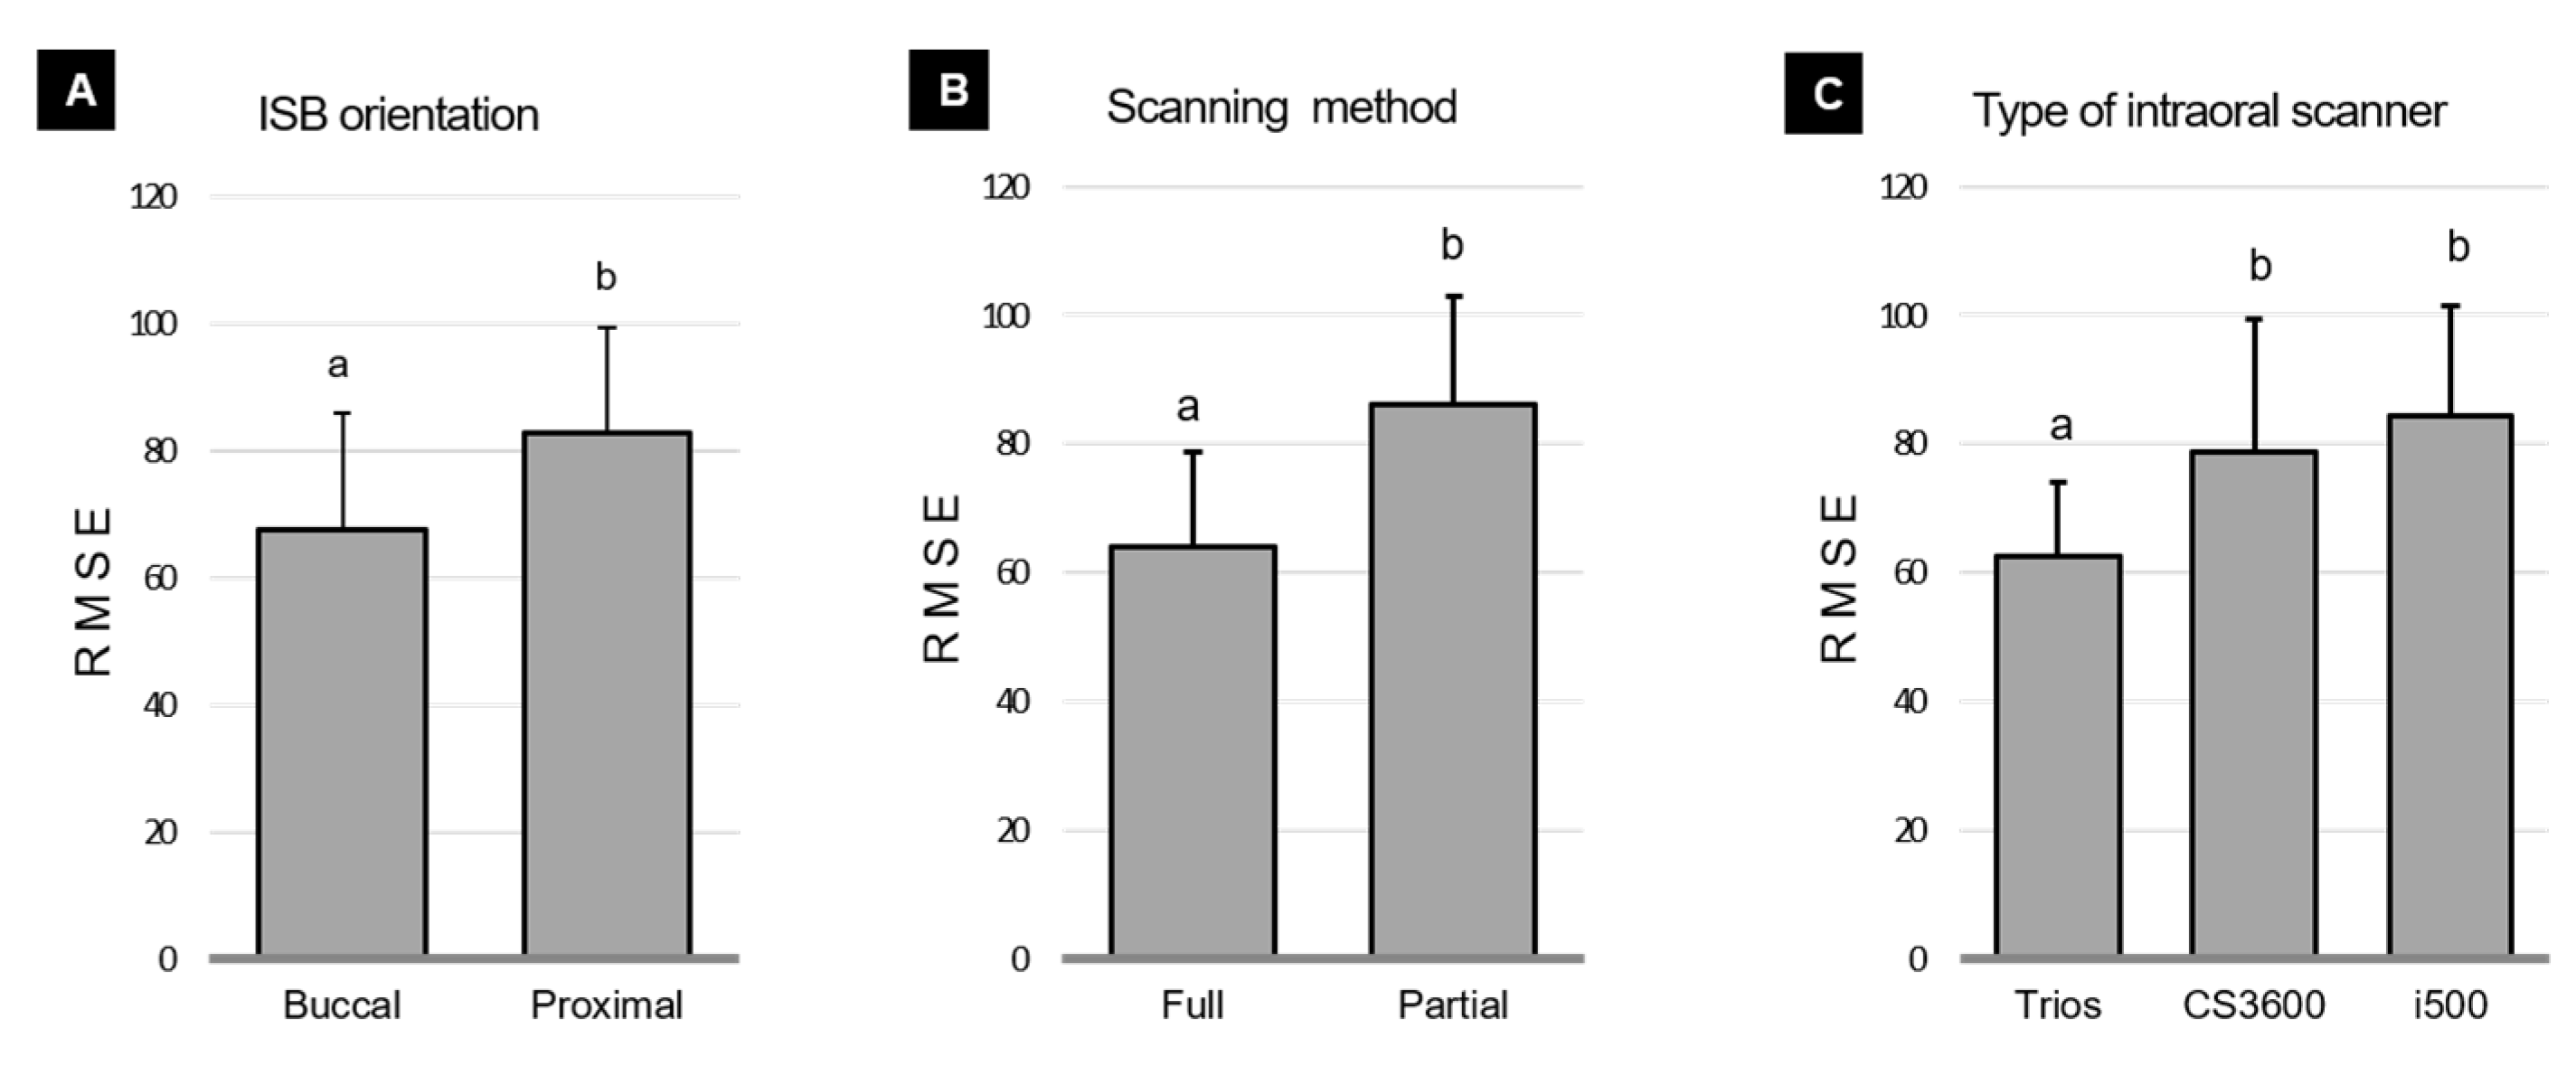
Prealignment data on trueness according to the ISB orientation, scanning method, and type of intraoral scanner are shown in
Figure 3. The three-way ANOVA of prealignment data revealed that all main effects of ISB orientation (
F = 65.493,
p < 0.001), scanning method (
F = 137.794,
p < 0.001), and scanner type were statistically significant (
F = 47.865,
p < 0.001). Analysis of two-way interactions revealed significant interaction effects of the scanning method and the scanner type (
F = 8.177,
p = 0.001), while the other interaction effects were not statistically significant (ISB orientation and scanning method:
F = 3.343,
p = 0.071; ISB orientation and scanner type:
F = 0.015,
p = 0.985). The three-way interaction effect of the ISB orientation, scanning method, and scanner type was not statistically significant (
F = 2.445,
p = 0.093). The overall RMSE according to the ISB orientation and scanning methods was lower in the buccal groups (67.50 ± 18.56 μm) than in the proximal groups (82.80 ± 16.73 μm), and lower in the full-scan groups (64.05 ± 14.74 μm) than in the partial-scan groups (86.24 ± 16.59 μm). RMSE values for the overall prealignment data according to the type of intraoral scanner were significantly lower for the TRIOS 3 device (62.46 ± 11.51 μm) than for the CS3600 (78.73 ± 20.76 μm,
p < 0.001) and i500 (84.25 ± 17.30 μm,
p < 0.001) devices.
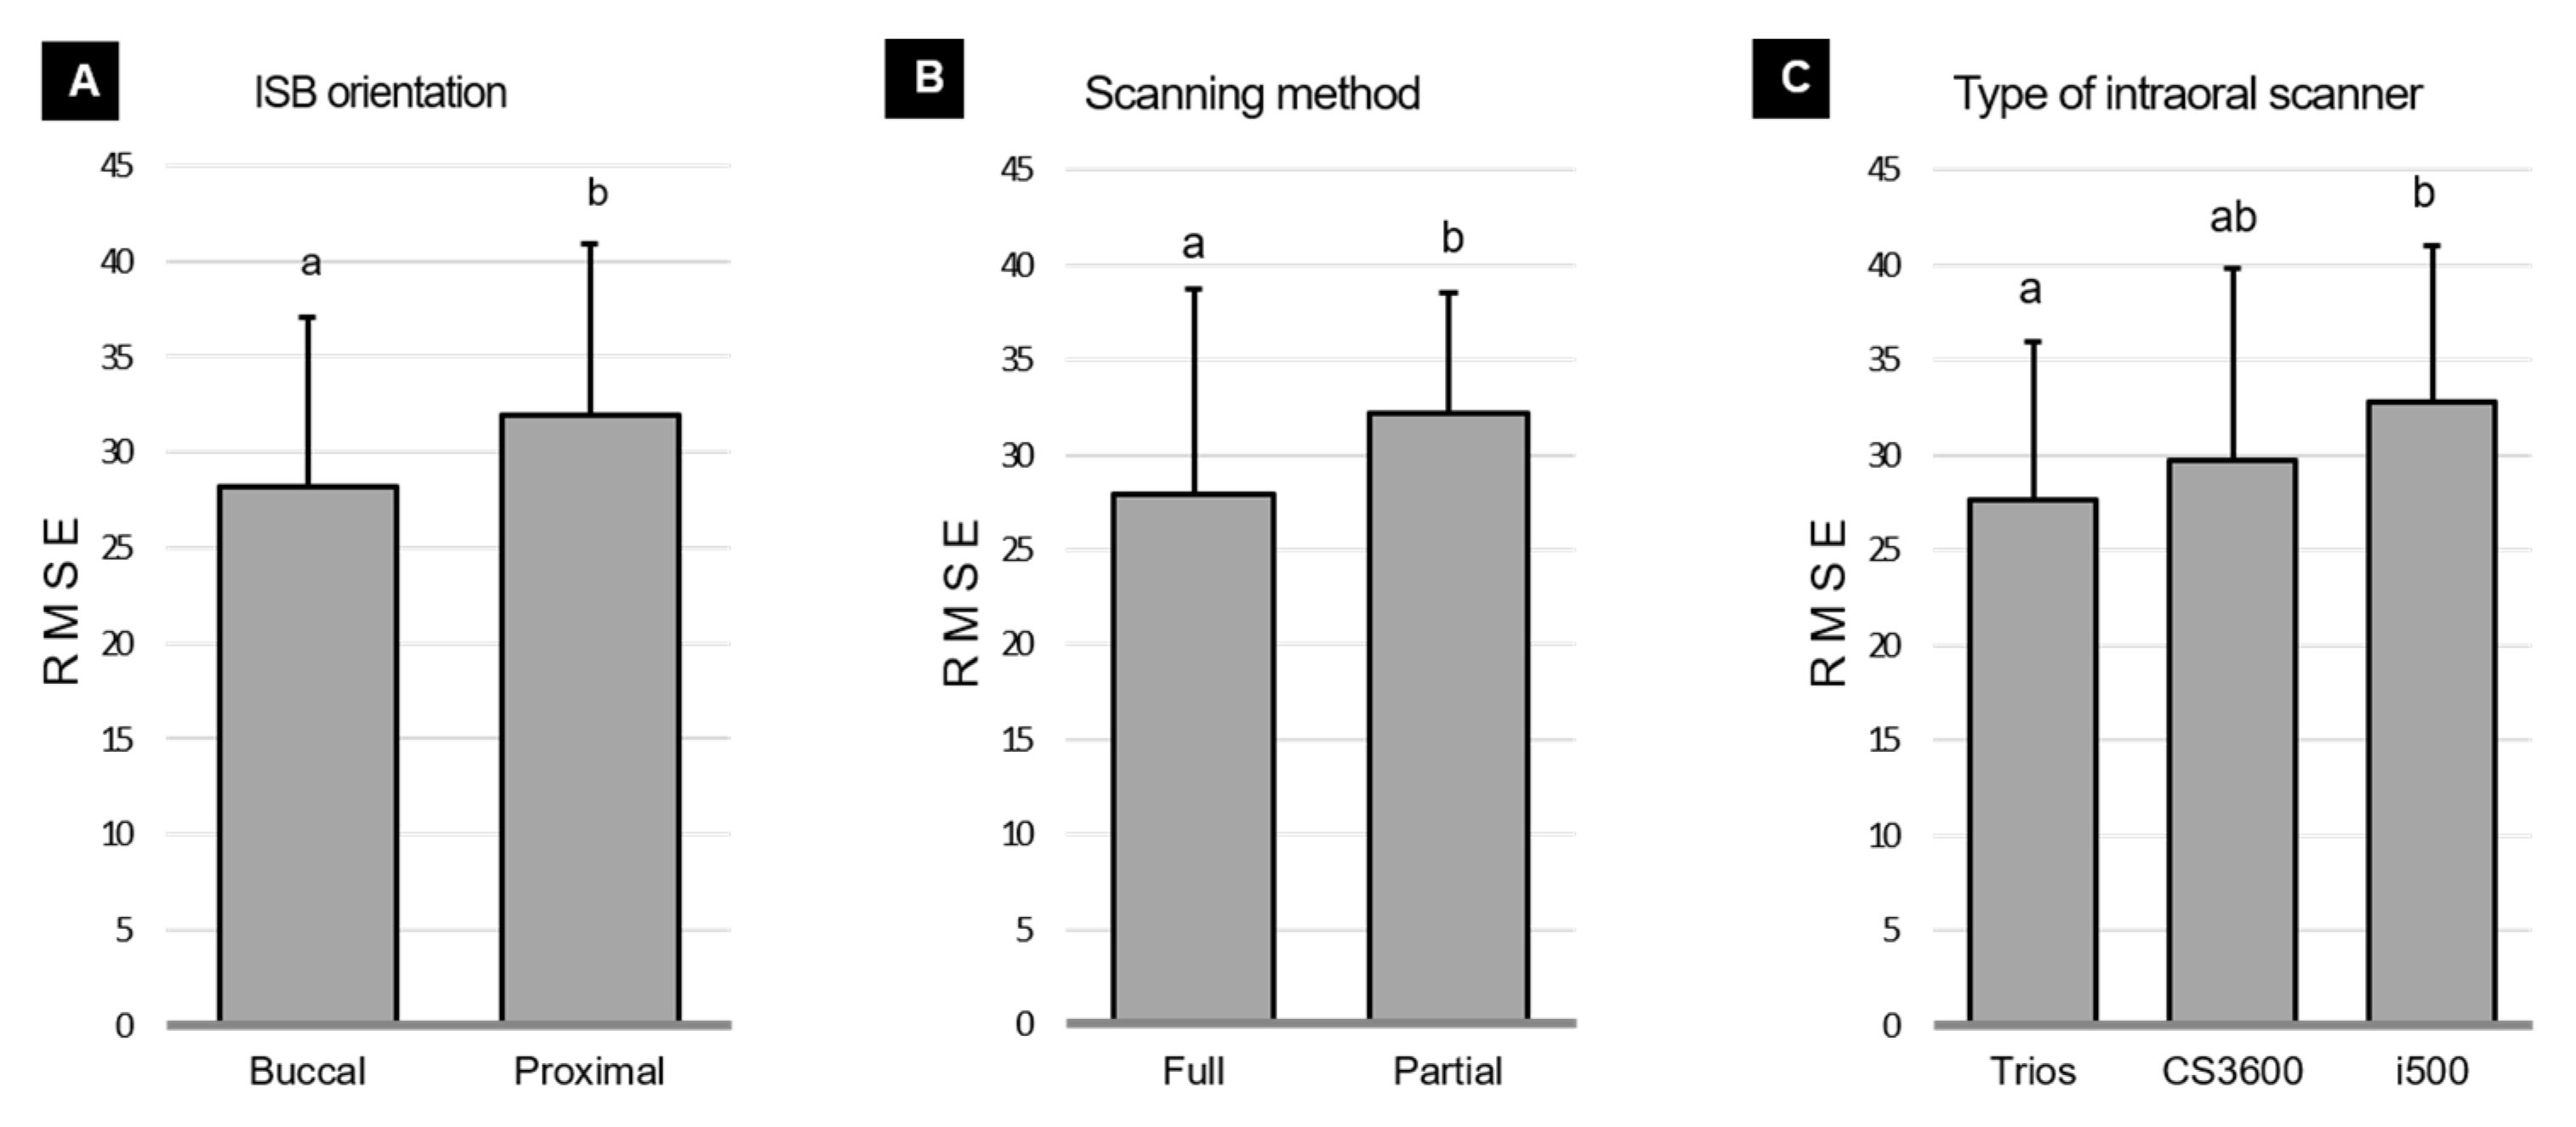
Postalignment data on trueness according to the ISB orientation, scanning method, or type of intraoral scanner are shown in
Figure 4. The three-way ANOVA of postalignment data revealed that there were significant main effects of the ISB orientation (
F = 4.811,
p = 0.031) and scanning method (
F = 6.022,
p = 0.016), but not of the scanner type (
F = 3.104,
p = 0.050). Analysis of two-way interactions revealed that there were no significant interaction effects of the ISB orientation and scanning method (
F = 2.446
p = 0.122), ISB orientation and scanner type (
F = 1.061,
p = 0.351), or scanning method and scanner type (
F = 1.241,
p = 0.294). The three-way interaction effect of the ISB orientation, scanning method, and scanner type was not statistically significant (
F = 0.454,
p = 0.636). The overall RMSE according to the ISB orientation and scanning methods was significantly lower in the buccal groups (28.15 ± 8.87 μm) than in the proximal groups (31.94 ± 8.95 μm), and significantly lower in the full-scan groups (27.92 ± 10.80 μm) than in the partial-scan groups (32.16 ± 6.35 μm). RMSE values for the overall postalignment data according to the type of intraoral scanner were significantly lower for the TRIOS 3 device (27.61 ± 8.33 μm) than for the i500 device (32.84 ± 8.13 μm,
p = 0.040).
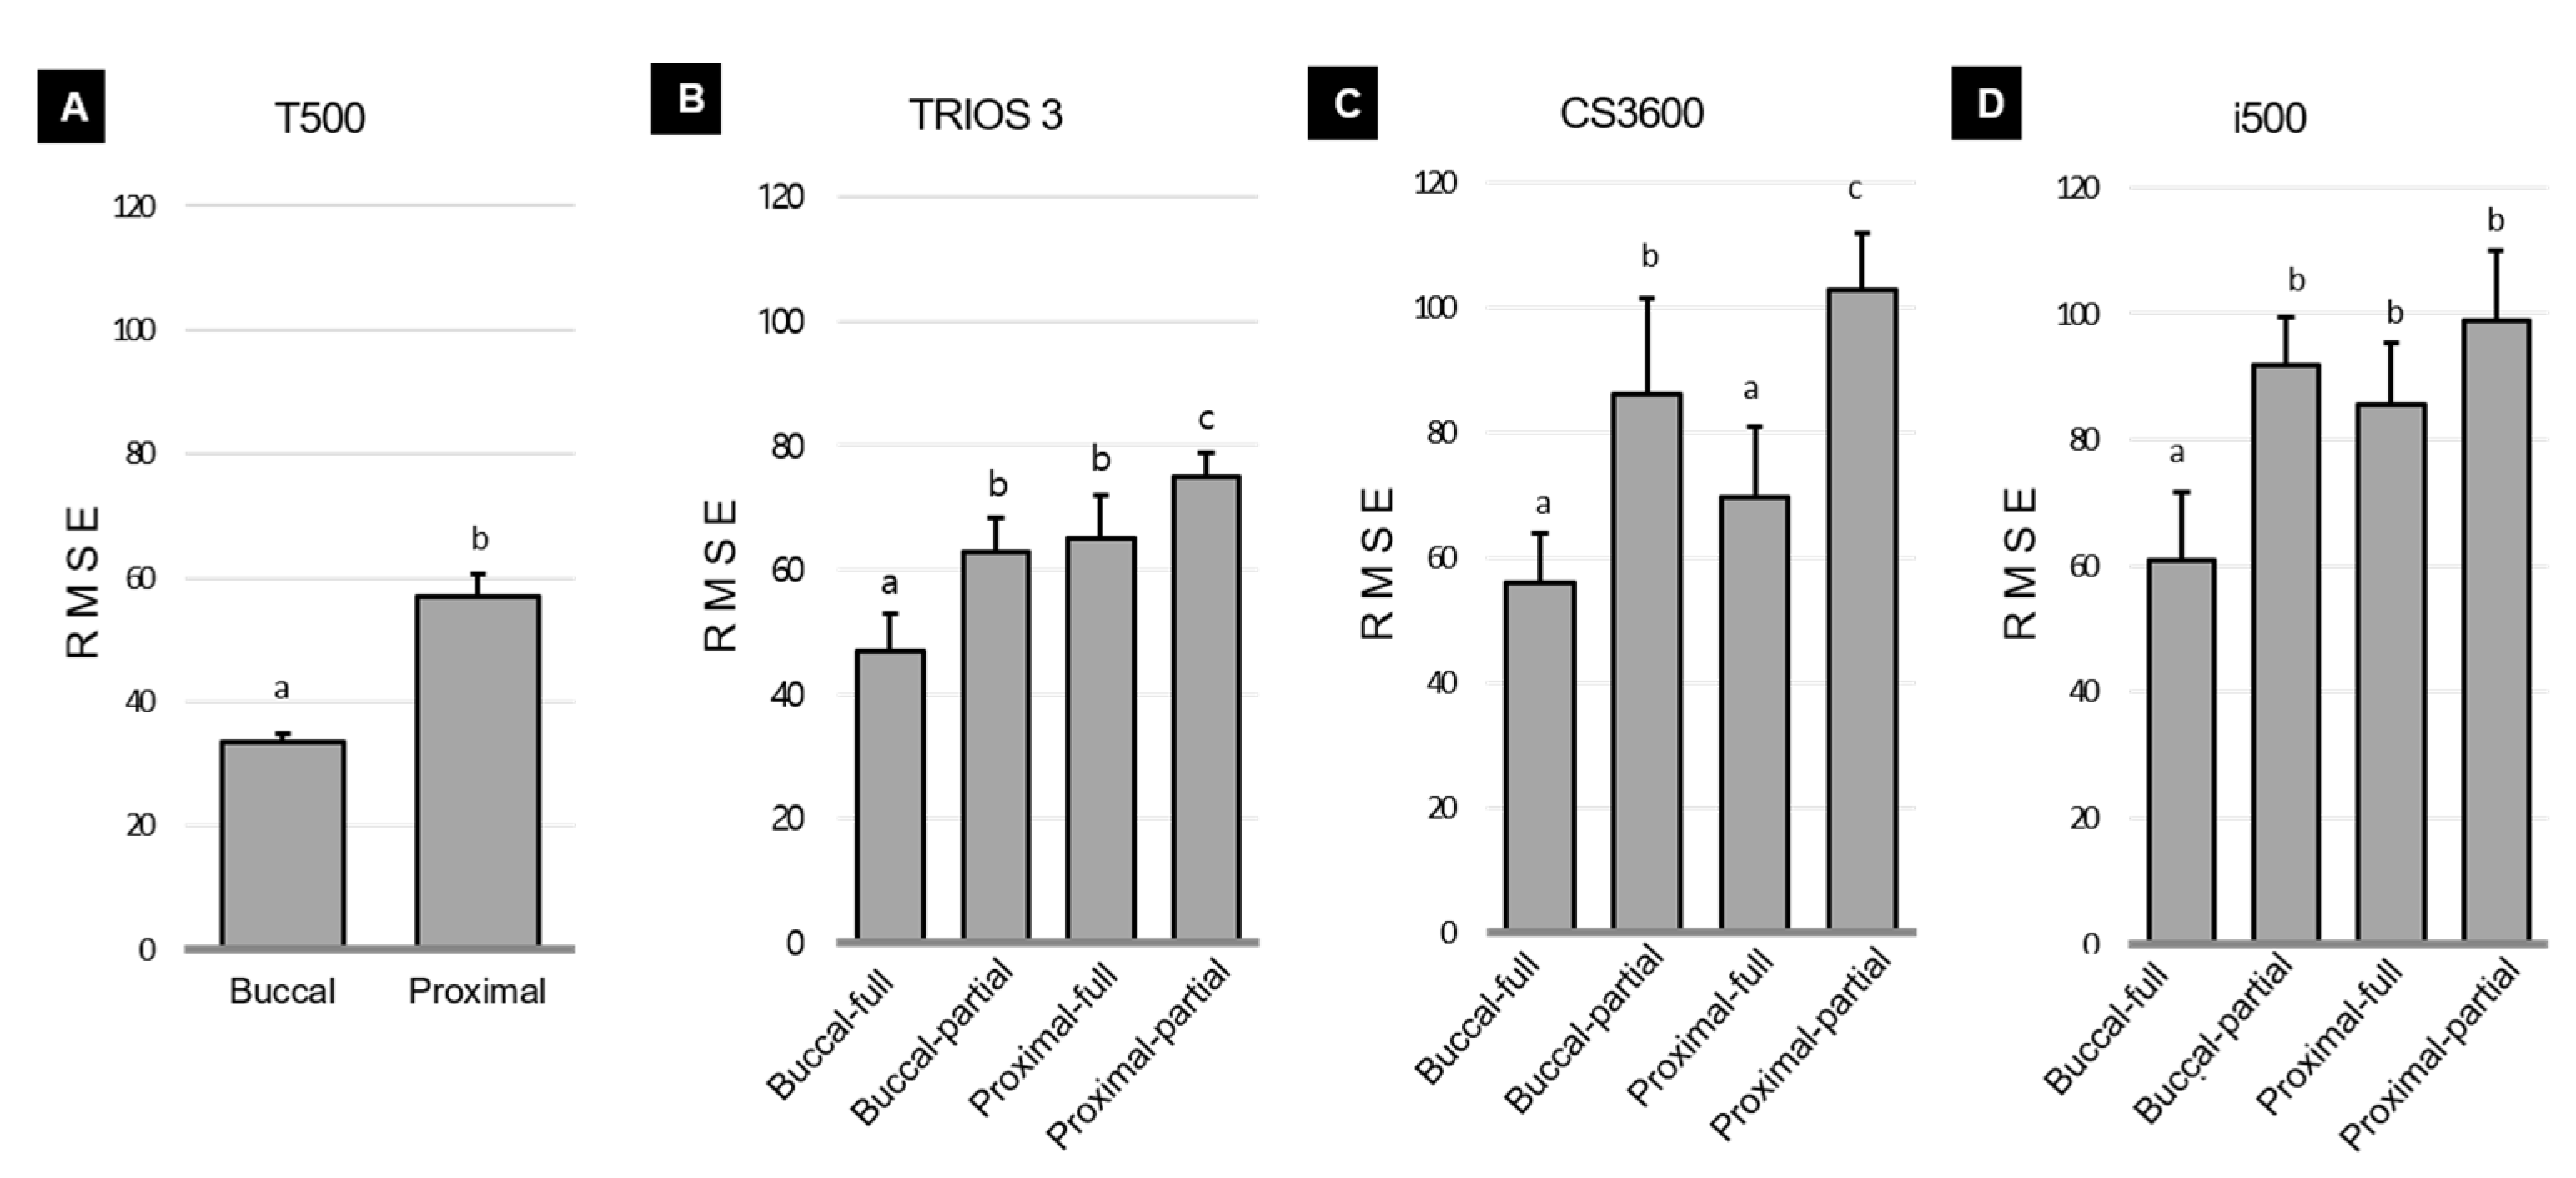
Prealignment data on trueness according to combinations of the ISB orientation and scanning method for each scanner are shown in
Figure 5. For the T500 scanner, the RMSE was significantly lower in the buccal groups (33.45 ± 1.50 μm) than in the proximal groups (56.91 ± 3.60 μm,
F = 4.088,
p < 0.001). The TRIOS 3 scanner showed significant differences in one-way analysis according to ISB orientation (
F = 32.923,
p < 0.001). The RMSE was lowest for the ISB with its flat surface facing the buccal direction and full scanning (buccal–full:47.02 ± 5.91 μm), and highest for the ISB with its flat surface facing the proximal direction and partial scanning (proximal–partial: 74.91 ± 3.99 μm). The CS3600 scanner also showed significant differences in one-way analysis (
F = 25.929,
p < 0.001), with the RMSE being lowest for buccal–full (56.09 ± 7.74 μm) and proximal–full (69.79 ± 11.18 μm), and highest for proximal–partial (102.79 ± 9.22 μm). The i500 scanner also showed a significant difference in one-way analysis (
F = 22.046,
p < 0.001), with the RMSE being lowest for buccal–full (60.91 ± 10.74 μm). The common result for all scanners was that in the case of prealignment data, the RMSE was the lowest for buccal–full and the highest for proximal–partial.
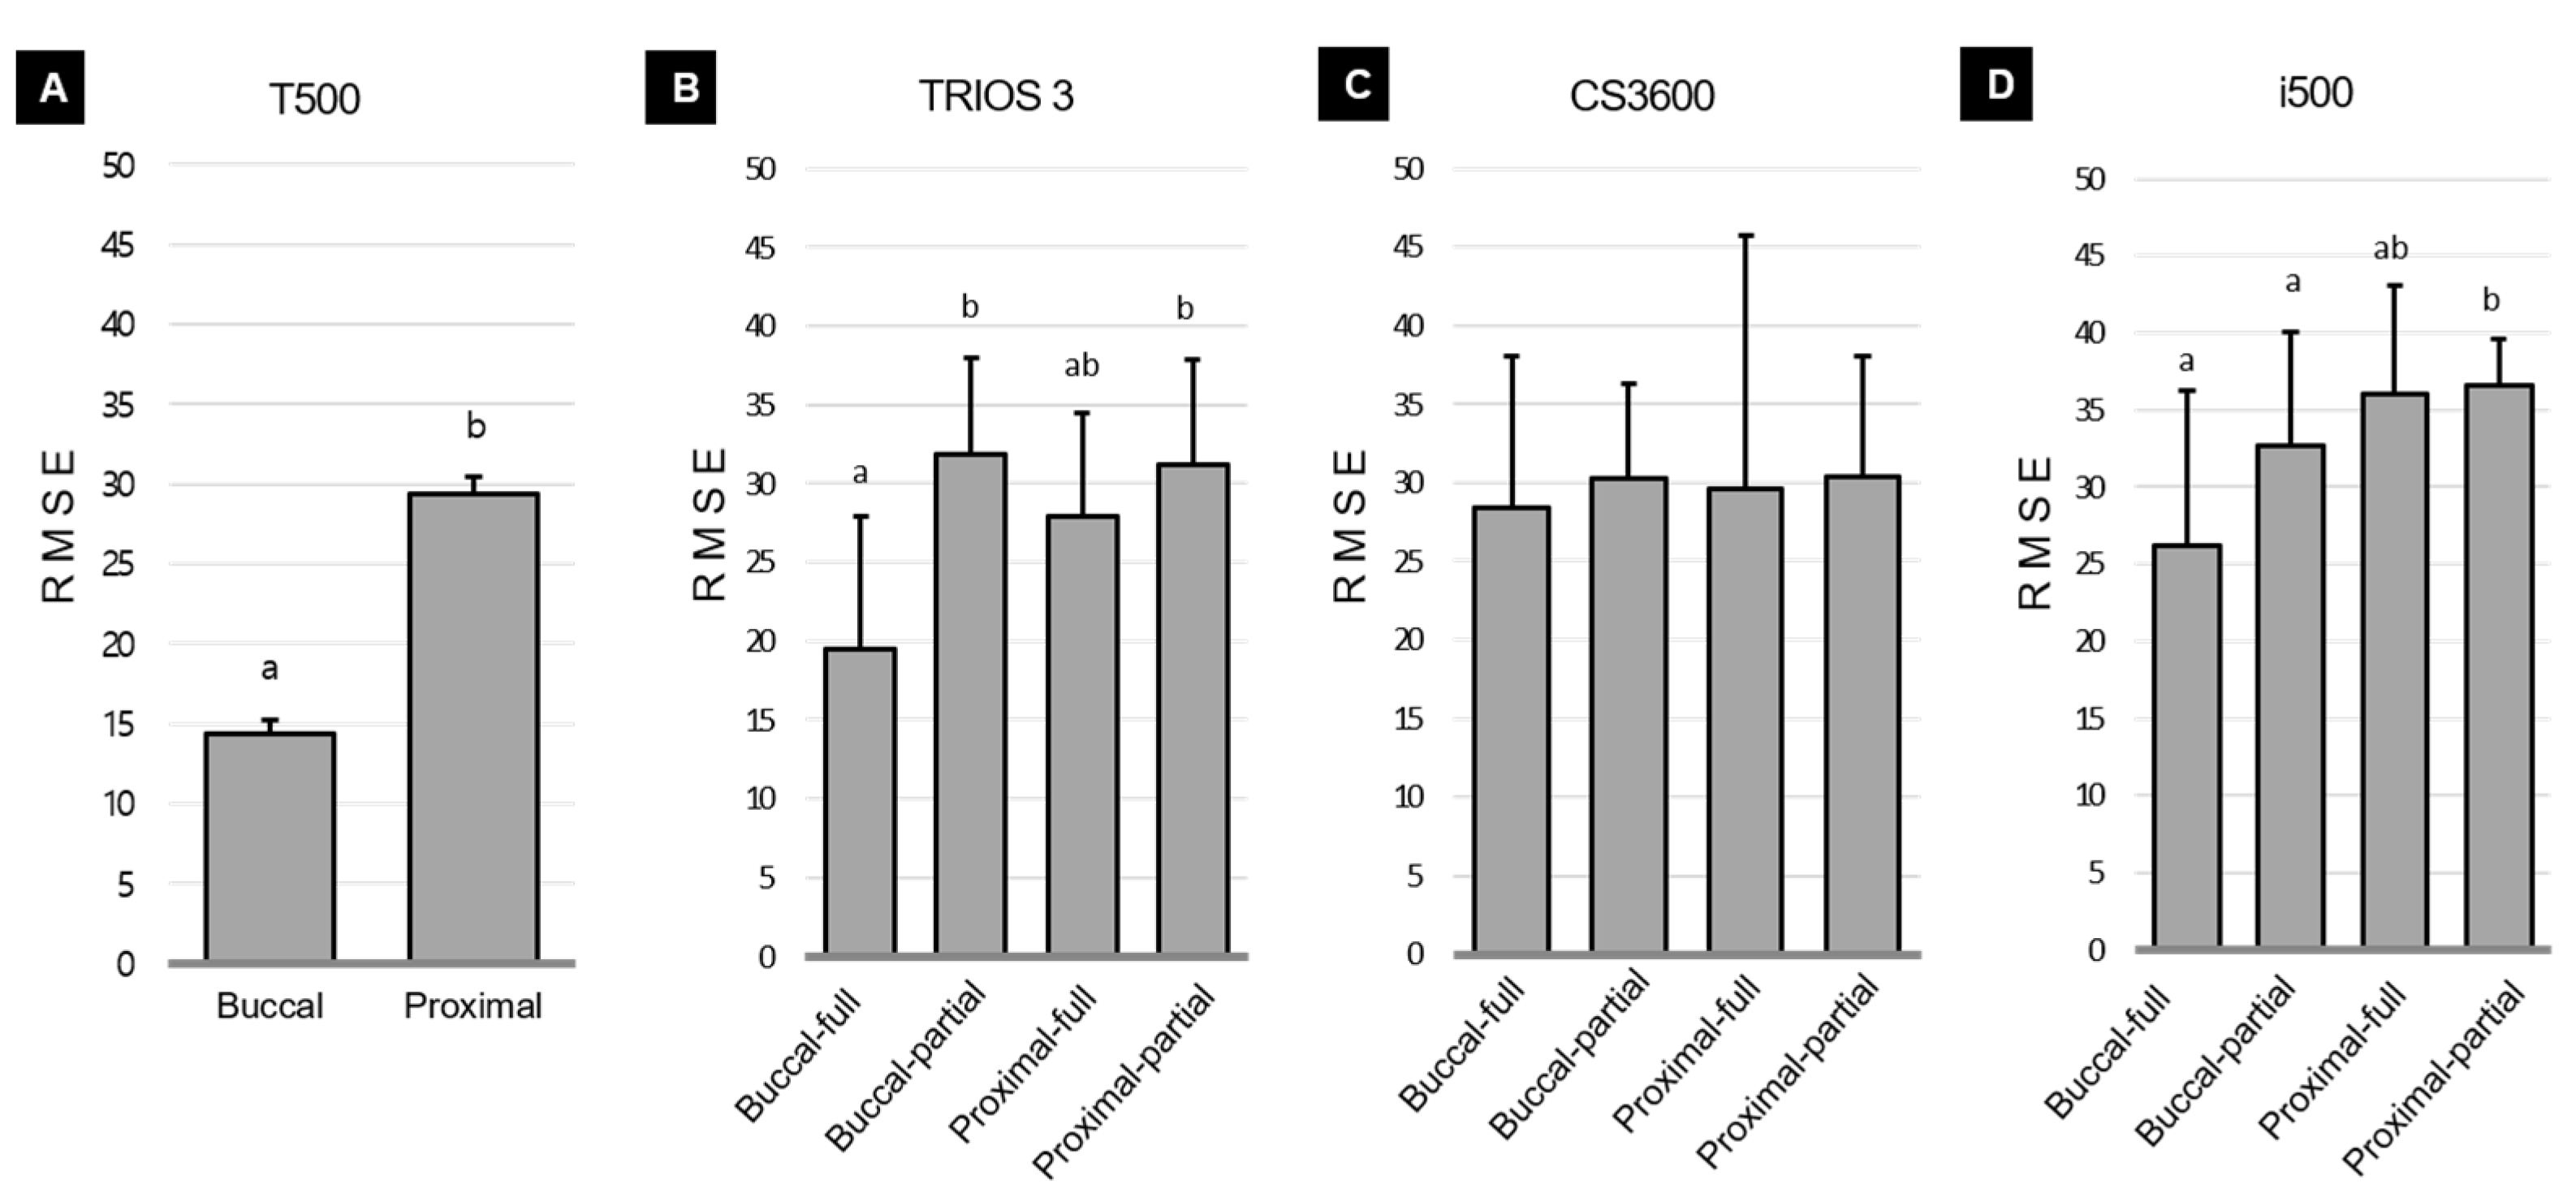
Postalignment data on trueness according to combinations of the ISB orientation and scanning method for each scanner are shown in
Figure 6. For the T500 scanner, the RMSE was lower in the buccal groups (14.34 ± 0.89 μm) than in the proximal groups (29.35 ± 1.15 μm,
p < 0.001). The TRIOS 3 scanner showed significant differences in one-way analysis according to the ISB orientation and scanning method (
F = 5.342,
p < 0.005), with the RMSE being lower for buccal–full (19.45 ± 8.42 μm) than for buccal–partial (31.89 ± 6.07 μm) and proximal–partial (31.20 ± 6.70 μm). For the CS3600 scanner, the RMSE values did not differ between the groups (
F = 0.059,
p = 0.981). The i500 scanner showed significant differences in one-way analysis (
F = 3.369,
p = 0.032), with the RMSE being lower for buccal–full (26.18 ± 10.11 μm) and buccal–partial (32.69 ± 7.31 μm) than for proximal–partial (36.54 ± 3.08 μm).
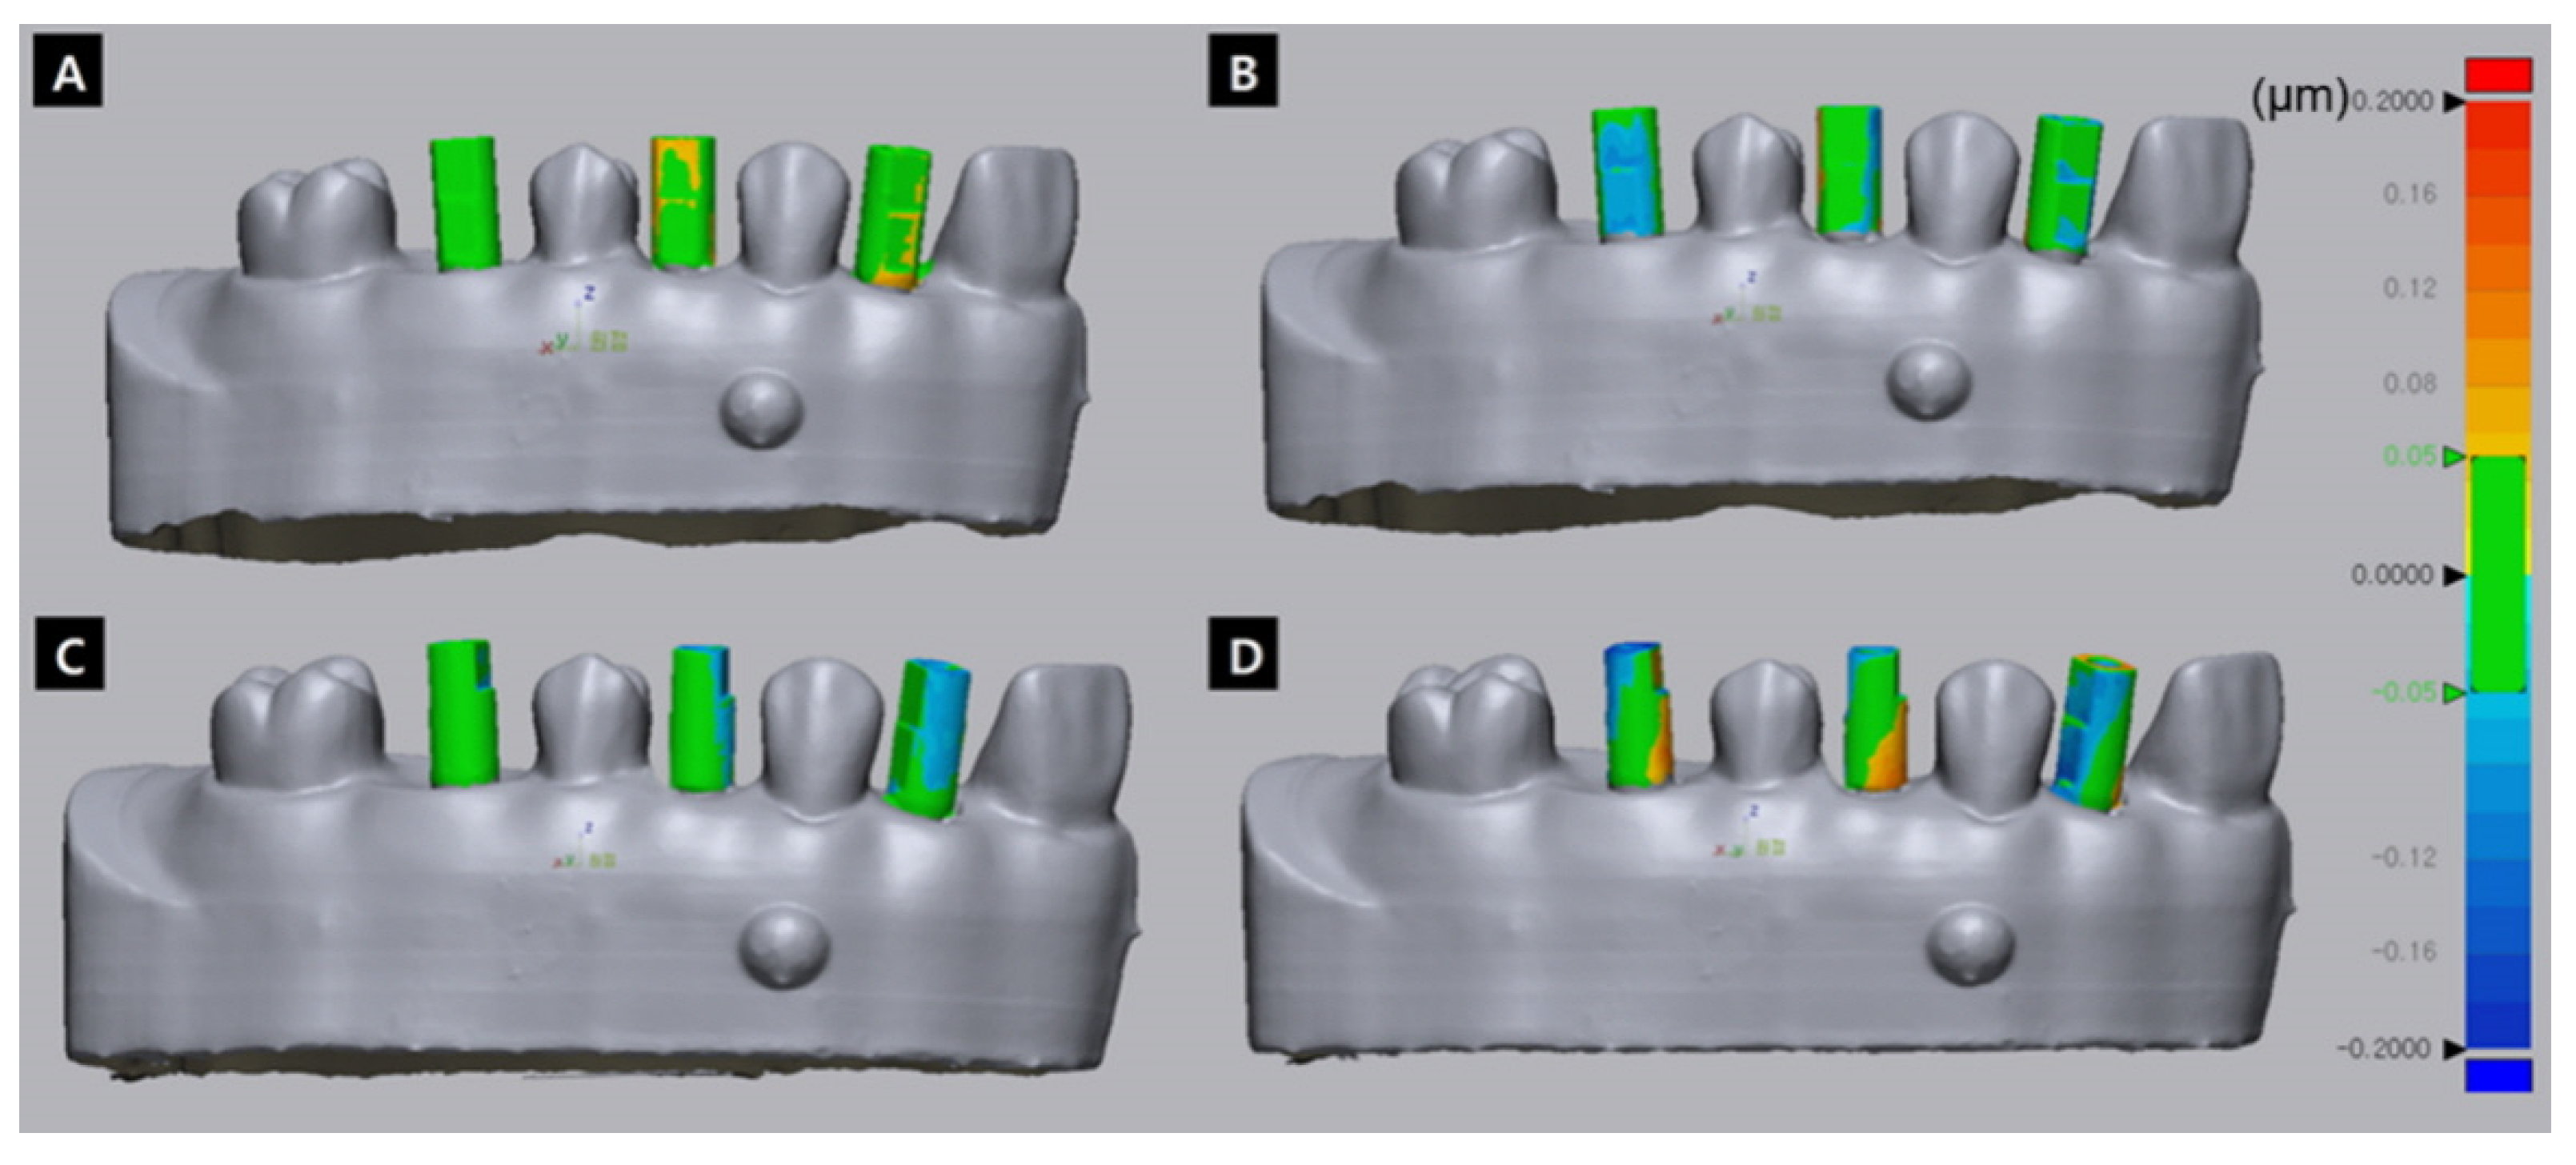
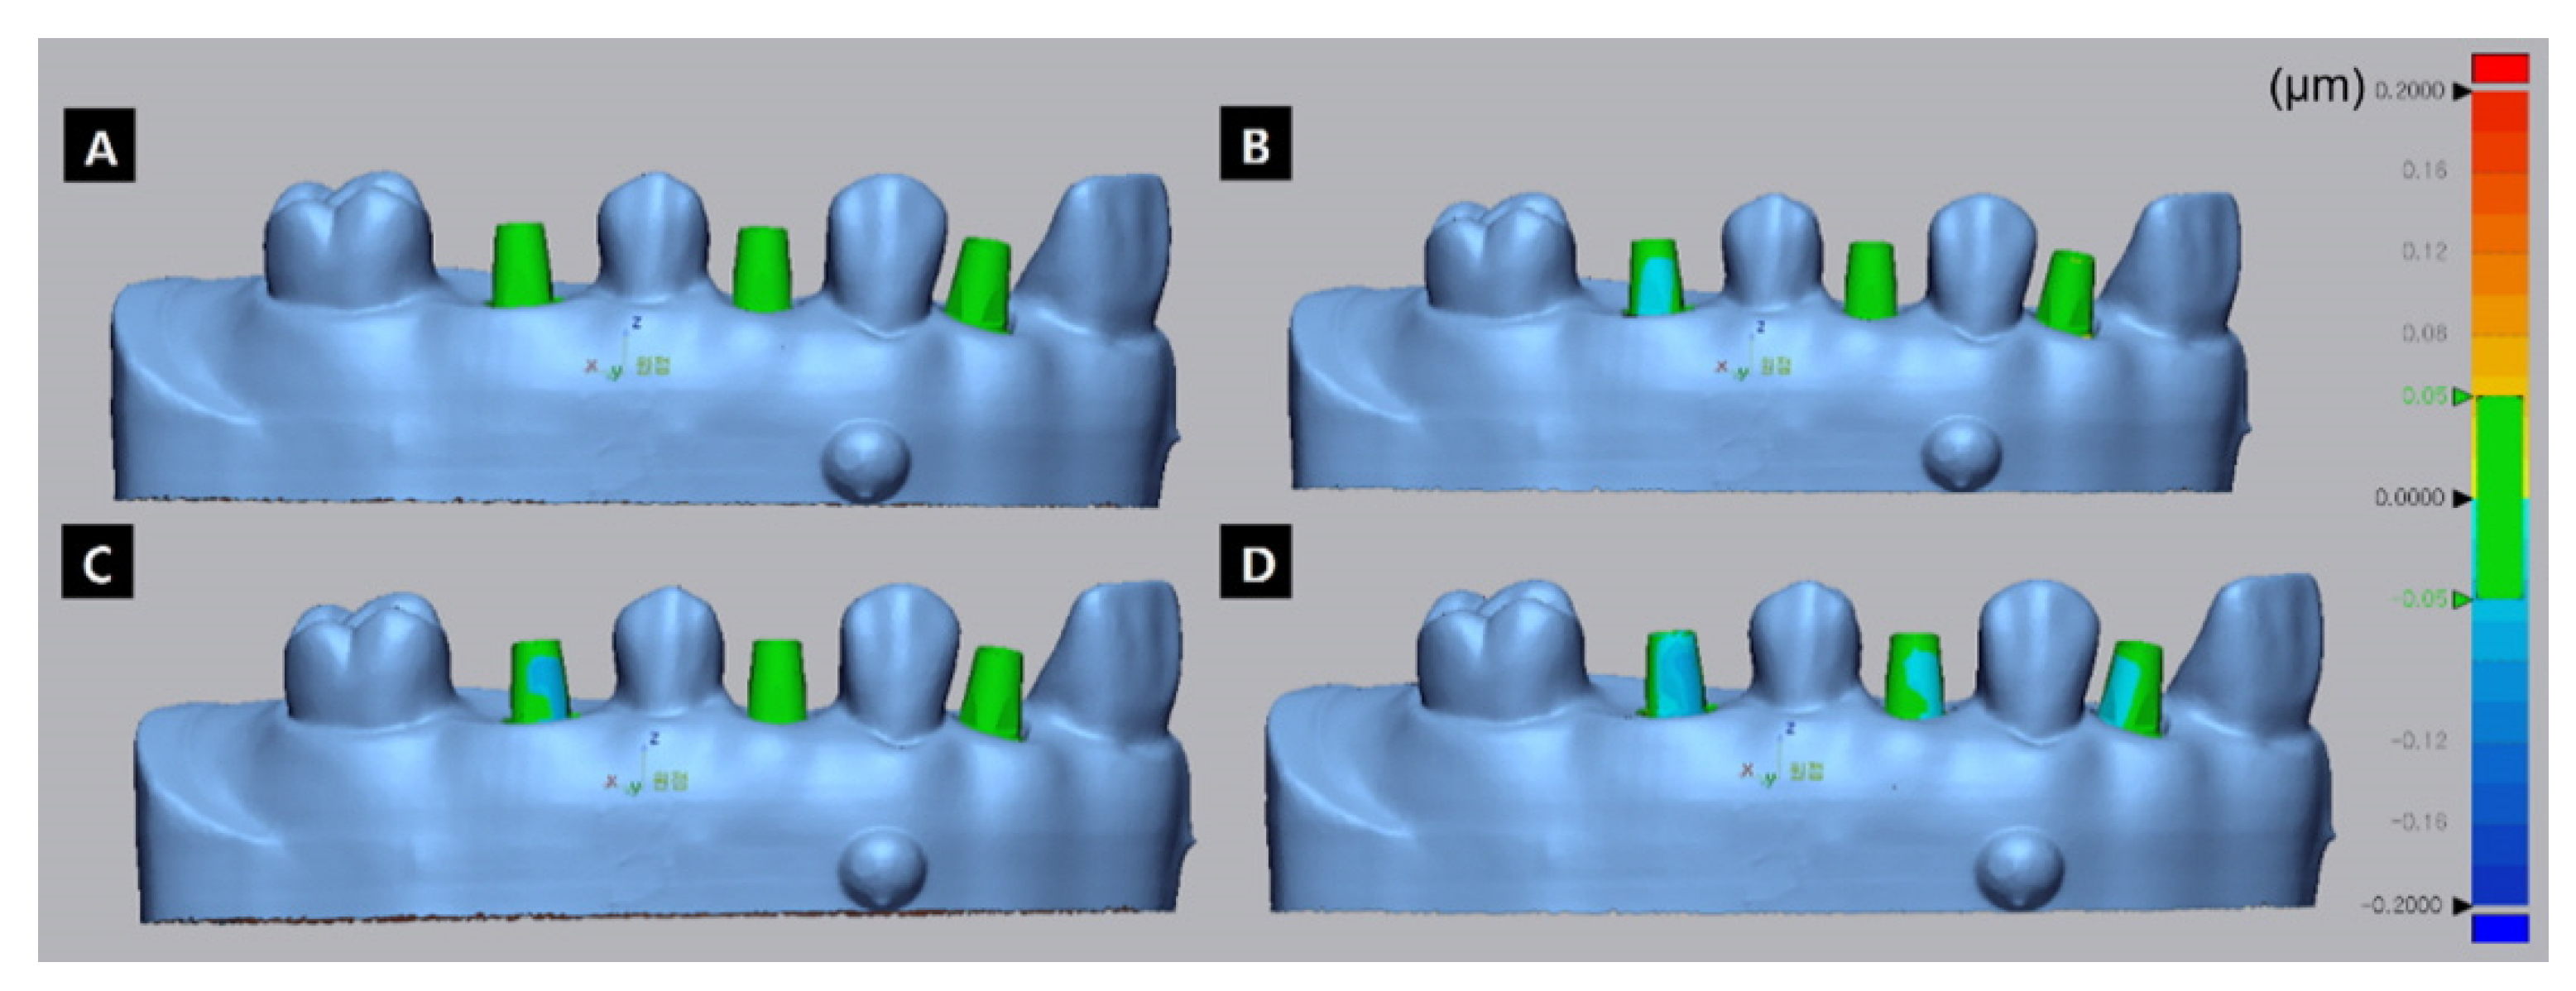
Figure 7 and
Figure 8 show representative images from the trueness evaluation of test data for the i500 scanner.
Figure 7 shows prealignment data for the deviation of the ISB areas, which was higher in the proximal groups (
Figure 7C,D) than in the buccal groups (
Figure 7A,B), and higher in the partial-scan groups (
Figure 7B,D) than in the full-scan groups (
Figure 7A,C).
Figure 8 shows postalignment data for the deviation of the abutment areas, which was higher in the proximal groups (
Figure 8C,D) than in the buccal groups (
Figure 8A,B), and higher in the partial-scan groups (
Figure 8B,D) than in the full-scan groups (
Figure 8A,C). Comparing the prealignment and postalignment images reveals that the degree of deviation tended to be lower in the postalignment data.
4. Discussion
This study compared the trueness of digital implant impressions according to the ISB orientation and scanning method in the cases of a single implant in the presence of adjacent teeth. For two of the three intraoral scanners, there were significant differences according to the ISB orientation and the scanning method. For the tabletop scanner, it was found to show higher trueness to connect the ISB with its flat surface facing the buccal direction; that is, the null hypothesis of this study was partially rejected for three types of intraoral scanner, and rejected for one laboratory scanner.
For the prealignment data, the overall RMSE was significantly lower in the buccal group than in the proximal group for the three intraoral scanners. Deep, undercut, angled, inclined, or crowded surfaces of surrounding structures are difficult to scan and hence cause inaccurate point clouds, which may decrease the scan accuracy in proximal areas [
28,
29]. This difference in ease of scanning between the buccal and proximal surfaces would have influenced the trueness according to the ISB orientation.
For the postalignment data, the RMSE was lower when the flat surface of the ISB faced the buccal direction and a full scan was performed. The effects of the ISB orientation and scanning method do not seem to be completely compensated for even in the process of aligning with a virtual implant, which seems to have a subtle effect on the completion of the process of aligning library data. In the case of fabricating restorations from natural teeth, it is important to capture the details of the teeth well, including in the margin area. However, in the case of implants, only the location of the ISB is important, resulting in differences in the reported importance of the scanning method [
30]. However, the present study confirmed that a meticulous full scan of the entire areas of the ISBs is important even when scanning an implant case using ISBs. This is consistent with the finding of Park et al. that the imaging deficiency of the ISB influenced the position of the virtual implant; these authors suggested that a surface area deficiency of more than 10% in an ISB should be avoided [
24].
The present study found that both prealignment and postalignment data showed differences in RMSE values according to the ISB orientation and scanning method for different scanners. For the implant, after data are acquired by scanning, mesh reconstruction is performed using an implant library, and a virtual implant is created by surface matching with the digital implant library [
9]. Therefore, not only the scan quality but also the shape-matching algorithm affect the accuracy. The differences in trueness according to scanner types in the present study may have resulted from not only the scanning process itself but also during data processing. Previous studies have found that the accuracy when using different intraoral scanner systems varies with factors such as the familiarity of the operator, learning curve, ergonomic design of the handheld camera, design of hardware and software, and the research method and design [
31]. Therefore, future comparisons of the accuracy of scanners for digital implant impressions will require the establishment of a standardized research model [
31].
The T500 device is a laboratory scanner, and unlike intraoral scanners that acquire small images using a small scanner head and stitch these images together to obtain the entire image, the overall accuracy is higher for a laboratory scanner because it obtains a whole image of the entire area and scans by rotating the model table [
32]. The present study found that the accuracy of the T500 scanner was higher when the flat surface of the ISB facing the buccal direction in both the prealignment and postalignment data. The model table was scanned within the limit that allowed rotation, so the flat surface of the ISB faced the buccal direction, and the scan accessibility of the flat surface was higher, which would have contributed to increased trueness.
This was an in vitro study, and real clinical scanning procedures are further influenced by patient movements (e.g., breathing), humidity, and the restricted intraoral space [
33]. Therefore, future studies need to reproduce the in vivo environment of the oral cavity. Additionally, the present study analyzed the trueness by matching a reference file and the test file using a best-fit algorithm to obtain RMSE values. This method presents negative and positive deviations for each region as a color map in the scan file in three dimensions, and provides an average deviation value for the entire area as an RMSE value; however, a limitation is that it does not indicate the accuracy of the actual implant position. Future studies should, therefore, evaluate linear and angular discrepancies in the positions of implant fixtures, and also the final restorations in order to assess clinically significant differences. Moreover, the ISBs used in this study had a cylindrical shape with a flat surface and were made of polyether ether ketone. Since clinicians use various types of ISBs in clinical practice, it is necessary to conduct additional research into the effects of different materials and types of ISBs [
22]. Finally, since scanning results are also affected by the individual’s experience, it is also necessary to investigate outcomes for several researchers to determine the intra- and interoperator reliabilities [
34].
Previous studies on the accuracy of digital implant impressions have mainly involved edentulous cases or multiple cases [
16,
17,
18,
19,
20,
21,
22,
23]. In contrast, this study focused on partial-arch models with single implants in the presence of adjacent teeth. In particular, the effect of ISB orientation and the scanning method was examined. Clinically, the operator must invest additional time and effort to completely scan all areas, including the proximal surface of the ISB. The results of this study indicate that when performing oral scanning, the operator should connect the ISB so that its flat surface faces the buccal direction, and should try to scan the full area. It was also found that it is advantageous to connect the ISBs buccally when using a tabletop scanner.


