Article

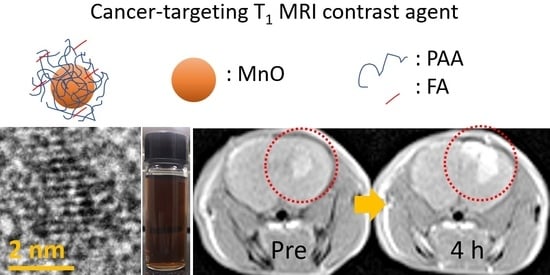
In Vivo Positive Magnetic Resonance Imaging of Brain Cancer (U87MG) Using Folic Acid-Conjugated Polyacrylic Acid-Coated Ultrasmall Manganese Oxide Nanoparticles

1
Department of Chemistry, College of Natural Sciences, Kyungpook National University, Taegu 41566, Korea
2
Division of Applied RI, Korea Institute of Radiological and Medical Sciences (KIRAMS), Seoul 01812, Korea
3
Department of Molecular Medicine, School of Medicine, Kyungpook National University, Taegu 41944, Korea
4
Department of Biology Education, Teachers’ College, Kyungpook National University, Taegu 41566, Korea
*
Authors to whom correspondence should be addressed.
Appl. Sci. 2021, 11(6), 2596; https://doi.org/10.3390/app11062596
Submission received: 31 January 2021 / Revised: 3 March 2021 / Accepted: 9 March 2021 / Published: 15 March 2021
(This article belongs to the Special Issue Nanomaterials, Targeting and Treating Diseases)

Abstract

:

Featured Application

Cancer-targeting T1 magnetic resonance imaging contrast agent.

Abstract

Ultrasmall nanoparticles are potential candidates for application as high-performance imaging agents. Herein, we present the synthesis and characterization of folic acid (FA)-conjugated polyacrylic acid (PAA)-coated MnO nanoparticles with an average particle diameter of 2.7 nm. FA conferred cancer-targeting ability, while PAA conferred good colloidal stability and low cellular cytotoxicity on the FA-PAA-coated MnO nanoparticles. Further, the nanoparticles exhibited a high relaxivity (r1) value of 9.3 s−1mM−1 (r2/r1 = 2.2). Their application potential as cancer-targeting T1 magnetic resonance imaging contrast agents was confirmed by their enhanced T1 contrast enhancements at the brain cancer (U87MG) site upon intravenous administration to mice tails.

Graphical Abstract

1. Introduction

Cancer is a deadly disease with high recurrence and mortality rates [1]. An accurate cancer diagnosis at the early stages is vital for the patient’s timely treatment. Magnetic resonance imaging (MRI) is the clinically relevant and common method for preoperatively estimating the prognosis of a cancer patient [2,3]. Contrast agents are generally used in MRI [4,5], most commonly Gd-chelates [6,7,8], to further improve the cancer diagnosis. Recently, nanoparticles have attracted increasing research attention owing to their better contrasting abilities than those of commercial molecular agents [5,9,10].
Among nanoparticles, ultrasmall manganese oxide (MnO) nanoparticles are receiving special research interest due to their potential applicability as contrast agents in positive (T1) MRI [11,12]. Although bulk MnO is antiferromagnetic, MnO nanoparticles exhibit considerable magnetization at room temperature, attributable to the unpaired 3d-electron spins of Mn2+ on the nanoparticle surfaces [13,14]. Notably, the high pure spin magnetic moment (S = 5/2) of Mn2+ can strongly induce longitudinal water proton spin relaxations since slow electron spin motions match well with proton spin relaxations [7,8]. In addition, Mn2+ is nearly non-toxic in limited dosages [12,15]. Thus, MnCl2 has been approved for use in animals as a T1 MRI contrast agent by the United States Food and Drug Administration [12,15].
Ultrasmall nanoparticle contrast agents possess an additional advantage over molecular agents since cancer-targeting ligands and drugs can easily attach to the nanoparticle surfaces. Moreover, the conjugation of cancer-targeting ligands to the nanoparticles further improves their contrasting abilities. Among cancer-targeting ligands, folic acid (FA) has been widely used owing to its high affinity towards folate receptors, which are over-expressed on diverse cancer cells [16,17,18,19]. Furthermore, FA can easily be conjugated to surface-modified nanoparticles through an amide bond [20,21,22,23].
Small molecules such as FA are less efficient in providing good colloidal stability to nanoparticles compared to polymers. This is owing to many hydrophilic and binding groups of polymers that can attach to the nanoparticles [24,25]. Polyacrylic acid (PAA) with numerous COOH groups (i.e., one COOH group per monomer unit) belongs to such polymers [26,27,28]. Therefore, herein, FA was conjugated with PAA, and subsequently the obtained FA-PAA ligands were grafted onto the nanoparticle surfaces.
Herein, we report the synthesis and extensive characterization of FA-PAA-coated MnO nanoparticles. We measured in vitro cellular cytotoxicities of these nanoparticles and investigated their relaxometric properties and effectiveness as cancer-targeting T1 MRI contrast agents using brain cancer model nude mice.

2. Materials and Methods

2.1. Materials

MnCl2∙4H2O (>99%), NaOH (>99%), FA (>97%), PAA (Mw = ~1800 amu), dimethyl sulfoxide (DMSO) (99.9%), triethylene glycol (TEG) (99%), N,N′-dicyclohexylcarbodiimide (DCC) (99%), 4-(dimethylamino) pyridine (DMAP) (>99%), tert-butyl N-(2-aminoethyl) carbamate (EDA-Boc) (>98%), triethylamine (TEA) (>99%), trifluoroacetic acid (TFA) (99%), Roswell Park Memorial Institute (RPMI)-1640, and Dulbecco’s Modified Eagle Medium (DMEM) were purchased from Sigma-Aldrich, USA. Ethyl acetate (99.9%), chloroform (99.9%), and ethanol (99.99%) were purchased from Duksan Chemical Co., South Korea. All chemicals were used without any further purification.

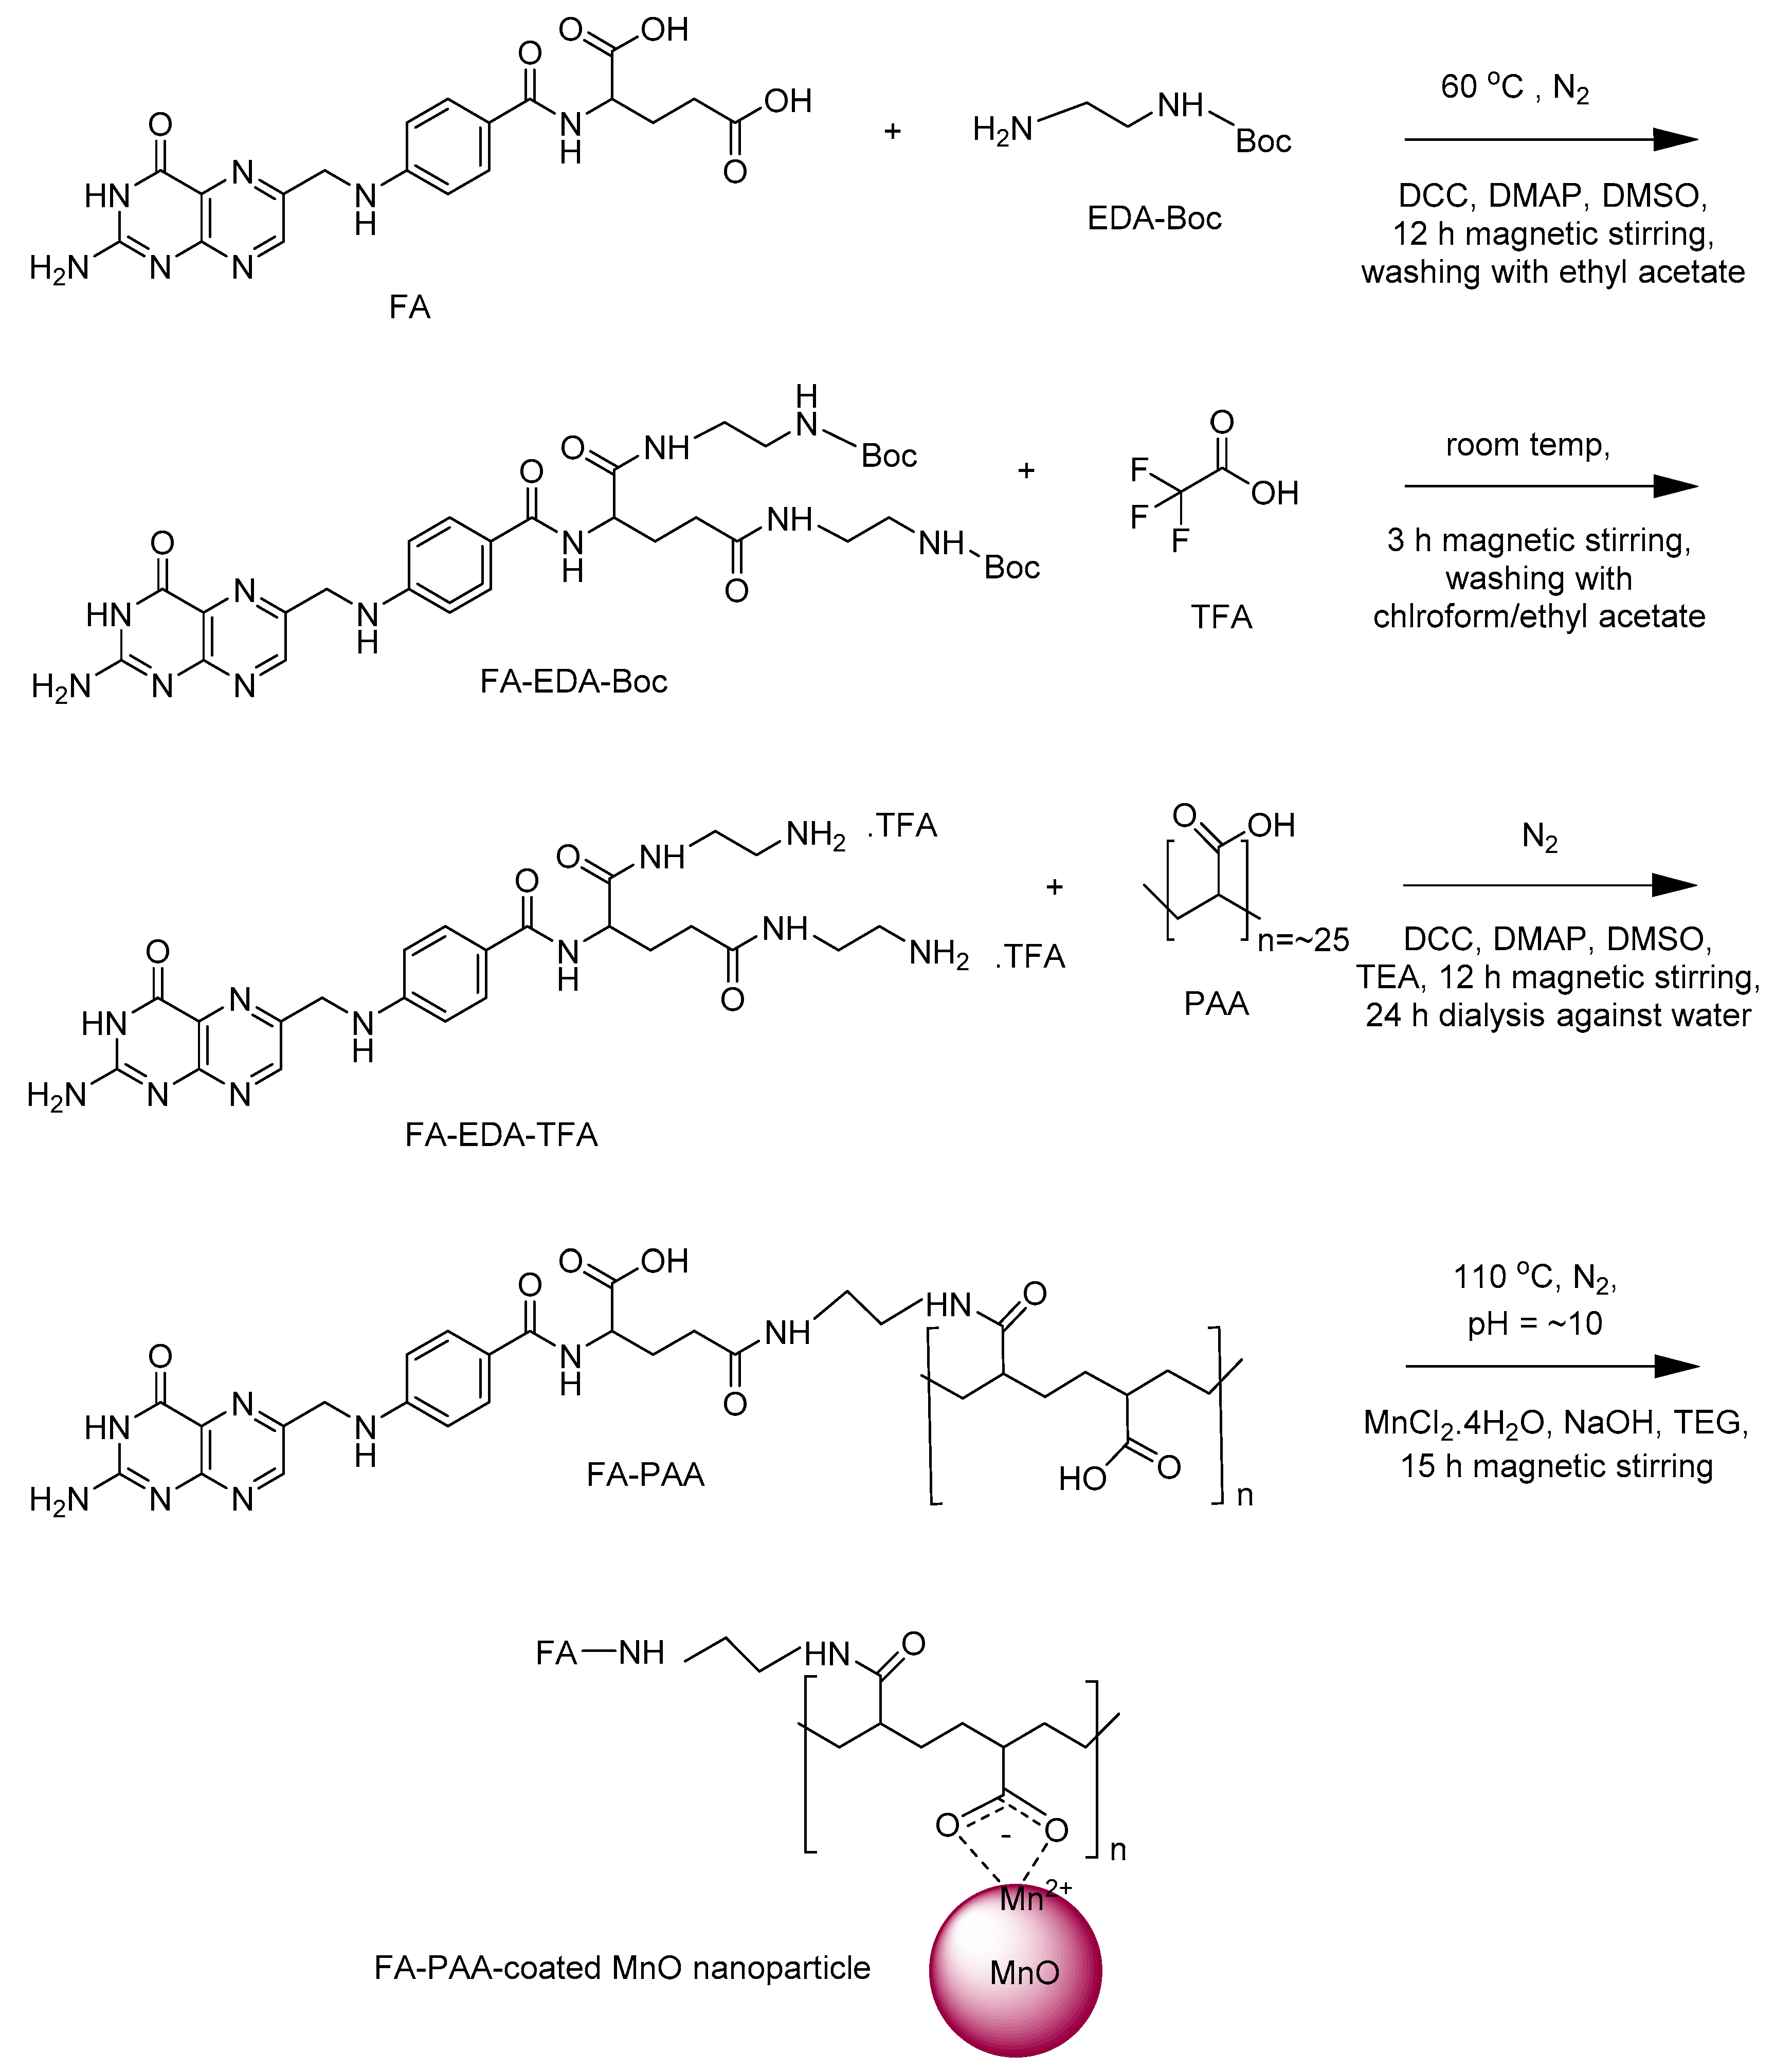
2.2. Preparation of FA-PAA

FA-PAA was prepared via three steps, i.e., FA-EDA-Boc → FA-EDA-TFA → FA-PAA (Figure 1). To prepare FA-EDA-Boc (the first step in Figure 1), 0.9 mmol of FA was dissolved in 15 mL of DMSO at 60 °C under an N2 flow and magnetic stirring in a 100-mL three-neck round-bottom flask. After the solution temperature decreased to room temperature, 0.1 mmol of DMAP and 1.0 mmol of DCC were added to the solution using a syringe, followed by magnetic stirring for another 1 h. Next, 1.8 mmol of EDA-Boc was added to the solution with a syringe and the reaction proceeded for 12 h. The obtained product solution was added slowly to cold ethyl acetate. The obtained yellow precipitate, i.e., FA-EDA-Boc, was washed with ethyl acetate several times. To prepare FA-PAA-TFA (the second step in Figure 1), 2 mL of TFA was added to the yellow precipitate obtained above in a 100-mL three-neck round-bottom flask, and the solution was magnetically stirred for 3 h at room temperature until it dissolved in TFA. Next, chloroform was slowly added to the solution until a yellow precipitate was formed. The upper clear solution was removed, and the remaining precipitate was washed thrice with ethyl acetate. The obtained product, i.e., FA-EDA-TFA, was dried to powder form using a rotary evaporator. To prepare FA-PAA (the third step in Figure 1), the above FA-EDA-TFA was added to 5 mL of DMSO in a 100-mL three-neck round-bottom flask, followed by the addition of 40 μL of TEA using a syringe. The mixture was magnetically stirred until a clear solution was obtained. Separately, 1.5 mmol of PAA was added to 20 mL of DMSO under an N2 flow at 60 °C in a 100-mL three-neck round-bottom flask, and the mixture was magnetically stirred until a clear solution was obtained. After the solution temperature decreased to room temperature, 1.5 mmol of DCC and 0.15 mmol of DMAP were added using a syringe, and the reaction continued for 1 h. Thereafter, the above-prepared FA-EDA-TFA solution was slowly added to the PAA solution using a syringe. The reaction continued for 12 h with magnetic stirring. The obtained solution was dialyzed (MWCO = 1000 amu) against triple-distilled water for 24 h. After dialysis, the remaining solution inside the bag was filtered using a Whatman filter paper (Sigma-Aldrich, USA) and subsequently evaporated using a rotary evaporator to obtain a dark yellow solid product, i.e., FA-PAA.

2.3. Preparation of FA-PAA-Coated MnO Nanoparticles

To prepare the FA-PAA-coated MnO nanoparticles through a simple one-pot polyol method (last step in Figure 1), 0.25 mmol of FA-PAA and 2 mmol of MnCl2∙4H2O were dissolved in 20 mL of TEG in a 100-mL three-neck round-bottom flask under an N2 flow and magnetic stirring at room temperature. In a separate beaker, 10 mmol of NaOH was dissolved in 15 mL of TEG at room temperature: The NaOH solution was slowly added to the above solution with a syringe until the pH reached ~10. Then, the reaction temperature slowly increased from room temperature to 110 °C and maintained at that temperature for 15 h. The solution was cooled to room temperature and transferred to a 500 mL beaker. The product solution was then washed with 400 mL of ethanol thrice to remove TEG, Mn2+, Cl, Na+, OH, and FA-PAA. To this end, the product solution was diluted with 400 mL of ethanol and then, kept in a refrigerator (~4 °C) for a few days until the product nanoparticles were precipitated. The upper clear portion of the solution was removed, and the remaining product solution was washed with ethanol again. This washing process was repeated thrice. Ethanol was removed from the product nanoparticles by adding 400 mL of triple-distilled water to the product solution and then, concentrating it to a volume of 20–30 mL using a rotary evaporator. This washing process was repeated thrice. The product solution was split into two parts: One-half volume was freeze-dried to a powder sample under a vacuum, whereas the other half volume was used to make an aqueous nanoparticle suspension by diluting it with triple-distilled water.

2.4. Characterizations

A high-resolution transmission electron microscope (HRTEM) (Titan G2 Chemi STEM CS Probe, FEI, Hillsboro, Oregon, USA; 200 kV accelerating voltages) was employed to measure the nanoparticle particle diameters. For the measurement, a minute amount of the nanoparticle suspension sample diluted with triple-distilled water was dropped onto an amorphous carbon film coated-copper grid (PELCO No.160, TED PELLA, Inc., Redding, CA, USA). The sample was dried in air at room temperature prior to the measurements. The hydrodynamic diameters of the nanoparticles were measured using a dynamic light-scattering (DLS) particle size analyzer (Zetasizer Nano ZS, Malvern, Malvern, UK) and a nanoparticle suspension sample diluted with triple-distilled water (0.1 mM Mn). The zeta potentials (Zetasizer Nano ZS, Malvern, Malvern, UK) were measured using a nanoparticle suspension sample diluted with triple-distilled water (0.1 mM Mn). The structural characterization of the nanoparticles was performed using an X-ray powder diffractometer (XRD) (X’PERT PRO MRD, Philips, The Netherlands) with unfiltered CuKα radiation (λ = 1.54184 Å) and powder samples. The Mn concentration in the aqueous nanoparticle suspension sample was determined via inductively coupled plasma-atomic emission spectroscopy (ICP-AES) (IRIS/AP, Thermo Jarrell Ash Co., Waltham, MA, USA). Fourier transform infrared (FT-IR) absorption spectroscopy (Galaxy 7020A, Mattson Instrument, Inc., Madison, WI, USA) was used to prove the nanoparticle surface coating. KBr pellets of the powder samples were used to record the FT-IR absorption spectra. Thermogravimetric analysis (TGA) (SDT-Q600, TA Instrument, New Castle, DE, USA) was used to estimate the surface-coating amount on the nanoparticles. The TGA curve of the powder sample was recorded between room temperature and 700 °C under an N2 flow. A vibrating sample magnetometer (VSM) (7407-S, Lake Shore Cryotronics Inc., Westerville, OH, USA) was employed to investigate the magnetic properties of the nanoparticles using the powder sample (approximately 15–20 mg). The magnetization (M) versus the applied field (H) (i.e., M−H) curves (‒2.0 T ≤ H ≤ 2.0 T) at T = 100 and 300 K were recorded. The net mass of the MnO nanoparticles extracted from the TGA curve was used to estimate the net M value of the sample (only MnO nanoparticles without FA-PAA).

2.5. Relaxometric Property Measurements

The original aqueous nanoparticle suspension sample was diluted with triple-distilled water to prepare aqueous nanoparticle suspension samples with various Mn-concentrations (1.0, 0.5, 0.25, 0.125, and 0.0625 mM). The longitudinal (T1) and transverse (T2) water proton spin relaxation times were measured for these solutions using a 3.0 T MRI scanner (Magnetom Trio Tim, Siemens, Munchen, Bayern, Germany). An inversion recovery method was employed to obtain the T1 relaxation times [29]. A multiple spin-echo method with a Carr-Purcell-Meiboom-Gill pulse sequence was employed to obtain the T2 relaxation times [29]. Thereafter, 1/T1 and 1/T2 were plotted as a function of Mn-concentration to estimate the longitudinal (r1) and transverse (r2) water proton spin relaxivities from the slopes, respectively.

2.6. Cellular Toxicity Measurements

A CellTiter-Glo Luminescent Cell Viability Assay (Promega, Madison, WI, USA) was employed to obtain the cellular toxicity of the aqueous nanoparticle suspension sample. A luminometer (Synergy HT, BioTek, Winooski, VT, USA) was used to quantify the intracellular adenosine triphosphate in this assay. Normal mouse hepatocyte (NCTC1469) and human prostate cancer (DU145) cell lines were employed for the tests. The cells were incubated for 24 h on a 24-well cell culture plate (5 × 10⁴ cell density, 500 μL of cells per well, 5% CO2, and a temperature of 37 °C). RPMI-1640 and DMEM were employed as the culture media for the DU145 and NCTC1469 cells, respectively. The original concentrated nanoparticle suspension sample was diluted with a sterile phosphate-buffered saline (PBS) solution to make five test nanoparticle suspension samples, and 2 μL of each test nanoparticle suspension sample was added to the above-cultured cells to obtain Mn-concentrations of 10, 50, 100, and 200 μM in the cells. Thereafter, the treated cells with nanoparticle suspension samples were incubated for 48 h. A total of 200 μL of CellTiter-Glo reagent was added to 200 μL of the above incubated treated cells per well and the cells were lysed for 30 min on an orbital shaker. The viabilities of the cells were measured using the luminometer (300–700 nm), following which they were normalized with respect to those of the control cells with 0.0 M Mn. The average cell viabilities were estimated from three measurements.

2.7. Preparation of Cancer Model Nude Mice

The human glioblastoma (U87MG) cancer cells were incubated for 24 h at 37 °C in air containing 5% CO2 using the culture medium made of RPMI-1640 containing 1% (v/v) of penicillin-streptomycin and 10% (v/v) of fetal bovine serum. Two BALB/c nude mice (male, 5 weeks old, ~20 g) were inoculated to their brains with 5 × 10⁶ U87MG cancer cells suspended in a 100 μL of PBS solution. The MRI experiments were conducted 3 weeks after the cancer-cell inoculation.

2.8. In Vivo T1 MRI Experiments

The same 3.0 T MRI scanner was employed to measure the in vivo T1 MR images. The tails of the above-prepared cancer model nude mice were intravenously injected with the aqueous nanoparticle suspension sample (injection dose = ~0.1 mmol Mn/kg). The mice were anesthetized with 1.5% isoflurane in oxygen. The imaging measurements were conducted prior and posterior to the injection of the sample. During the measurements, the body temperature of the mice was kept at 37 °C using a warm water blanket. Following the measurements, the mice were revived from anesthesia and placed in a cage with free access to food and water. For measurements, radio-frequency spoiled T1-weighted gradient-recalled echo (GRE) sequences were used. The typical measurement parameters are as follows: Applied MR field (H) = 3 T, temperature = 37 °C, echo time = 12 ms, repetition time = 564 ms, pixel bandwidth = 15.63 Hz, frequency = 256 Hz, phase = 256, number of acquisitions = 3, field of view = 60 mm, phase field of view = 1, slice thickness = 1.0 mm, number of slices = 24, and spacing gap = 1.1 mm.

3. Results

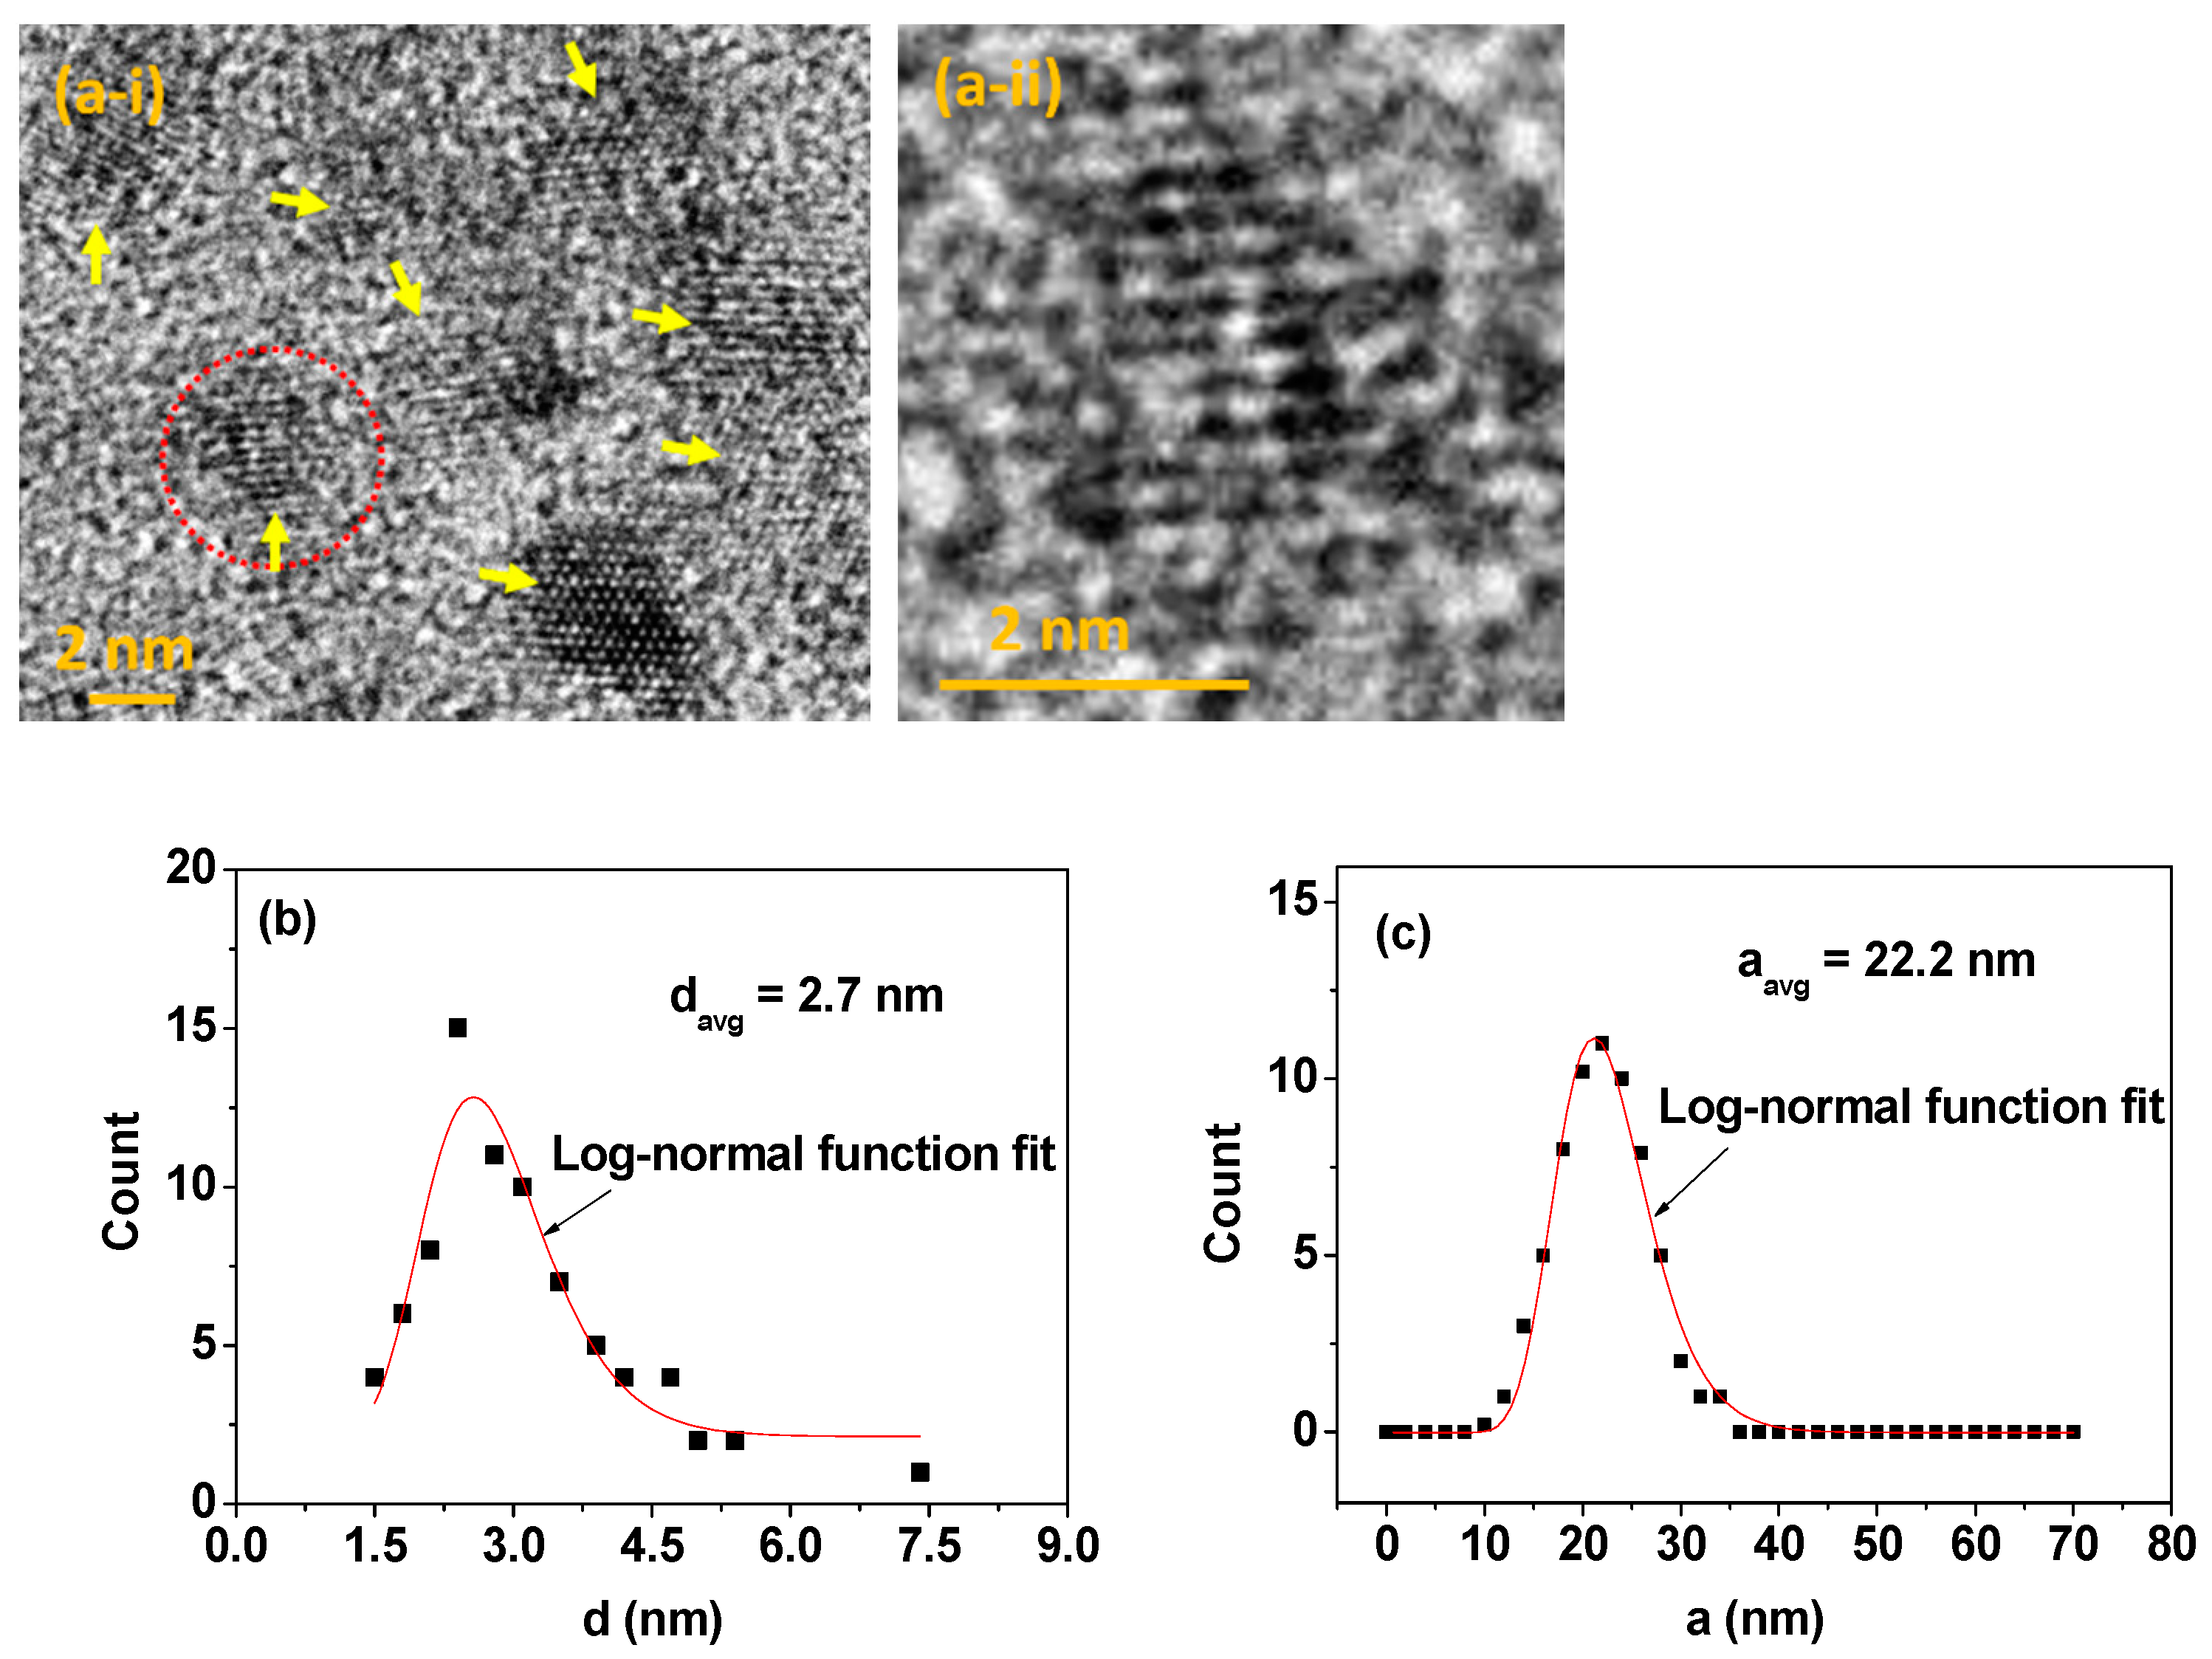
3.1. Particle Size, Colloidal Stability, and Crystal Structure

The colloidally stable FA-PAA-coated MnO nanoparticles were prepared via a simple one-pot polyol method (last step in Figure 1). The nanoparticle diameter (d) was measured via HRTEM. The nanoparticles were ultrasmall (Figure 2a-i), and a magnified image of a nanoparticle, indicated as a dotted circle in Figure 2a-i, showed the MnO nanoparticle lattice fringes (Figure 2a-ii). The estimated average particle diameter was 2.7 ± 0.1 nm from a log-normal function fit to the observed particle diameter distribution (Figure 2b and Table 1). The hydrodynamic diameter (a) of the FA-PAA-coated MnO nanoparticles was measured via DLS, and the estimated average hydrodynamic diameter was 22.2 ± 0.1 nm from a log-normal function fit to the observed hydrodynamic diameter distribution (Figure 2c and Table 1).
The nanoparticle colloidal stability was confirmed by visually inspecting the aqueous nanoparticle suspension sample (36.4 mM Mn) (Figure 3a-i): since preparation, no nanoparticle precipitation occurred (>1 year). Further, no nanoparticle precipitation occurred for the dilute aqueous nanoparticle suspension samples (2.0 mM Mn) in the presence of 1.0 mM Ca2+ and Mg2+ ions for 5 days (Figure 3a-ii,a-iii, respectively, indicating no effects of these biologically important ions on the nanoparticle colloidal stability). Additionally, the high zeta potential (ξ) of ‒32.6 ± 0.4 mV (Figure 3b and Table 1) further confirmed the colloidal stability. Colloidal dispersion was confirmed through the Tyndall effect: laser light scattering was only observed in the nanoparticle suspension sample, caused by the collision between the nanoparticle colloids and the passing laser light. Contrastingly, it was not observed in the reference triple-distilled water (Figure 3c).
As shown in Figure 4, the XRD pattern obtained before TGA show significantly broad peaks (bottom spectrum), probably since most of the nanoparticles were not fully crystallized owing to their ultrasmall particle sizes. However, after TGA, sharp peaks were observed (top spectrum), due to the particle growth and crystallization of the nanoparticles. All post-TGA peaks could be assigned with (hkl) Miller indices. They corresponded to the cubic structure of MnO with characteristic peaks of (111), (200), (220), (311), (222), and (400) as indicated on the top of the XRD pattern. The estimated cell constant (L) of 4.43 ± 0.1 Å was consistent with the reported value [30].

3.2. Surface-Coating

The FA-PAA coating on the nanoparticles was confirmed from the FT-IR absorption spectrum of the FA-PAA-coated MnO nanoparticles (bottom spectrum in Figure 5a). The FT-IR absorption spectra of FA, PAA, and FA-PAA were also recorded for reference (top three spectra in Figure 5a). The C-H symmetric stretching peak at ~2940 cm−1 was observed in all FT-IR absorption spectra, supporting that the MnO nanoparticles were coated with FA-PAA. The C=C aromatic ring symmetric stretching peak at 1602 cm−1 in the spectrum of FA also appeared in the spectrum of FA-PAA, confirming the successful conjugation of FA with PAA through an amide bond between the -NH2 group of FA and the -COOH group of PAA. This peak also appeared in the spectrum of the FA-PAA-coated MnO nanoparticles, confirming that the MnO nanoparticles were coated with FA-PAA. The C=O symmetric stretching peak at 1688 cm−1 in the FA-PAA spectrum was split into COO antisymmetric stretching at 1540 cm−1 and COO symmetric stretching at 1396 cm−1 in the spectrum of FA-PAA-coated MnO nanoparticles, which were red-shifted by 148 and 292 cm−1, respectively. This is owing to the strong coordination bonding between the -COO group of PAA of FA-PAA and the Mn2+ species on the nanoparticle surface. Such splittings and red-shifts have been observed previously in various ligands with carboxylic groups bonded to metal oxides [31,32], which support our results.
The average surface-coating amount of FA-PAA was estimated from the TGA curve (Figure 5b). After heating the powder sample from room temperature to 700 °C, a decrease in mass was observed in the TGA curve. The initial decrease in mass (14.6 wt%) between the room temperature and ~100 °C was owing to air and water desorption, whereas the following mass decrease (P) (38.1 wt%) was due to the FA-PAA removal from the nanoparticles by flowing hot nitrogen. The remaining mass (47.3 wt%) was attributed to the MnO nanoparticles, as confirmed from the XRD pattern obtained after TGA (Figure 4). Therefore, 44.6 wt% FA-PAA [obtained as 38.1/(1 − 0.146)] is estimated to be in the FA-PAA-coated MnO nanoparticles. The average number of FA-PAA molecules grafted per nanoparticle unit surface area, i.e., the grafting density (σ) [33], was estimated to be 0.6 nm−1 using the above-mentioned P-value of FA-PAA, the davg estimated via HRTEM imaging, and the bulk density of MnO (5.45 g/cm3) [34]. The average number (N) of FA-PAA molecules coating a nanoparticle surface was determined as the product of σ by the nanoparticle surface area (πdavg2), which was found to be ~14. Table 1 summarized the surface-coating results.

3.3. Magnetic Properties

The mass-corrected M‒H curves of the powder sample at T = 100 and 300 K are presented in Figure 6. The M‒H curve at T = 100 K was slightly noisy due to a slight instability in the temperature control of the instrument at low temperature. However, it was stable at room temperature (i.e., T = 300 K). The M‒H curves showed the lack of saturation magnetization and a zero value in both remanence and coercivity, i.e., no hysteresis. This lack of saturation magnetization and hysteresis indicates that the MnO nanoparticles are paramagnetic, as observed previously [35]. From the mass-corrected M‒H curves, the net M values of the MnO nanoparticles at T = 100 and 300 K at H = 2.0 T were estimated to be 3.2 and 1.1 emu/g, respectively (Table 1). Since the bulk MnO is antiferromagnetic, the observed appreciable M values of the nanoparticles are mainly attributable to the many unpaired paramagnetic 3d-electron spins (S = 5/2) of Mn2+ species on the nanoparticle surfaces since the observed particle diameters were ultrasmall [13,14].

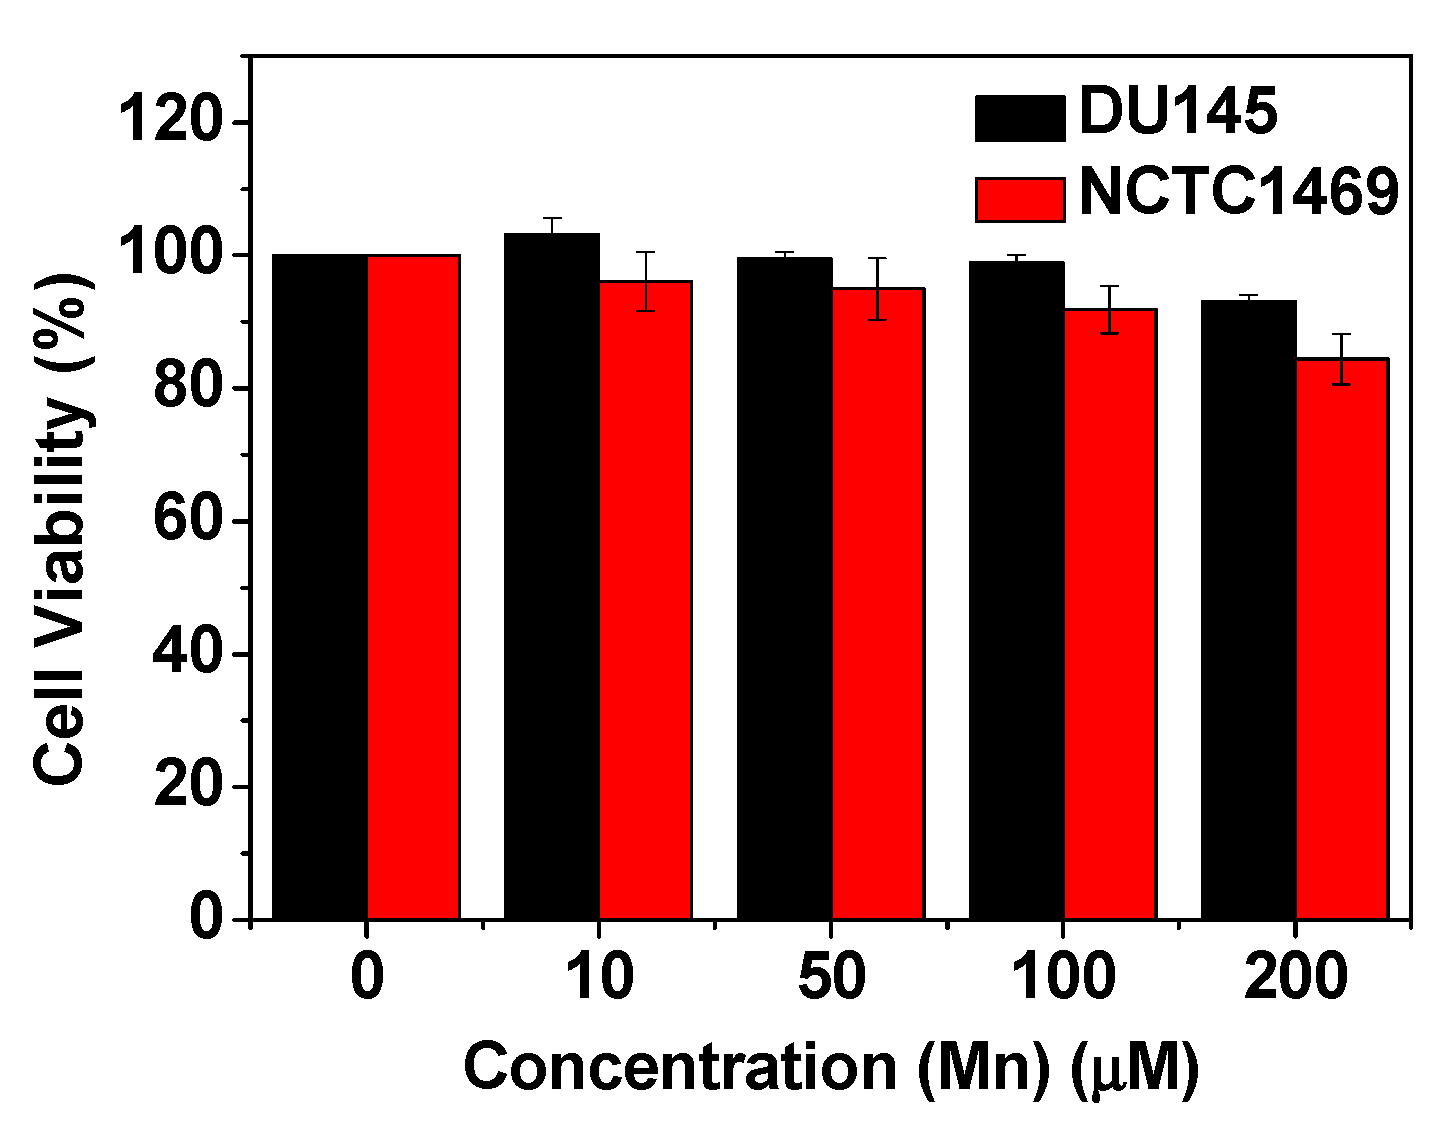
3.4. In Vitro Cell Viabilities

No significant loss in cell viabilities up to 200 μM Mn was observed for the FA-PAA-coated MnO nanoparticles in the DU145 and NCTC1469 cells (Figure 7), indicating the suitability of the nanoparticles for in vivo applications.

3.5. Water Proton Spin Relaxivity Values

The r1 and r2 relaxivities of the FA-PAA-coated MnO nanoparticles, i.e., the slopes of the 1/T1 and 1/T2 plots versus the Mn-concentration, respectively, were estimated to investigate their potential as an MRI contrast agent. As shown in Figure 8a and Table 1, the estimated r1 and r2 values were 9.3 ± 0.1 and 20.4 ± 0.4 mM−1s−1 (r2/r1 = 2.2), respectively. In addition, dose-dependent contrast enhancements were clearly observed in the longitudinal (R1) and transverse (R2) map images (Figure 8b), evidencing that the FA-PAA-coated MnO nanoparticles can act as both T1 and T2 MRI contrast agents. However, the r1 value was high and the r2/r1 ratio was somewhat close to one, corresponding to highly suitable conditions for successful application as a T1 MRI contrast agent [7,8]. Thus, the FA-PAA-coated MnO nanoparticles were applied as a T1 MRI contrast agent in this study.

3.6. In Vivo T1 MRI

The nanoparticle suspension sample was intravenously administrated to the tails of the brain cancer model nude mice. The T1 MR images were taken before and after the administration. As shown in Figure 9a, positive contrast enhancements were clearly observed at the brain cancer site after administration. To quantitatively evaluate the contrast enhancements, the signal-to-noise ratio (SNR) of a region of interest (ROI) (denoted as red dots indicated with arrows) at both the cancer and normal brain tissues was plotted versus time (Figure 9b). The contrast enhancements at the brain cancer site were stronger than those at the normal brain tissue, indicating the high accumulation of nanoparticles at the brain cancer site. In addition, the [{contrast (24 h) − contrast (0 h)}/contrast (0 h)] value at the brain cancer site was approximately seven times higher than that at the normal brain tissue, indicating the prolonged retention of the nanoparticles at the cancer site, which is likely attributable to the cancer-targeting function of the nanoparticles.

4. Discussion

Both the colloidal stability and the biocompatibility of the nanoparticles are essential for their in vivo biomedical applications. The FA-PAA-coated MnO nanoparticles exhibited these properties owing to the hydrophilic and biocompatible PAA polymers grafted on their surfaces.
The observed high r1 value and the r2/r1 ratio which was somewhat close to one are attributable to the strong interactions between the many Mn2+ species on the nanoparticle surfaces and the numerous water molecules around the nanoparticles attracted by PAA (Figure 10a), as confirmed by the large hydrodynamic diameter of the nanoparticles. This type of interaction corresponds to the magnetic dipole‒dipole interaction between 3d-electron spins (S = 5/2) of Mn2+ and water proton spins (s = 1/2) [8]. As shown in Figure 10b, the longitudinal water proton spin relaxation from the β‒spin (−1/2) to the α‒spin (1/2) is strongly stimulated by the 3d-electron spins of Mn2+ since slow electron spin motions match well with the proton spin relaxations [7,8]. Under such conditions, the T1 relaxation times of the water proton spins significantly decrease, resulting in a high r1 value, as observed in various hydrophilic polymer-coated gadolinium oxide nanoparticles [36,37,38].
As a comparison, the r1 values of various MnO nanoparticles and metal-ion chelates are provided in Table 2. As presented in Table 2, the r1 values of large MnO nanoparticles (davg > 10 nm) [20,39,40,41] are smaller than those [35] of ultrasmall MnO nanoparticles (davg < 3 nm), including that in this study. This is due to the fact that ultrasmall nanoparticles possess higher surface‒to‒volume ratios than large nanoparticles, and thus, they possess a higher number of surface Mn2+ with S = 5/2 per nanoparticle that interact with water proton spins (s = 1/2) (Figure 10a,b). In addition, the r1 value of the FA-PAA-coated MnO nanoparticles is 2–3 times higher than those [7,8] of the molecular Gd3+‒ and Mn2+‒chelates (Table 2). This property corresponds to the advantage of ultrasmall nanoparticle contrast agents over molecular contrast agents, which likely results from the high density of the Mn2+ species on the nanoparticle surface that can interact with many water molecules (Figure 10a), whereas only a few water molecules are allowed to interact with the central Gd3+ or Mn2+ ion in molecular contrast agents [6,7,8].
Herein, the FA-PAA-coated MnO nanoparticles exhibited stronger positive contrast enhancements at the brain cancer site compared to those at the normal brain tissue. This is due to the fact that FA possesses a high binding affinity towards folate receptors, which are over-expressed on U87MG cancer cells [42]. This result demonstrates the application potential of FA-PAA-coated MnO nanoparticles as a cancer-targeting T1 MRI contrast agent.

5. Conclusions

FA-PAA-coated MnO nanoparticles with ultrasmall particle diameters (davg = 2.7 nm) were prepared through a simple one-pot polyol method in this study. The results are summarized as follows:
(1)
The PAA coating conferred good colloidal stability and low cellular cytotoxicity, while FA conferred cancer-targeting ability on the nanoparticles.
(2)
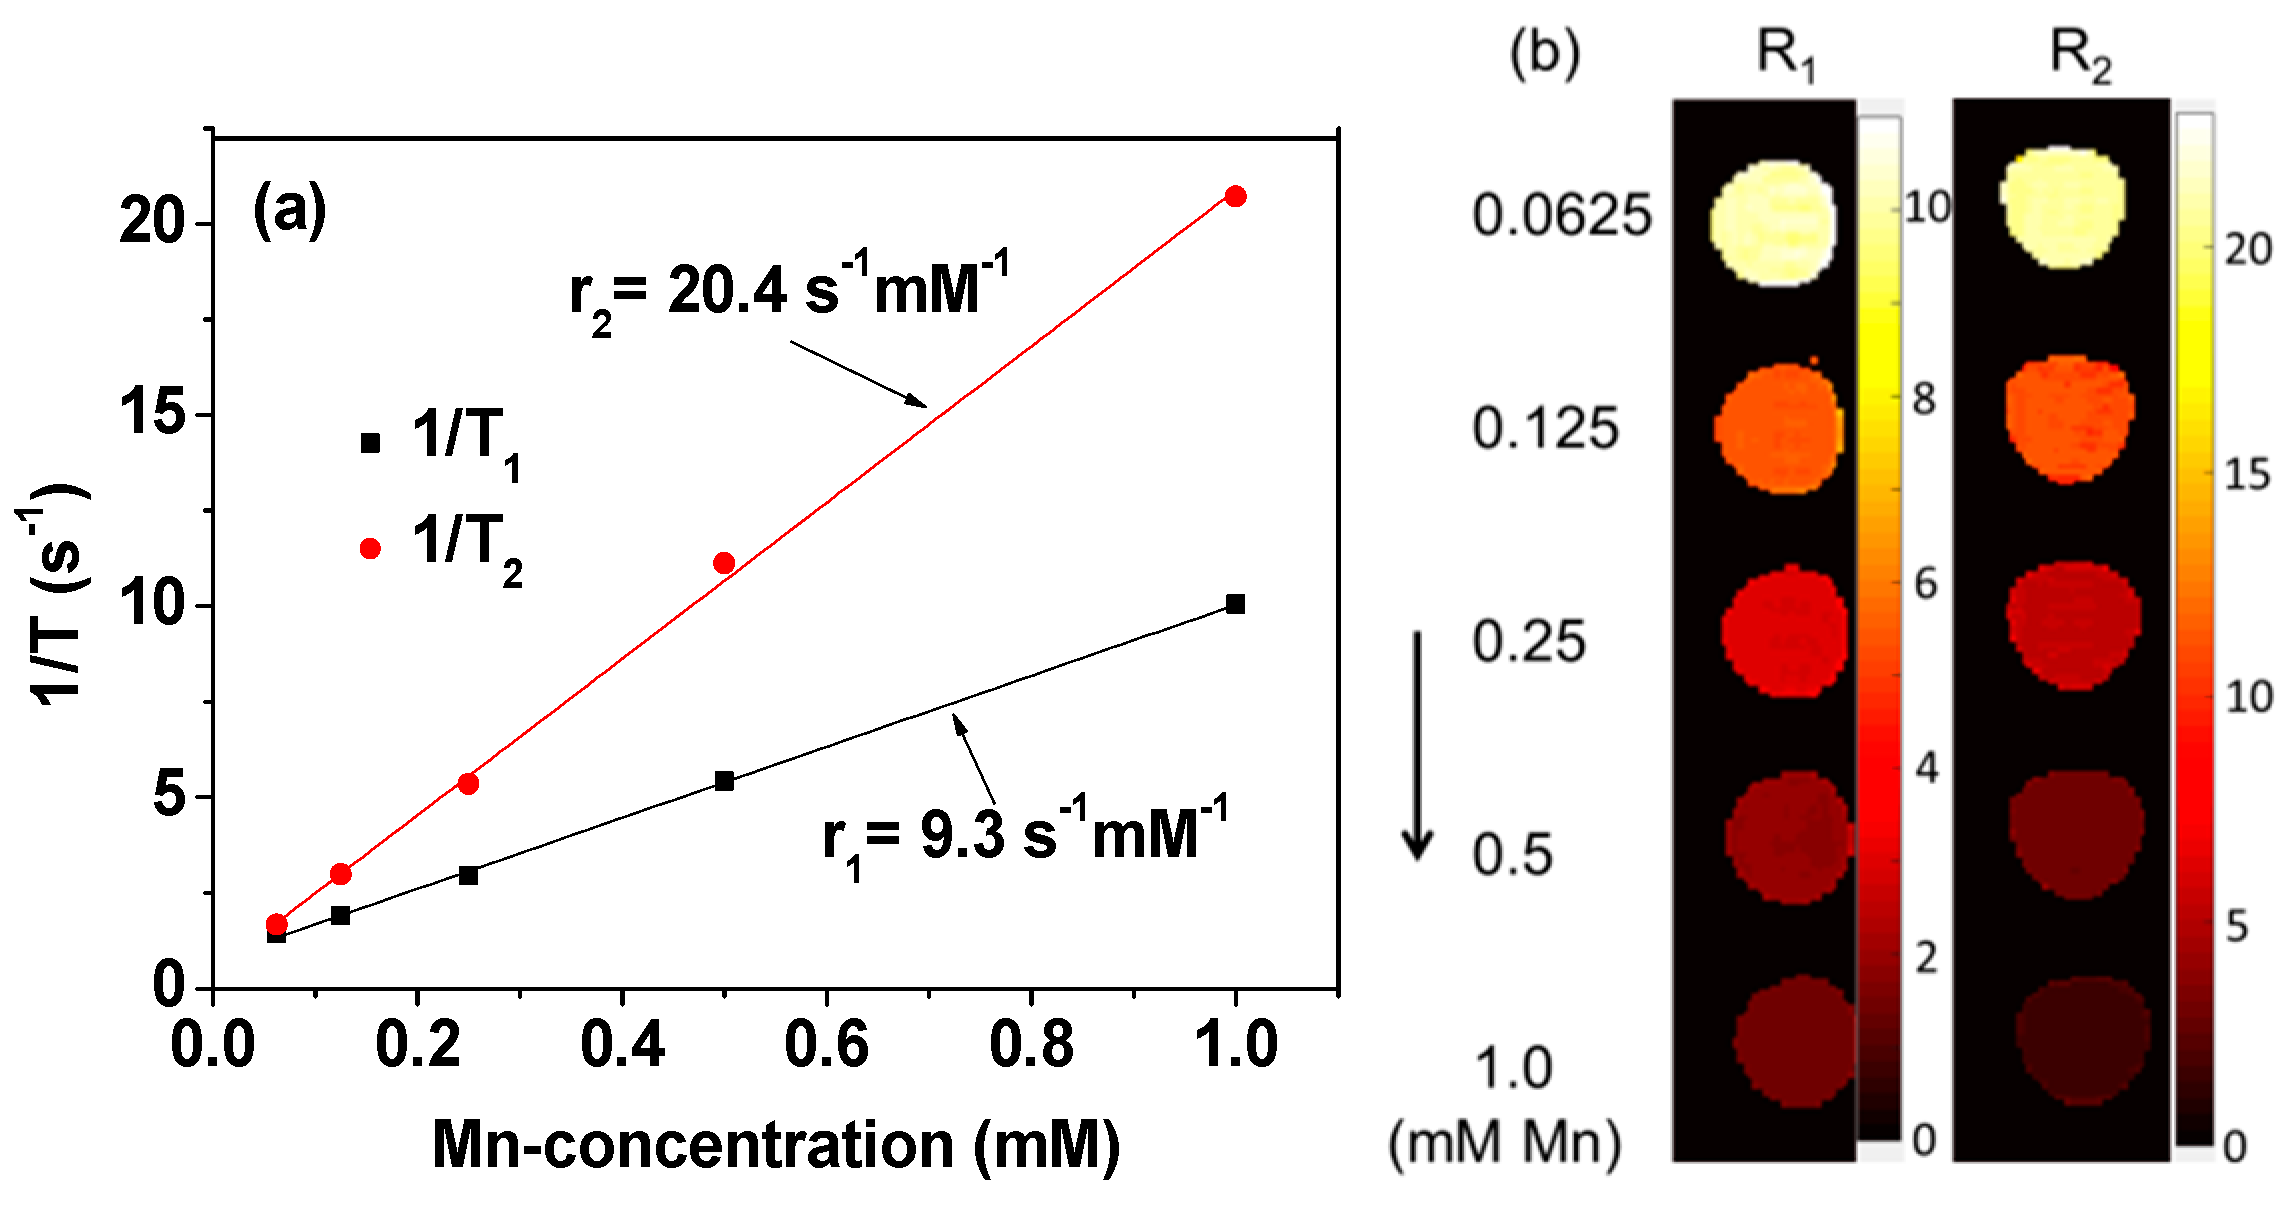
The FA-PAA-coated MnO nanoparticles exhibited a high value of r1 = 9.3 s−1mM−1 (r2/r1 = 2.2) owing to the strong interactions between the numerous Mn2+ species on the nanoparticle surfaces and the many water molecules around the nanoparticles attracted by PAA.
(3)
The effectiveness of the FA-PAA-coated MnO nanoparticles as a cancer-targeting T1 MRI contrast agent was proved by the strong positive contrast enhancements of the brain cancer site compared to those of the normal brain tissue.

Author Contributions

Methodology, S.M. and S.-L.H.; conceptualization, S.M.; formal analysis, S.M., H.Y., S.L., T.T., M.Y.A., A.K.A.A.S., D.Z. and Y.L.; investigation, S.M., H.Y., J.-A.P., S.K., J.-U.Y., H.C. and K.-S.C.; data curation, S.M., H.Y., J.-A.P., S.K., J.-U.Y., H.C. and K.-S.C.; writing—original draft preparation, S.M.; writing—review and editing, G.-H.L.; supervision, G.-H.L. and Y.C.; funding acquisition, G.-H.L. and Y.C. All authors have read and agreed to the published version of the manuscript.

Funding

This study was supported by the Basic Science Research Program (grant number 2016R1D1A3B01007622 to G.-H.L. and 2020R1A2C2008060 to Y.C.) of the National Research Foundation funded by the Ministry of Education, Science, and Technology.

Institutional Review Board Statement

The in vivo animal imaging experiments were performed according to the rules and regulation of the animal research committee of the Korea Institute of Radiological and Medical Sciences (approval number: Kirams2018-0072 and approval data: 9 January 2019).

Informed Consent Statement

Not applicable.

Data Availability Statement

The data presented in this study are available on request from the corresponding authors.

Acknowledgments

We thank the Korea Basic Science Institute for allowing us to use their XRD machine.

Conflicts of Interest

The authors declare no conflict of interest.

References

  1. Siegel, R.L.; Miller, K.D.; Jemal, A. Cancer statistics. CA Cancer J. Clin. 2020, 70, 7–30. [Google Scholar] [CrossRef]
  2. Haris, M.; Yadav, S.K.; Rizwan, A.; Singh, A.; Wang, E.; Hariharan, H.; Reddy, R.; Marincola, F.M. Molecular magnetic resonance imaging in cancer. J. Transl. Med. 2015, 13, 313. [Google Scholar] [CrossRef] [PubMed] [Green Version]
  3. Harisinghani, M.G.; O’Shea, A.; Weissleder, R. Advances in clinical MRI technology. Sci. Transl. Med. 2019, 18, eaba2591. [Google Scholar] [CrossRef] [PubMed] [Green Version]
  4. Xiao, Y.-D.; Paudel, R.; Liu, J.; Ma, C.; Zhang, Z.-S.; Zhou, S.-K. MRI contrast agents: Classification and application (Review). Int. J. Mol. Med. 2016, 38, 1319–1326. [Google Scholar] [CrossRef] [Green Version]
  5. Na, H.B.; Song, I.C.; Hyeon, T. Inorganic nanoparticles for MRI contrast agents. Adv. Mater. 2009, 21, 2133–2148. [Google Scholar] [CrossRef]
  6. Caravan, P. Strategies for increasing the sensitivity of gadolinium-based MRI contrast agents. Chem. Soc. Rev. 2006, 35, 512–523. [Google Scholar] [CrossRef]
  7. Caravan, P.; Ellison, J.J.; McMurry, T.J.; Lauffer, R.B. Gadolinium(III) chelates as MRI contrast agents: Structure, dynamics, and applications. Chem. Rev. 1999, 99, 2293–2352. [Google Scholar] [CrossRef]
  8. Lauffer, R.B. Paramagnetic metal complexes as water proton relaxation agents for NMR imaging: Theory and design. Chem. Rev. 1987, 87, 901–927. [Google Scholar] [CrossRef]
  9. Wang, J.; Huang, Y.; David, A.E.; Chertok, B.; Zhang, L.; Yu, F.; Yang, V.C. Magnetic nanoparticles for MRI of brain tumors. Curr. Pharm. Biotechnol. 2012, 13, 2403–2416. [Google Scholar] [CrossRef] [PubMed]
  10. Park, J.Y.; Baek, M.J.; Choi, E.S.; Woo, S.; Kim, J.H.; Kim, T.J.; Jung, J.C.; Chae, K.S.; Chang, Y.; Lee, G.H. Paramagnetic ultrasmall gadolinium oxide nanoparticles as advanced T1 MRI contrast agent: Account for large longitudinal relaxivity, optimal particle diameter, and in vivo T1 MR images. ACS Nano 2009, 3, 3663–3669. [Google Scholar] [CrossRef] [PubMed]
  11. Pan, D.; Schmieder, A.H.; Wickline, S.A.; Lanza, G.M. Manganese-based MRI contrast agents: Past, present, and future. Tetrahedron 2011, 67, 8431–8444. [Google Scholar] [CrossRef] [PubMed] [Green Version]
  12. Zhen, Z.; Xie, J. Development of manganese-based nanoparticles as contrast probes for magnetic resonance imaging. Theranostics 2012, 2, 45–54. [Google Scholar] [CrossRef] [PubMed]
  13. Sako, S.; Umemura, Y.; Ohshima, K.; Sakai, M.; Bandow, S. Magnetic property of antiferromagnetic MnO ultrafine-particle. J. Phys. Soc. Jpn. 1996, 65, 280–284. [Google Scholar] [CrossRef]
  14. Trohidou, K.N.; Zianni, X.; Blackman, J.A. Surface effects on the magnetic behaviour of antiferromagnetic particles. J. Appl. Phys. 1998, 84, 2795–2800. [Google Scholar] [CrossRef]
  15. Silva, A.C.; Lee, J.H.; Aoki, I.; Koretsky, A.P. Manganese-enhanced magnetic resonance imaging (MEMRI): Methodological and practical considerations. NMR Biomed. 2004, 17, 532–543. [Google Scholar] [CrossRef] [PubMed]
  16. Reddy, J.A.; Allagadda, V.M.; Leamon, C.P. Targeting therapeutic and imaging agents to folate receptor positive tumors. Curr. Pharm. Biotechnol. 2005, 6, 131–150. [Google Scholar] [CrossRef]
  17. Zhao, X.; Li, H.; Lee, R.J. Targeted drug delivery via folate receptors. Expert Opin. Drug Deliv. 2008, 5, 309–319. [Google Scholar] [CrossRef]
  18. Leamon, C.P.; Reddy, J.A. Folate-targeted chemotherapy. Adv. Drug Deliv. Rev. 2004, 56, 1127–1141. [Google Scholar] [CrossRef]
  19. Xia, W.; Low, P.S. Folate-targeted therapies for cancer. J. Med. Chem. 2010, 53, 6811–6824. [Google Scholar] [CrossRef] [PubMed]
  20. Chen, N.; Shao, C.; Qu, Y.; Li, S.; Gu, W.; Zheng, T.; Ye, L.; Yu, C. Folic acid-conjugated MnO nanoparticles as a T1 contrast agent for magnetic resonance imaging of tiny brain gliomas. ACS Appl. Mater. Interfaces 2014, 6, 19850–19857. [Google Scholar] [CrossRef]
  21. Rana, S.; Shetake, N.G.; Barick, K.C.; Pandey, B.N.; Salunke, H.G.; Hassan, P.A. Folic acid conjugated Fe3O4 magnetic nanoparticles for targeted delivery of doxorubicin. Dalton Trans. 2016, 45, 17401–17408. [Google Scholar] [CrossRef]
  22. Li, L.; Gao, F.; Jiang, W.; Wu, X.; Cai, Y.; Tangs, J.; Gao, X.; Gao, F. Folic acid-conjugated superparamagnetic iron oxide nanoparticles for tumor-targeting MR imaging. Drug Deliv. 2016, 23, 1726–1733. [Google Scholar] [CrossRef] [PubMed]
  23. Chauhan, R.P.; Mathur, R.; Singh, G.; Kaul, A.; Bag, N.; Singh, S.; Kumar, H.; Patra, M.; Mishra, A.K. Evaluation of folate conjugated superparamagnetic iron oxide nanoparticles for scintigraphic/magnetic resonance imaging. J. Biomed. Nanotechnol. 2013, 9, 323–334. [Google Scholar] [CrossRef] [PubMed]
  24. Quarta, A.; Curcio, A.; Kakwere, H.; Pellegrino, T. Polymer coated inorganic nanoparticles: Tailoring the nanocrystal surface for designing nanoprobes with biological implications. Nanoscale 2012, 4, 3319–3334. [Google Scholar] [CrossRef]
  25. Larson, N.; Ghandehari, H. Polymeric conjugates for drug delivery. Chem. Mater. 2012, 24, 840–853. [Google Scholar] [CrossRef] [Green Version]
  26. Lin, C.-L.; Lee, C.-F.; Chiu, W.-Y. Preparation and properties of poly(acrylic acid) oligomer stabilized superparamagnetic ferrofluid. J. Colloid Interface Sci. 2005, 291, 411–420. [Google Scholar] [CrossRef]
  27. Sanchez, L.M.; Martin, D.A.; Alvarez, V.A.; Gonzalez, J.S. Polyacrylic acid-coated iron oxide magnetic nanoparticles: The polymer molecular weight influence. Colloid Surf. A 2018, 543, 28–37. [Google Scholar] [CrossRef] [Green Version]
  28. Liufu, S.; Xiao, H.; Li, Y. Adsorption of poly(acrylic acid) onto the surface of titanium dioxide and the colloidal stability of aqueous suspension. J. Colloid Interface Sci. 2005, 281, 155–163. [Google Scholar] [CrossRef] [PubMed]
  29. Henoumont, C.; Laurent, S.; Elst, L.V. How to perform accurate and reliable measurements of longitudinal and transverse relaxation times of MRI contrast media in aqueous solutions. Contrast Media Mol. Imaging 2009, 4, 312–321. [Google Scholar] [CrossRef]
  30. Moore, T.E.; Ellis, M.; Selwood, P.W. Solid oxides and hydroxides of manganese. J. Am. Chem. Soc. 1950, 72, 856–866. [Google Scholar] [CrossRef]
  31. Mendive, C.B.; Bredow, T.; Blesa, M.A.; Bahnemann, D.W. ATR-FTIR measurements and quantum chemical calculations concerning the adsorption and photoreaction of oxalic acid on TiO2. Phys. Chem. Chem. Phys. 2006, 8, 3232–3247. [Google Scholar] [CrossRef]
  32. Daecon, G.B.; Philips, R.J. Relationships between the carbon-oxygen stretching frequencies of carboxylato complexes and the type of carboxylate coordination. Coord. Chem. Rev. 1980, 33, 227–250. [Google Scholar] [CrossRef]
  33. Benoit, D.N.; Zhu, H.; Lilierose, M.H.; Verm, R.A.; Ali, N.; Morrison, A.N.; Fortner, J.D.; Avendano, C.; Colvin, V.L. Measuring the grafting density of nanoparticles in solution by analytical ultracentrifugation and total organic carbon analysis. Anal. Chem. 2012, 84, 9238–9245. [Google Scholar] [CrossRef] [Green Version]
  34. Lide, D.R. CRC Handbook of Chemistry and Physics; Internet Version; CRC Press: Boca Raton, FL, USA, 2005; pp. 4–68. [Google Scholar]
  35. Baek, M.J.; Park, J.Y.; Xu, W.; Kattel, K.; Kim, H.G.; Lee, E.J.; Patel, A.K.; Lee, J.J.; Chang, Y.; Kim, T.J.; et al. Water-soluble MnO nanocolloid for a molecular T1 MR imaging: A facile one-pot synthesis, in vivo T1 MR images, and account for relaxivities. ACS Appl. Mater. Interfaces 2010, 2, 2949–2955. [Google Scholar] [CrossRef] [PubMed]
  36. Miao, X.; Ho, S.L.; Tegafaw, T.; Cha, H.; Chang, Y.; Oh, I.T.; Yaseen, A.M.; Marasini, S.; Ghazanfari, A.; Yue, H.; et al. Stable and non-toxic ultrasmall gadolinium oxide nanoparticle colloids (coating material = polyacrylic acid) as high-performance T1 magnetic resonance imaging contrast agents. RSC Adv. 2018, 8, 3189–3197. [Google Scholar] [CrossRef] [Green Version]
  37. Jang, Y.-J.; Liu, S.; Yue, H.; Park, J.A.; Cha, H.; Ho, S.L.; Marasini, S.; Ghazanfari, A.; Ahmad, M.Y.; Miao, X.; et al. Hydrophilic biocompatible poly(acrylic acid-co-maleic acid) polymer as a surface-coating ligand of ultrasmall Gd2O3 nanoparticles to obtain a high r1 value and T1 MR images. Diagnostics 2021, 11, 2. [Google Scholar] [CrossRef]
  38. Ahmad, M.Y.; Ahmad, M.W.; Yue, H.; Ho, S.L.; Park, J.A.; Jung, K.-H.; Cha, H.; Marasini, S.; Ghazanfari, A.; Liu, S.; et al. In vivo positive magnetic resonance imaging applications of poly(methyl vinyl ether-alt-maleic acid)-coated ultra-small paramagnetic gadolinium oxide nanoparticles. Molecules 2020, 25, 1159. [Google Scholar] [CrossRef] [PubMed] [Green Version]
  39. Shin, J.; Anisur, R.M.; Ko, M.K.; Im, G.H.; Lee, J.H.; Lee, I.S. Hollow manganese oxide nanoparticles as multifunctional agents for magnetic resonance imaging and drug delivery. Angew. Chem. Int. Ed. 2009, 48, 321–324. [Google Scholar] [CrossRef]
  40. Kim, T.; Momin, E.; Choi, J.; Yuan, K.; Zaidi, H.; Kim, J.; Park, M.; Lee, N.; McMahon, M.T.; Quinones-Hinojosa, A.; et al. Mesoporous silica-coated hollow manganese oxide nanoparticles as positive T1 contrast agents for labeling and MRI tracking of adipose derived mesenchymal stem cells. J. Am. Chem. Soc. 2011, 133, 2955–2961. [Google Scholar] [CrossRef] [PubMed]
  41. Huang, J.; Xie, J.; Chen, K.; Bu, L.; Lee, S.; Cheng, Z.; Li, X.; Chen, X. HSA coated MnO nanoparticles with prominent MRI contrast for tumor imaging. Chem. Commun. 2010, 46, 6684–6686. [Google Scholar] [CrossRef] [Green Version]
  42. Marfavi, Z.H.; Farhadi, M.; Jameie, S.B.; Zahmatkeshan, M.; Pirhajati, V.; Jameie, M. Glioblastoma U-87MG tumour cells suppressed by ZnO folic acid-conjugated nanoparticles: An in vitro study. Artif. Cells Nanomed. Biotechnol. 2019, 47, 2783–2790. [Google Scholar] [CrossRef] [PubMed]
Figure 1. Synthesis of folic acid-polyacrylic acid (FA-PAA) via three steps and the FA-PAA-coated manganese oxide (MnO) nanoparticles via one-step.
Applsci 11 02596 g001
Figure 2. (a-i) High-resolution transmission electron microscope (HRTEM) image (arrows indicate FA-PAA-coated MnO nanoparticles) and (a-ii) a magnified image of a nanoparticle indicated as a dotted circle in (a-i). (b) Particle diameter distribution. (c) Hydrodynamic diameter distribution.
Applsci 11 02596 g002
Figure 3. Photographs of (a-i) an aqueous nanoparticle dispersion sample (since preparation, no nanoparticle precipitation was observed for >1 year, proving the good nanoparticle colloidal stability) and those of dilute aqueous nanoparticle dispersion samples in the presence of 1.0 mM (a-ii) Ca2+ and (a-iii) Mg2+ ions (no nanoparticle precipitation occurred for 5 days, indicating no effects of these ions on the nanoparticle colloidal stability). (b) Zeta potential curve. (c) Tyndall effect showing laser light scattering through a laser path (labeled with an arrow) for the aqueous nanoparticle dispersion sample (right vial), whereas no such effect was observed in the triple-distilled water (left vial), confirming the colloidal dispersion.
Applsci 11 02596 g003
Figure 4. XRD patterns before and after thermogravimetric analysis (TGA). The post-TGA peaks were assigned with (hkl) Miller indices. “L”: cell constant of MnO.
Applsci 11 02596 g004
Figure 5. (a) FT-IR absorption spectra of the FA-PAA-coated MnO nanoparticles, FA, PAA, and FA-PAA. The subscripts, “AS”: Antisymmetric stretch and “SS”: Asymmetric stretch. (b) TGA curve.
Applsci 11 02596 g005
Figure 6. Mass-corrected magnetization versus the applied field (i.e., M‒H) curves (−2.0 T ≤ H ≤ 2.0 T) at T—100 and 300 K. The M values are the net M values of the MnO nanoparticles without FA-PAA (see text for details). The M‒H curve at T = 100 K was slightly noisy owing to the slight temperature instability of the instrument.
Applsci 11 02596 g006
Figure 7. Cell viabilities of NCTC1469 and DU145 cells for the FA-PAA-coated MnO nanoparticles, exhibiting very low toxicities of up to 200 μM Mn.
Applsci 11 02596 g007
Figure 8. (a) 1/T1 and 1/T2 plots versus the Mn-concentration. The r1 and r2 values were estimated from the corresponding slopes, respectively. (b) Dose-dependent contrast enhancements in R1 and R2 map images.
Applsci 11 02596 g008
Figure 9. (a) T1 magnetic resonance (MR) images before (pre = 0 h) and 4 h after intravenous administration. The dotted circles indicate the location of the brain cancer. Region-of-interest (ROI) at the brain cancer site and normal brain tissue (labeled with small dots and arrows). (b) Plots of SNR‒ROI versus time, where SNR is the signal-to-noise ratio.
Applsci 11 02596 g009
Figure 10. (a) Magnetic dipole‒dipole interactions between the Mn2+ (S = 5/2) species on the MnO nanoparticle surface and the water proton spins (s = 1/2), as indicated by the dotted lines. The FA-PAA ligands coating the nanoparticle surface were omitted for simplicity. (b) Stimulation of the longitudinal water proton spin relaxation from the β‒spin (mβ = −1/2) to α‒spin (m = 1/2) by the 3d-electron spins (S = 5/2) of Mn2+ (here, two stimulating Mn2+ species are arbitrarily shown).
Applsci 11 02596 g010
Table 1. Summarized properties of the FA-PAA-coated MnO nanoparticles.
Particle Dimension
(nm)
Surface-Coating AmountMagnetic PropertiesWater Proton Spin Relaxivity
(s−1mM−1)
davg 1aavg 2ξavg 3
(mV)
P 4
(wt%)
σ 5
(1/nm)
N 6MagnetismNet magnetization
(emu/g)
r1r2
100 K300 K
2.7 ± 0.122.2 ± 0.1−32.6 ± 0.444.60.614Paramagnetic3.21.19.3 ± 0.120.4 ± 0.4
1 davg: Average particle diameter. 2 aavg: Average hydrodynamic diameter. 3 ξavg: Average zeta potential. 4 P: Average surface-coating amount per nanoparticle in wt%. 5 σ: Average grafting density. 6 N: Average number of FA-PAA ligands coating a nanoparticle.
Table 2. Comparison of the r1 values of various MnO nanoparticles and metal-ion chelates.
CoreCoating Ligand or Chelatedavg
(nm)
r1
(s−1mM−1)
Applied Field
(T)
Ref.
MnO nanoparticlePEG 1-phospholipid200.213.0[39]
MnO nanoparticleMesoporous SiO2150.6511.7[40]
MnO nanoparticleHuman serum albumin25.21.977.0[41]
MnO nanoparticleFA-TETT 216.84.837.0[20]
MnO nanoparticleD-glucuronic acid2.57.021.5[35]
MnO nanoparticleFA-PAA 32.79.33.0This study
Mn2+ ionEDTA 4-2.90.47[8]
Gd3+ ionDTPA 5-4.10.47[8]
1 PEG: Poly(ethylene glycol). 2 FA-TETT: Folic acid conjugated N-(trimethoxysilylpropyl) ethylene diamine triacetic acid. 3 FA-PAA: Folic acid conjugated polyacrylic acid. 4 EDTA: Ethylenediaminetetraacetic acid. 5 DTPA: Diethylenetriaminepentaacetic acid.
Publisher’s Note: MDPI stays neutral with regard to jurisdictional claims in published maps and institutional affiliations.

