Article

Optimization of Machining Parameters in Milling Process of Inconel 718 under Surface Roughness Constraints

1
Department of Mechanical Engineering, National Chung Hsing University, Taichung City 402, Taiwan
2
Smart Machinery Center, Industrial Technology Research Institute, Taichung City 407, Taiwan
*
Author to whom correspondence should be addressed.
Appl. Sci. 2021, 11(5), 2137; https://doi.org/10.3390/app11052137
Submission received: 5 February 2021 / Revised: 19 February 2021 / Accepted: 25 February 2021 / Published: 28 February 2021
(This article belongs to the Special Issue Advanced Manufacturing Technologies and Their Applications)

Abstract

:
The objective of this research is to investigate the feasibility of utilizing the Elman neural network to predict the surface roughness in the milling process of Inconel 718 and then optimizing the cutting parameters through the particle swarm optimization (PSO) algorithm according to the different surface roughness requirements. The prediction of surface roughness includes the feature extraction of vibration measurements as well as the current signals, the feature selection using correlation analysis and the prediction of surface roughness through the Elman artificial neural network. Based on the prediction model of surface roughness, the cutting parameters were optimized in order to obtain the maximal feed rate according to different surface roughness constraints. The experiment results show that the surface roughness of Inconel 718 can be accurately predicted in the milling process and thereafter the optimal cutting parameter combination can be determined to accelerate the milling process.

1. Introduction

The material of Inconel 718 has been broadly used in manufacturing the components of aircraft and space vehicles in the aerospace industry. In the milling process of Inconel 718, the surface roughness is one of the important indicators to assess the work-piece quality. The surface roughness of work-piece is mainly influenced by the combinations of cutting parameters, tool machine vibrations, tool wearing and other external factors. In order to improve the surface condition of work-piece and enhance the manufacturing efficiency, the essential tasks involve the accurate prediction of surface roughness quantities as well as the optimization of the cutting parameter combinations.
The traditional studies indicated that the surface roughness of work-piece is dominated by the cutting speed, feed rate and cutting depth [1]. Therefore, the different combinations of cutting parameters were utilized to predict the surface roughness of work-piece in the machining process through the artificial neural network (ANN) and regression scheme [1,2]. As the concept of intelligent manufacturing was proposed, the vibration measurements of machining process were utilized to improve the prediction accuracy of surface roughness. Grzenda and Bustillo [3] presented a semisupervised approach to the development of roughness prediction models in the milling process. In their study, the vibration data are used in combination with the K-nearest Neighbors and random forest techniques to increase the accuracy of the prediction models. Alternatively, the classifier of support vector machine was employed to predict the surface roughness of aluminum plate during the end milling process through the feature sets that include the statistical parameters, FFT spectra and wavelet packets [4]. In addition, a prediction model based on energy consumption was proposed to estimate the surface roughness in turning operation [5]. The cutting energy consumption and cutting parameters were extracted as the inputs to the prediction model in their research. Ambhore et al. [6] conducted the research to develop the predictive model through evaluating the tool vibration acceleration and the surface roughness of AISI 52100 steel with different machining parameters. Their investigation indicated that the prediction of ANN is more accurate than the regression analysis. A series of artificial intelligence methods, including random forest, standard multilayer perceptrons, regression trees and radial-based functions, are tested to predict the surface roughness deviation through taking the tool wear into account [7].
Traditionally, the selection of cutting parameters in the machining process is mainly based on the Taguchi method. Camposeco-Negrete [8] presented a cutting parameter optimization approach to minimize the cutting energy consumption and surface roughness of AISI 6061 T6 during the turning operation through the Taguchi method. The results of the research work showed that the feed rate is the most significant factor for minimizing energy consumption and surface roughness. Owing to the rapid development of artificial intelligence techniques and optimization algorithms, several approaches have been applied to search the optimal combination of cutting parameters for different machining conditions. Mahdavinejad et al. [9] employed the multiperceptron ANN to build the surface roughness model and used the artificial immune algorithm to find the optimal parameters, including cutting velocity, feed per tooth and cutting depth, to minimize the surface roughness in the milling process of Ti-6Al-4V. Additionally, the particle swarm optimization (PSO) technique was utilized to find the optimal cutting parameters for minimizing the face milling time under the desired surface roughness values of aluminum work-piece based on the model that depicts the relationship among the cutting velocity, feed rate, cutting depth and surface roughness [10]. The multiobjective optimization approach was proposed to obtain the optimal combination of milling parameters for achieving minimum cutting power, surface roughness and maximum material removal rate through using the adaptive neuro fuzzy interface system combining the vibration and communication particle swarm optimization algorithm [11]. Alternatively, the genetic algorithm was also applied for optimizing the cutting parameters to reduce the energy consumption as well as the processing time [12]. Their study demonstrated that 32.07% of the consumed energy can be decreased and 34.11% of the processing time can be reduced. Ma et al. [13] conducted an experimental study for the optimization of the machining parameters in high-speed milling process of Inconel 718 based on chip variation. In order to maximize the material removal rate and to minimize the machining time as well as the surface roughness, the grey relational analysis was used for optimizing the output parameters on the turning of oil-hardened nonshrinking die steel [14].
By reviewing the previous literature of machining parameter optimization, the search of optimal cutting parameters was mainly achieved based on the assumed connection between the work-piece surface quality and the tooling parameters. However, the work-piece surface quality, such as the surface roughness, is partially influenced by the combinations of machining parameters and the tool machine vibration behaviors. Furthermore, due to the nature of cutting Inconel 718 work-piece, the factors, such as build-up-edge (BUE) phenomenon and rapid tool wearing, may also affect the surface quality during the cutting steps, and hence it makes the prediction of surface roughness more difficult in the manufacturing process.
To advance the state-of-art of cutting parameter optimization based on surface roughness prediction in this research, the characteristics of BUE phenomenon in cutting Inconel 718 were assumed to reflect on the vibration behaviors. The vibration measurements of spindle and fixture are investigated during the milling process of Inconel 718. On the other hand, the factor of tool wearing was simplified by computing the accumulated volume removal as well as the accumulated operation time for each cutter. The correlation between the roughness average (Ra) values of Inconel 718 work-piece and the vibration signals was analyzed to extract the vibration features. Owing to the nature of sequential milling process in this research, the signal features may be various in different milling stages. It is also well known that the Elman neural network has the characteristics of general recurrent neural network that accommodates the time-varying features of data series and has the outperformance of prediction [15]. Therefore, the Elman neural network was utilized to build the surface roughness prediction model of Inconel 718 in the milling process. Based on the prediction model, the cutting parameters were optimized through the PSO algorithm. In general, the feed rate is one of the factors dominating the Ra value of work-piece surface. The Ra value normally increases as increasing the feed rate under the condition of fixing the other parameters. Meanwhile, the cutting time consumption is determined by the feed rate. Based on this concept, the optimization scenario was set to maximize the feed rate under the different constraints of Ra values. Therefore, the optimal combination of cutting parameters can achieve acceleration of the tooling process for different surface quality requirements of Inconel 718 work-piece. For the purpose of further usage and reference, all the measurements, the corresponding Ra values and the cutting parameters utilized in this research article are available at the website [16].

2. Experiment and Measurements

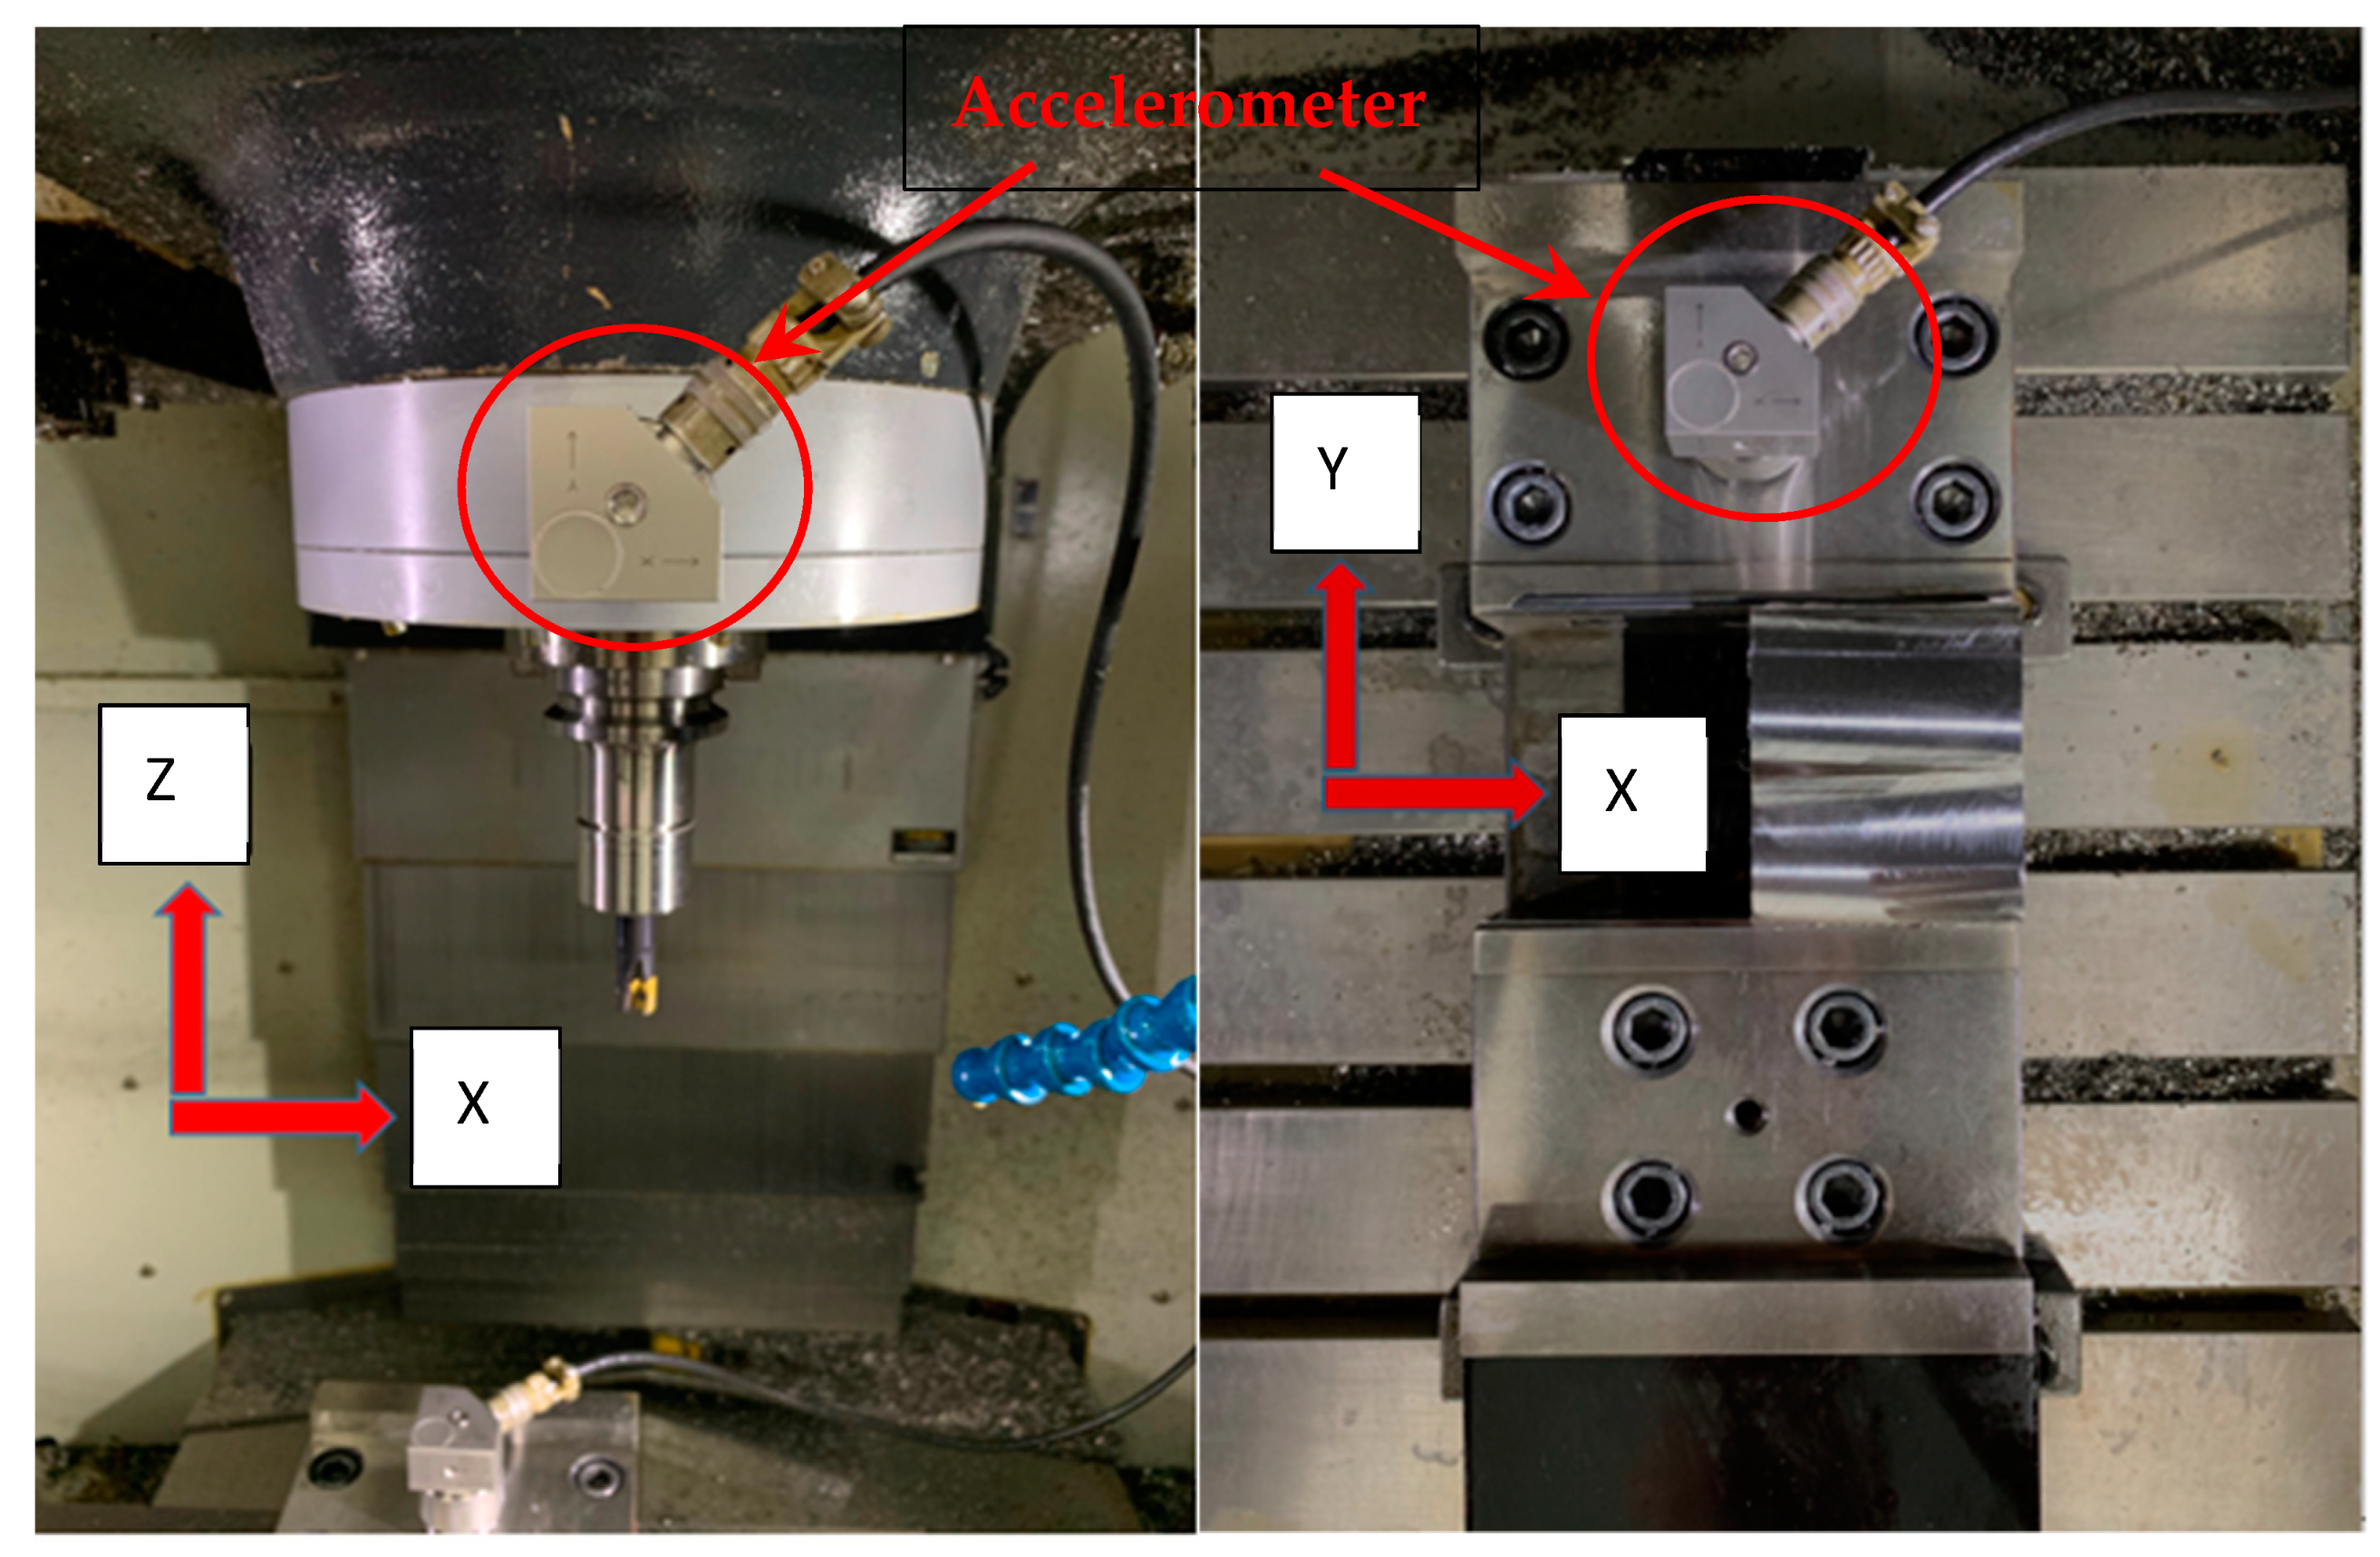
2.1. Experiment Setup

A milling machine (Awea Mechatronics, Hsinchu County, Taiwan, Type: A + 1020) was utilized to demonstrate the effectiveness of work-piece surface roughness prediction and cutting parameter optimization in this research. The Inconel 718 that has been used as the component material of gas turbine engine or rocket engine in the aerospace engineering field was selected as the work-piece material in the experiment. According to the material properties of work-piece, the TiAlN-PVD-coated carbide grade cutter (Kennametal Incorporation, Pittsburgh PA, USA, type: KC725M) was utilized in the milling machine. The specifications of the cutter are shown in Table 1.
As shown in Figure 1, two tri-axial accelerometers (PCB Piezotronics, Depew, NY, USA, type: 629A31) were stuck on the spindle and the vise, respectively to measure the vibration acceleration synchronously during the milling process. The vibration signals were discretized and recorded through the data acquisition module (National Instruments Corporation, Austin, TX, USA, type: NI9234) with the sampling frequency of 25.6 kHz. The slot milling process produced five straight routes on each block of Inconel 718 work-piece. The surface roughness measurement system (Kosaka Laboratory Limited, Tokyo, Japan, type: SE3500K) was utilized to detect the Ra value of each milling route on the work-piece. The current signals of the spindle were acquired synchronously through the Servo Guide system (Fanuc Corporation, Yamanashi Prefecture, Japan) in the spindle drive module with the sampling frequency of 2 kHz.
According to the parameter range suggested by the cutter manufacturing company, the cutting parameters were set in this experiment. Additionally, the accumulated volume removal of each cutter and the accumulated operation time of each cutter were estimated to simply represent the factor of tool wearing. All the cutting parameters as well as the associated accumulated volume removal and the accumulated operation time per cutter are shown in Table 2. The measured signals, the corresponding Ra values and the cutting parameters utilized in this research article are available at the website [16].

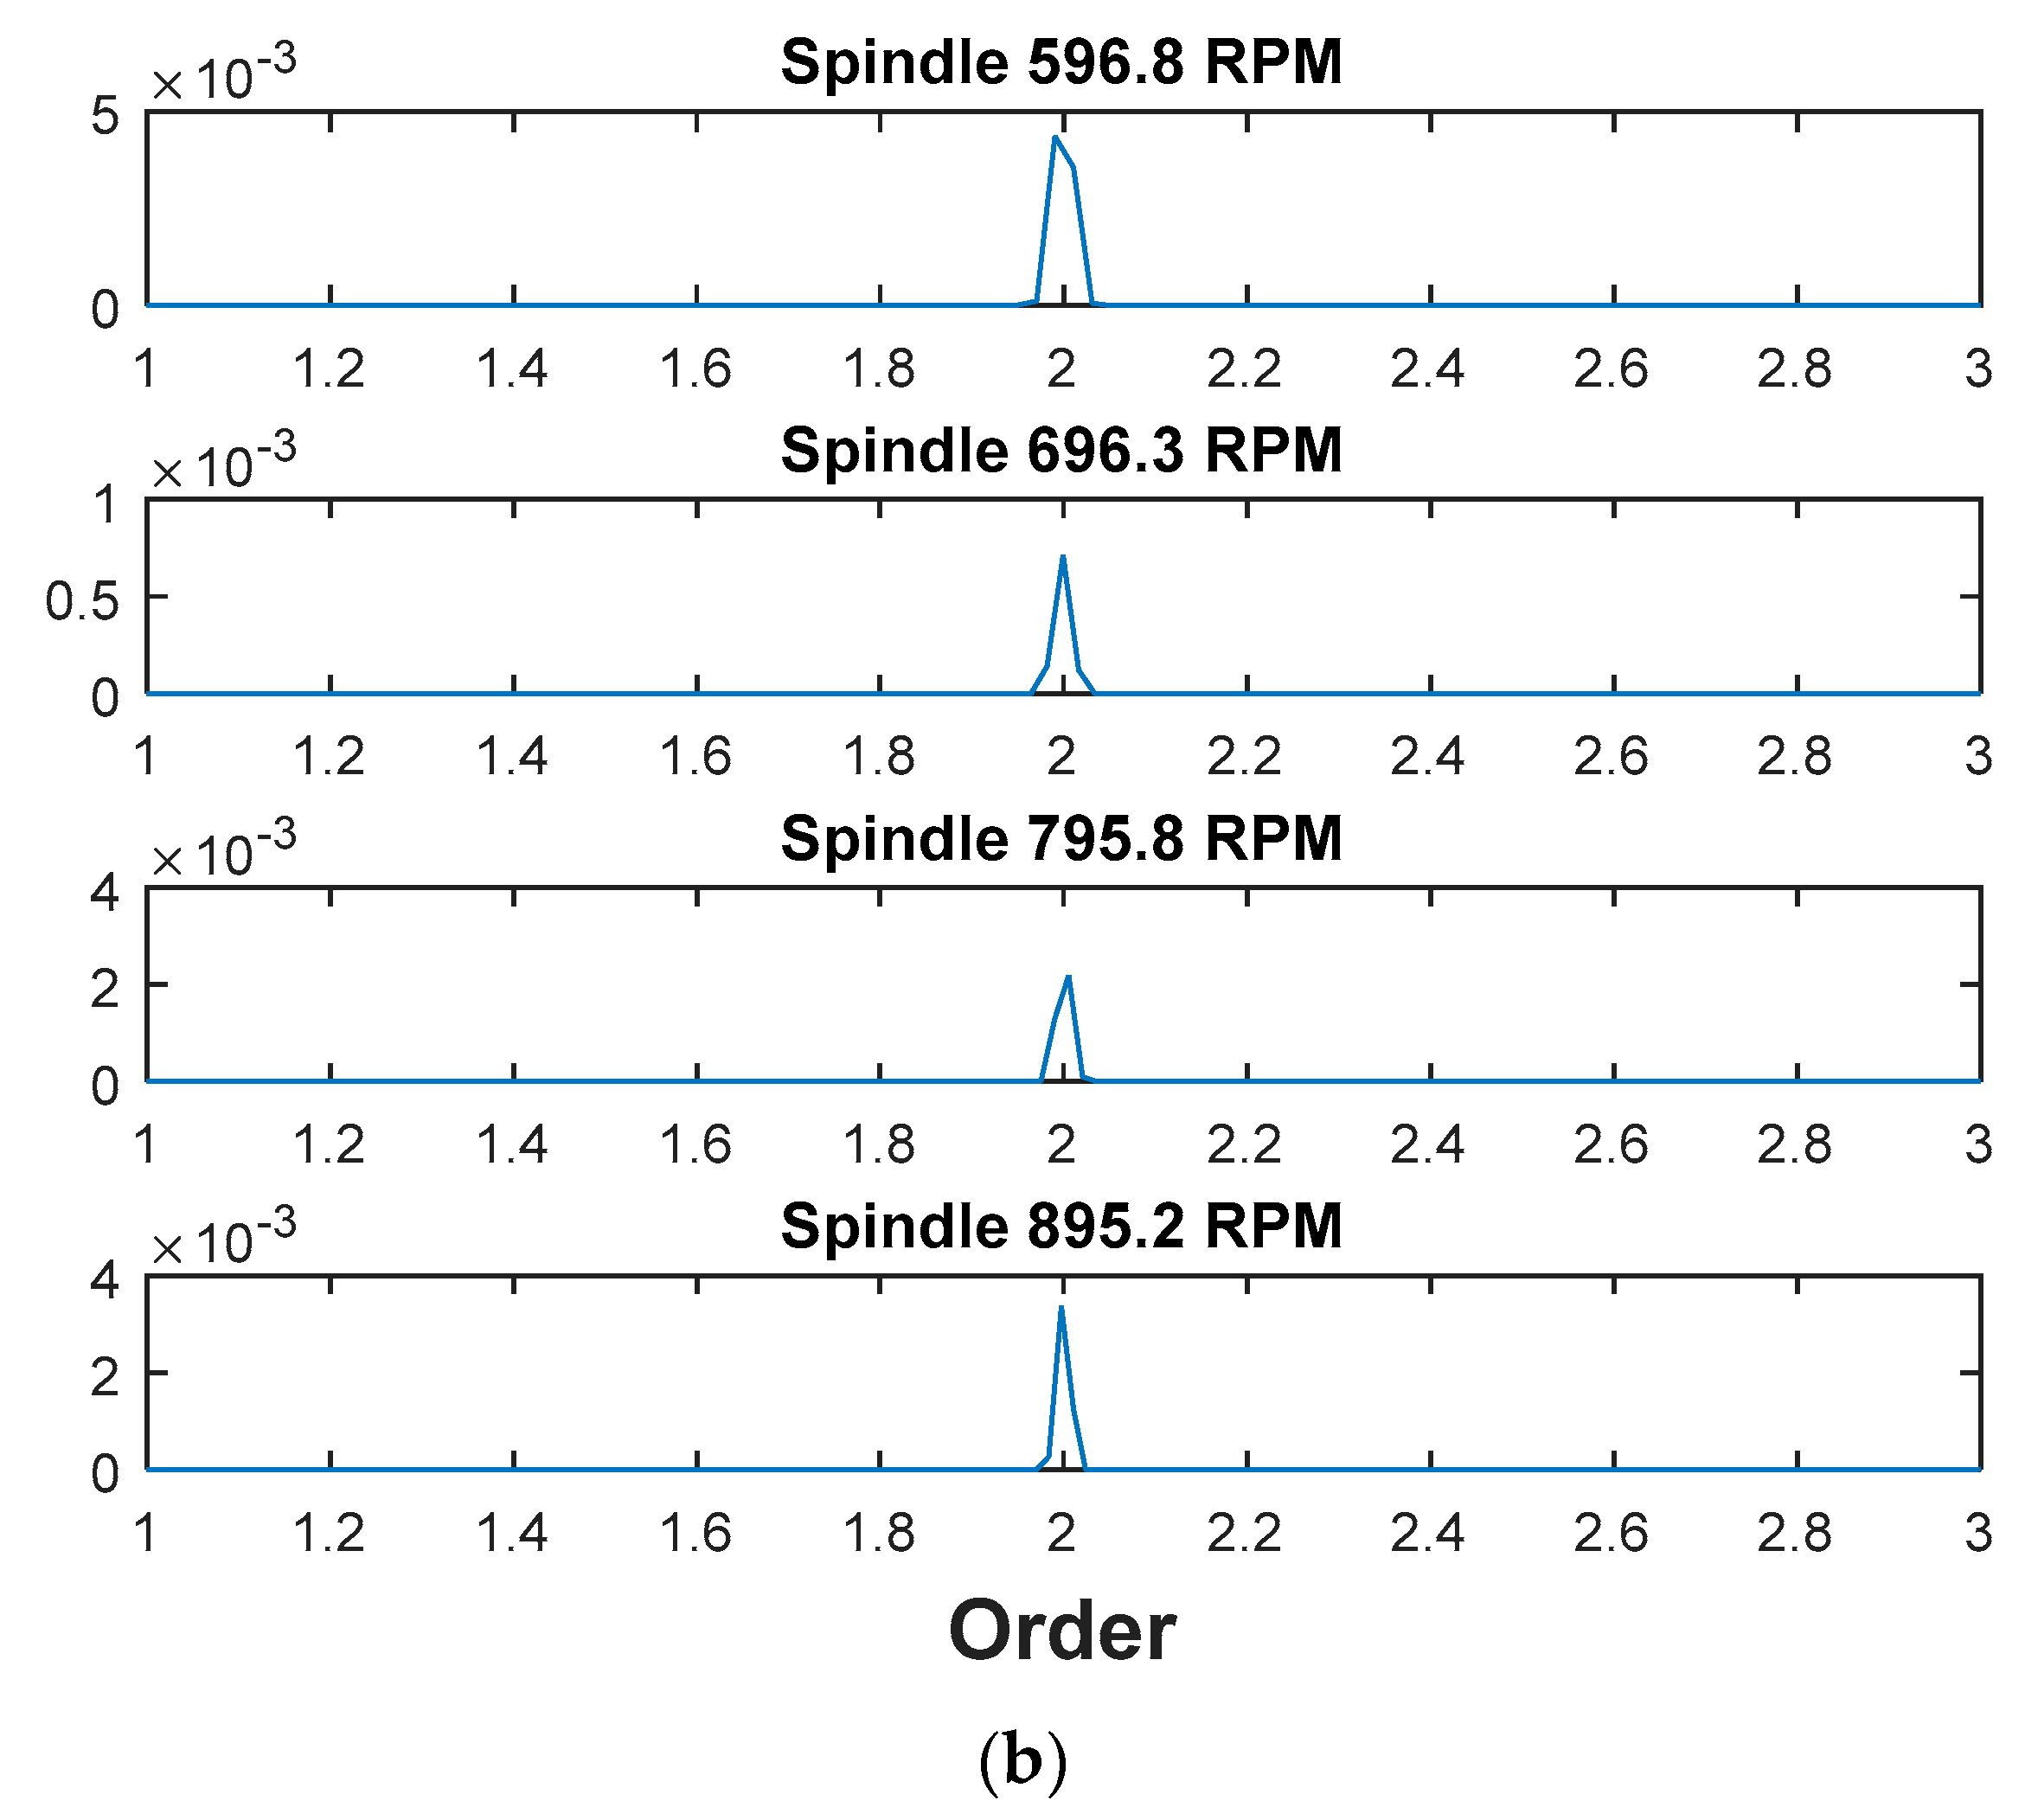
2.2. Signal Processing

In this experiment, the vibration accelerations at spindle and vise were measured in the three directions. The relative vibration accelerations between the spindle and the vise were also calculated. The current values of spindle were recorded synchronously during the cutting process. Since all the signals contain the measurements at different stages of milling process, such as idling, initial cutting, stable cutting and tool retracting, only the measured data of 14 s within the stable cutting were utilized for the steps of signal processing and feature extraction thereafter to enhance the surface roughness prediction of milling process.
In general, the vibration and current measurements may inevitably contain complicated composition at different frequencies, including the uncorrelated signal components, disturbances and noises. During the cutting process, the vibration behavior may present the nonstationary manners, such as amplitude/frequency modulation or intermittency, while the blades of cutter move forward and try to remove the material from work-piece. On the other hand, the spindle currents are normally varying with time because the servo control system of spindle tries to overcome the various cutting resistance and then keeps the spindle running at a constant rotation speed. Since the vibration measurements and current signals normally present the complicated nonstationary behaviors, all the time series signals were first separated through the empirical mode decomposition (EMD) method [17], which can be formulated as
x ( t ) = k = 1 m c k ( t ) + r m ( t )
where x(t) represents the measured complicated signal, ck(t) is the i-th intrinsic mode function (IMF) and rm(t) represents the signal residue or trend. Figure 2 illustrates the IMF1 to 16 of one of the vibration signals. According to the spindle speeds, the IMFs that contain the frequency components of two to four times of the spindle rotating frequencies were collected to synthesize the associated reconstructed signals. In such a way, the essential features related to the milling process can be reserved and those uncorrelated signal components, such as noise and signal trend, can be removed.
In the cutting process, the tool blades cyclically impact the work-piece and hence the vibration behaviors normally present periodically amplitude-modulation phenomenon in spindle and work-piece. Meanwhile, the spindle current signal may also reveal the amplitude modulation behavior since the cutter encounters the periodic resistance from the work-piece and hence the servo control system tries to make the spindle at a constant rotation speed through varying the current. Therefore, the envelope analysis is capable of demodulating the measurements and is one of the useful techniques to extract the signal features that are correlated to the amplitude modulation characteristics. The envelope of measurement can be determined by means of the analytical signal method. The complex analytical signal z(t) of measurement x(t) is computed through the Hilbert transform [17],
z ( t ) = x ( t ) + j H [ x ( t ) ] = A ( t ) e j ϕ ( t )
where x(t) is the measured signal, H[•] represents the Hilbert transform operator and A(t) is the envelope of signal x(t).
The reconstructed signals and their envelopes were then analyzed to extract the interior features. The FFT spectrum analysis was employed to extract the frequency-domain features of the reconstructed signals as well as their corresponding envelope signals. As indicated [18,19], the frequency-domain features include the spindle rotating speed-related ones and the spindle rotating speed-unrelated ones. The spindle rotating speed-unrelated features can be attributed to the machine structural vibrations as well as the external noises. As illustrated in Figure 3, the spectra of the vibration signals reveal that the vibration energy is concentrated at the same certain frequencies even though the spindle rotating frequencies are different. Therefore, the vibration energy levels at specific frequencies (such as 469–470 Hz) can be classified to the spindle rotating speed-unrelated features in frequency-domain.
On the other hand, the frequencies at which the signal energy is concentrated vary along with the spindle rotating speed, as shown in Figure 4a that illustrates the spectrum of a vibration signal set under different spindle rotating speed. The frequencies were then normalized by the spindle rotating frequency to obtain the order spectra as shown in Figure 4b. It is apparently observed that the spectral peak can be found at order-2 since there are two blades in one cutter, and thus the vibration energy concentration is noted at the frequency of two times the spindle rotating frequency, which is the tool passing frequency. Therefore, the vibration amplitude levels at the indicated orders represent the spindle rotating speed-related features in frequency-domain.
Besides the features in frequency-domain, the statistical quantities of the measured time series were computed to extract the features in time-domain. In this study, the time-domain features that were extracted from the measurements include the following quantities.
(1)
Multiscale entropy (MSE): the MSE was extensively applied to quantify the complexity or disorderliness of a time series [20]. Therefore, the sample entropy [21] was calculated to estimate the complexity of the measurement in different scales, which represent the dynamic features of the system [22].
(2)
Root-mean-square value (RMS): the RMS value is broadly employed to indicate the statistical mean amplitude of a time series.
(3)
Standard deviation (STD): the STD is generally to measure the amount of variation or dispersion of a time series.
(4)
Skewness: the skewness value is the measure of the extent to which a probability distribution of the time series leans to one side of mean.
(5)
Kurtosis: the kurtosis value describes the measure of tailedness of the distribution relative to the normal distribution (kurtosis value is 3).
(6)
Peak-to-peak value: the peak-to-peak value of a time series describes the change between the peak and valley in the data set, which indicates the range of oscillating data.
(7)
Crest factor (CF): the CF value is a parameter of waveform indicating the peak measurement that is normalized by the mean amplitude of the data set.
(8)
Coefficient of variation (CV): the CV value is a measure of the extent variability relative to the mean of the data set.

2.3. Correlation Analysis

The Ra values of all cutting routes on the work-piece were measured after the slot milling process was finished for each block of Inconel 718. The correlation analysis between the Ra values and extracted features were then applied for feature selection. Table 3, Table 4 and Table 5 show the Pearson correlation coefficients between the statistical features and the Ra values. It is noted from Table 3 that the entropy of vise vibration in X-direction has relatively high correlation (absolute value of correlation coefficient ≥ 0.4) with the Ra values within more scales than the other measurement points and directions. Additionally, Table 4 shows the observation that the statistical features of vibration signals have more correlation with respect to the Ra values in X-direction. It can be inferred that the cutting process of Inconel 718 consists of more essential vibration characteristics in X-direction due to reasons of the cutting resistance of Inconel 718 (material property) as well as the feeding direction. The result of correlation analysis for the spindle current (Table 5) depicts that the RMS, STD, peak-to-peak and CV values have more correlation coefficients with respect to the Ra values.
The correlation analysis in frequency-domain was also employed to the vibration signals and their corresponding envelope signals in three directions. As the aforementioned, the frequency-domain features include the rotation speed-related and unrelated features. In order to extract the rotation speed-unrelated features, the correlation coefficients were calculated to quantify the correlation between the power spectrum densities of vibration signals and the Ra values within 8 kHz. The correlation coefficients were also computed to assess the correlation between the corresponding envelope of vibration signals and the Ra values. To obtain the rotation speed-related features of vibration signals and their corresponding envelope signals, on the other hand, the correlation coefficients of their order spectra (normalized frequency by rotation speed) with respect to the Ra values were also computed from 0 to 100× orders. Additionally, the correlation coefficients among the Ra values and the power spectrum densities of spindle currents were calculated within the frequency range of 1 kHz as well.
The correlation analysis results in frequency-domain are illustrated in Figure 5 and Figure 6. Figure 5 shows the correlation coefficients among the Ra values and the power spectrum densities of the spindle vibration signals as well as their corresponding envelopes in three directions. The correlation coefficients of the order spectra of spindle vibration signals and their corresponding envelopes with respect to the Ra values are shown in Figure 6. It can be noted that the correlation coefficients of high value (absolute value ≥ 0.4) were computed at more frequencies/orders in vibration signals than in their corresponding envelopes. The results are reasonable since the frequency-domain characteristics reveal the information inside the vibration signal while the envelope signal represents the amplitude modulation behavior in time-domain.

3. Results and Discussion

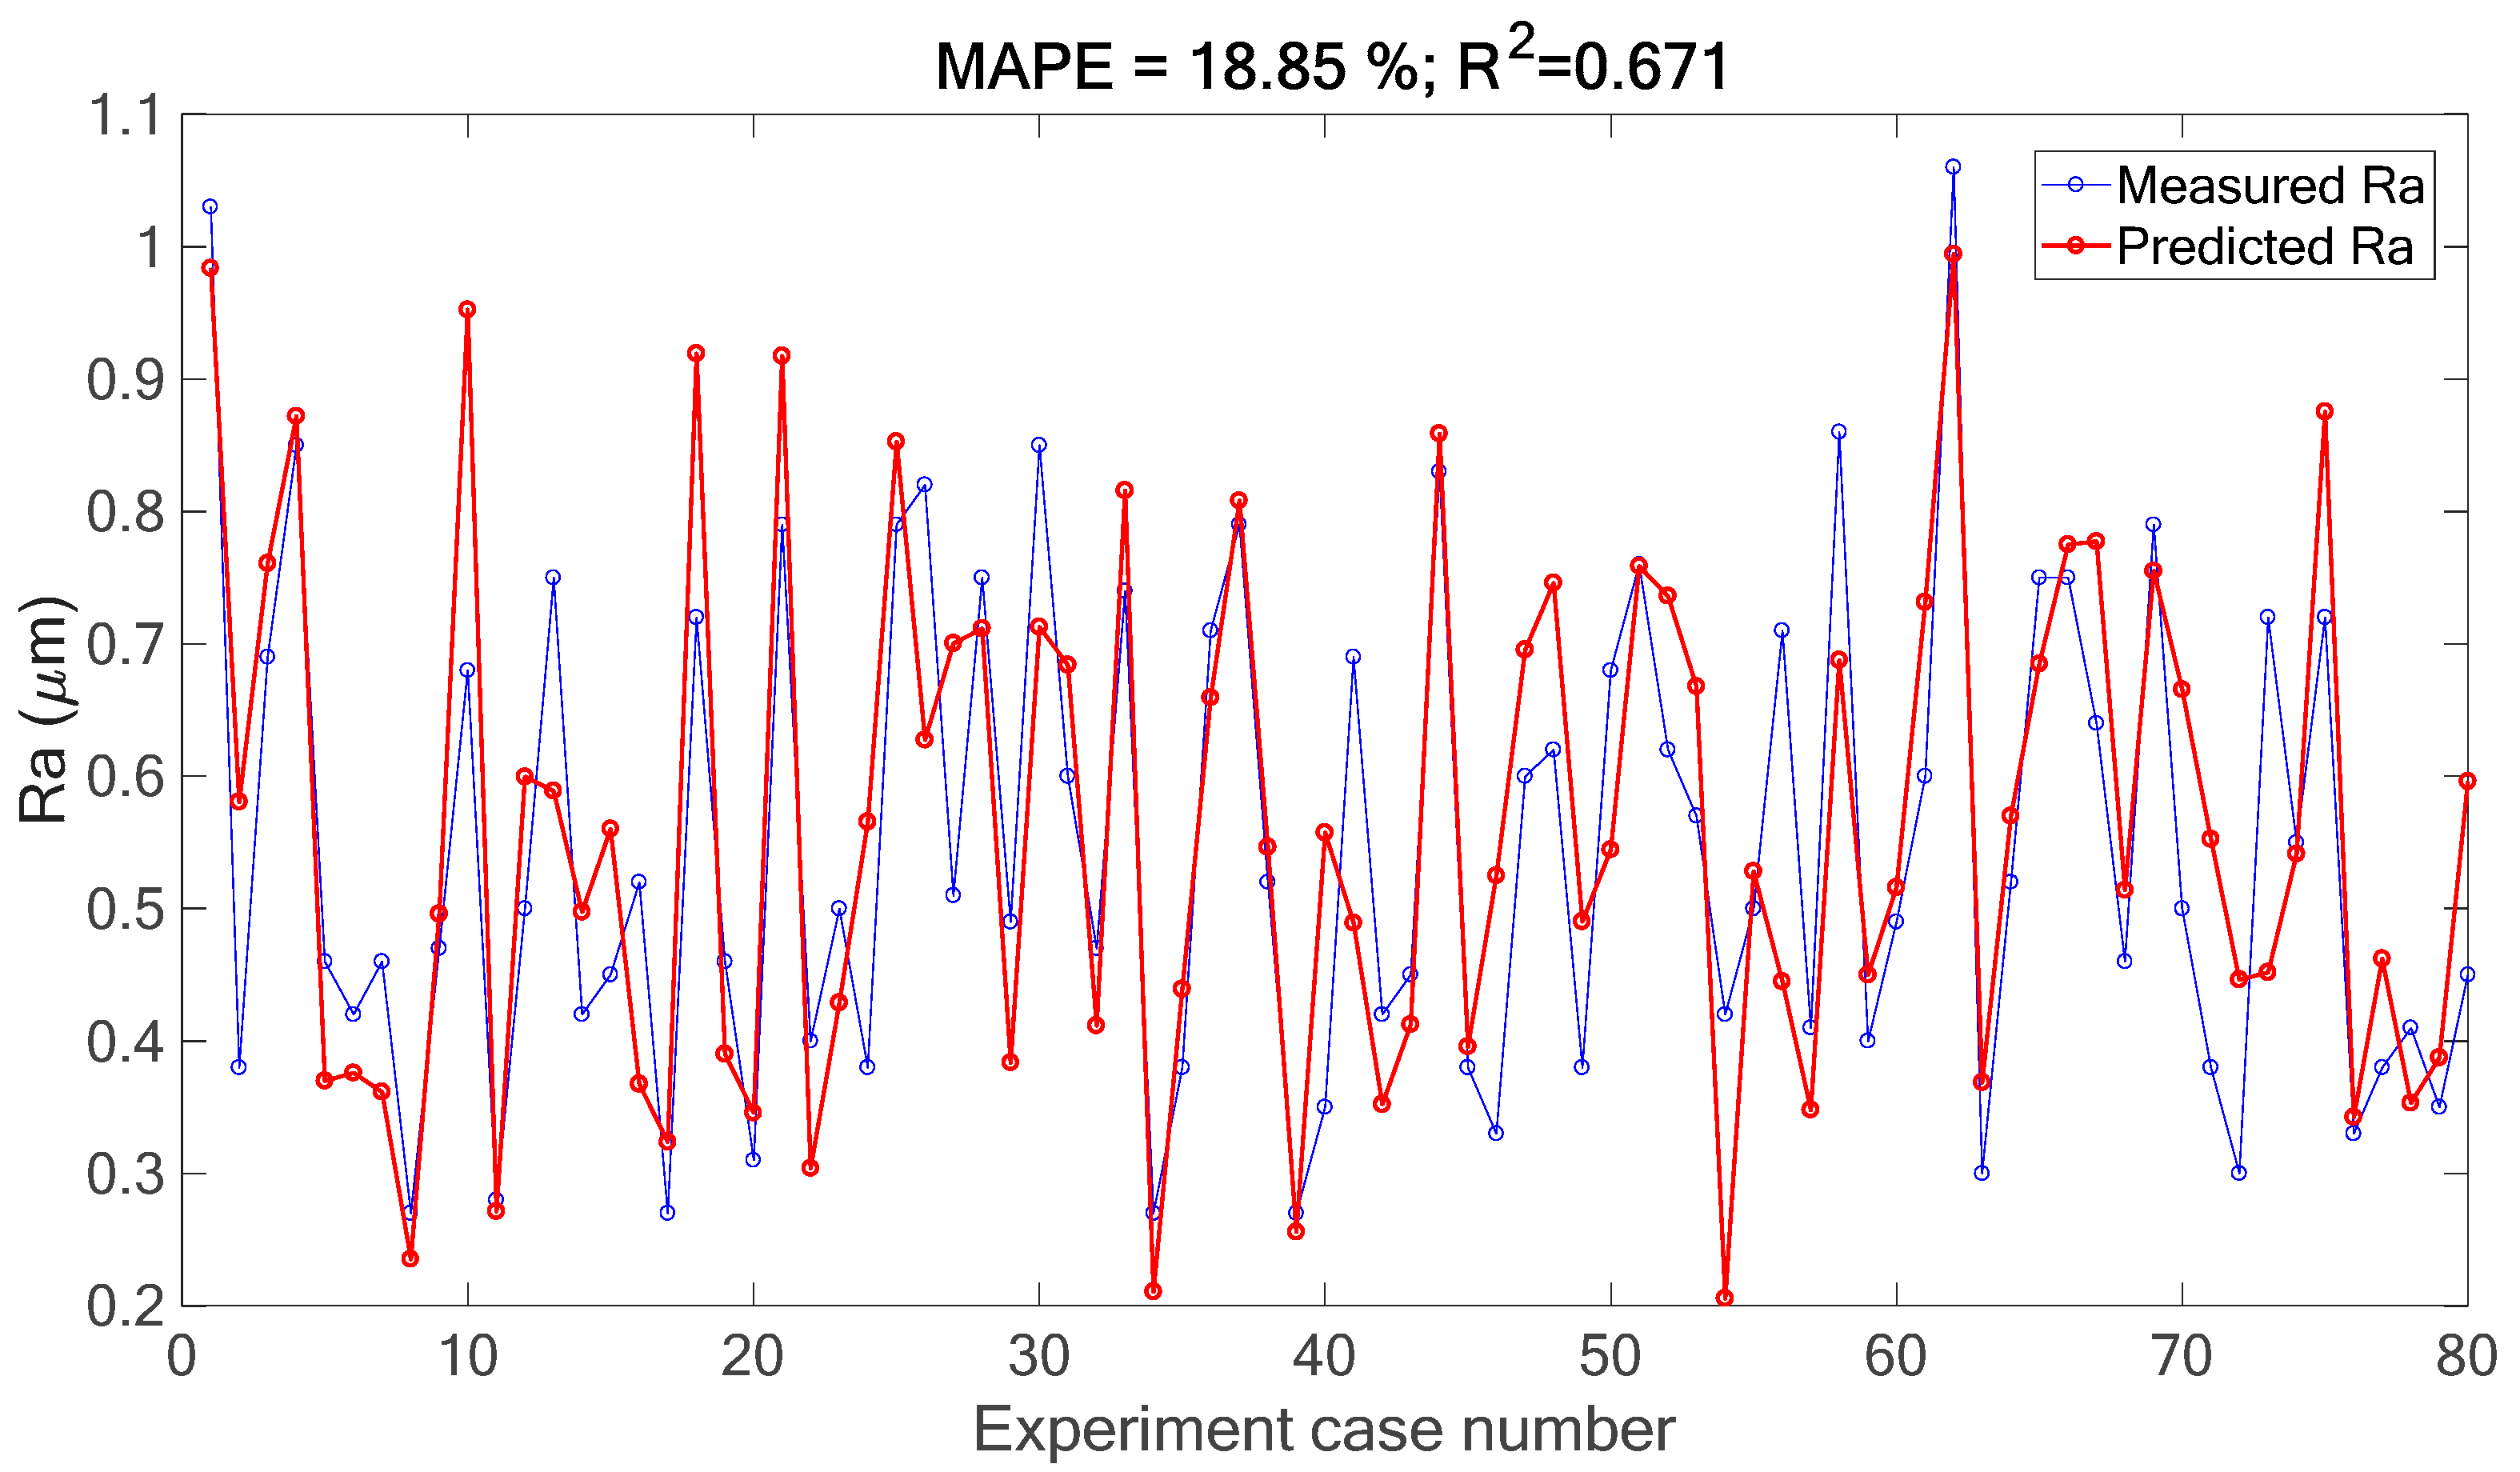
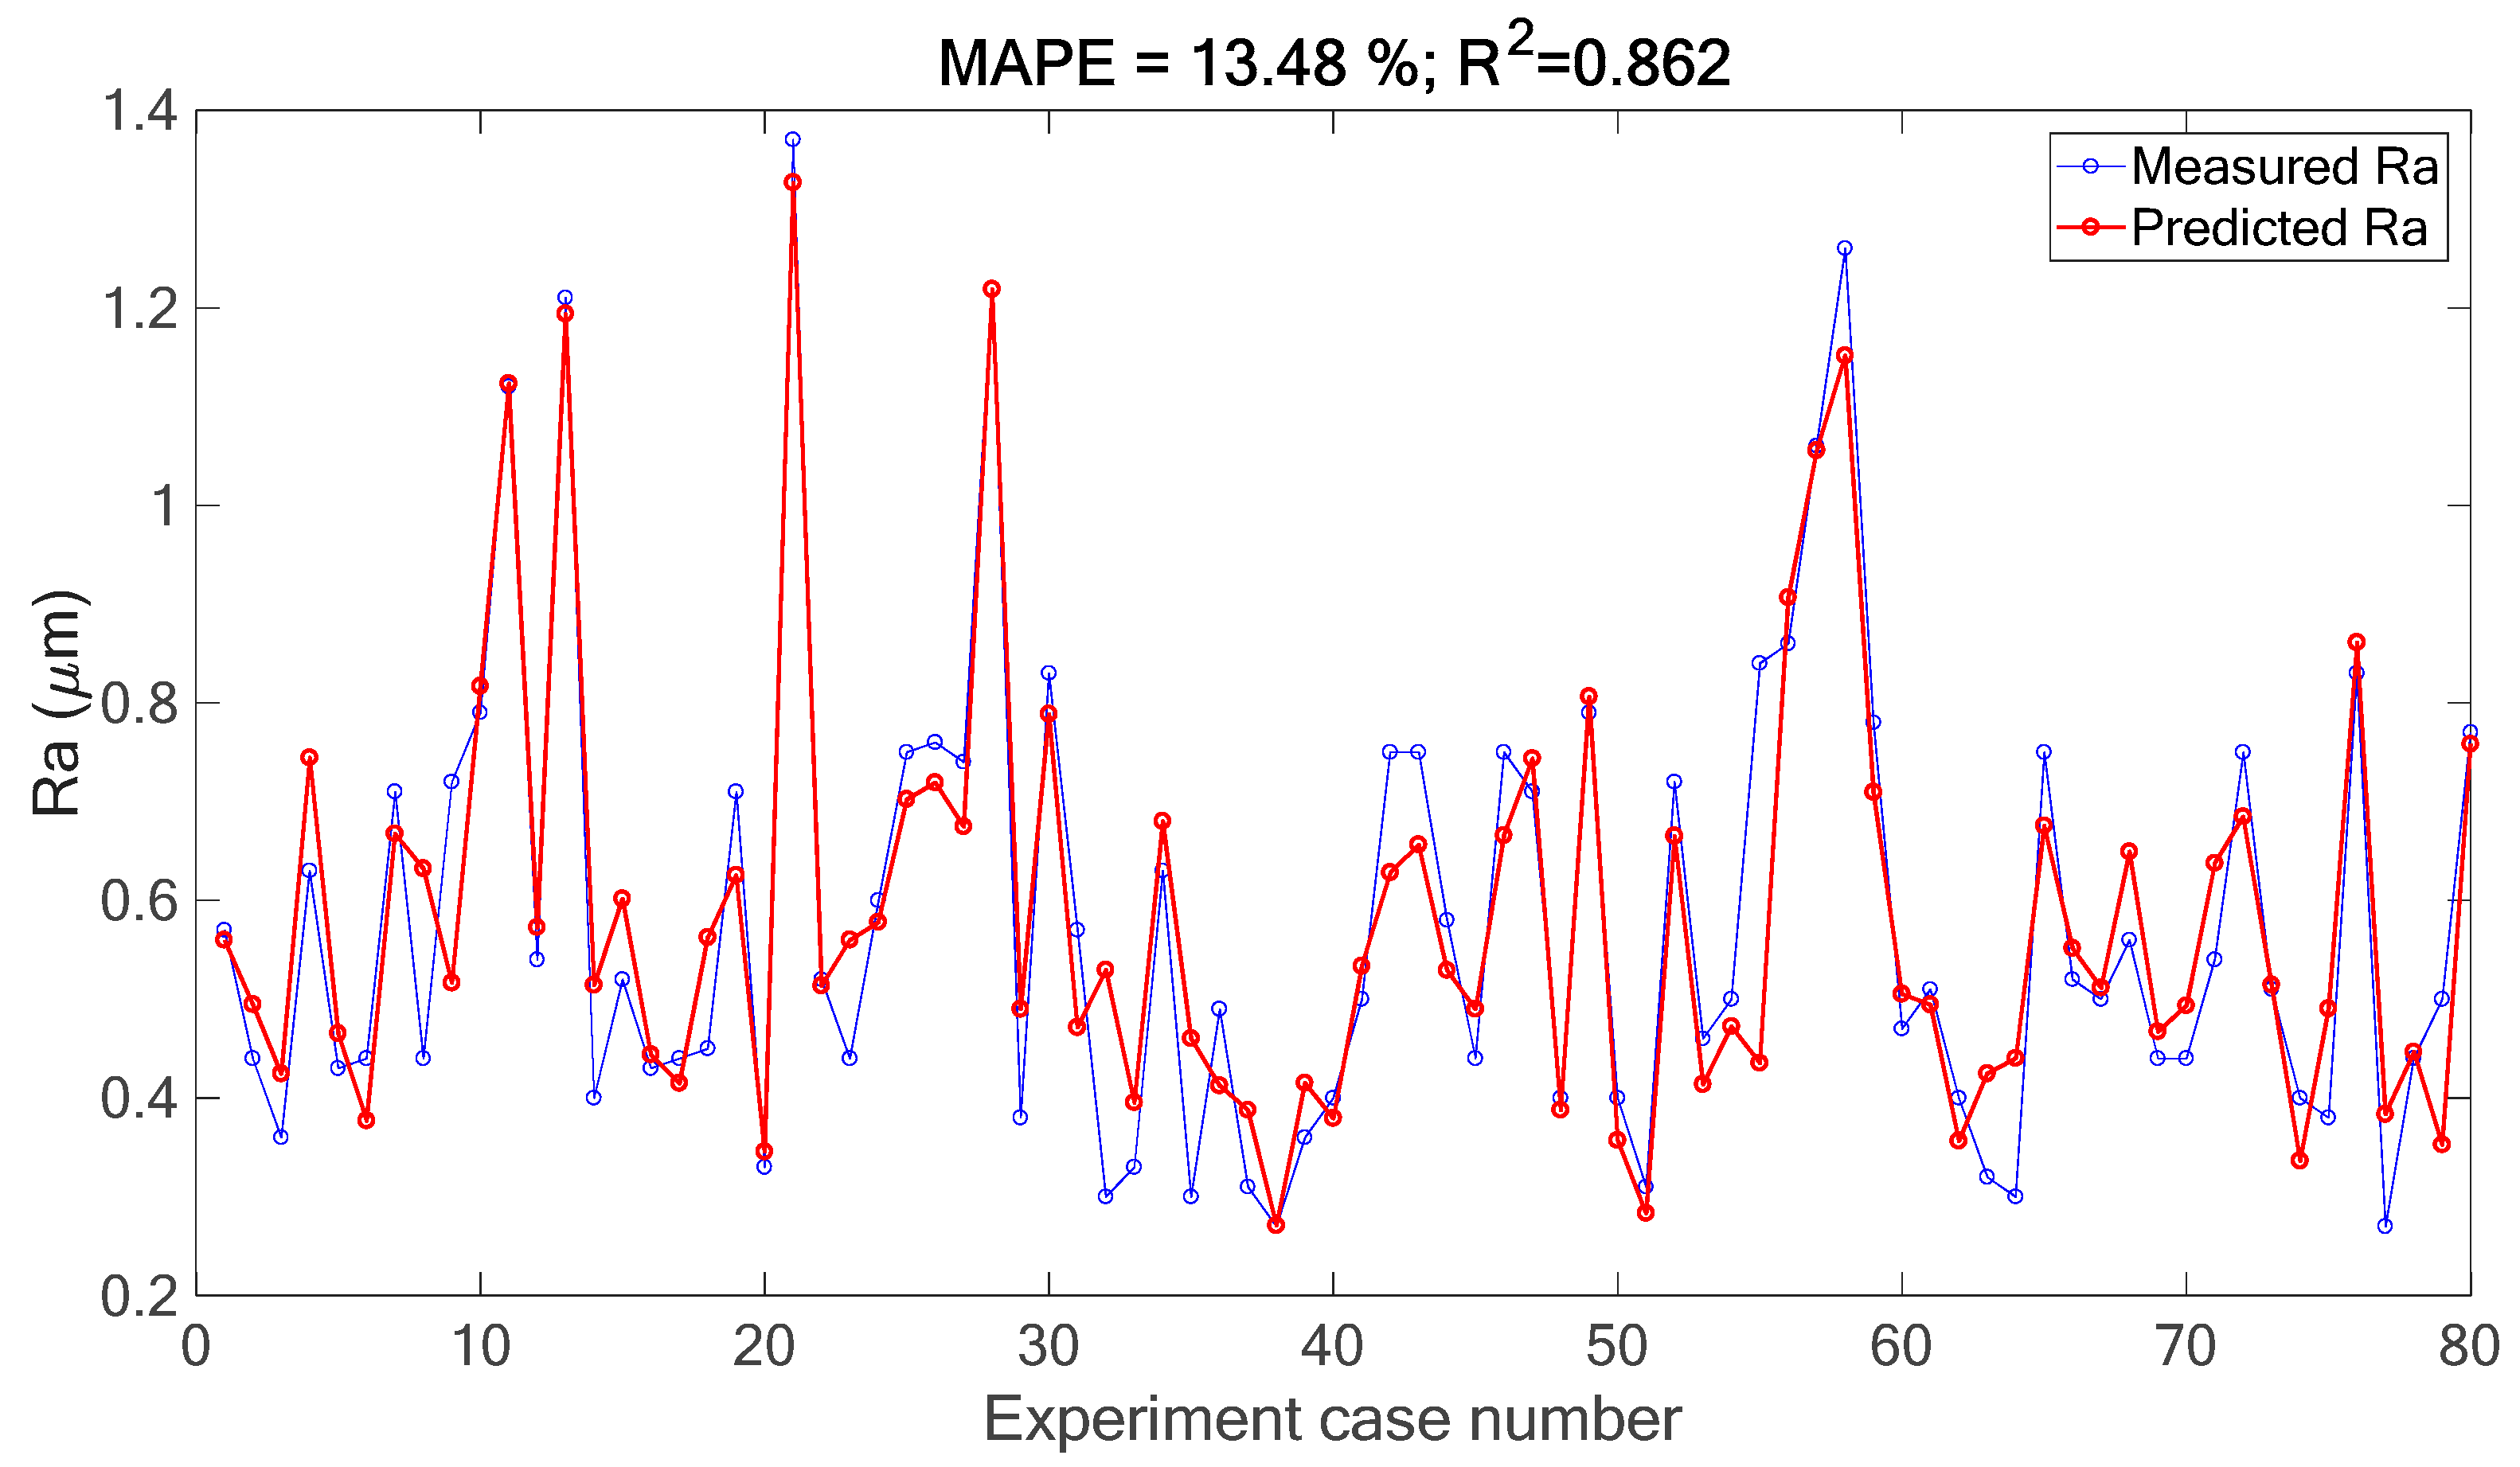
3.1. Surface Roughness Prediction Result

As the correlation analysis is processed, the features (including time-domain and frequency-domain) that have correlation coefficient of values higher than 0.4 (as shown in Table 3, Table 4 and Table 5 and Figure 5 and Figure 6) are selected as the input layer of the prediction model. In this research, the Elman neural network [15,23] was employed to form the prediction model of surface roughness during the milling process. Among the total of 116 measured data sets, 100 data sets were randomly collected to train the prediction model, and the remaining 16 data sets were utilized for testing. The training and testing steps were repeated for five rounds to execute the cross-validation. The prediction results of Elman neural network are presented in Figure 7. With the selected features of measured signals, it can be observed that the Ra values of Inconel 718 work-piece during the milling process can be predicted accurately. The predictive error was assessed to be 18.85% in terms of the mean absolute percentage error (MAPE) value in this case. On the other hand, the coefficient of determination (R2) of the predictive model is 0.671. Furthermore, the prediction accuracy can be enhanced to the MAPE value of 13.48% by combining the signal features and the cutting parameters (as shown in Table 2) as the input layer of Elman neural network, and the prediction result is shown in Figure 8. The R2 value is 0.862 in this case.

3.2. Cutting Parameter Optimization

Once the surface roughness prediction model was built and validated as stated in Section 3.1, the inverse model was utilized for the optimization of cutting parameters. The PSO algorithm [24] was applied to search for the optimal combinations of cutting parameters for different schemes. In this research, the cutting parameter optimization was based on the scenario that the feed rate is maximized to accelerate the milling process subjected to different Ra requirements. Therefore, the fitness function of the optimization process J(x) is formulated as
J ( x ) = f ( x ) α | R ( x ) R exp |
where f(x) represents the feed rate, R(x) represents the Ra prediction value, Rexp is the expected Ra value, and α represents the adjusting parameter for weighting the difference between the predicted and expected Ra values.
The cutting parameters’ range (values of lower and upper bounds) was set according to the tool manufacturer’s specifications as shown in Table 6 to constrain the searching boundary in the optimization process. As the aforementioned in [1], the surface roughness of work-piece is affected mainly by the cutting speed, feed rate and cutting depth. Furthermore, the clamping force amount of fixture changes the boundary conditions between the vise and work-piece and thus influences the vibration behaviors as well as hereafter the surface roughness of work-piece. In this research, the Ra values of Inconel 718 work-piece were classified to four levels (0.4, 0.6, 0.8 and 1.0 μm) to represent the different milling quality requirements. With the constraints of Ra values, the feed rate is maximized to decrease the consuming cutting time. Three sets of cutting parameter combinations were obtained as the optimization results of PSO algorithm as shown in Table 7. The selected optimal combinations of cutting parameters were then utilized for the experiment validation. Table 8 shows the experiment results through using the selected optimal combinations of cutting parameters. A reasonable result can be observed that the maximized feed rate has to be decreased apparently for achieving the requirements of fine surface conditions (Ra = 0.6 and 0.4 μm), as compared with the milling requirements of rough surface conditions (Ra = 1 and 0.8 μm). For the imprecise requirement of rougher surface quality (Ra = 1.0 and 0.8 μm), the factor of cutting depth does not affect the Ra value of Inconel 718 work-piece, and thus the optimal values of cutting speed and feed per tooth are set to the values of upper bound since the feed rate needs to be maximized. However, the cutting depth becomes one of the crucial factors for the strict requirement of finer surface quality (Ra = 0.4 and 0.6 μm), and therefore optimization process tried to search the parameters combination for achieving the maximal feed rate as well as the fine Ra restriction. Through the cutting parameter optimization, it is noted that the predicted Ra values of the Elman neural network are closed to the measured Ra values of actual milling process with the overall accurate MAPE value of 10.38%. Furthermore, the examination was carried out to verify that the feed rate is maximized by using the computed optimal combinations of cutting parameters. The verification result is shown in Table 9. The result indicates that the feed rates can be maximized by using the optimized cutting parameters for the required Ra values of 1, 0.8 and 0.6 μm since the feed rate errors are less than 1%, while the feed rate could be further accelerated by 24% for the required Ra value of 0.4 μm.

4. Conclusions

The surface roughness of Inconel 718 work-piece was accurately predicted in the milling process through the signal feature extraction techniques as well as the Elman neural network in this research. The well-trained surface roughness prediction model was utilized to optimize the cutting parameters through the PSO algorithm based on the scenario that the feed rate is maximized in case of different constraints of surface roughness requirements. The experiment results show that the surface roughness of Inconel 718 work-piece can be accurately predicted in the milling process by using the selected signal features as well as the cutting parameters. The Ra prediction was achieved through the Elman neural network model with the MAPE value of 13.48%. Meanwhile, the optimized cutting parameters were validated experimentally to demonstrate that the proposed method is feasible to accelerate the milling process under the different requirements of surface quality. With the optimal cutting parameter combinations, the measured Ra values are closed to the required Ra values with the overall accurate MAPE value of 10.38%. The required Ra values of 1, 0.8 and 0.6 μm can be achieved by the maximized feed rates that have the errors of less than 1%. The required Ra values of 0.4 μm can be achieved by the feed rate of 24% more speed.

Author Contributions

T.-Y.W. was in charge of the supervision in this research, including initiating the research project, conducting the experiment setup, advising the data analysis methods and final manuscript writing. C.-C.L. was in charge of the experiment implementation, vibration signal acquisition, signal analysis and parameters optimization. All the authors have approved the research contents that were written in the final manuscript. All authors have read and agreed to the published version of the manuscript.

Funding

This research was funded by the Ministry of Science and Technology in Taiwan, Republic of China, grant number MOST 108-2221-E-005-052 and MOST 109-2634-F-009-031.

Institutional Review Board Statement

Not applicable.

Informed Consent Statement

Not applicable.

Data Availability Statement

All the experiment data of this research are available at the website http://web.nchu.edu.tw/~tianyauwu/data/2020RA_optimal/2020RA_optimal.htm (accessed on 25 February 2021).

Conflicts of Interest

The authors declare no conflict of interest.

References

  1. Karayel, D. Prediction and control of surface roughness in CNC lathe using artificial neural network. J. Mater. Process. Technol. 2009, 209, 3125–3137. [Google Scholar] [CrossRef]
  2. Asiltürk, İ.; Çunkaş, M. Modeling and prediction of surface roughness in turning operations using artificial neural network and multiple regression method. Expert Syst. Appl. 2011, 38, 5826–5832. [Google Scholar] [CrossRef]
  3. Grzenda, M.; Bustillo, A. Semi-supervised roughness prediction with partly unlabeled vibration data streams. J. Intell. Manuf. 2019, 30, 933–945. [Google Scholar] [CrossRef]
  4. Abu-Mahfouz, I.; El Ariss, O.; Rahman, A.E.; Banerjee, A. Surface roughness prediction as a classification problem using support vector machine. Int. J. Adv. Manuf. Technol. 2017, 92, 803–815. [Google Scholar] [CrossRef]
  5. Xie, N.; Zhou, J.F.; Zheng, B.R. An energy-based modeling and prediction approach for surface roughness in turning. Int. J. Adv. Manuf. Technol. 2018, 96, 2293–2306. [Google Scholar] [CrossRef]
  6. Ambhore, N.; Kamble, D.; Chinchanikar, S. Evaluation of cutting tool vibration and surface roughness in hard turning of AISI 52100 steel: An experimental and ANN approach. J. Vib. Eng. Technol. 2020, 8, 455–462. [Google Scholar] [CrossRef]
  7. Pimenov, D.Y.; Bustillo, A.; Mikolajczyk, T. Artificial intelligence for automatic prediction of required surface roughness by monitoring wear on face mill teeth. J. Intell. Manuf. 2018, 29, 1045–1061. [Google Scholar] [CrossRef] [Green Version]
  8. Camposeco-Negrete, C. Optimization of cutting parameters for minimizing energy consumption in turning of AISI 6061 T6 using Taguchi methodology and ANOVA. J. Clean. Prod. 2013, 53, 195–203. [Google Scholar] [CrossRef]
  9. Mahdavinejad, R.A.; Khani, N.; Fakhrabadi, M.M.S. Optimization of milling parameters using artificial neural network and artificial immune system. J. Mech. Sci. Technol. 2012, 26, 4097–4104. [Google Scholar] [CrossRef]
  10. Raja, S.B.; Baskar, N. Application of Particle Swarm Optimization technique for achieving desired milled surface roughness in minimum machining time. Expert Syst. Appl. 2012, 39, 5982–5989. [Google Scholar] [CrossRef]
  11. Xu, L.H.; Huang, C.Z.; Li, C.W.; Wang, J.; Liu, H.L.; Wang X., D. Estimation of tool wear and optimization of cutting parameters based on novel ANFIS-PSO method toward intelligent machining. J. Intell. Manuf. 2020. [Google Scholar] [CrossRef]
  12. Deng, Z.H.; Zhang, H.; Fu, Y.H.; Wan, L.L.; Liu, W. Optimization of process parameters for minimum energy consumption based on cutting specific energy consumption. J. Clean. Prod. 2017, 166, 1407–1414. [Google Scholar] [CrossRef]
  13. Ma, J.W.; Wang, F.J.; Jia, Z.Y.; Gao, Y.Y. Machining parameter optimization in high-speed milling for Inconel 718 curved surface. Mater. Manuf. Process. 2016, 31, 1692–1699. [Google Scholar] [CrossRef]
  14. Dhilip, J.D.J.; Jeevan, J.; Arulkirubakaran, D.; Ramesh, M. Investigation and optimization of parameters for hard turning of OHNS steel. Mater. Manuf. Process. 2020, 35, 1113–1119. [Google Scholar] [CrossRef]
  15. Pradhan, M.K.; Das, R. Recurrent neural network estimation of material removal rate in electrical discharge machining of AISI D2 tool steel. Proc. Inst. Mech. Eng. Part B J. Eng. Manuf. 2011, 225, 414–421. [Google Scholar] [CrossRef]
  16. Measurements and Parameter Data. Available online: http://web.nchu.edu.tw/~tianyauwu/data/2020RA_optimal/2020RA_optimal.htm (accessed on 25 February 2021).
  17. Huang, N.E.; Shen, Z.; Long, S.R.; Wu, M.C.; Shih, H.H.; Zheng, Q.; Yen, N.C.; Tung, C.C.; Liu, H.H. The empirical mode decomposition and the Hilbert spectrum for nonlinear and non-stationary time series analysis. Proc. Roy. Soc. Lond. A 1998, 454, 903–995. [Google Scholar] [CrossRef]
  18. Chang, C.Y.; Wu, T.Y. Identification of milling status using vibration feature extraction techniques and support vector machine classifier. Inventions 2018, 3, 25. [Google Scholar] [CrossRef] [Green Version]
  19. Wu, T.Y.; Lei, K.W. Prediction of surface roughness in milling process using vibration signal analysis and artificial neural network. Int. J. Adv. Manuf. Technol. 2019, 102, 305–314. [Google Scholar] [CrossRef]
  20. Wu, S.D.; Wu, C.W.; Wu, T.Y.; Wang, C.C. Multi-scale analysis based ball bearing defect diagnostics using Mahalanobis distance and support vector machine. Entropy 2013, 15, 416–433. [Google Scholar] [CrossRef] [Green Version]
  21. Richman, J.S.; Moorman, J.R. Physiological time-series analysis using approximate entropy and sample entropy. Am. J. Physiol. Heart Circ. Physiol. 2000, 278, H2039–H2049. [Google Scholar] [CrossRef] [Green Version]
  22. Wu, T.Y.; Yu, C.L.; Liu, D.C. On multi-scale entropy analysis of order-tracking measurement for bearing fault diagnosis under variable speed. Entropy 2016, 18, 292. [Google Scholar] [CrossRef] [Green Version]
  23. Conde, A.; Arriandiaga, A.; Sanchez, J.A.; Portillo, E.; Plaza, S.; Cabanes, I. High-accuracy wire electrical discharge machining using artificial neural networks and optimization techniques. Robot. Comput. Integr. Manuf. 2020, 49, 24–38. [Google Scholar]
  24. Kennedy, J.; Eberhart, R.C. Particle swarm optimization. In Proceedings of the 1995 IEEE-International Conference on Neural Networks, Perth, WA, Australia, 27 November–1 December 1995; Volume 4, pp. 1942–1948. [Google Scholar]
Figure 1. Two tri-axial accelerometers on spindle (left) and vise (right).
Applsci 11 02137 g001
Figure 2. Illustration of vibration signal intrinsic mode functions (IMFs) through empirical mode decomposition (EMD).
Applsci 11 02137 g002
Figure 3. Illustration of spindle rotating speed-unrelated frequency-domain features: Spectrum of vibration signal under different spindle rotating speeds.
Applsci 11 02137 g003
Figure 4. Illustration of spindle rotating speed-related frequency-domain features: (a) Spectrum of vibration signal under different spindle rotating speeds; (b) Order spectrum of vibration signal under different spindle rotating speeds.
Applsci 11 02137 g004aApplsci 11 02137 g004b
Figure 5. Correlation coefficients among Ra values and power spectrum densities of spindle vibration signals as well as their corresponding envelopes in three directions.
Applsci 11 02137 g005
Figure 6. Correlation coefficients of order spectra of spindle vibration signals and their corresponding envelopes with respect to Ra values.
Applsci 11 02137 g006
Figure 7. Prediction results of Ra values through Elman neural network by using signal features.
Applsci 11 02137 g007
Figure 8. Prediction results of Ra values through Elman neural network by using signal features and cutting parameters.
Applsci 11 02137 g008
Table 1. Specifications of cutter.
Diameter (mm)16
Blade length (mm)11
Cutter length (mm)90
Number of blades2
Table 2. Cutting parameters, accumulated volume removal and operation time.
Cutting speed (m/min)30, 35, 40, 45
Feed per tooth (mm/tooth)0.05, 0.12, 0.18, 0.25
Cutting depth (mm)0.5, 0.8, 1.2, 1.5
Clamping force of vise (N)9807, 26,479, 45,112, 62,765
Accumulated volume removal per cutter (mm3)0–7584
Accumulated operation time per cutter (second)0–266.4
Table 3. Pearson correlation coefficients (absolute value ≥ 0.4) between multiscale entropy and the Ra values.
Spindle vibration X-axisScale67111213
Correlation coefficient0.420.410.440.440.42
Vise vibration X-axisScale78910111213141516171819
Correlation coefficient0.440.460.510.520.530.550.540.530.480.460.450.420.42
Relative vibration X-axisScale67
Correlation coefficient0.400.41
Table 4. Pearson correlation coefficients (absolute value ≥ 0.2) between the vibration statistical features and the Ra values.
Correlation CoefficientX-AxisY-AxisZ-Axis
SpindleVibration0.45 (RMS)
0.45(STD)
0.27(Skewness)
0.37(Peak-to-peak)
0.33(RMS)
0.33(STD)
−0.27(Kurtosis)
0.23(Peak-to-peak)
−0.23(CF)
0.28(RMS)
0.28(STD)
Envelope0.48(RMS)
0.44(STD)
0.27(Peak-to-peak)
0.36(RMS)
0.33(STD)
0.33(RMS)
0.30(STD)
ViseVibration0.20(RMS)
0.20(STD)
−0.24(Kurtosis)
−0.22(CF)
0.31(RMS)
0.31(STD)
−0.26(Kurtosis)
0.27(Peak-to-peak)
0.20(RMS)
0.20(STD)
−0.20(Kurtosis)
−0.21(CF)
Envelope0.21(RMS) −0.22(CF)
Relative vibrationVibration0.39(RMS)
0.39(STD)
0.35(Peak-to-peak)
0.35(RMS)
0.35(STD)
−0.28(Kurtosis)
0.25(Peak-to-peak)
−0.21(CF)
0.27(RMS)
0.27(STD)
0.22(Peak-to-peak)
Envelope0.43(RMS)
0.39(STD)
0.22(Peak-to-peak)
0.36(RMS)
0.31(STD)
0.23(RMS)
Table 5. Pearson correlation coefficients between the statistical features of spindle current and the Ra values.
Spindle Current FeaturesCorrelation Coefficient
RMS0.55
STD0.64
Skewness−0.1
Kurtosis0.38
Peak-to-peak0.6
CF0.48
CV0.6
Table 6. Cutting parameters range.
Cutting ParameterLower BoundUpper Bound
Cutting speed (m/min)3045
Feed per tooth (mm/tooth)0.050.25
Cutting depth (mm)0.51.5
Clamping force of vise (N)980762,765
Table 7. Optimal cutting parameter combinations from particle swarm optimization (PSO) algorithm.
Expected Ra (μm)Cutting Speed (m/min)Feed Per Tooth (mm/tooth)Cutting Depth (mm)Clamping Force of Vise (N)Feed Rate (mm/min)Predicted Ra (μm)
1.045.000.251.329807447.621.00
45.000.250.879807447.621.00
45.000.250.759807447.621.00
0.845.000.250.5026,479447.620.75
45.000.251.2962,765447.620.75
45.000.251.5045,112447.620.74
0.644.760.221.4762,765384.680.58
45.000.221.3345,112393.910.60
45.000.231.5045,112409.040.60
0.430.000.050.50980759.680.39
33.830.071.1062,76593.720.31
30.000.090.5062,765108.710.28
Table 8. Experiment results by using the selected optimal combinations of cutting parameters.
Expected Ra (μm)Feed Rate (mm/min)Predicted Ra (μm)Measured Ra (μm)Error (%)
1447.621.000.93−7.00
447.621.001.1919.00
447.621.001.055.00
0.8447.620.750.783.45
447.620.750.73−2.67
447.620.740.73−1.35
0.6384.680.580.55−5.17
393.910.600.635.00
409.040.600.646.67
0.459.680.390.34−13.49
93.720.310.3925.00
108.710.280.3730.74
MAPE: 10.38%
Table 9. Verification of experimental result for feed rate maximization.
Expected Ra (μm)Maximum Feed Rate in Experiment (mm/min)
1447.62
0.8447.62
0.6387.89
0.4143.24
Publisher’s Note: MDPI stays neutral with regard to jurisdictional claims in published maps and institutional affiliations.

