Article

Preparation of Synthetic Titania Slag Relevant to the Industrial Smelting Process Using an Induction Furnace

1
Process Metallurgy Research Unit, University of Oulu, P.O. Box 4300, FI-90014, 90570 Oulu, Finland
2
Metso Outotec Research Center, Kuparitie 10, 28330 Pori, Finland
3
Nano and Molecular Systems Research Unit, University of Oulu, P.O. Box 4300, FI-90014, 90570 Oulu, Finland
*
Author to whom correspondence should be addressed.
Appl. Sci. 2021, 11(3), 1153; https://doi.org/10.3390/app11031153
Submission received: 31 December 2020 / Revised: 20 January 2021 / Accepted: 25 January 2021 / Published: 27 January 2021
(This article belongs to the Special Issue Imaging and Characterization of Applied Materials)

Abstract

:
A high titania slag that is used as a feedstock for TiO2 manufacturing is obtained by ilmenite smelting (FeO.TiO2). The composition of the slag obtained by smelting is dependent on the composition of the mineral used for slag preparation, i.e., ilmenite in our study. At the laboratory scale, ilmenite slags are mostly obtained by using ilmenite as the raw material. An easy and simple way would be to prepare the synthetic slag using the individual components and heating them to high temperature in a furnace. The titania slag has a high oxidizing nature and requires an inert atmosphere to prevent oxidation of the slag as well as the molybdenum crucible. This paper describes the preparation of synthetic ilmenite slag using an induction furnace and the study of the composition and the phases formed in the slag. X-ray powder diffraction (XRD), scanning electron microscopy (SEM), and inductively coupled plasma-optical emission spectroscopy (ICP-OES) were used as analytical techniques for studying the slag. A comparison between obtained synthetic slag and industrial ilmenite slag was performed to test the possibility of preparing slags in the laboratory as per the required composition. The slags show similar phase formation as obtained in industrial ilmenite slags, which means that the synthetic slags are identical to the industrial slags.

1. Introduction

Ilmenite with a composition of FeO.TiO2 is one of the major sources of titanium metal and titanium dioxide, which is used as a pigment in paints, cosmetics, plastics, rubber, and textiles [1,2,3]. To produce titanium dioxide, the ilmenite feed is first upgraded to a titanium oxide product [4,5]. From the upgraded product, TiO2 is commercially produced either by the sulfate or chloride route [6,7]. The sulfate route, though it can use lower grade ores, is generally expensive and less environmentally friendly, whereas the chloride route is limited to high-grade feedstocks as the impurities can affect the stability of the fluidized bed [8]. The up-gradation of ilmenite is performed by carbothermic reduction to remove iron oxide. It can be conducted either by solid-state reduction at around 1200 °C, where synthetic rutile is produced or in a fully liquid state above 1600 °C where a high titania slag is produced with pig iron as a by-product [9,10,11]. In the smelting of ilmenite, the iron oxide in ilmenite is reduced by a suitable carbonaceous reductant to metallic iron, resulting in a high titania slag containing 75–95% TiO2, of which slags with titania content above 85% are used for the chloride route and others for the sulfate route [12]. The reductant used is a carbonaceous material, such as anthracite, petroleum coke, metallurgical coke, etc. [13]. The smelting process of ilmenite is an unusual case where slag is the primary product, and the by-product is a valuable raw material to get pig iron and other metallic components [14,15].
The titania slag forms a single phase with a stoichiometry of M3O5 [16] and is a molten mixture of Ti3O5, FeTi2O5, MnTi2O5, Al2TiO5, MgTi2O5, V2TiO5, and Cr2TiO5. M3O5 is a solid solution, which is called pseudobrookite, and is present in major quantities in the slag with a small amount of rutile and ilmenite [17,18,19]. Pseudobrookite is only formed when the reduction of ilmenite happens at a temperature f more than 1200 °C, below which rutile and ilmenite are the dominant phases [20,21].
The trivalent cations in the slag are easily oxidized if the slag comes into contact with oxygen or any oxidizer and the oxidation reaction is highly exothermic [22,23]. As the slag is very easily oxidized, an inert gas (such as Ar) is used when the slag is produced in the laboratory to prevent oxidation. The impurities in ilmenite, such as CaO, MgO, Al2O3, SiO2, and MnO2, are carried into the slag and can affect the slag if present in large quantities [24]. However, most of the ilmenite ores have a concentration of the impurities in quantities that do not affect the slag formation or its properties significantly.
Pesl and Eric [25] produced synthetic slag for preparing ternary diagrams using TiO2, Ti2O3, Fe, and Fe2O3 but without any other impurities. No further data were found in the literature where the liquid slag phase boundary was measured using saturation experiments. Pesl and Eric [25] investigated the slag model to assess the slag condition based on the ternary diagram. In the present work, several impurities will be used to replicate the industrial slag system. Such slag samples can be utilized to prepare calibration curves using various spectroscopic techniques, thus improving the accuracy of the system. In this paper, the phase study of synthetic ilmenite slags that were prepared in an induction furnace under a controlled argon atmosphere is reported. A phase study is carried out to determine the phases that are formed and to verify their similarity with the industrial slag. M3O5 slag composition is a characteristic for ilmenite slags, and the effect of the quantity of various components on the phases formed are studied. The studied method provides an alternative way to make synthetic slags, which is cheaper and easy to prepare.

2. Materials and Methods

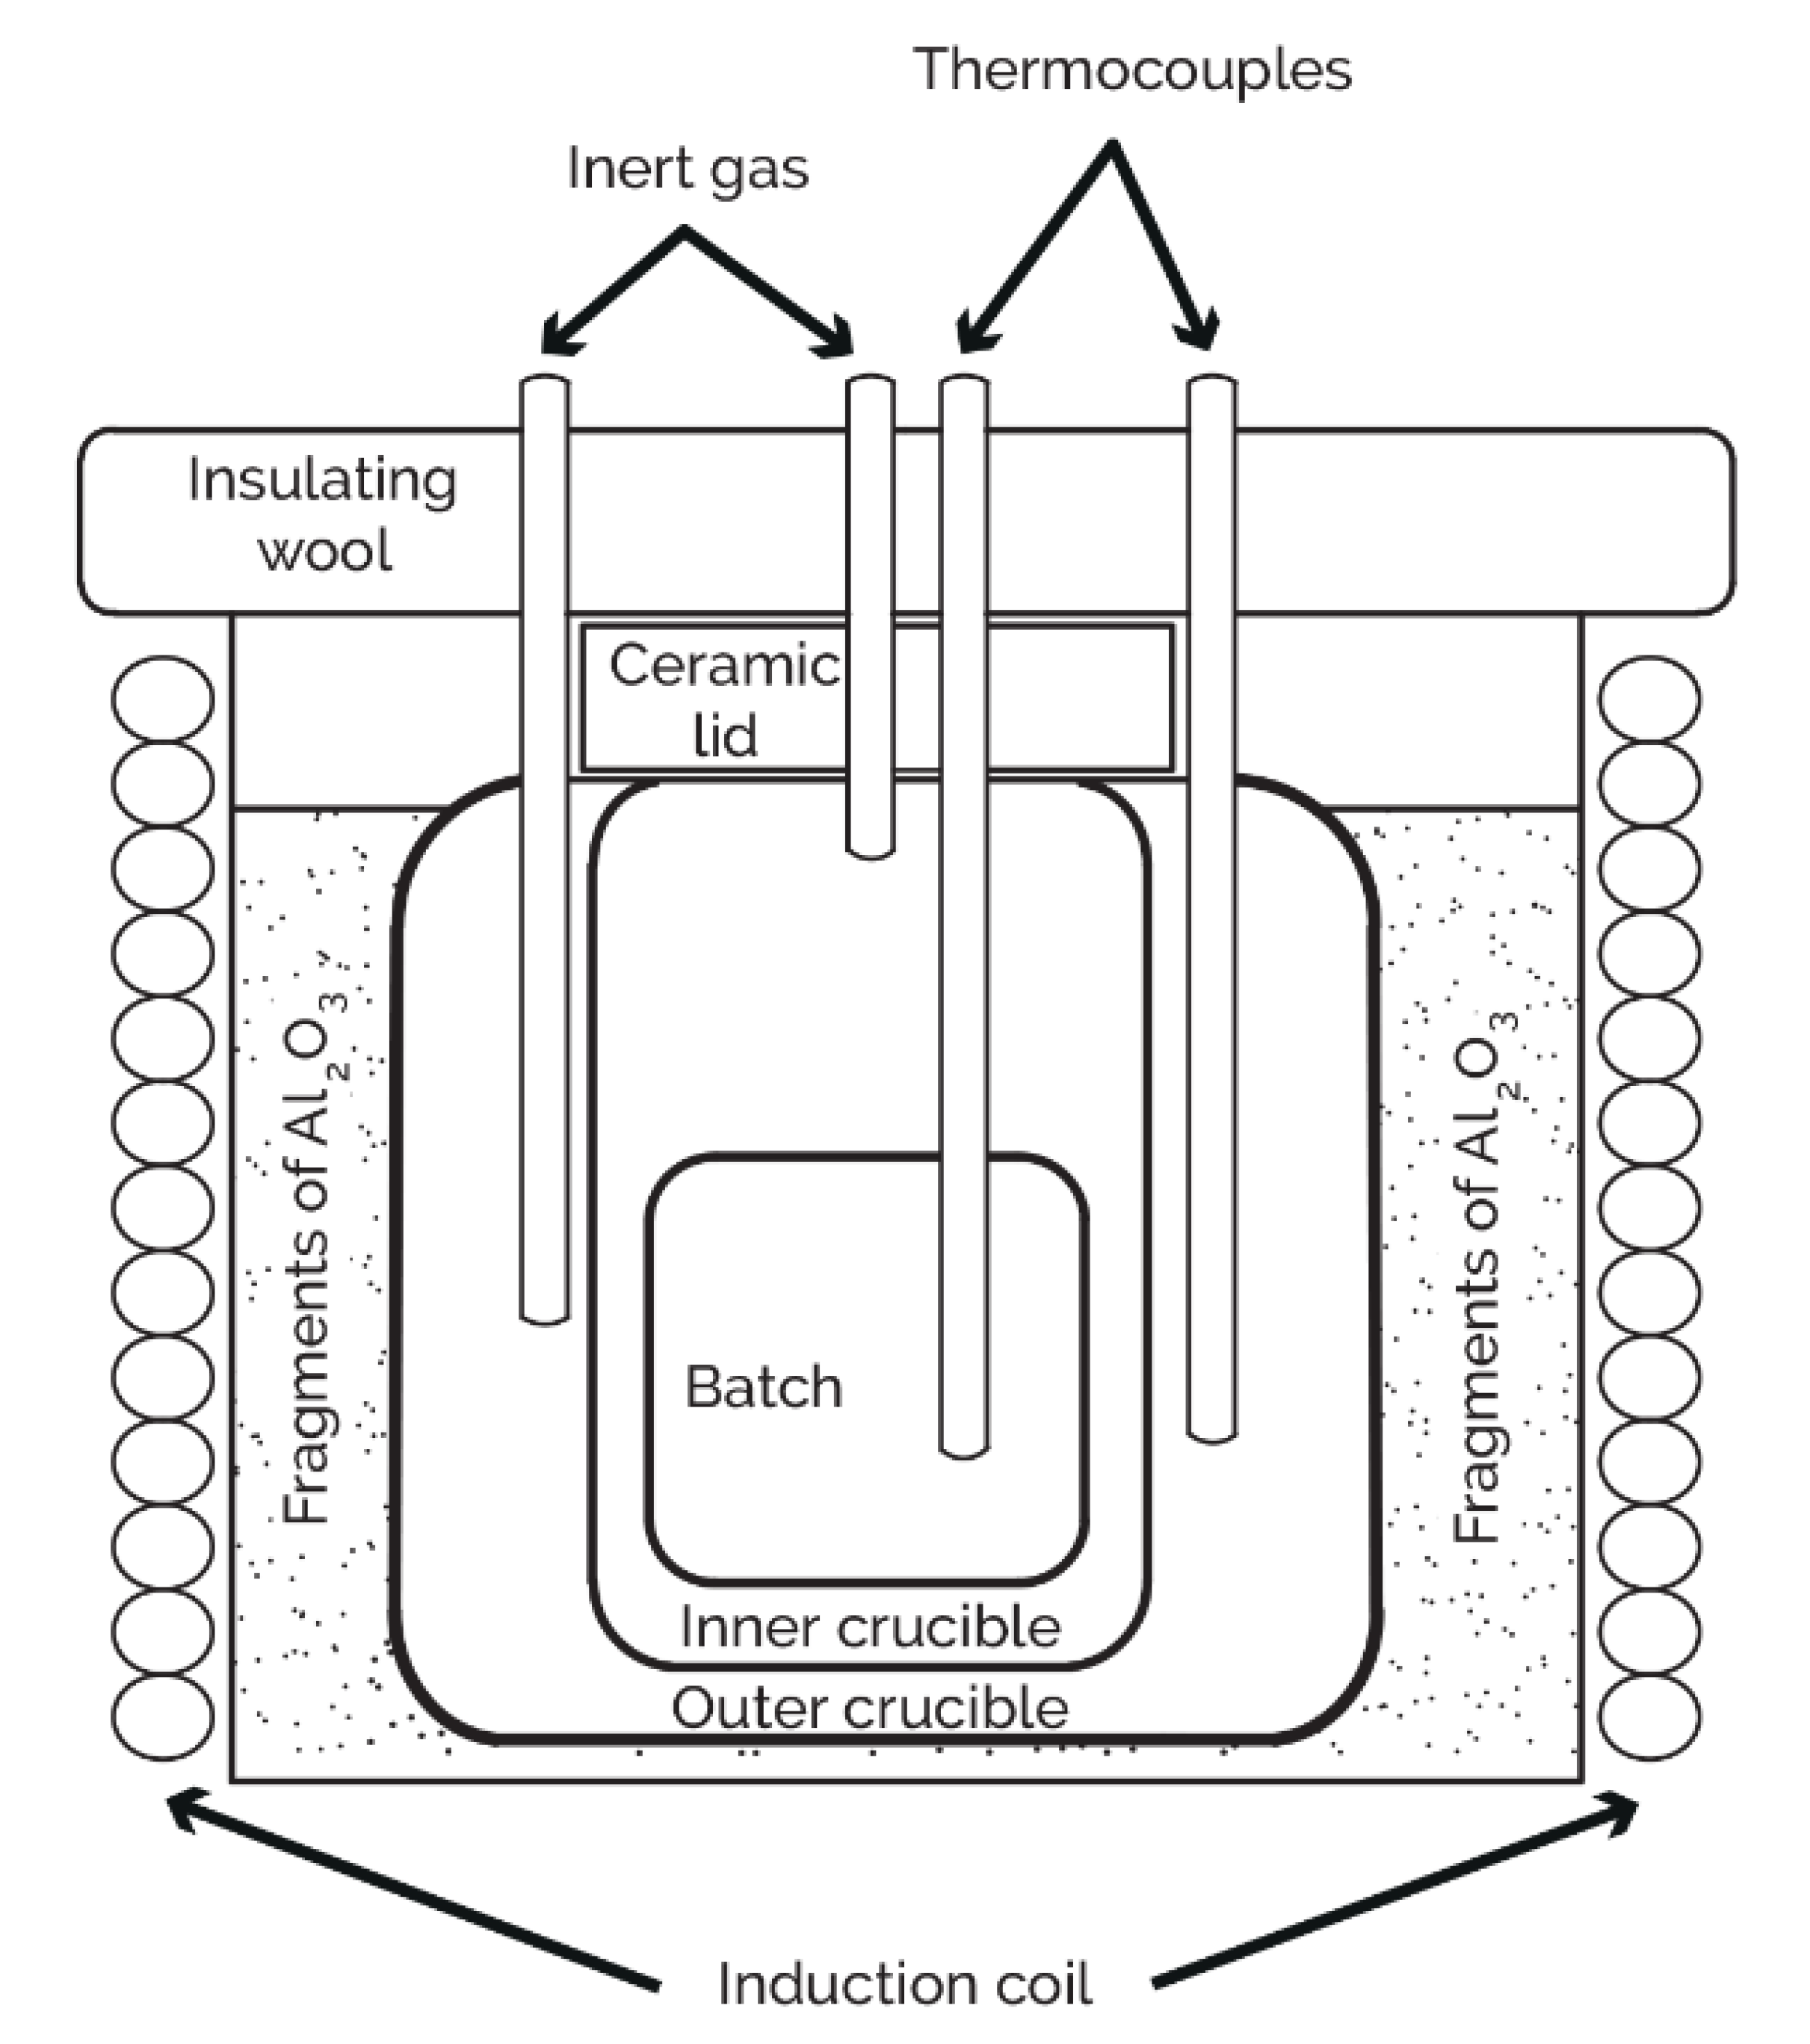
2.1. Apparatus and Material

An induction furnace (Type TNX 60, Plustherm Point GmBH, Wettingen, Switzerland) with a recrystallized alumina work tube was used. A schematic of the furnace is shown in Figure 1. A molybdenum crucible was used as the inner crucible for the preparation of the slag. The furnace was water cooled and had openings to facilitate the introduction of an inert gas in the crucible and thermocouple. The temperature was measured by a B-type thermocouple, which was checked against a calibrated standard couple.
The synthetic samples were made from mixtures of TiO2 (>99.5 pct), Ti2O3 (>99.9 pct), FeO (>99.5 pct), MgO (>99.9 pct), MnO (>99.9 pct), SiO2 (>99.9 pct), and Al2O3 (>99.5 pct). The concentration of components used for each test is described in Table 1. The percentage composition of TiO2 and Ti2O3 selected for each test was comparable to the actual industrial slag. The presence of FeO can play an important role in the slag formation, so a wide range (1% to 15%) of composition was selected. The MgO composition in industrial slag is around 1–2%, but there can be an increase in composition because the ilmenite smelter operates with a freeze lining of a solidified slag against the furnace wall [15]. Any damage caused to the freeze lining may result in a higher concentration of MgO in the slag. To accommodate this variation, the percentage composition of MgO was from 0.6% to 10%. All the other impurities were within the range of industrial slags.
A FeO-TiO2-Ti2O3 ternary phase diagram at 1600 °C and 1500 °C is shown in Figure 2 and Figure 3, respectively, which were prepared with FactSage version 6.4 using FactPS and FToxid databases.
The constitution of the ternary phases in the system was similar between 1500 °C and 1600 °C. Pseudobrookite formation was more prominent at 1500 °C with a higher concentration of TiO2 in the system [26]. However, the liquid slag phase was enlarged at 1600 °C, and the magneli phases were solidified, as shown in Figure 2. The bordering phase regions were shifted, accordingly, too.
The temperature (in °C) mentioned was the liquidus temperature for each sample, which was determined based on the theoretically calculated liquidus contour diagram, as shown in Figure 4. The calculation of the diagram was carried out with MTDATA 6.0 software [27] using a non-commercial HTOX 9.0 database [28] for oxide and sulfide systems. It was important to keep a check on the liquidus temperature so that the complete melting of the slag was achieved. This was especially so in the laboratory furnace as the holding period was just half an hour to achieve equilibrium. Samples with low FeO started to melt at lower temperatures when compared to samples with higher FeO content. For the experiment, the furnace was heated to a temperature equal to 20 °C above the liquidus temperature of the test sample to make sure that the liquidus temperature was achieved. An S-type thermocouple was placed near the crucible to measure the temperature in the furnace.

2.2. Procedure

The reagents for the synthetic slag preparation were weighed and thoroughly mixed to form a uniform mixture weighing 100 g. The mixture was then charged in a 125 mL molybdenum crucible, which was placed in the induction furnace. Argon gas with a flow rate of 1 L/min was purged above the insulating wool and inside the crucible to ensure an inert gas atmosphere that prevented any oxidation of molybdenum crucible at a higher temperature. The furnace was heated to the required temperature as mentioned above, and a holding period of 30 min was given to attain equilibrium for fully liquid slags. A quartz tube was used to take a sample of the molten slag from the crucible. The molten slag, with the quartz tube, was quenched in a cold-water bucket. The quartz tube was broken to get the slag sample, which was a cylindrical slag sample.

2.3. Analytical Techniques

A Thermo Scientific iCAP 7000 inductively coupled plasma analyzer equipped with optical emission spectroscopy (ICP-OES) was used to measure the elemental components of the slag after the total dissolution of the sample to an acid mixture consisting of nitric acid, hydrochloric acid, and perchloric acid. The metallic iron was analyzed with ICP-OES after dissolution to bromine methanol, and trivalent titanium content was analyzed by a titration-based method from a precipitate of dissolution of the sample to bromine methanol because metallic iron is disturbed in this titration method. In addition, the SiO2 content of the samples was analyzed colorimetrically as siliconmolydene blue with a Skalar Segmented Flow Analyzer (SFA San++) via dissolution of the sample to NaOH melt, diluted with hydrochloric acid, and then reduction with ascorbic acid. Skalar is an automated spectrophotometric analyzer used at the UV/Vis region in this analysis method. A Rigaku Smartlab 9 kW X-ray powder diffraction (XRD) was used for sample phase identification. The PDXL2 software suite with integrated available PDF-4 2018 database was used to analyze the weight percentage of the phases present in the samples. Scanning electron microscopy (SEM) with backscattered electron imaging was used for chemical characterization of the slag samples. Backscattered electron imaging was used to obtain the atomic number contrast in the microstructural image. All the phase diagrams and calculations were made with FactSage version 6.4 using FactPS, FToxid databases, and MTDATA software.

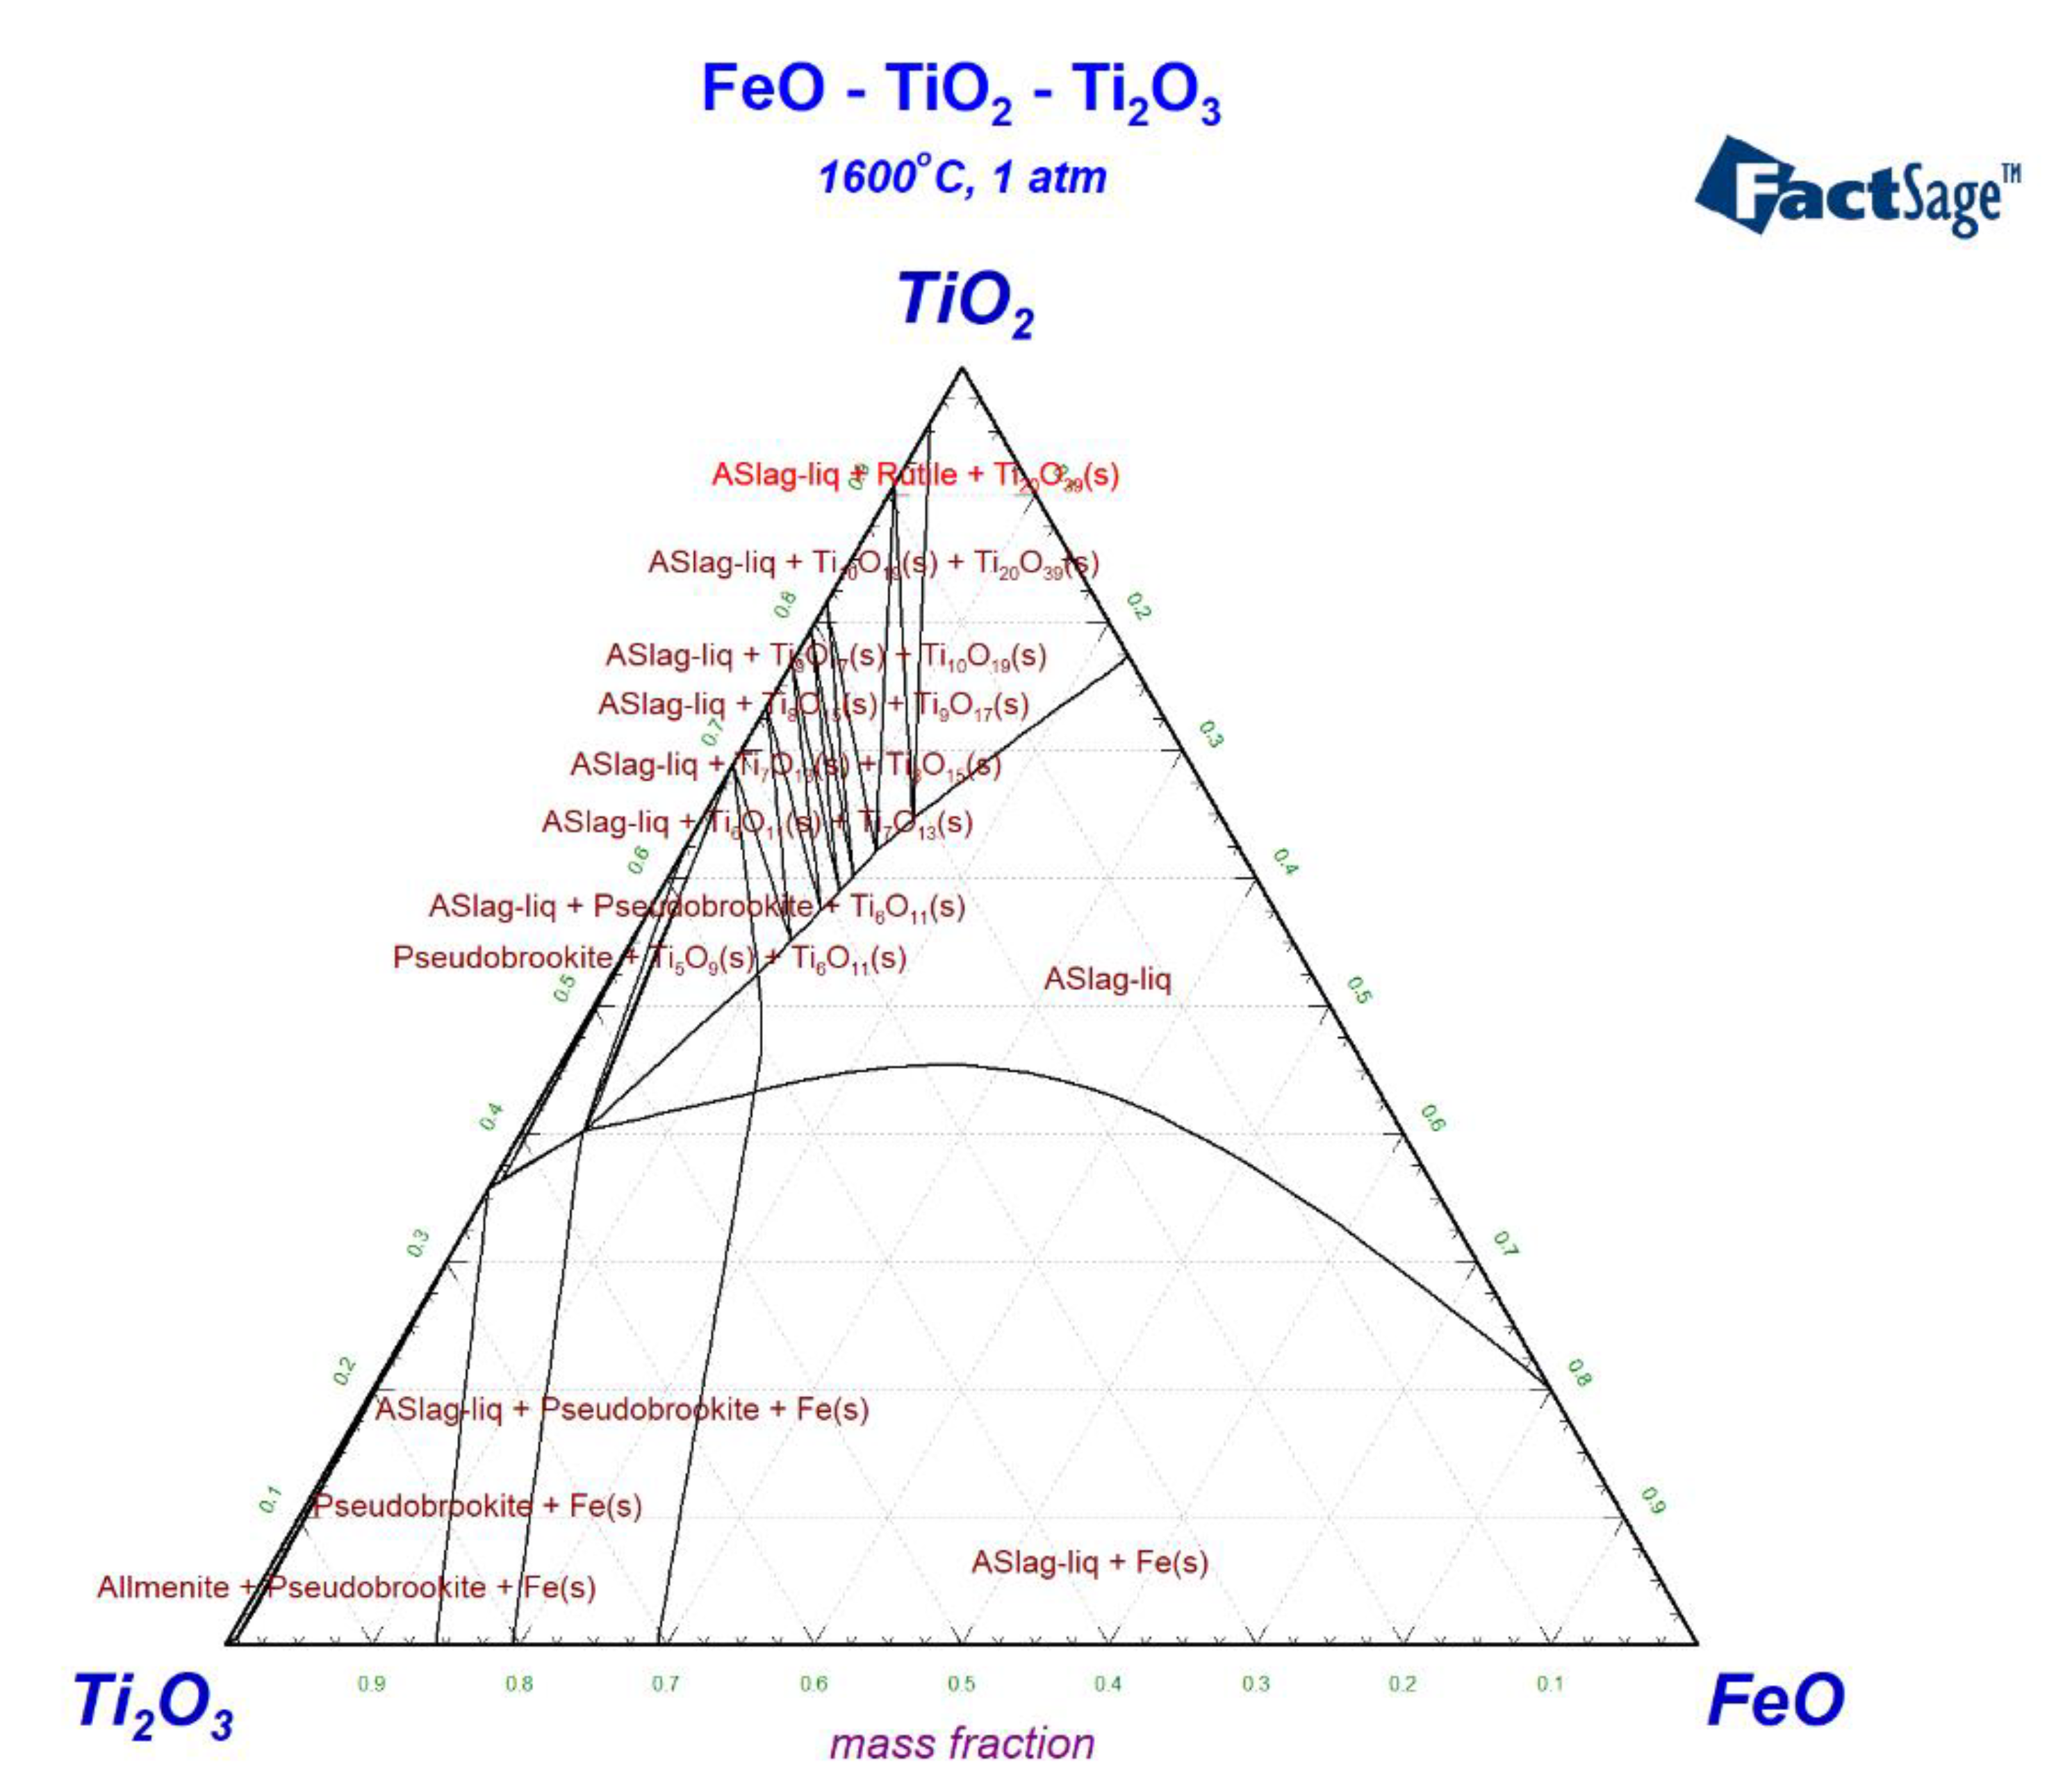
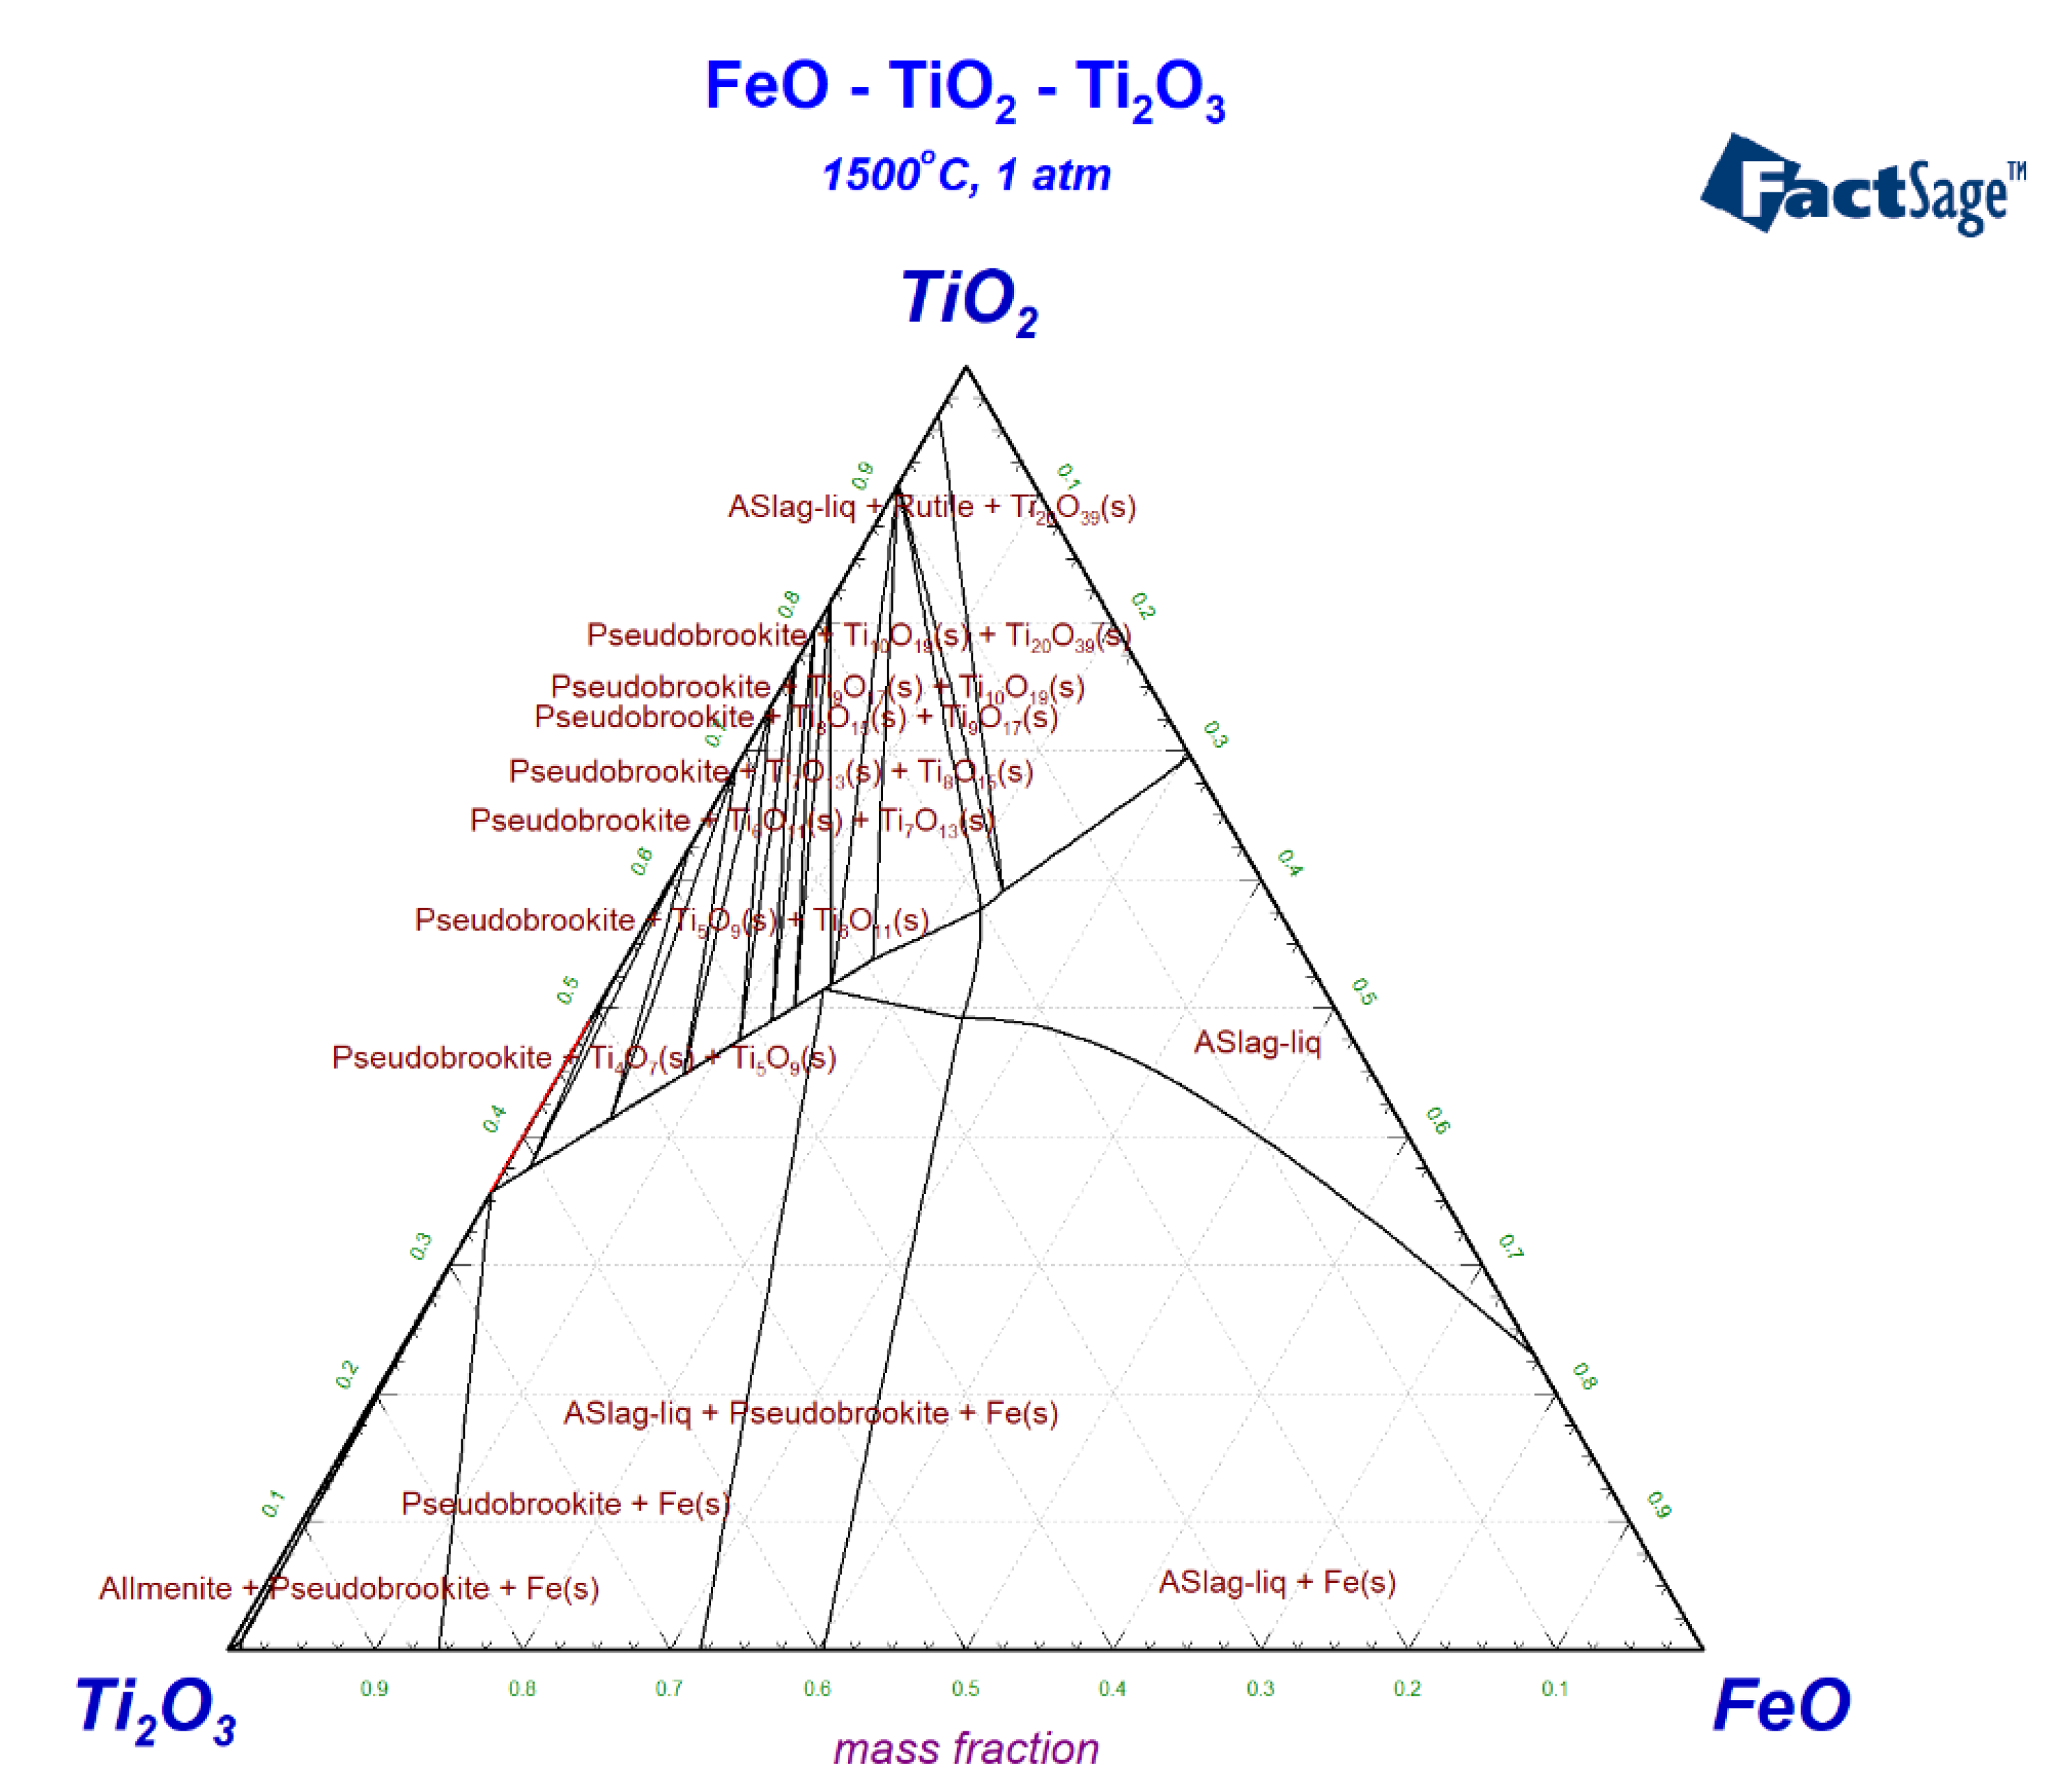
3. Results and Discussion

Each slag sample was quenched and sent for laboratory tests. The results of the ICP-OES analysis, wet chemical analysis, and coulometric analysis are given in Table 2. The experiments are given as test numbers, which represent the sample number also. The elemental composition obtained from ICP-OES was converted into weight percentage. The composition of each component obtained in Table 2 was slightly different than the raw materials that were used, as shown in Table 1. An increase in the quantity of TiO2 was observed in all samples compared to the values in Table 1, which indicates the oxidation of titanium from Ti3+ to a Ti4+ oxidation state. The amount of FeO and MgO remained almost the same, whereas the other impurities had some variation. Another reason for the difference can be attributed to the small sample size that was used for ICP-OES. Later, these values were normalized to represent a 100% composition value in the final slag composition values.
Energy dispersive X-ray microscopy (EDS) was performed to analyze the elemental composition of each phase and then compared with XRD to get a better idea about the phases present as XRD is not an accurate measuring technique for quantitative analysis. Figure 5 shows the XRD spectra of the cooled synthetic slag samples. Three samples were selected to show the peaks corresponding to the pseudobrookite, rutile, and silicate phases, as shown on the XRD pattern in Figure 5. The major and minor phases observed in each sample are listed in Table 3. It was observed that the pseudobrookite phase, having an M3O5 composition of divalent and trivalent ions, was consistent in all samples. The major phases were seen as a solid solution of various titanates, such as pseudobrookite, armalcolite, and Mg2TiO5, all having pseudobrookite–karrooite structure. Similar phases and structures were observed in a high titania industrial slag study [29]. The karrooite structure can accommodate a wide variety of mixed-valence metal cations. Other authors also reported that the solidified titania slag consisted mainly of a uniform M3O5 solid solution with minor phases consisting of rutile, silicate glass phase, metallic iron, and magneli phases [30,31]. The minor phases found in our samples consisted of rutile, magneli phases (titanium oxide), silicate phase, and anatase in a few samples.

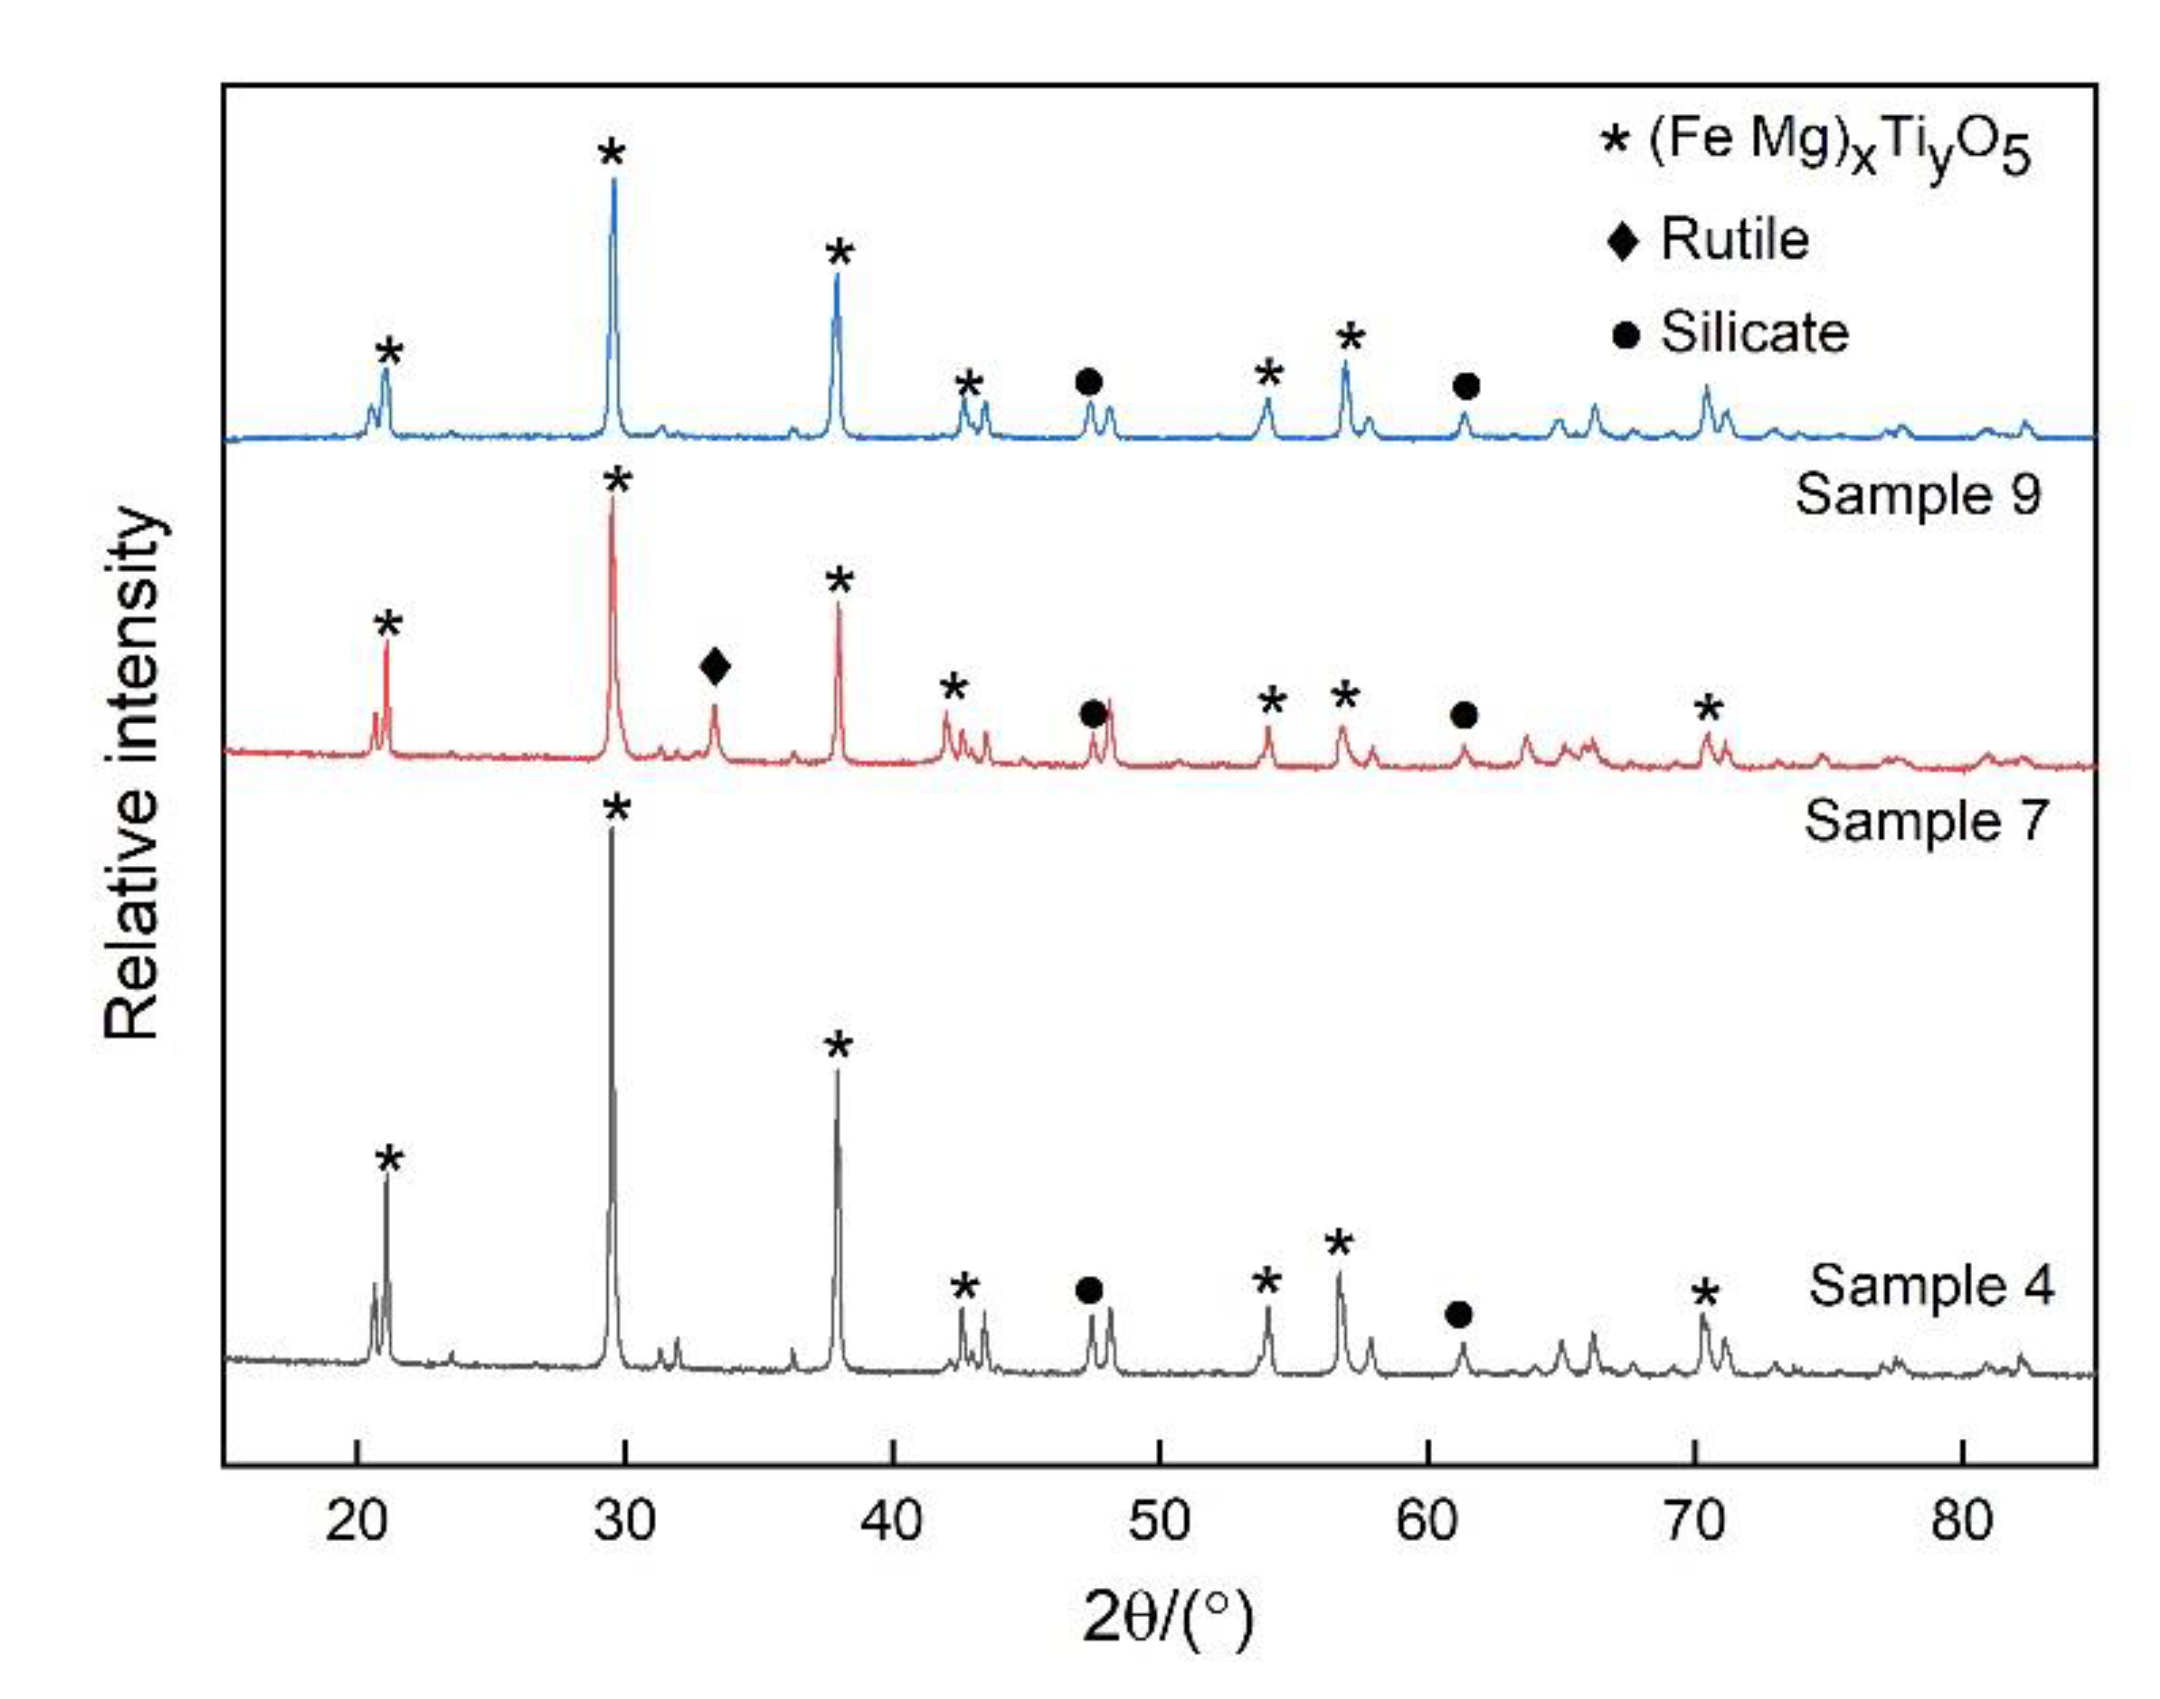
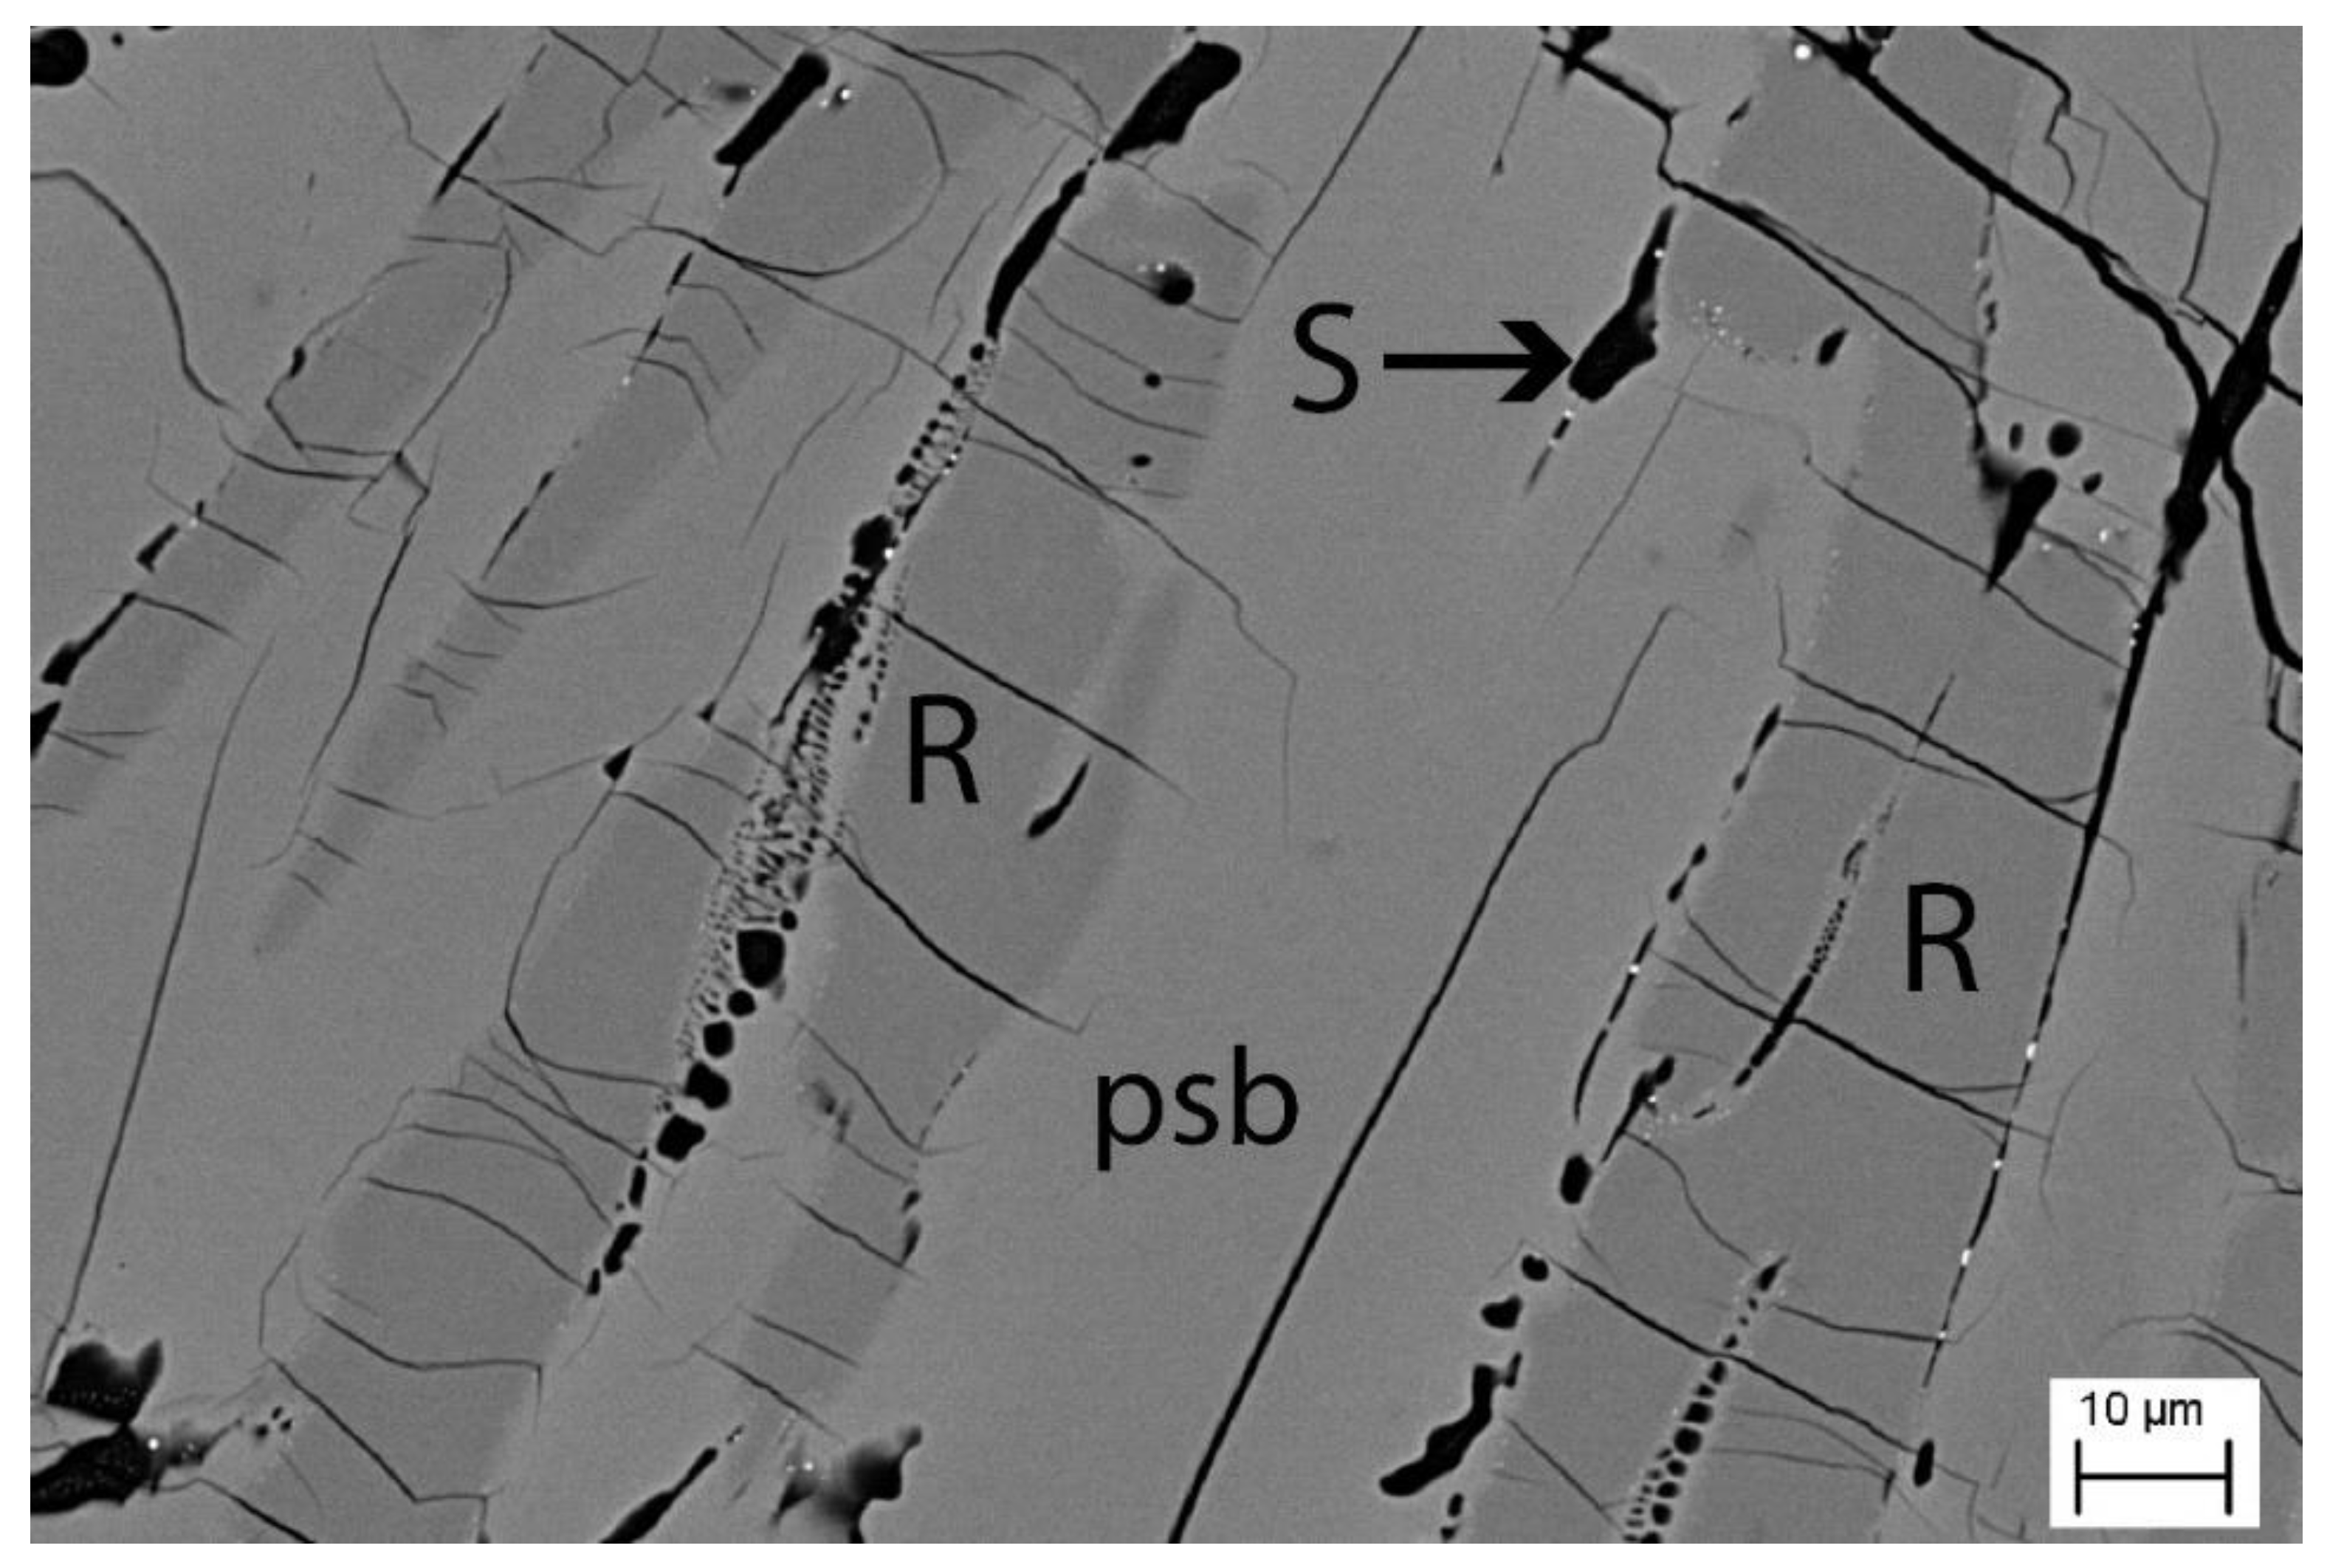
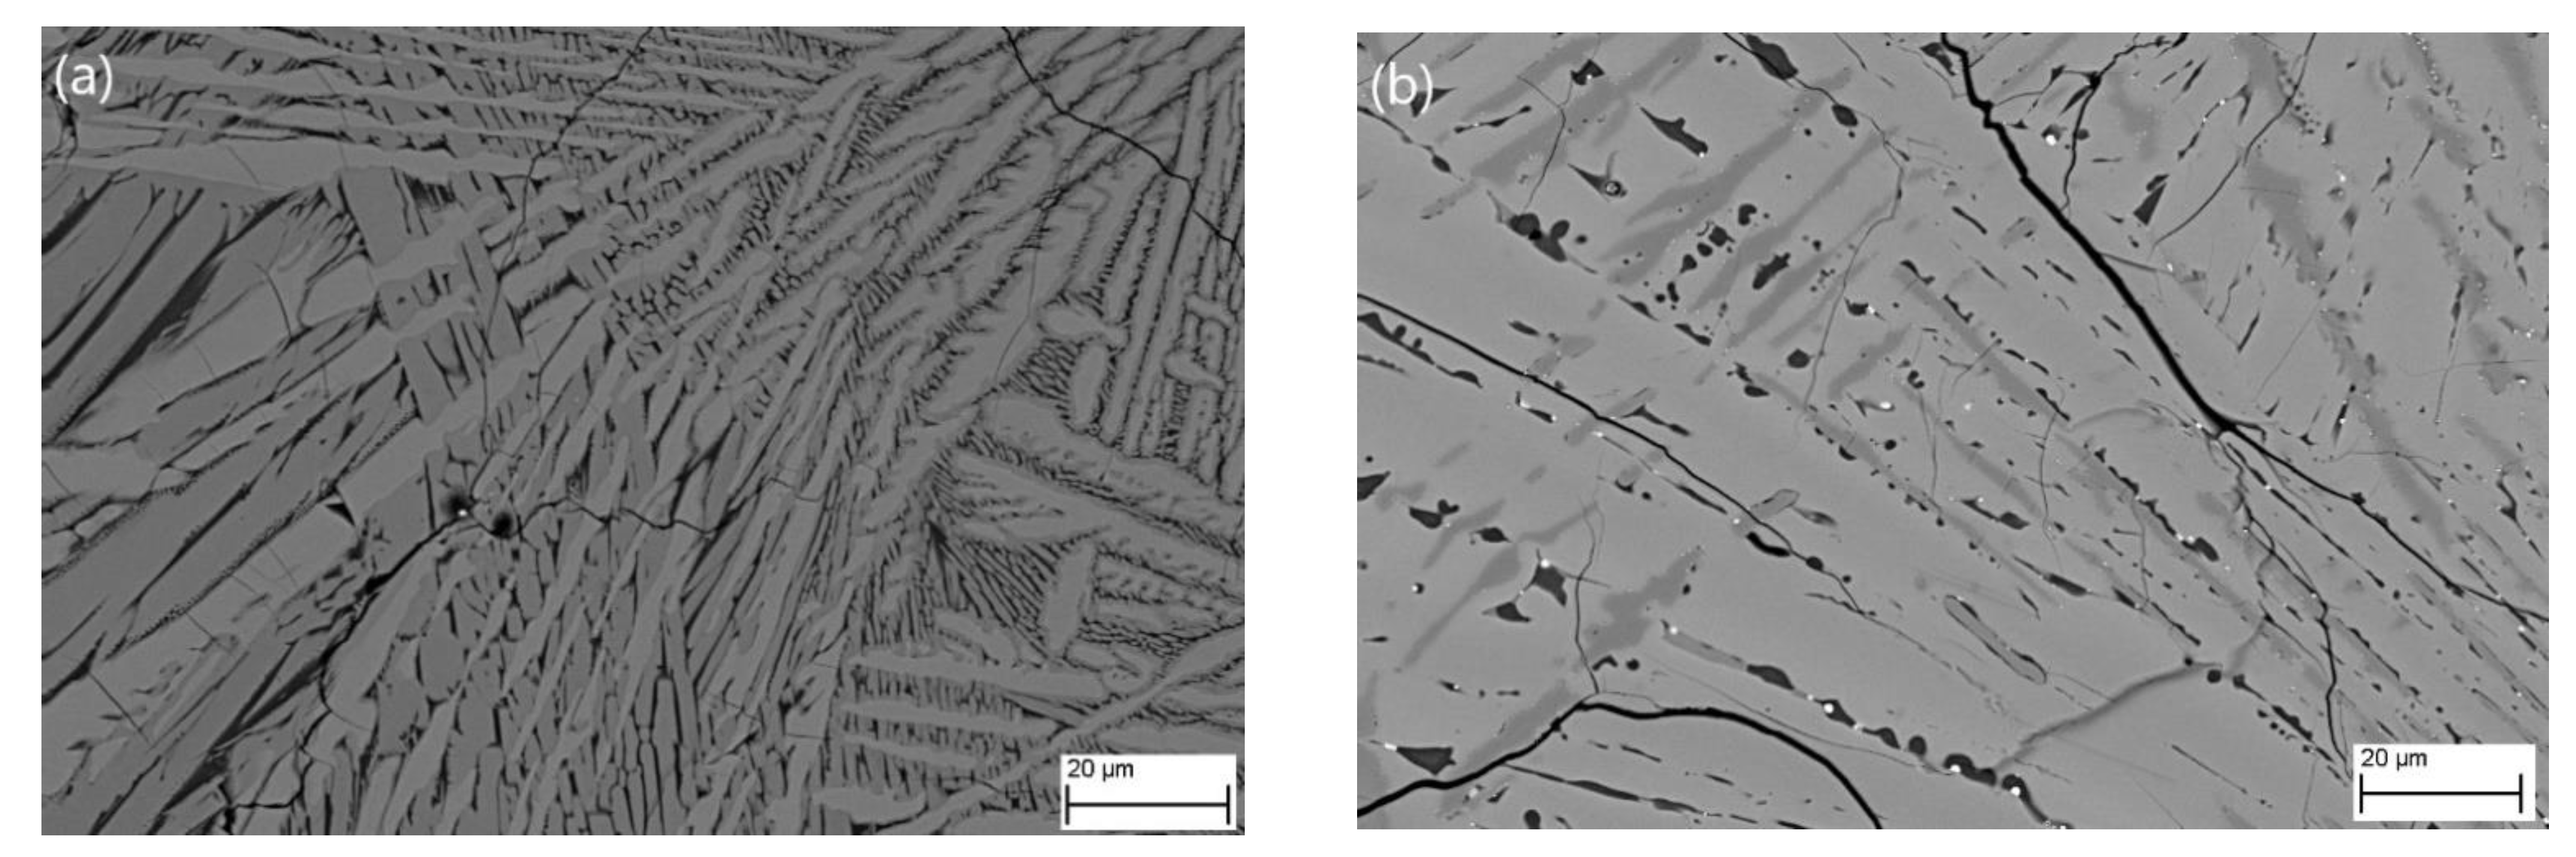
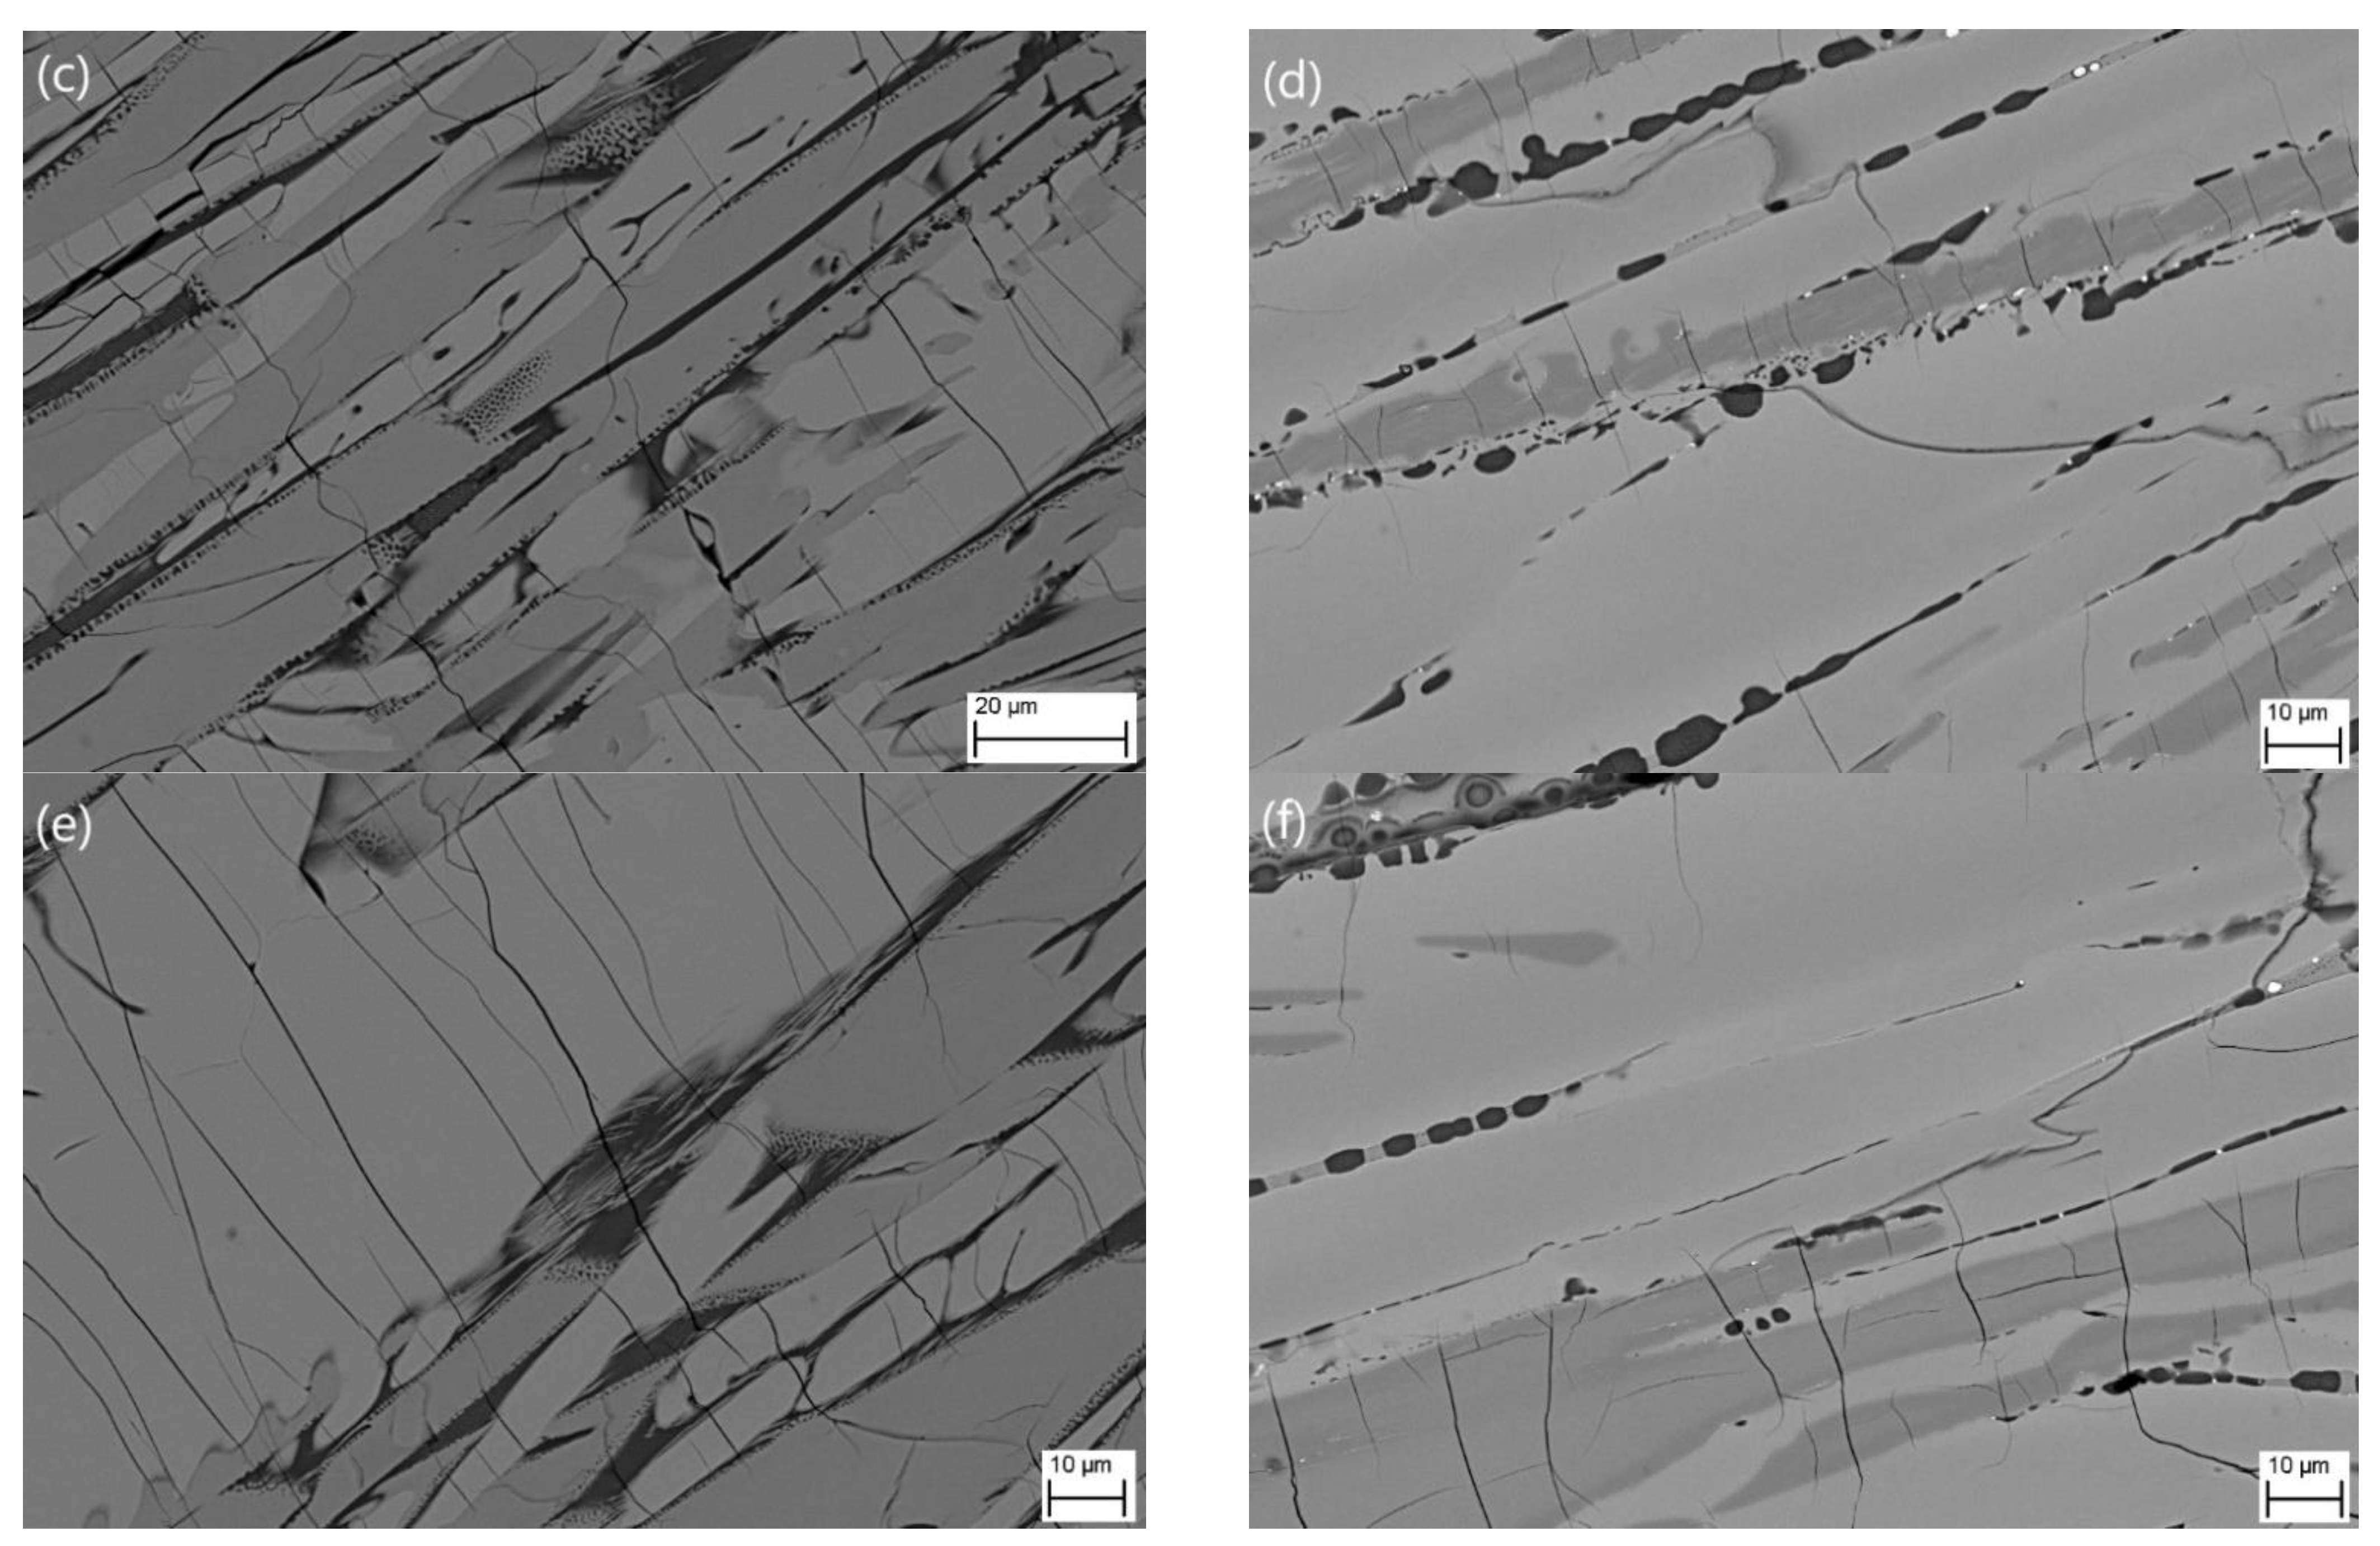
3.1. Slag Microstructure

The microstructure of the samples was studied by EDS-SEM analysis. Different phases were, observed under backscattered electron imaging, and they were compared with the phases obtained by XRD, as shown in Table 3. All the samples contained pseudobrookite as the major phase. The M3O5 phase formed in the slag samples consisted of a mixture of Ti2FeO5, Mg0.5Ti2.5O5, and Mg2.5Ti0.5O5, according to the XRD analysis. As all of them were of the M3O5 composition, they are represented as pseudobrookite in this discussion for simplicity. The other common phases observed were the ilmenite, rutile, and silicate glass phases, as discussed using the figures below.
Figure 6 shows the ilmenite slag sample after it was quenched in water. The cross-section of the sample could be seen to have a hollow tube-like area, which might have formed during the quenching for air passage. Three regions of the cross-section were analyzed using EDS-SEM to understand the phase composition and the differences as we move from the outer surface towards the hollow inner surface. In this study, the region near the outside surface was called as outer area, and the region near the hollow part, as the inner area. The region in between these two was referred to as the center, which represents the bulk material.
Figure 7 shows the microstructure of sample 1, where three different phases can be observed. Similar phase formation is observed in sample 3 (Figure 8) and the other samples. In some samples, two types of silicates were observed, as shown in Figure 8: S1 appeared lighter than the S2 in the backscattered electron image, indicating the presence of a higher average atomic number within the silicate phase. The amount of silicon dioxide present in the darker silicate (S2) phase was higher than, the lighter silicate (S1) phase. All the slag samples consisted of three to four phases where the pseudobrookite and silicate phases were consistent with the other phase consisting of ilmenite, rutile, or magneli phases. This can be observed throughout the microstructure images for samples.
Among the impurities present in the slag, nearly all the SiO2 and a majority of Al2O3 were in the glass phase, whereas the other impurities oxides, such as MnO and MgO, were present majorly in the M3O5 solid solution and also in the silicate phase [23]. The amount of Al2O3 that went to the silicate phase was almost equal to a third of the amount of SiO2 [32]. Within the slag, the divalent impurities (Mg2+ and Mn2+) substituted the Fe2+, whereas the trivalent impurities (Al3+) substituted the Ti3+ [31]. Pistorius explained the relation between the composition of FeO and Ti2O3 in an ilmenite slag that follows M3O5 stoichiometry [31]. Figure 9 shows the relation between the equivalent %Ti2O3 and equivalent %FeO. In Figure 9, the long dash line shows the trend for the Canadian and South African ilmenite slags with the expected relationship in a solid solution (M3O5) [31], whereas the short dash line shows the trend for the synthetic slags.
It is observed that the trend for the synthetic slags deviated from the trend observed in the industrial slag. The deviation can be attributed to the lower amount of pseudobrookite formed in the synthetic slag and the composition of the slag. The linear relation for industrial slag is observed if the M3O5 solid solution is simply a mixture of Ti3O5 and FeTi2O5 and the amount of rutile and silicate is small, which was not true for our slag composition. There were a few samples for which the silicate and rutile formation was less, and the trend was similar to the industrial slag. For samples with the highest pseudobrookite content (samples 6 and 9), the points on the trendline lay closer to the industrial slag trendline.
The percentage content of pseudobrookite in all the samples was in the range of 51% to 95%. Most of the impurities added in the slag, such as Al2O3, MnO, and SiO2, were found in the silicate phase that consisted mostly of SiO2. The silicate phases were observed between the boundaries of the pseudobrookite phase. It was found that the amount of pseudobrookite formed in the slag was proportional to the amount of impurities (FeO, MgO, MnO, SiO, and Al2O3) present in the raw material. An increase in the amount of impurity resulted in an increase in pseudobrookite formed. Samples 1, 2, and 3 had the least impurity content and the lowest amount of pseudobrookite content in the samples, whereas samples 6 and 9 had the largest amount of impurity and pseudobrookite (Table 2 and Table 3).
Two of the most important impurities in the ilmenite slags were FeO and MgO, as they affected the slag properties and freeze lining conditions, respectively. The other impurities were present in the oxide phase and did not have a significant effect on the smelting process as FeO or MgO. MgO had the most pronounced effect on the pseudobrookite formation than any other impurity. A higher amount of MgO in the samples resulted in higher pseudobrookite formation. The samples having a pseudobrookite amount around 85% or more were samples 4, 6, 7, and 9; these samples had the highest amount of MgO among the ten prepared samples. It should also be noted that the nominal composition of MgO in the slag varied from 1 to 2% in the industrial slags. Other impurities can have a similar effect as MgO, but no such trend was observed in this study.

3.2. Micro-Analyses

The results of the EDS analysis for sample 7 and sample 10 are summarized in Table 4 and Table 5, respectively. These two samples were selected for comparison due to them having the lowest and the highest amount of FeO present among all samples. The analysis was conducted in three different regions on the sample cross-section. The outer surface undergoes the fastest cooling, and toward the inner surface, the cooling rate decreases. The silicate and the pseudobrookite phase present near the outer surface had a smaller amount of FeO as compared to the center region. This was consistent with the expected solidification behavior that when the pseudobrookite phase solidified first, it will have a higher TiO2 content and lower iron content than the phases that were solidified later. Similar trends were observed in the industrial slag samples and the pilot plant slag samples studied by Pistorius [23]. The difference was more pronounced in their work as the sample size was large, and thus, the cooling rate would vary significantly.
The effect of the cooling speed on the grain size can be observed in Figure 10, which presents electron microscopy images of different slag regions for slag samples 7 and 10. As mentioned earlier, the cooling was fastest for the outer surface; this is reflected in the grain size. As we move from the outer surface to the inner surface, the grain got larger as the cooling slowed down.
The silicate phases were trapped between the pseudobrookite grains and could be observed around the larger grains in the center and inner surface regions. The grain size near the outer surface was relatively small, representing more nucleation due to faster cooling. It is interesting to note that cracks were present in the pseudobrookite phase in slag 7, having the lowest amount of FeO but not in sample 10, having the highest amount. The cracks were more often present within the rutile and silicate phases in sample 10. In the center, the pseudobrookite grain was more elongated and with larger segregation of silicate phases. The silicate phases had more defined boundaries, as observed in sample 10.
The synthetic slags showed similar characteristics to industrial slags. The impurities were in the silicate phase, thus giving an expected pseudobrookite phase with M3O5 composition along with rutile. This method of slag preparation gives the user the freedom to select the composition of the slag. The amount of pseudobrookite in the slag can be improved by controlling the amount of Ti2O3 in the slag mixture. The key features observed in the synthetic slags that are found in the industrial slags were the elongated pseudobrookite grains, the silicate phase between the pseudobrookite grain, and microcracking throughout the cross-section.

4. Conclusions

The preparation of the synthetic ilmenite slag was successfully carried out using a molybdenum crucible placed inside an induction furnace. The slag samples were quenched in water. Most of the slags consisted of three phases, namely pseudobrookite, rutile, and silicate phases. The quantity of the pseudobrookite formed in the synthetic slag was less than that found in industrial slags, but for a few samples, it was similar to an industrial slag. The samples having a lesser amount of Ti2O3 in the slag mixture resulted in a larger percentage of pseudobrookite in the final slag. The solidified titanium slag consisted of a microstructure that is similar to that observed in the industrial slags. The silicate phases were formed between the pseudobrookite grains, and the pseudobrookite grains had elongated shapes. The results suggest that the induction furnace with a controlled atmosphere can be used to prepare synthetic slags with the desired chemical composition. The synthetic slags can be helpful when preparing a calibration model, which requires samples with varying chemical compositions. For example, quantitative analysis of ilmenite slags with laser-induced breakdown spectroscopy (LIBS) requires such calibration.

Author Contributions

Conceptualization, A.K.G. and M.A.; Data curation, A.K.G.; Formal analysis, A.K.G.; Funding acquisition, M.H. and T.F.; Investigation, A.K.G. and M.A.; Methodology, J.P.; Project administration, M.H. and T.F.; Resources, P.M.; Software, A.K.G.; Supervision, M.A., P.M., and T.F.; Validation, M.A. and T.F.; Visualization, A.K.G. and M.A.; Writing—original draft, A.K.G.; Writing—review & editing, M.A. and J.P. All authors have read and agreed to the published version of the manuscript.

Funding

This project has received funding from the European Union’s Horizon 2020 research and innovation programme under the Marie Sklodowska-Curie grant agreement No 713606.

Institutional Review Board Statement

Not applicable.

Informed Consent Statement

Not applicable.

Data Availability Statement

Data is contained within the article and supplementary material.

Acknowledgments

The authors are grateful for the financial support from the I4Future doctoral programme—Imaging for the Future. Furthermore, the authors acknowledge the support of the Academy of Finland projects (Academy of Finland, No. 311934 and No. 326291) and Metso Outotec Research Center for their participation in the project.

Conflicts of Interest

The authors declare no conflict of interest. The funders had no role in the design of the study; in the collection, analyses, or interpretation of data; in the writing of the manuscript, or in the decision to publish the results.

References

  1. Dondi, M.; Cruciani, G.; Balboni, E.; Guarini, G.; Zanelli, C. Titania slag as a ceramic pigment. Dye. Pigment. 2008, 77, 608–613. [Google Scholar] [CrossRef] [Green Version]
  2. Gázquez, M.J.; Bolívar, J.P.; Garcia-Tenorio, R.; Vaca, F. A Review of the Production Cycle of Titanium Dioxide Pigment. Mater. Sci. Appl. 2014, 5, 441–458. [Google Scholar] [CrossRef] [Green Version]
  3. Kahn, J.A. Non-Rutile Feedstocks for the production of titanium. J. Met. 1984, 36, 33–38. [Google Scholar] [CrossRef]
  4. Noubactep, C. Metallic iron for environmental remediation: Learning from the Becher process. J. Hazard. Mater. 2009, 168, 1609–1612. [Google Scholar] [CrossRef] [Green Version]
  5. Xiang, J.; Pei, G.; Lv, W.; Liu, S.; Lv, X.; Qiu, G. Preparation of synthetic rutile from reduced ilmenite through the aeration leaching process. Chem. Eng. Process. Process. Intensif. 2020, 147, 107774. [Google Scholar] [CrossRef]
  6. Sahu, K.K.; Alex, T.C.; Mishra, D.; Delhi, N.; Agrawal, A. An overview on the production of pigment grade titania from titania rich slag. Waste Manag. Res. 2006, 24, 74–79. [Google Scholar] [CrossRef]
  7. Song, Y.; Dou, Z.; Zhang, T.; Liu, Y. Research Progress on the Extractive Metallurgy of Titanium and Its Alloys. Miner. Process. Extr. Metall. Rev. 2020. [Google Scholar] [CrossRef]
  8. Nguyen, T.H.; Lee, M.S. A Review on the Recovery of Titanium Dioxide from Ilmenite Ores by Direct Leaching Technologies. Miner. Process. Extr. Metall. Rev. 2019, 40, 231–247. [Google Scholar] [CrossRef]
  9. Lv, W.; Lv, X.; Xiang, J.; Zhang, Y.; Li, S.; Bai, C.; Song, B.; Han, K. A novel process to prepare high-titanium slag by carbothermic reduction of pre-oxidized ilmenite concentrate with the addition of Na2SO4. Int. J. Miner. Process. 2017, 167, 68–78. [Google Scholar] [CrossRef]
  10. Ma, N.; Warner, N.A. Smelting reduction of ilmenite by carbon in molten pig iron. Can. Metall. Q. 1999, 38, 165–173. [Google Scholar] [CrossRef]
  11. Sun, H.; Wang, J.; Dong, X.; Xue, Q. A literature review of titanium slag metallurgical processes. Metal. Int. 2012, 17, 49–56. [Google Scholar] [CrossRef]
  12. Pistorius, P.C.; De Villiers, J.P.R.; Gräser, P.; Venter, A. Partial slag solidification within ilmenite smelter. Miner. Process. Extr. Metall. 2011, 120, 211–217. [Google Scholar] [CrossRef] [Green Version]
  13. Chen, G.; Song, Z.; Chen, J.; Peng, J.; Srinivasakannan, C. Evaluation of the reducing product of carbonthermal reduction of ilmenite ores. J. Alloy. Compd. 2013, 577, 610–614. [Google Scholar] [CrossRef]
  14. Gous, M. An overview of the Namakwa Sands ilmenite smelting operations. J. S. Afr. Inst. Min. Metall. 2006, 106, 379–384. [Google Scholar]
  15. Pistorius, P.C. Ilmenite smelting: The basics. J. S. Afr. Inst. Min. Metall. 2008, 108, 35–43. [Google Scholar]
  16. Zietsman, J.H.; Pistorius, P.C. Process mechanisms in ilmenite smelting. SIAMM J. S. Afr. Inst. Min. Metall. 2004, 104, 653–660. [Google Scholar]
  17. Eriksen, J.M.; Robles, E.C.; Rosenqvist, T. Equlibrium between Liquid Fe-Ti-O Slags and Metallic Iron. Steel Res. Int. 2007, 78, 671–675. [Google Scholar] [CrossRef]
  18. Pistorius, P.C.; Motlhamme, T. Oxidation of High-Titanium Slags in the Presence of Water Vapour Oxidation of high-titanium slags in the presence of water vapour. Miner. Eng. 2006, 19, 232–236. [Google Scholar] [CrossRef]
  19. Samal, S. Synthesis and Characterization of Titanium Slag from Ilmenite by Thermal Plasma Processing. JOM 2016, 68, 2349–2358. [Google Scholar] [CrossRef]
  20. Eriksson, G.; Pelton, A.D. Measurement and Thermodynamic Evaluation of Phase Equilibria in the Fe-Ti-O System. Ber. Bunsenges. Phys. Chem. 1996, 100, 1839–1849. [Google Scholar] [CrossRef]
  21. Xiao, W.; Lu, X.; Zou, X.; Wei, X.; Ding, W. Phase transitions, micro-morphology and its oxidation mechanism in oxidation of ilmenite (FeTiO3) powder. Trans. Nonferrous Met. Soc. China 2013, 23, 2439–2445. [Google Scholar] [CrossRef]
  22. Pistorius, P.C.; Coetzee, C. Physicochemical Aspects of Titanium Slag Production and Solidification. Metall. Mater. Trans. B Process. Metall. Mater. Process. Sci. 2003, 34, 581–588. [Google Scholar] [CrossRef]
  23. Pistorius, P.C.; Kotzé, H. Role of silicate phases during comminution of titania slag. Miner. Eng. 2009, 22, 182–189. [Google Scholar] [CrossRef]
  24. Shihong, H.; Ting, L.; Fengxia, H.; Lin, Z. Effect of ilmenite component and AIR on element distribution of titanium slag smelted by DC Arc Furnace. Rare Metal Mater. Eng. 2014, 43, 2921–2926. [Google Scholar] [CrossRef]
  25. Pesl, J.; Eric, R. High-Temperature Phase Relations and Thermodynamics. Metall. Mater. Trans. B 1999, 30, 695–705. [Google Scholar] [CrossRef]
  26. Fourie, D.J.; Eksteen, J.J.; Zietsman, J.H. Isotherms Pertaining to High Titania Slags. J. S. Afr. Inst. Min. Metall. 2005, 105, 695–710. [Google Scholar]
  27. Davies, R.H.; Dinsdale, A.T.; Gisby, J.A.; Robinson, J.; Martin, S. Thermodynamic and Phase Equilibrium Software from National Physical Laboratory. Calphad 2002, 26, 229–271. [Google Scholar] [CrossRef]
  28. Gisby, J.; Taskinen, P.; Pihlasalo, J.; Li, Z.; Tyrer, M.; Pearce, J.; Avarmaa, K.; Björklund, P.; Davies, R.H.; Korpi, M.; et al. MTDATA and the Prediction of Phase Equilibria in Oxide Systems: 30 Years of Industrial Collaboration. Metall. Mater. Trans. B 2017, 48, 91–98. [Google Scholar] [CrossRef]
  29. Guéguin, M.; Cardarelli, F. Chemistry and mineralogy of titania-rich upgraded titania slags. Miner. Process. Extr. Met. Rev. 2007, 28, 1–58. [Google Scholar] [CrossRef]
  30. Coetsee, T.; Pistorius, C. V2O3—TiO2 Systems from 1400 °C to 1600 °C in Reducing Atmospheres. Engineering 2000, 88, 1998–2001. [Google Scholar]
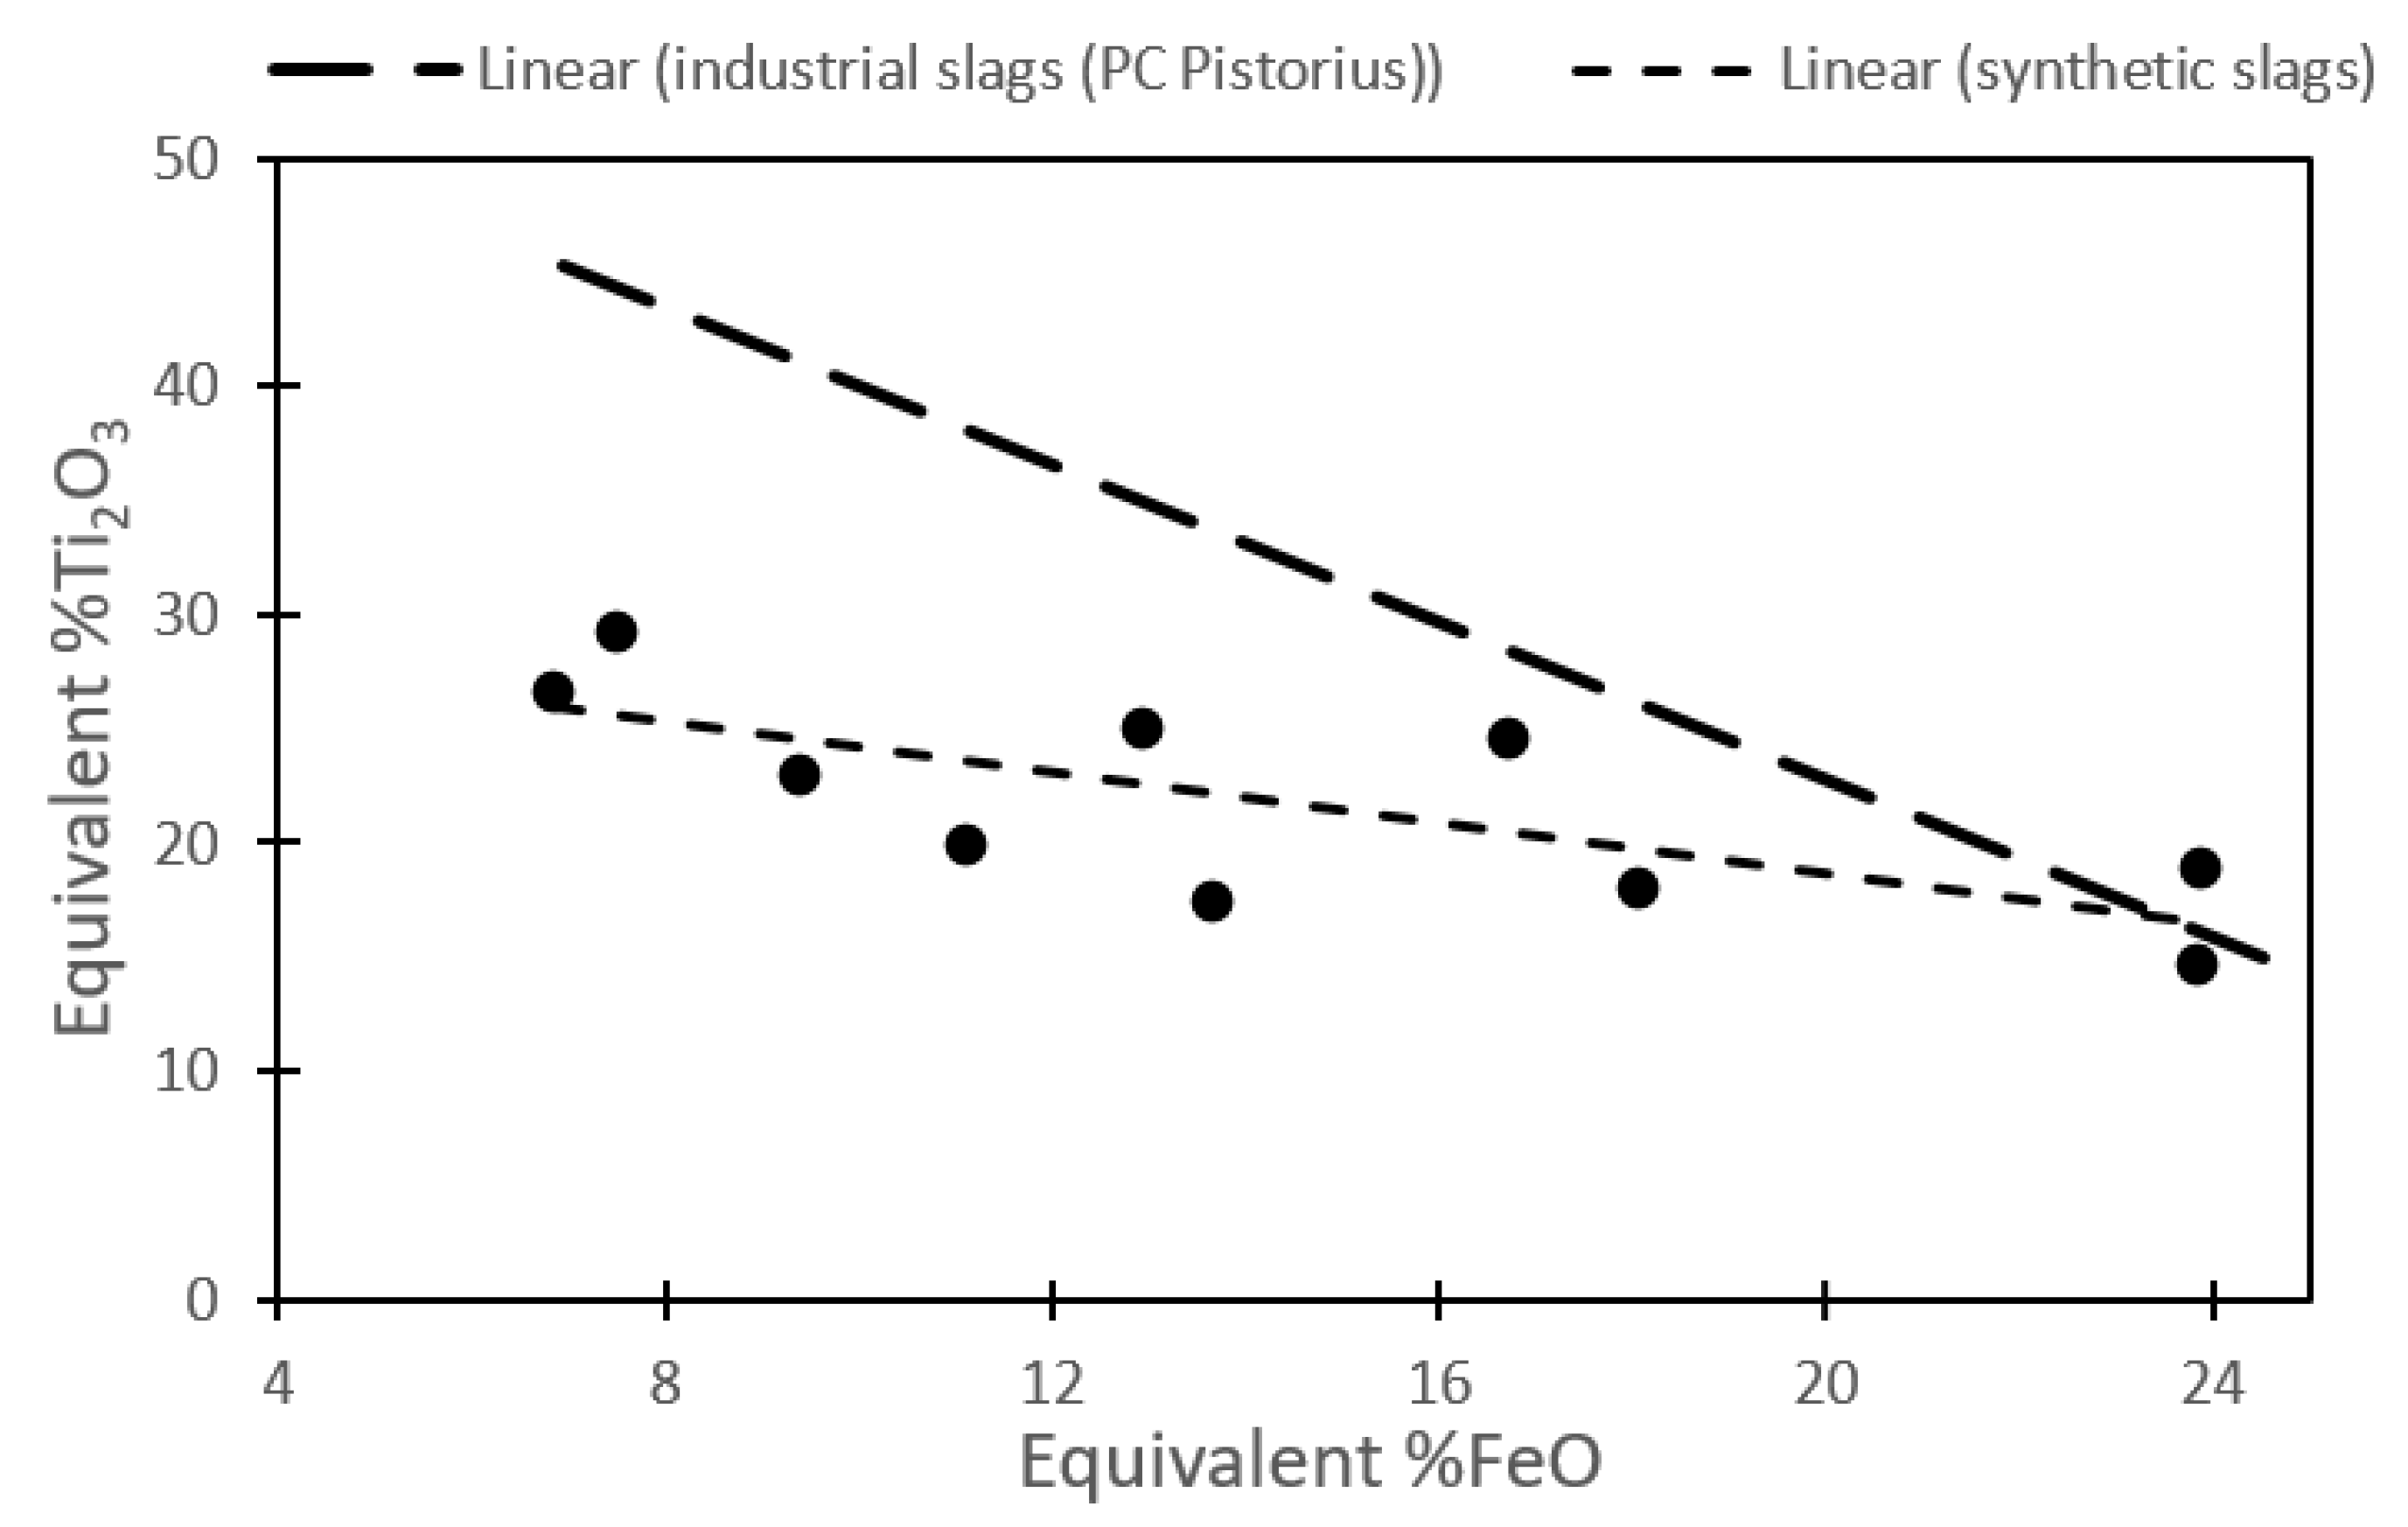
  31. Pistorius, P.C. The relationship between FeO and Ti2O3 in ilmenite smelter slags. Scand. J. Metall. 2002, 31, 120–125. [Google Scholar] [CrossRef] [Green Version]
  32. Borowiec, K.; Grau, A.E.; Gueguin, M.; Turgeon, J.-F. Method to upgrade titania slag and resulting product. U.S. Patent 5,830,420, 3 November 1998. [Google Scholar]
Figure 1. Schematic diagram of the induction furnace used for the preparation of the slags.
Applsci 11 01153 g001
Figure 2. FeO-TiO2-Ti2O3 ternary phase diagram at 1600 °C using FactSage version 6.4.
Applsci 11 01153 g002
Figure 3. FeO-TiO2-Ti2O3 ternary phase diagram at 1500 °C using FactSage version 6.4.
Applsci 11 01153 g003
Figure 4. Liquidus contour diagram that was used for the calculation of liquidus temperature. The composition of all samples is shown in the figure, which was used to determine the temperature.
Applsci 11 01153 g004
Figure 5. X-ray powder diffraction (XRD) patterns of three synthetic slags.
Applsci 11 01153 g005
Figure 6. (a) Water quenched slag sample. (b) The cross-section of the slag sample showing the inner and outer surface regions.
Applsci 11 01153 g006
Figure 7. Microstructures of slag sample 1 analyzed by scanning electron microscopy (SEM). The rutile phase is represented as R, the silicate phase as S, and the pseudobrookite phase as psb.
Applsci 11 01153 g007
Figure 8. Microstructures of slag sample 3 analyzed by SEM. The silicate phase consisted of two different silicate phases, as represented by S1 and S2, the lighter and darker silicate phases, respectively.
Applsci 11 01153 g008
Figure 9. Comparison of an actual trend of ‘equivalent FeO’ and ‘equivalent Ti2O3’for slags from Canadian and South African ilmenites (Pistorius, 2002) and the slags prepared synthetically.
Applsci 11 01153 g009
Figure 10. Microstructure for samples 7 and 10 obtained with energy dispersive X-ray microscopy (EDS) at the same magnification of 2000×. (a) Outer surface of sample 7, (b) Outer surface of sample 10, (c) Center part of sample 7, (d) Center part of sample 10, (e) Inner surface of sample 7, (f) Inner surface of sample 10.
Applsci 11 01153 g010aApplsci 11 01153 g010b
Table 1. Sample weight of components (in grams) and the liquidus temperature for each test.
SampleWeight in GramsTemp (°C)
TiO2Ti2O3FeOMgOMnOSiO2Al2O3
155.73450.61.521.21670
259.42870.81.81.51.51690
359.93031.221.921725
459.02475.50.5221720
552.332912.21.71.81620
661.2157100.8331745
768.81815142.21790
858.926110.81.3111660
955.4201360.32.52.81640
1055.2231511.72.51.61620
Table 2. Weight (in grams) of each component in the synthetic slag after smelting.
SampleWeight Percentage of Each Component
TiO2Ti2O3FeOMgOMnOSiO2Al2O3
162.4726.765.020.531.481.502.25
267.1621.406.480.711.631.111.51
366.3924.382.981.121.841.291.99
460.6822.547.374.930.571.872.04
562.0722.909.070.822.370.921.85
667.4011.467.038.960.841.492.83
768.8318.331.175.010.973.372.32
868.5816.4210.840.861.270.971.06
959.4515.7513.985.360.342.192.92
1062.9316.1214.620.991.671.731.95
Table 3. Phases in weight (percentage) detected by X-ray powder diffraction (XRD) for each sample using the Rietfeld refinement.
SlagPhases (wt%)
PseudobrookiteSilicateRutileIlmeniteTitanium OxideIron Titanium Oxide
151.236.0 12.9
264.04.1 5.926.0
357.87.0 35.2
484.812.32.9
568.214.610.3
695.21.03.0
785.17.04.6
851.11.929.0 18.0
988.211.50.3
1078.013.08.6
Table 4. Average composition of different regions in the slag sample 7 obtained with energy dispersive X-ray microscopy (EDS).
PositionTiO2SiO2FeOMgOMnOAl2O3
Pseudobrookite
Outer surface91.04 0.795.740.641.79
Center90.77 1.046.22 1.97
Inner Surface91.19 0.885.900.211.83
Silicate
Outer surface24.1455.771.445.524.888.25
Center19.7653.922.907.557.398.48
Inner Surface20.0655.162.207.606.528.46
Table 5. Average composition of different regions in the slag sample 10 obtained with EDS.
PositionTiO2SiO2FeOMgOMnOAl2O3
Pseudobrookite
Outer surface82.14 14.071.051.361.39
Center83.94 12.311.191.111.44
Inner Surface85.10 11.961.370.001.57
Silicate
Outer surface23.6361.367.080.002.675.25
Center14.4869.007.240.002.656.64
Inner Surface14.1764.6011.050.003.276.91
Publisher’s Note: MDPI stays neutral with regard to jurisdictional claims in published maps and institutional affiliations.

