
Evaluation of Structural Behavior and Fatigue Performance of a KR-Type Rail Clip


Abstract
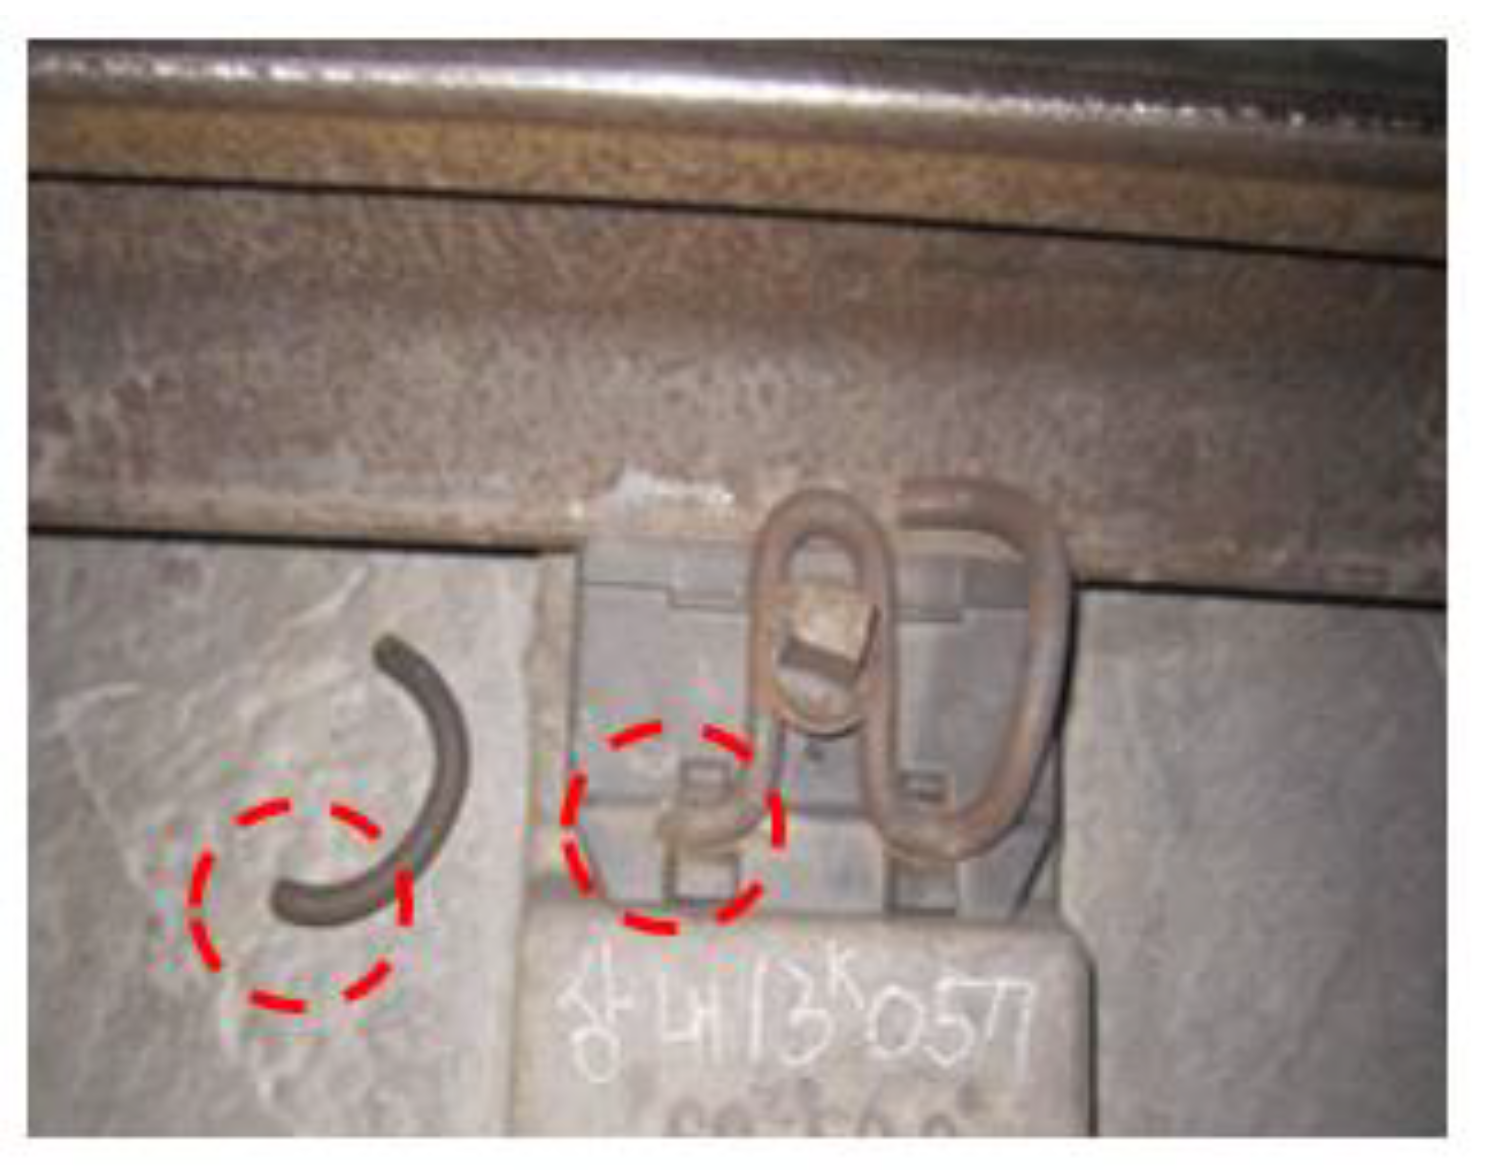
:1. Introduction
2. Laboratory Measurements
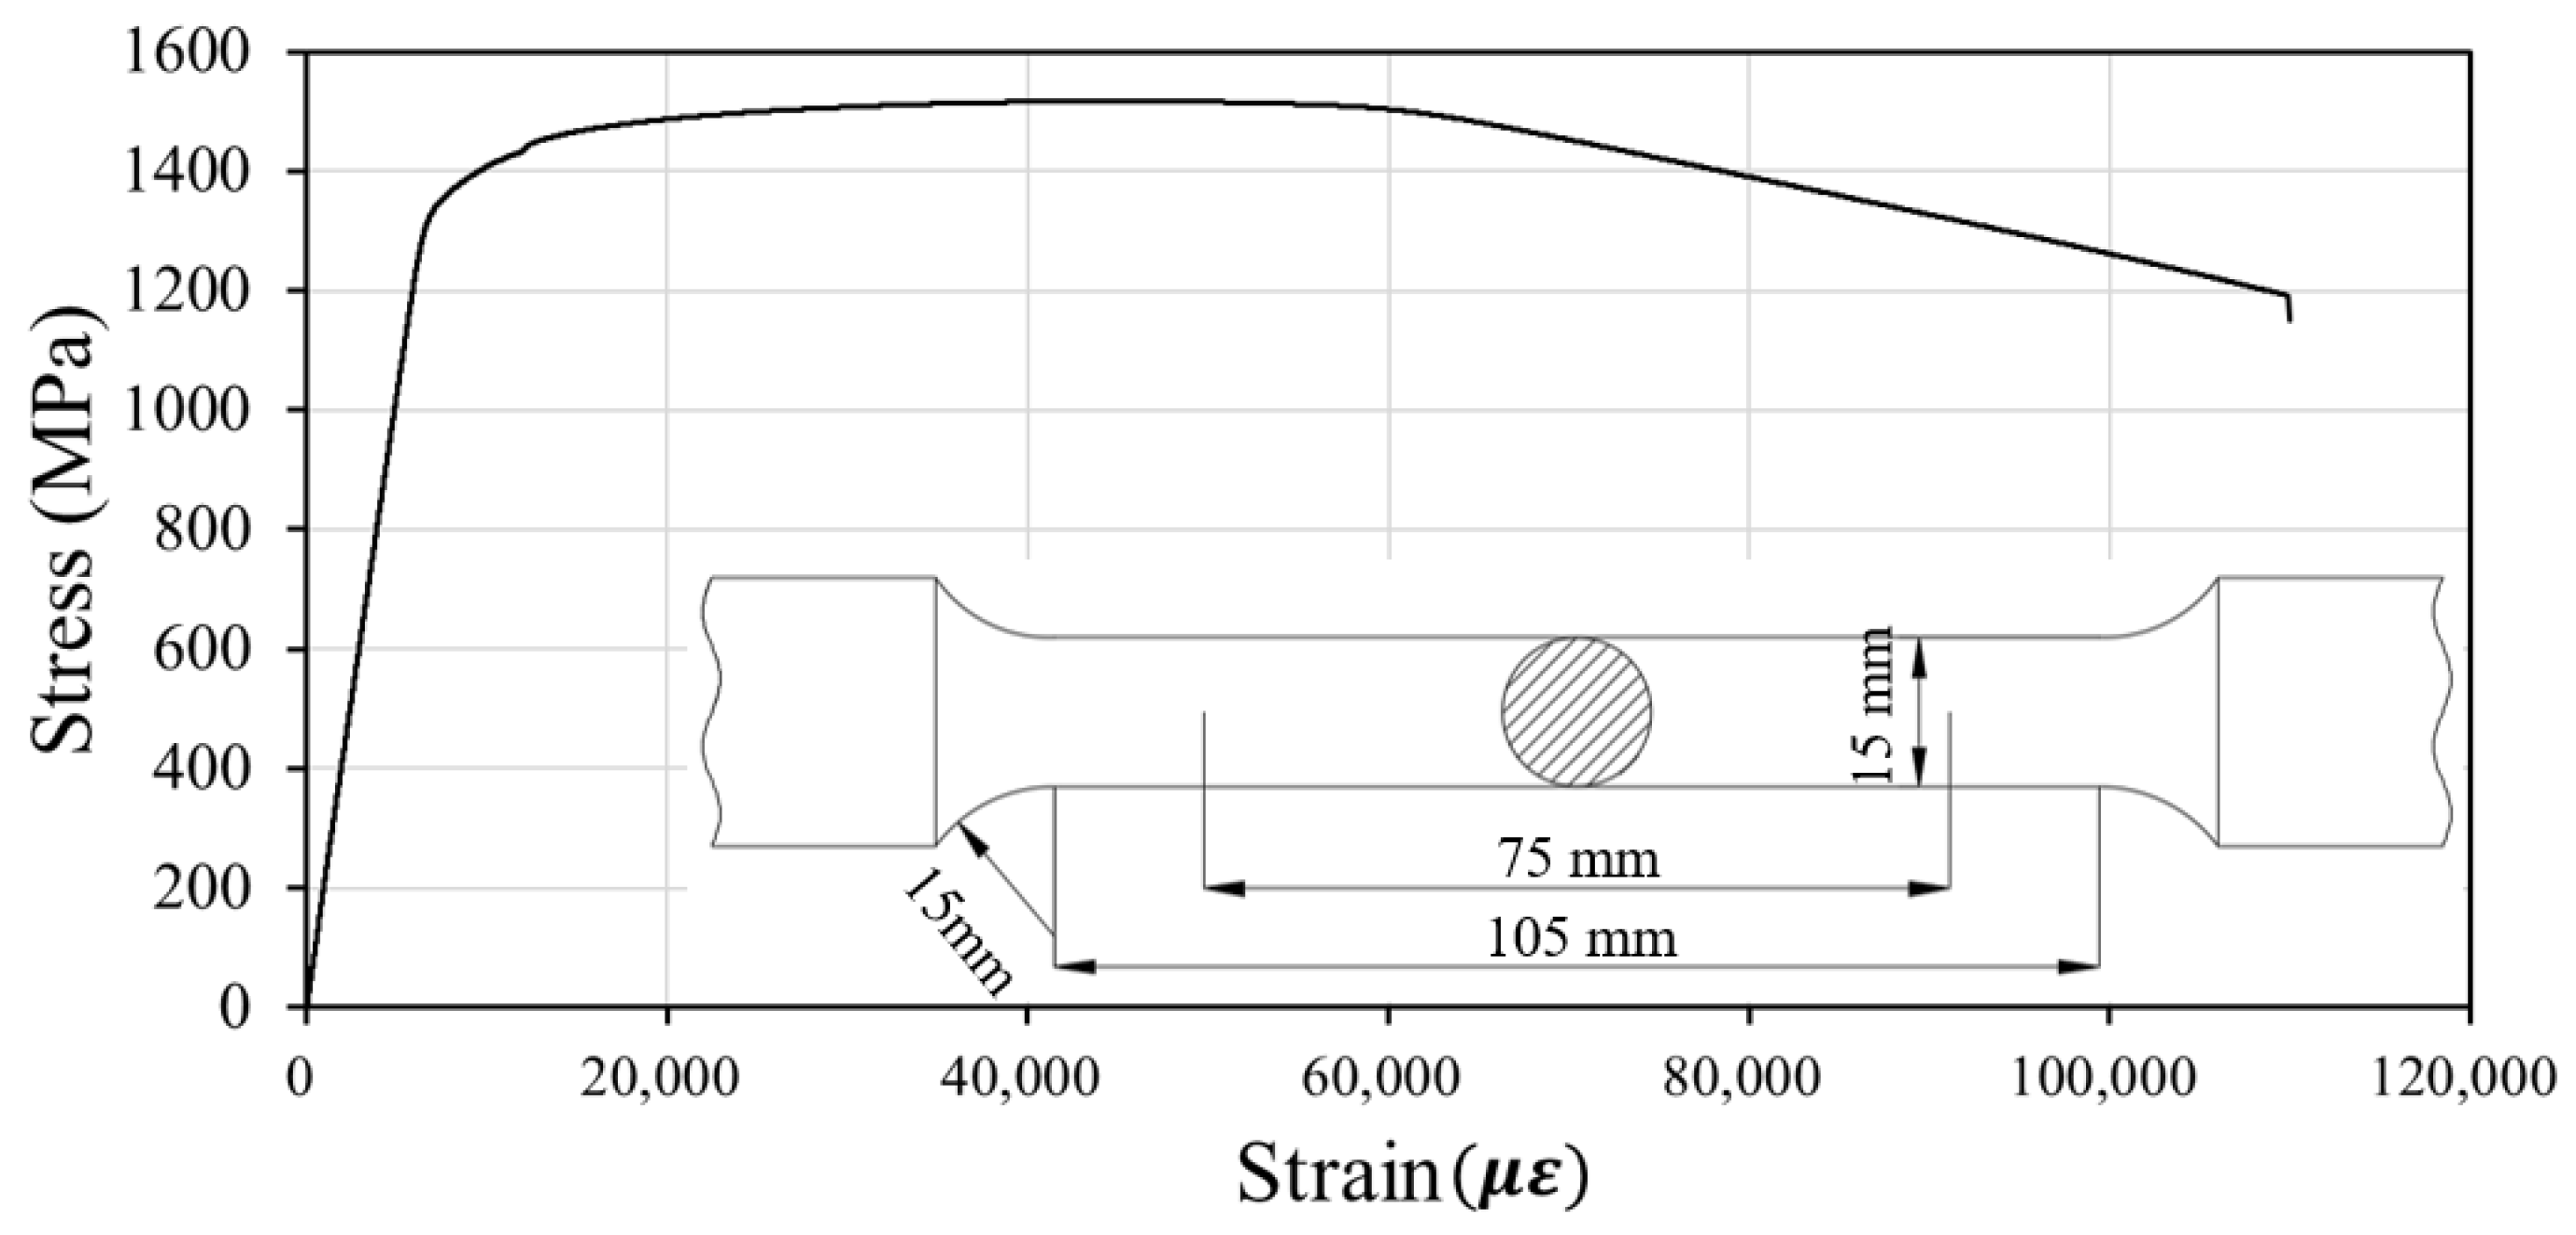
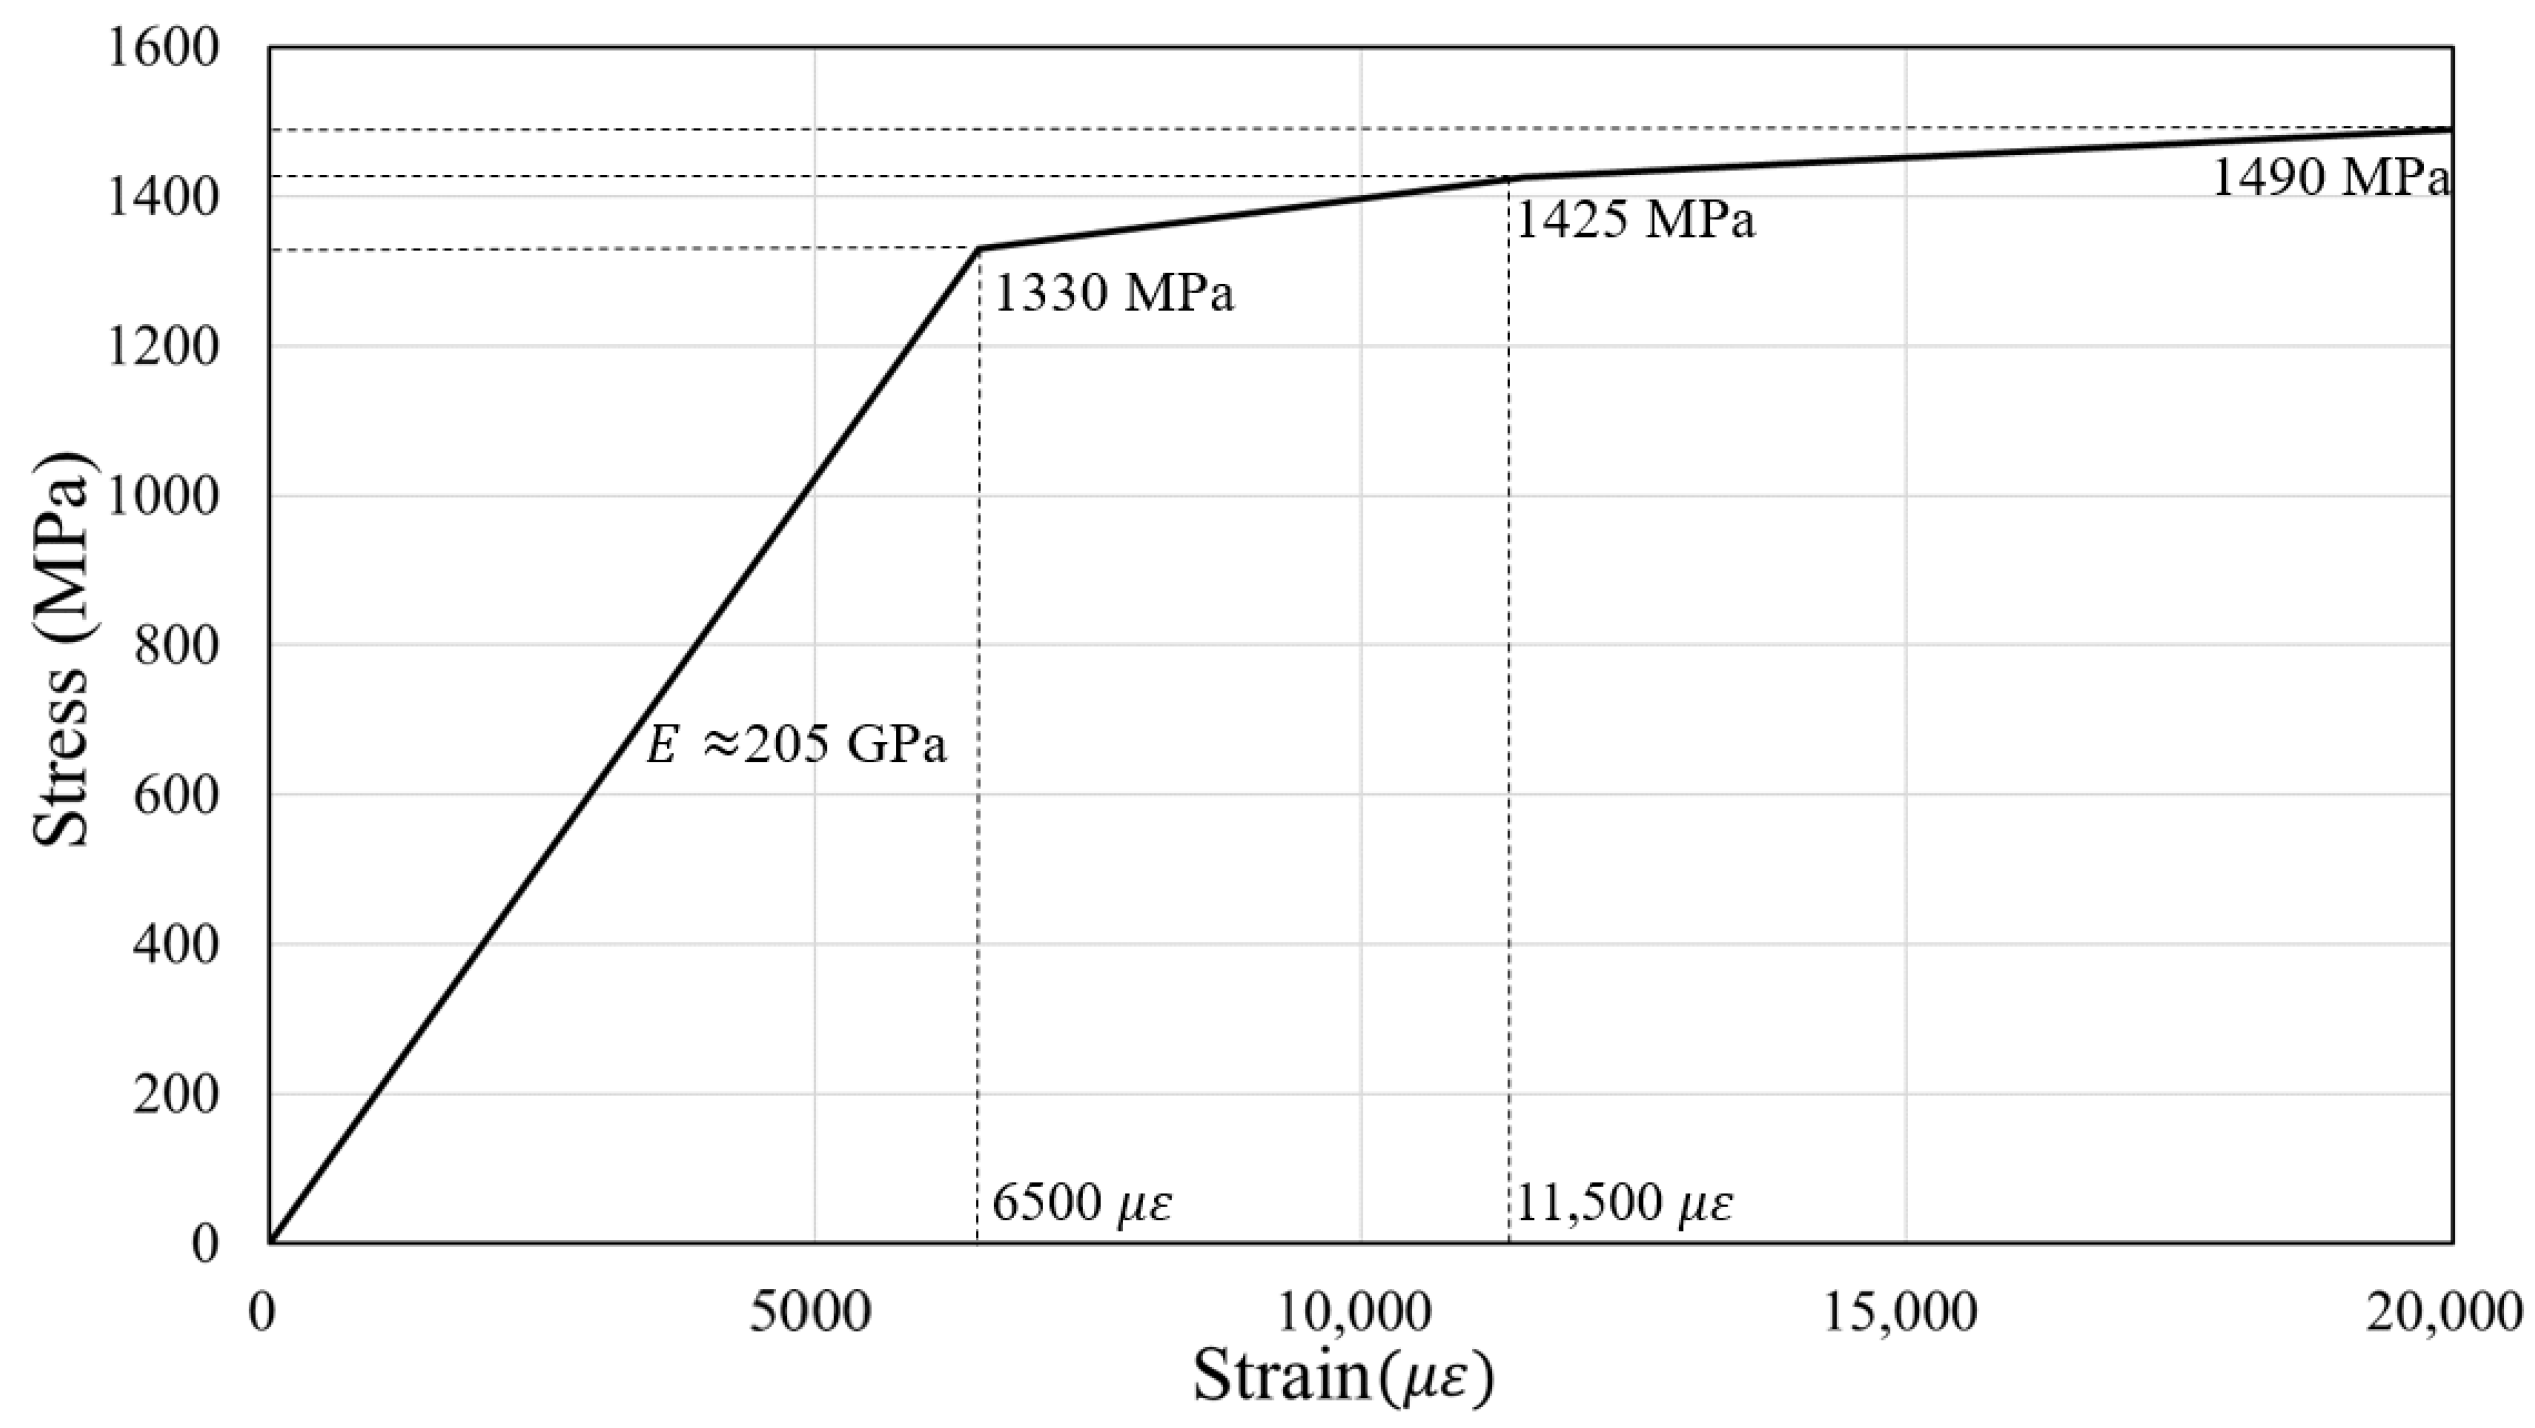
2.1. Tensile Coupon Test
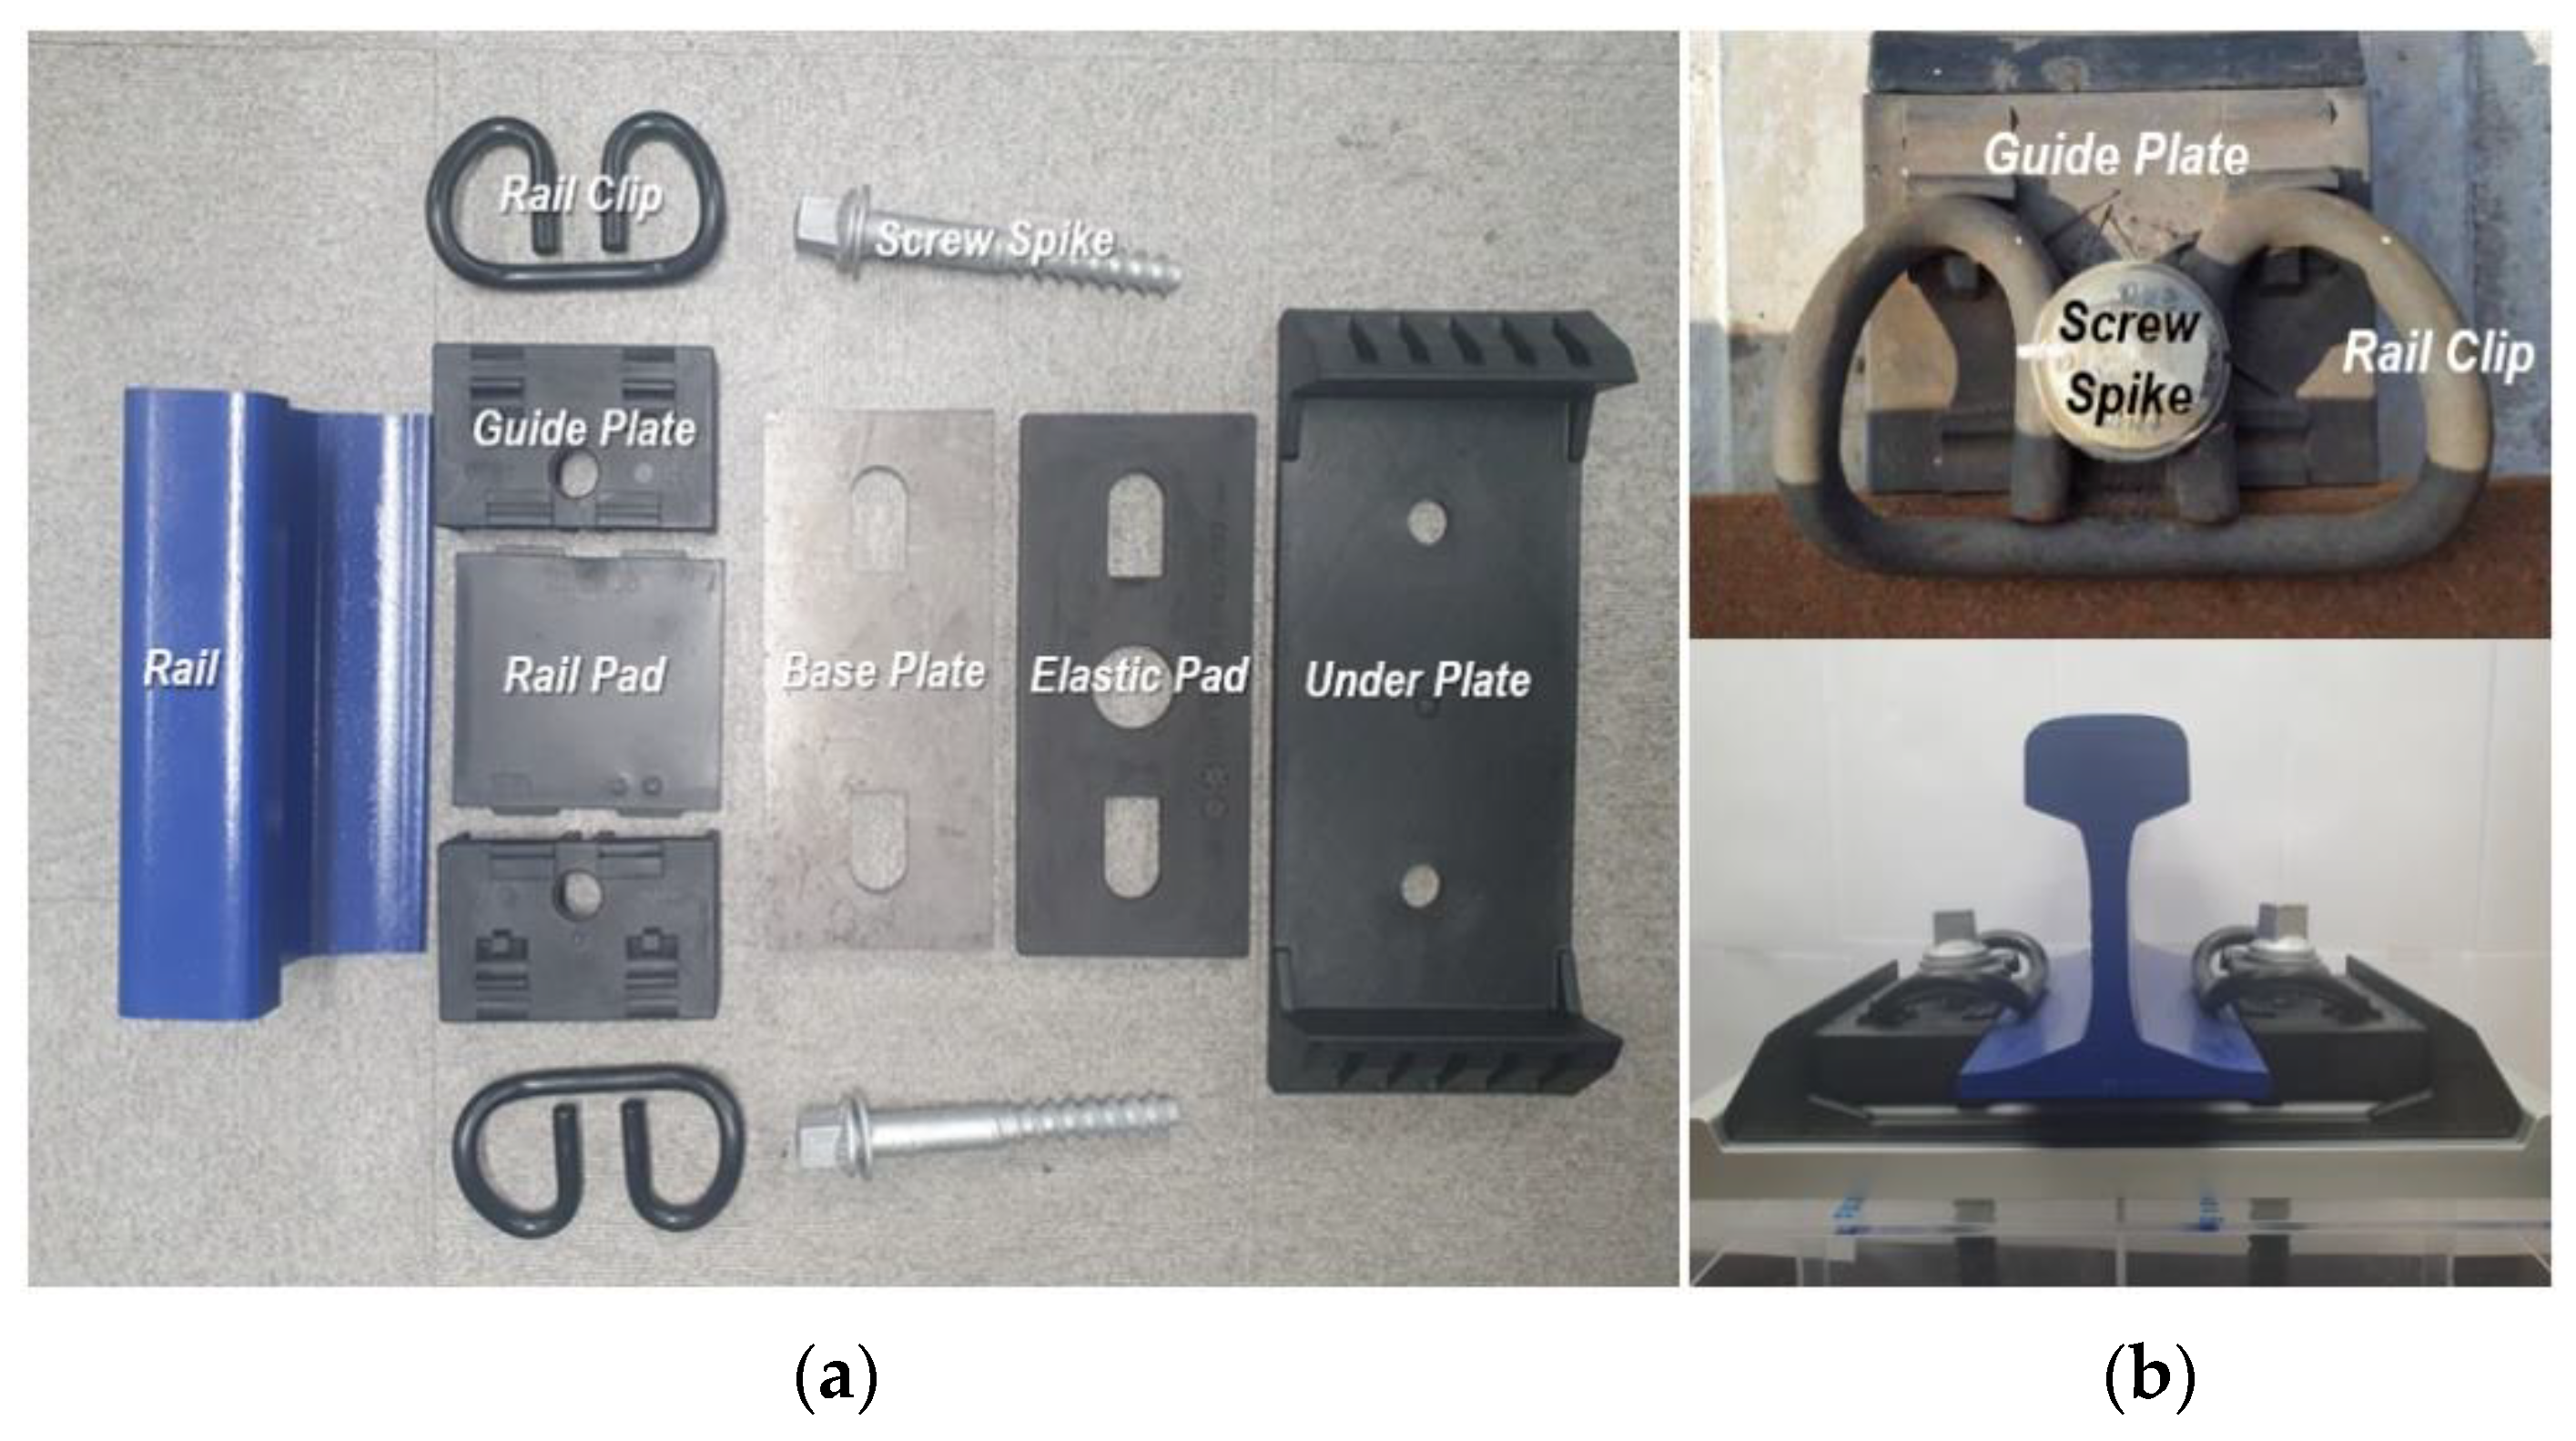
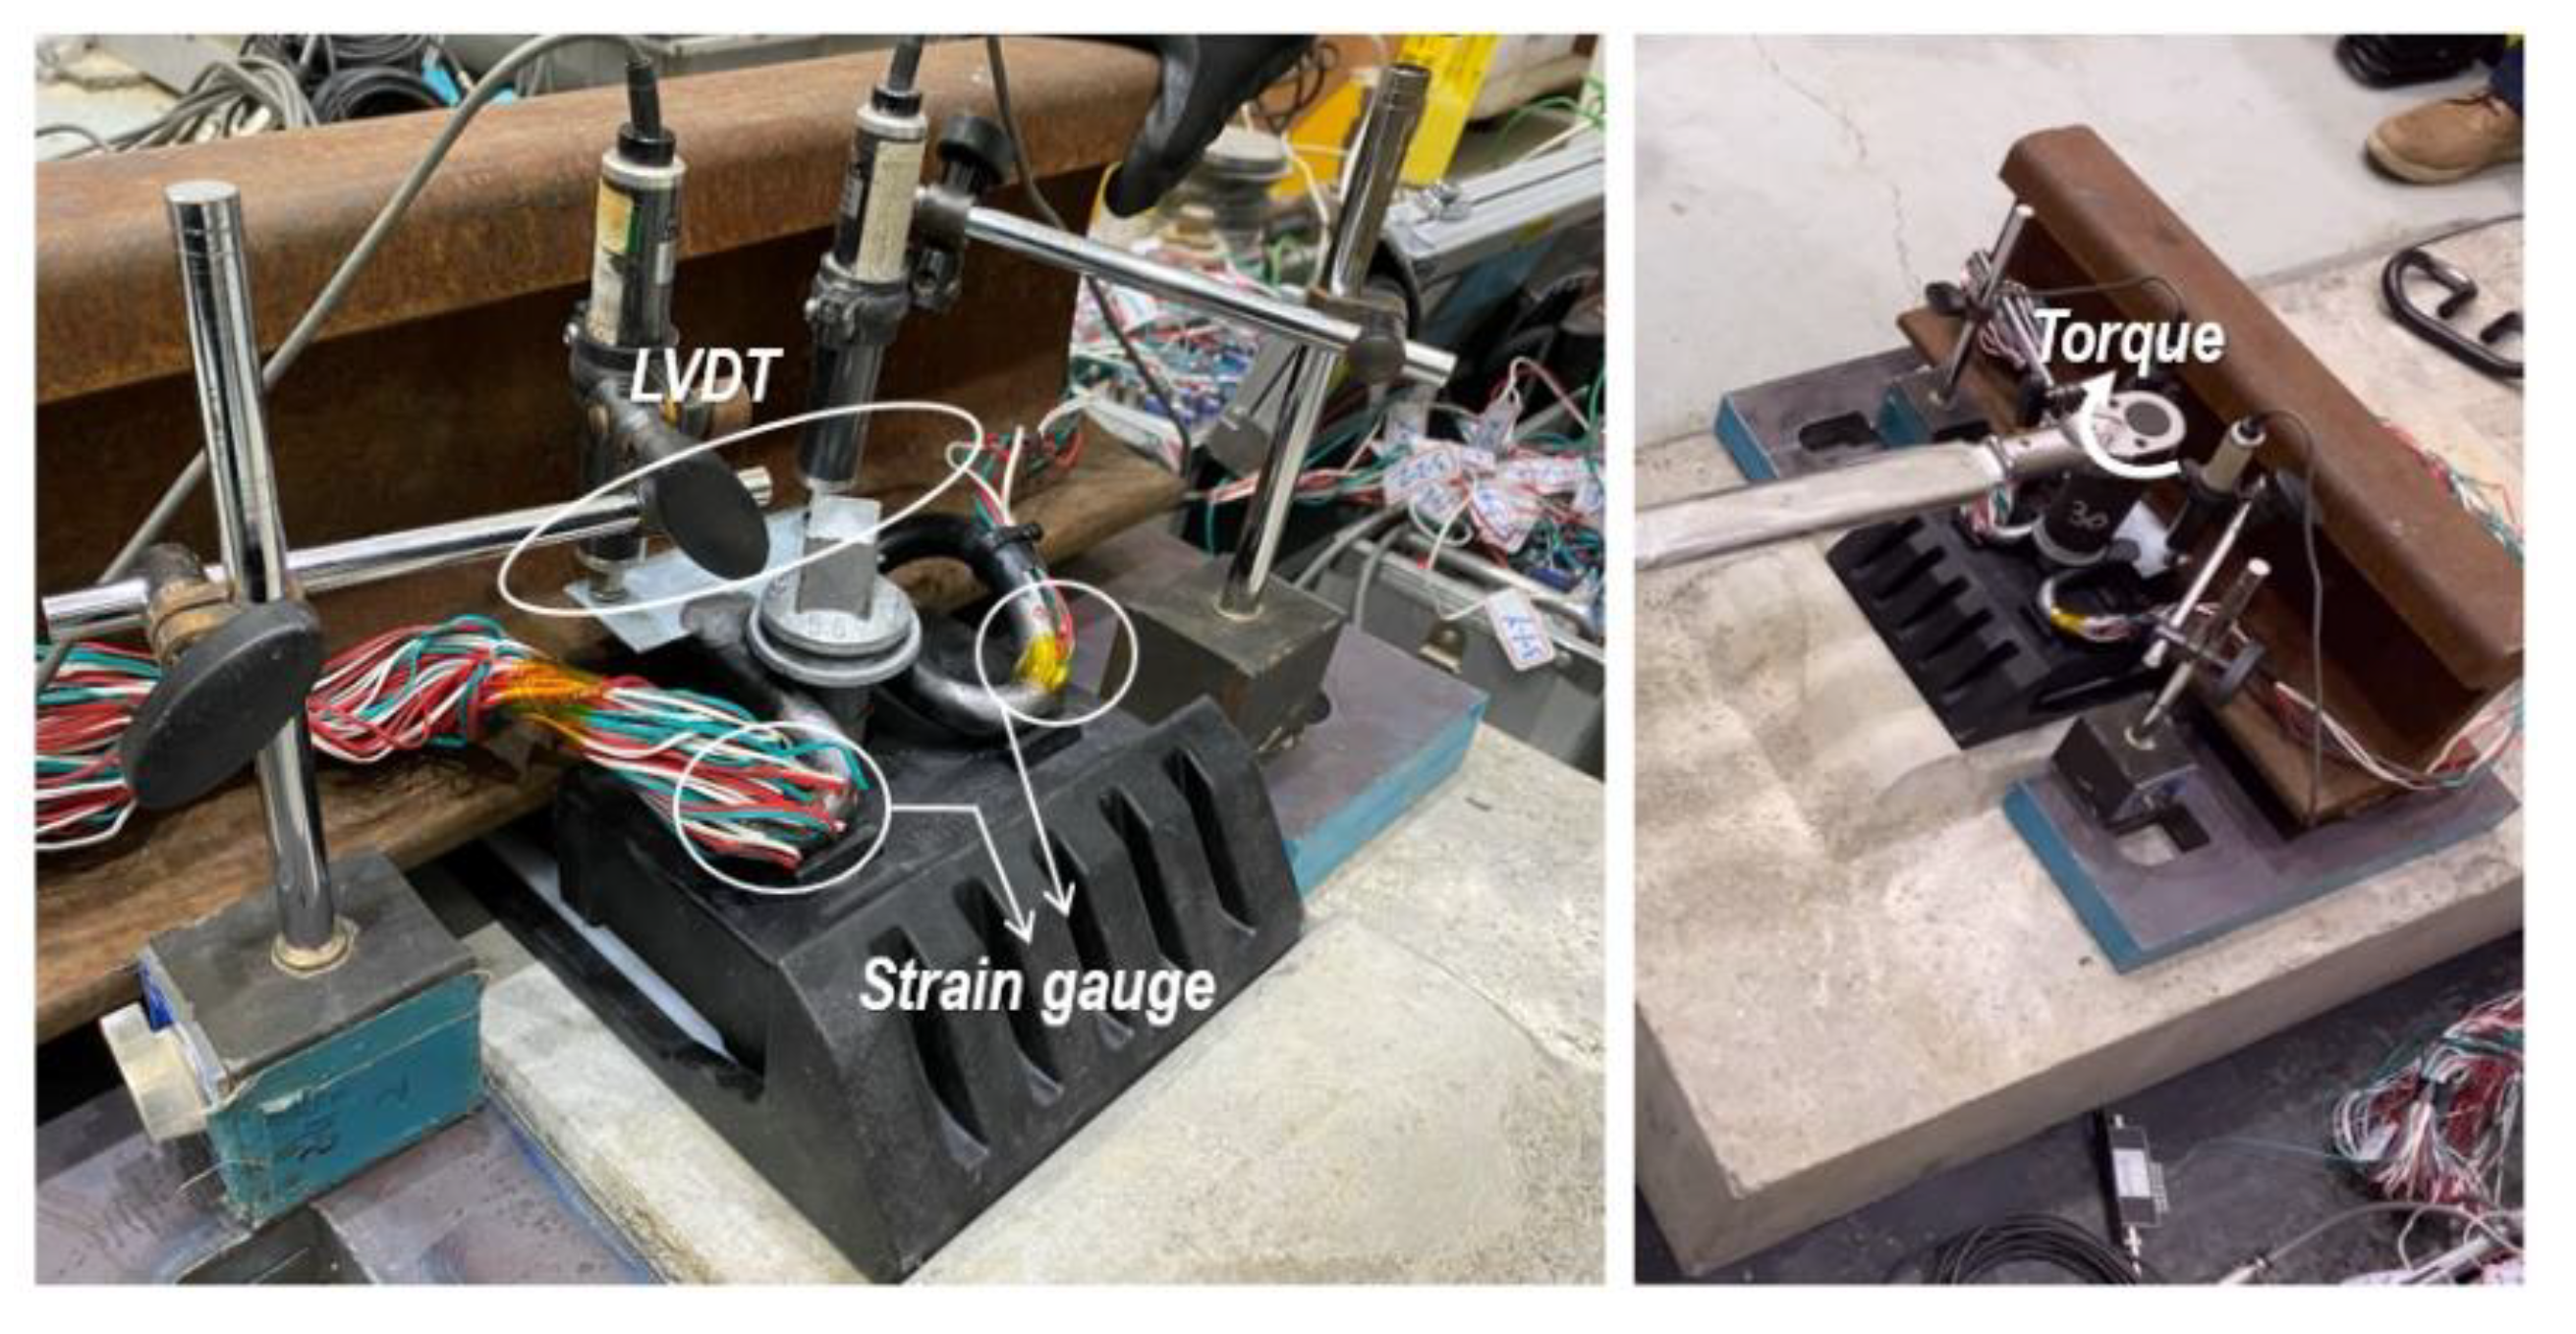
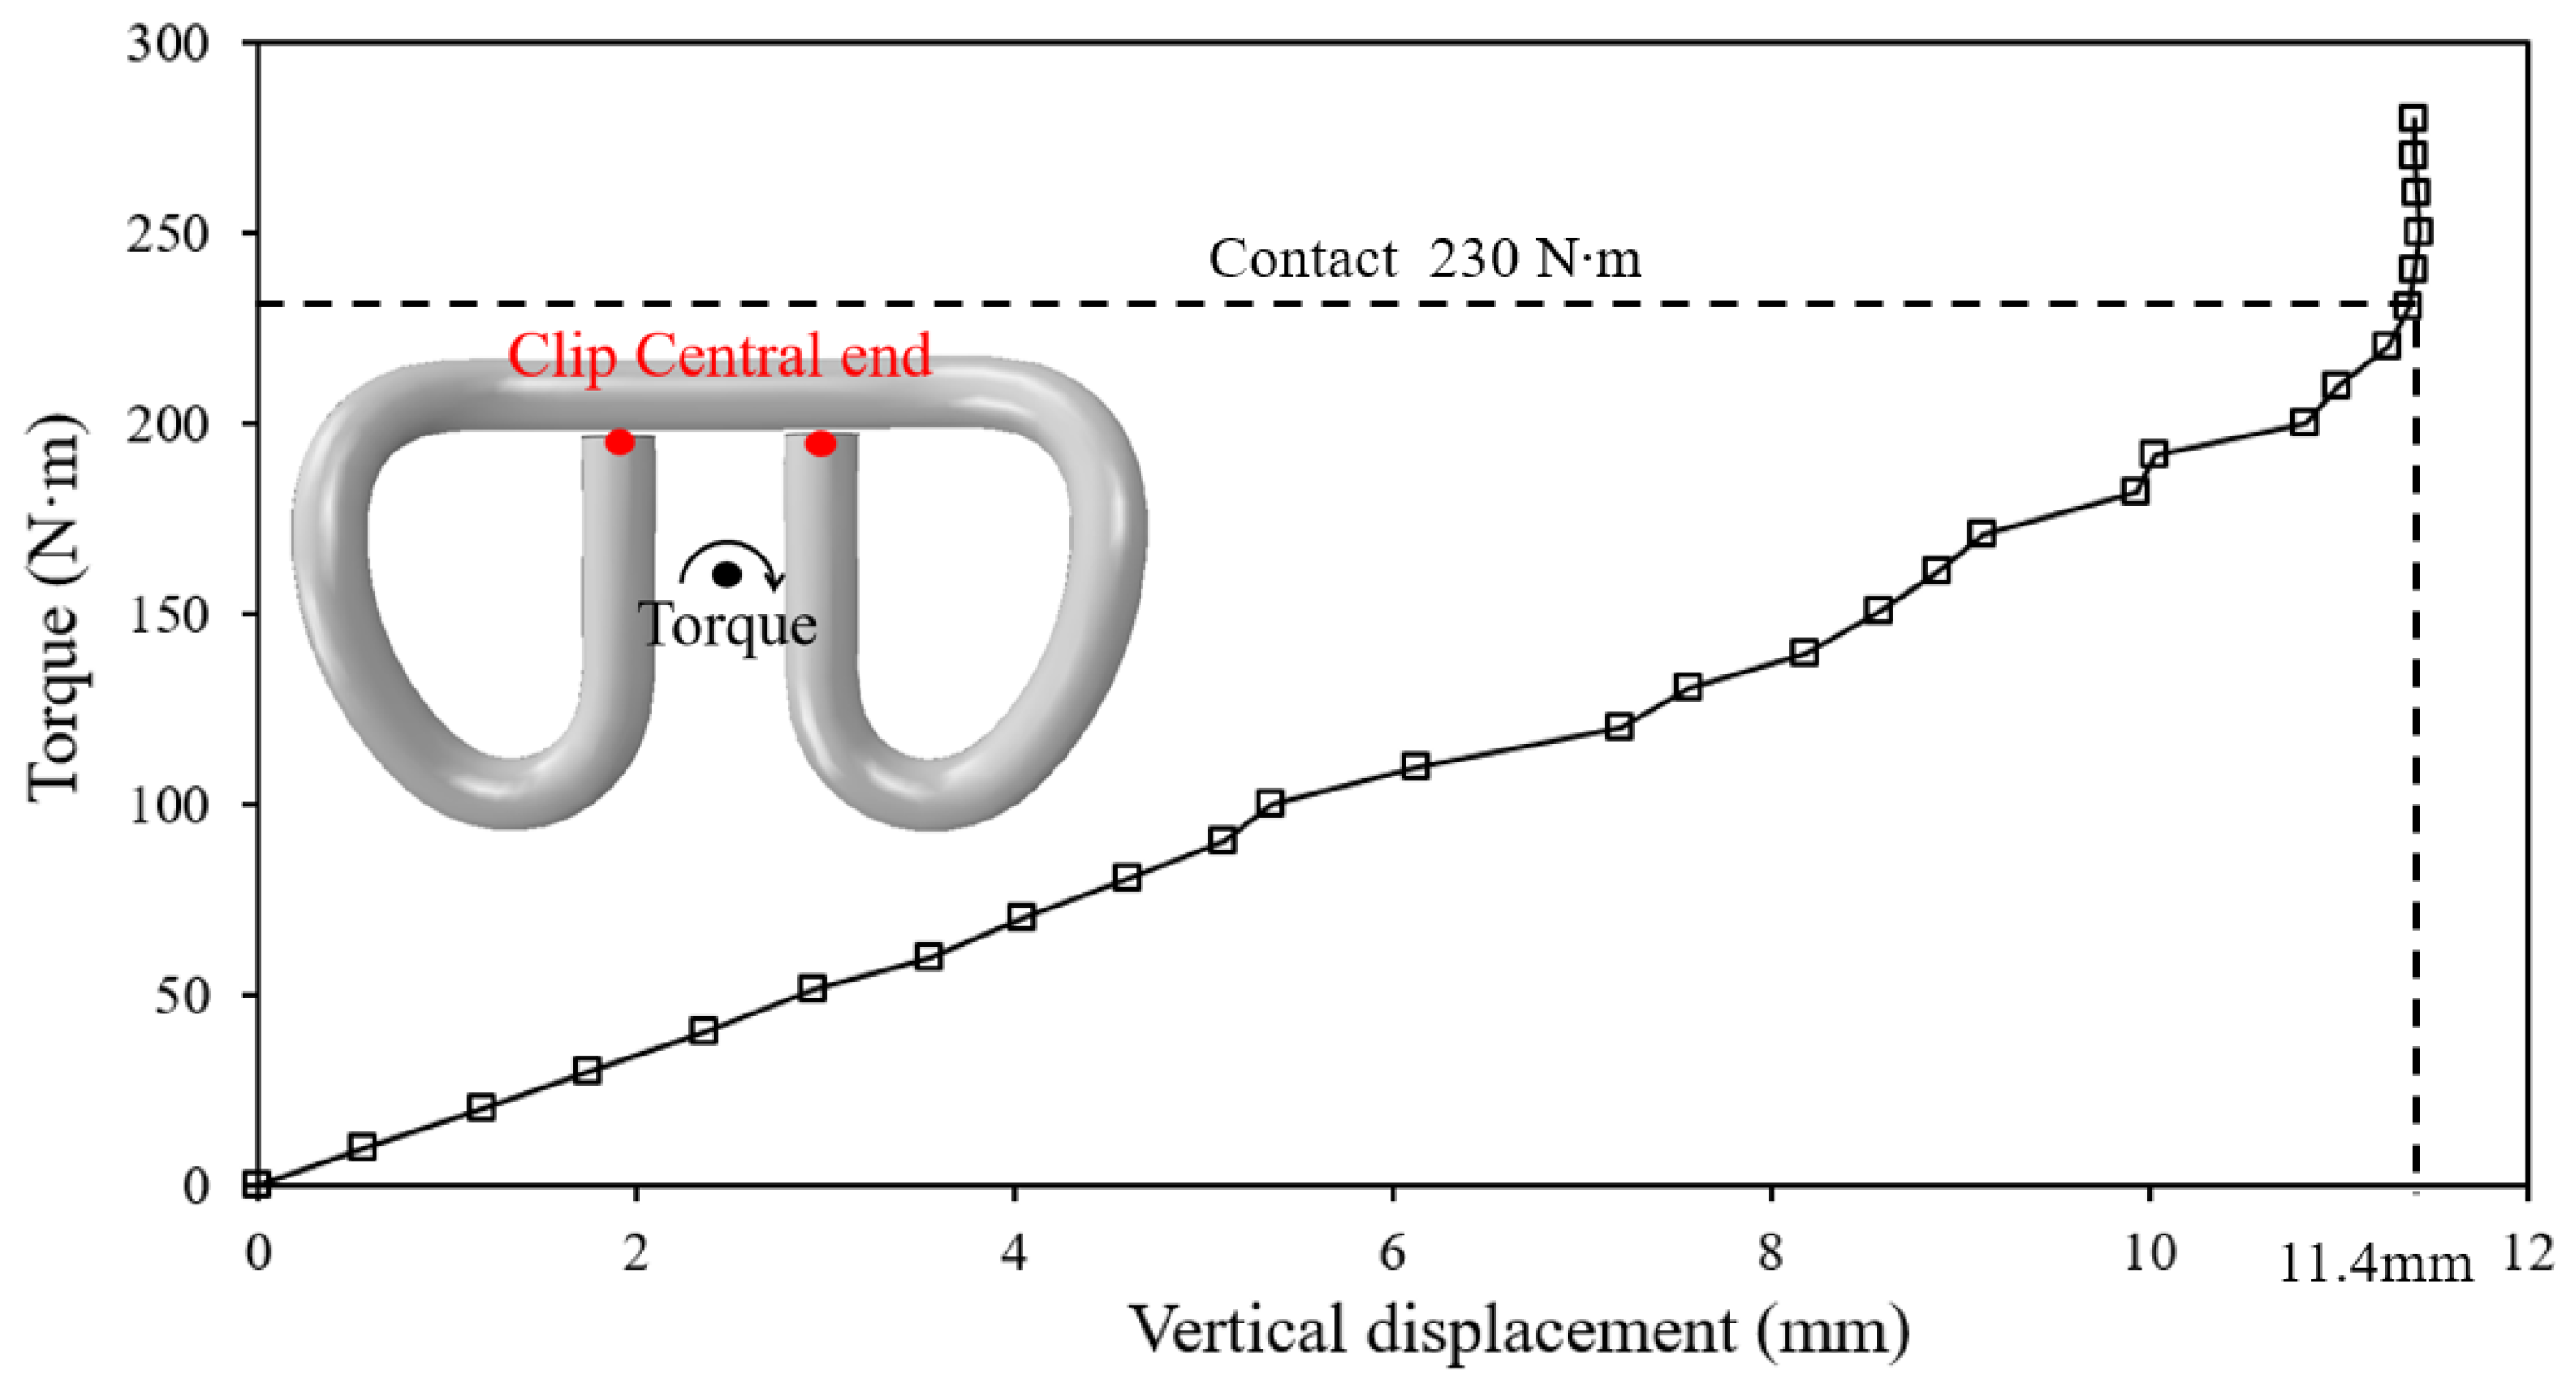
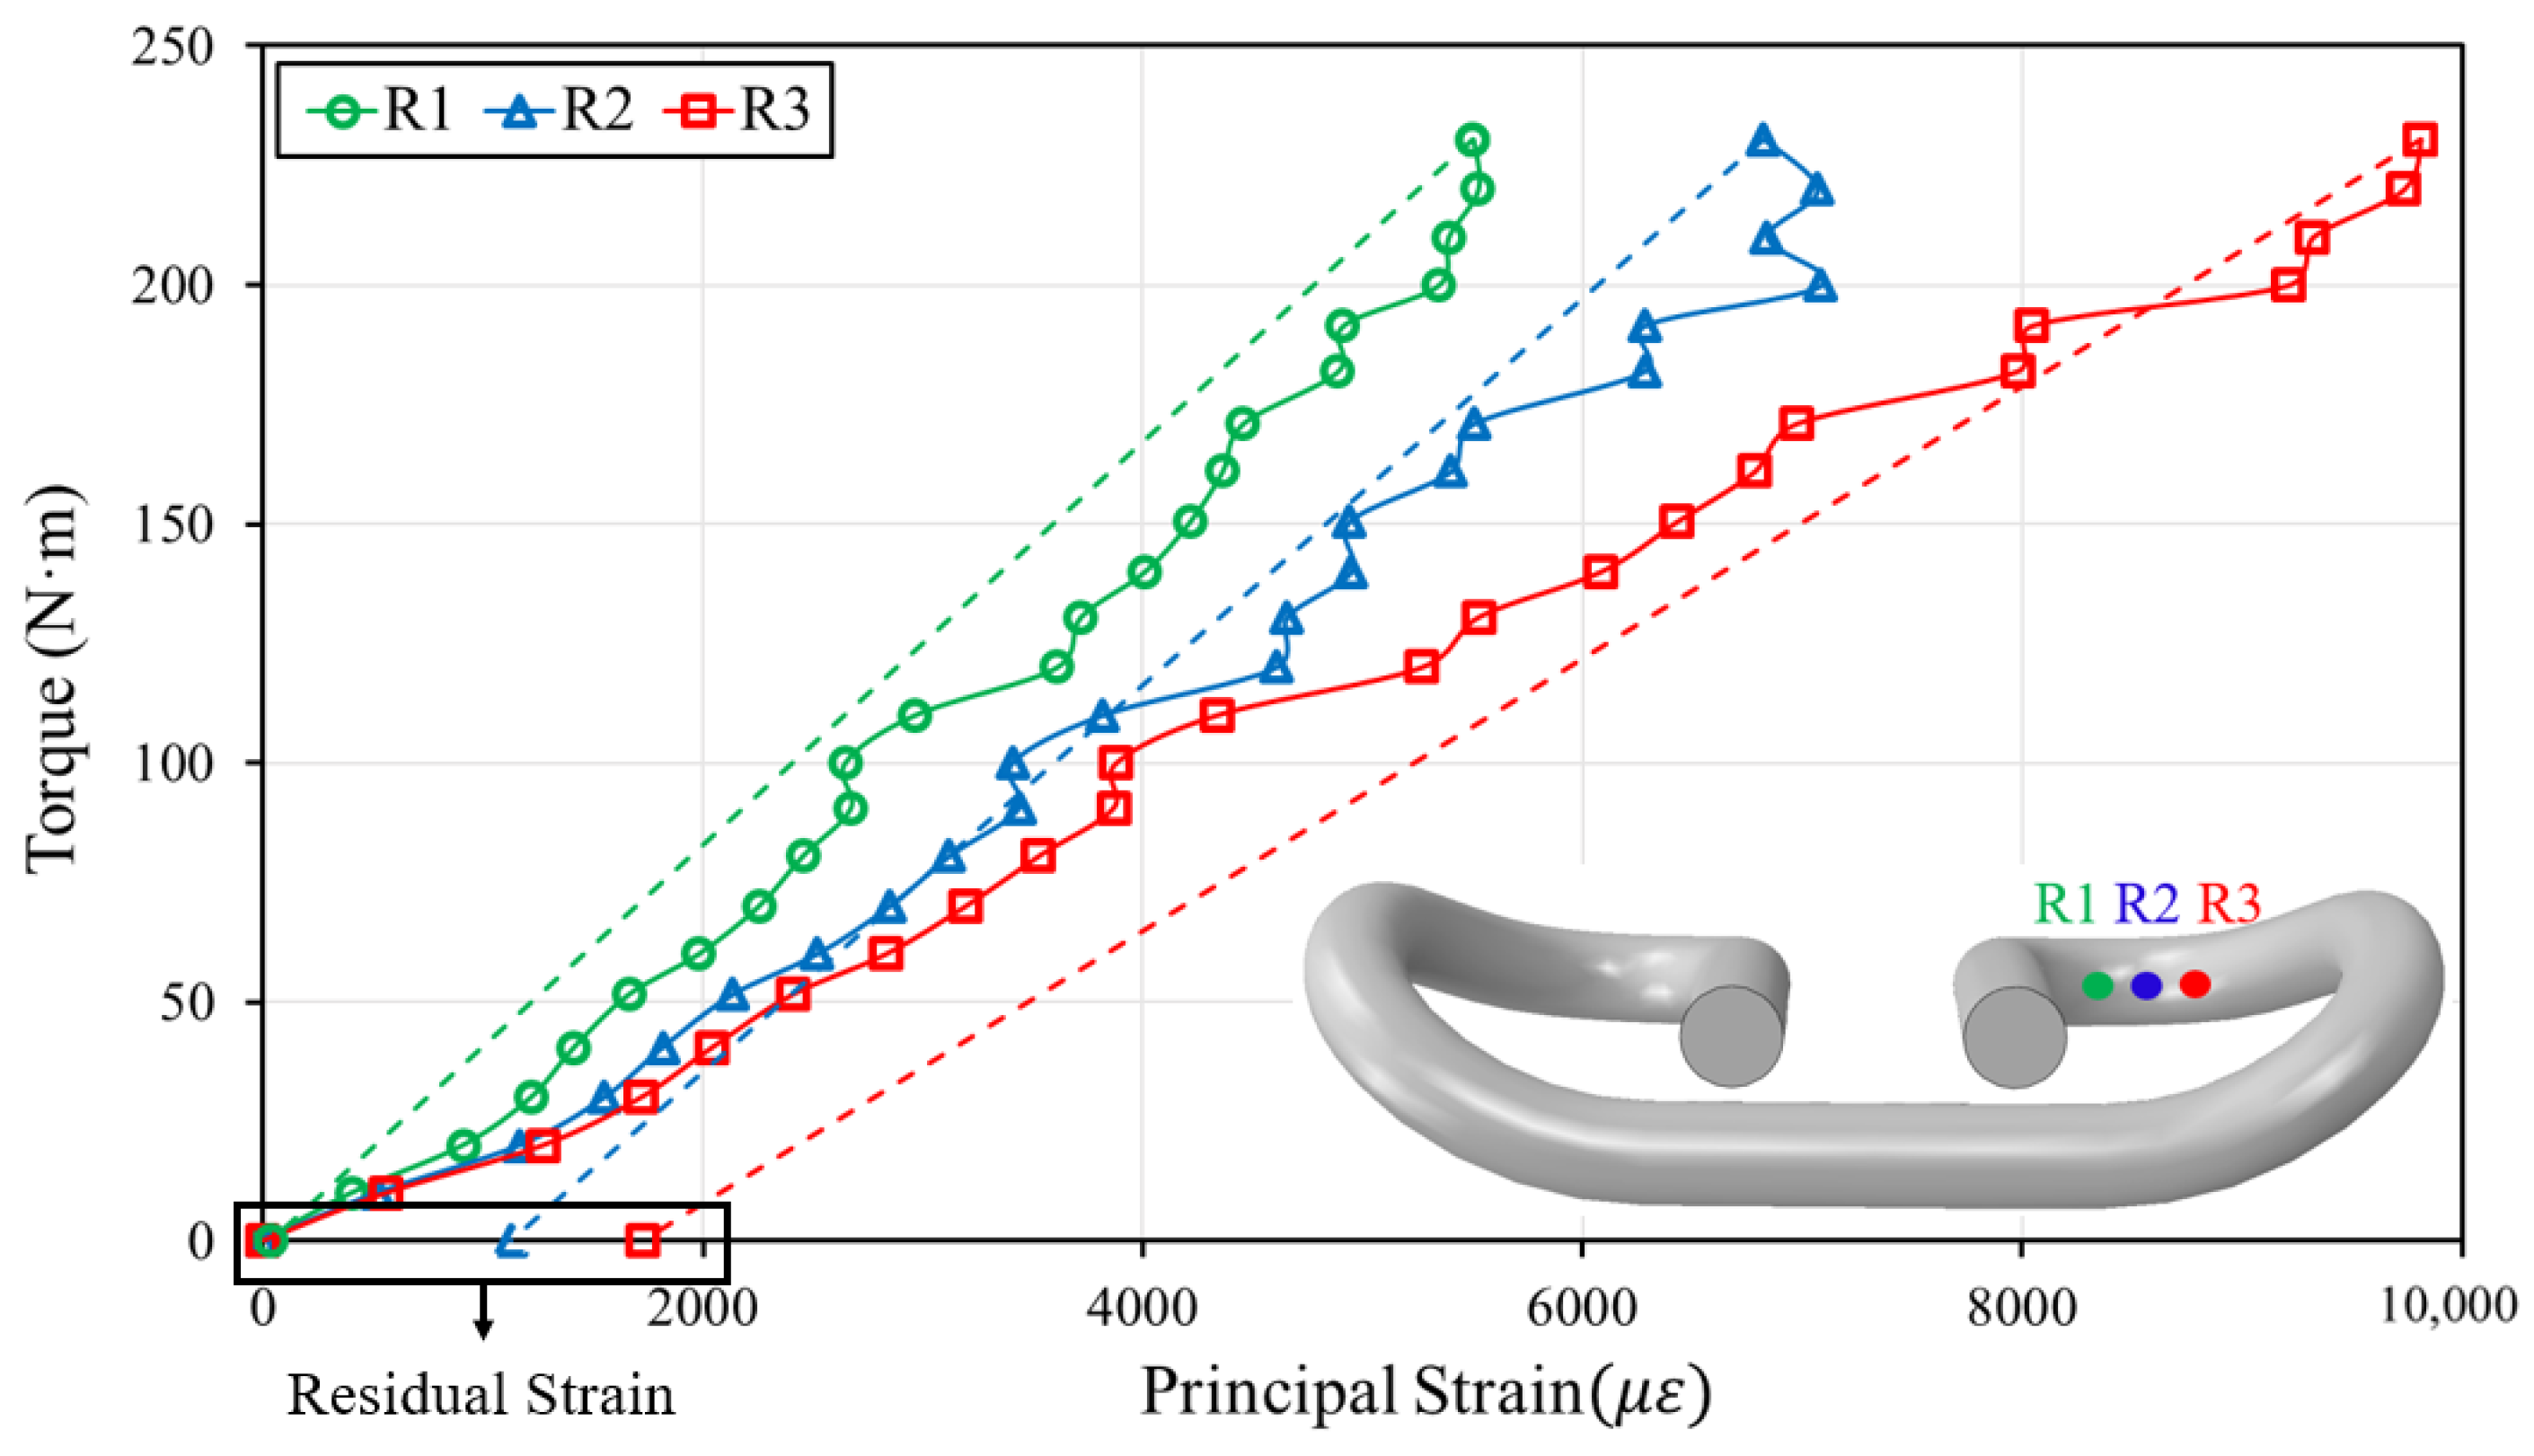
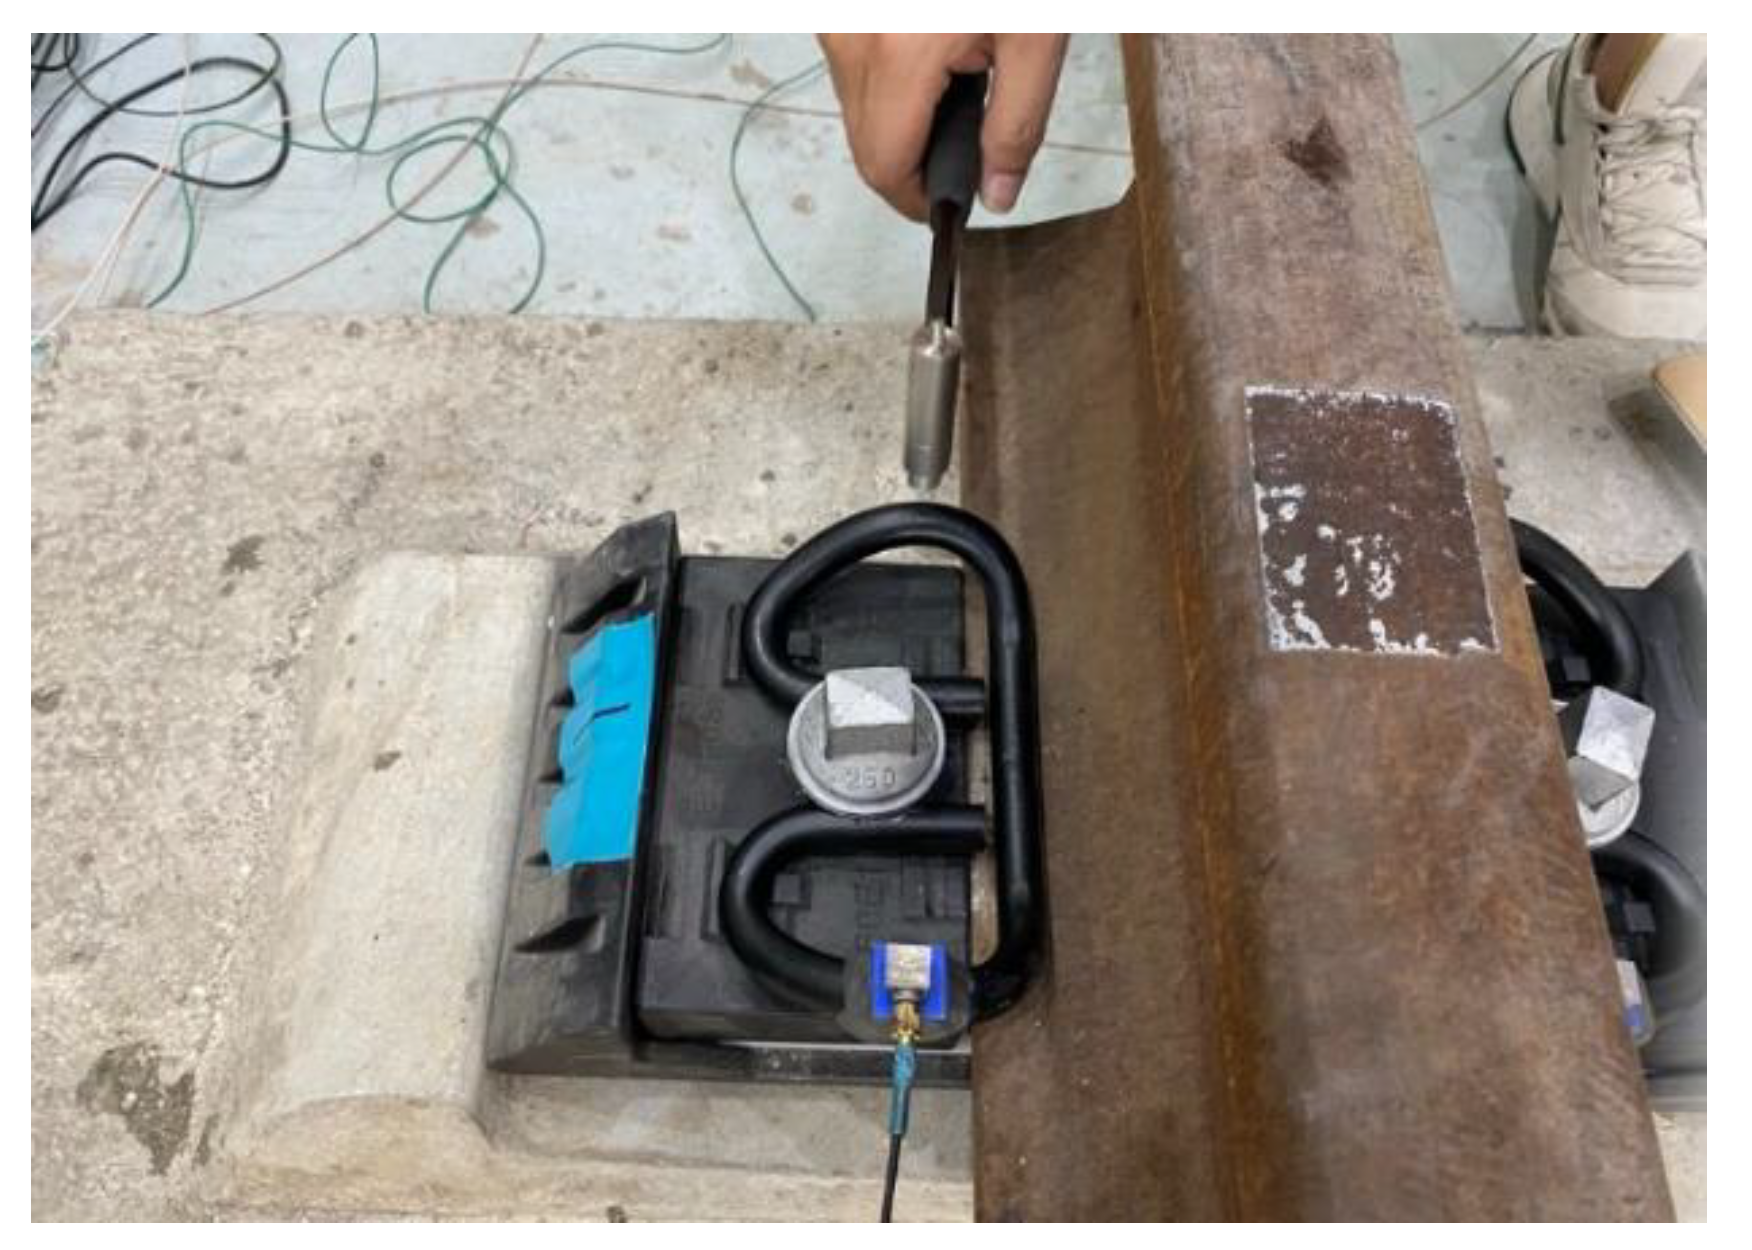
2.2. Assembly Test
3. Finite Element Analysis
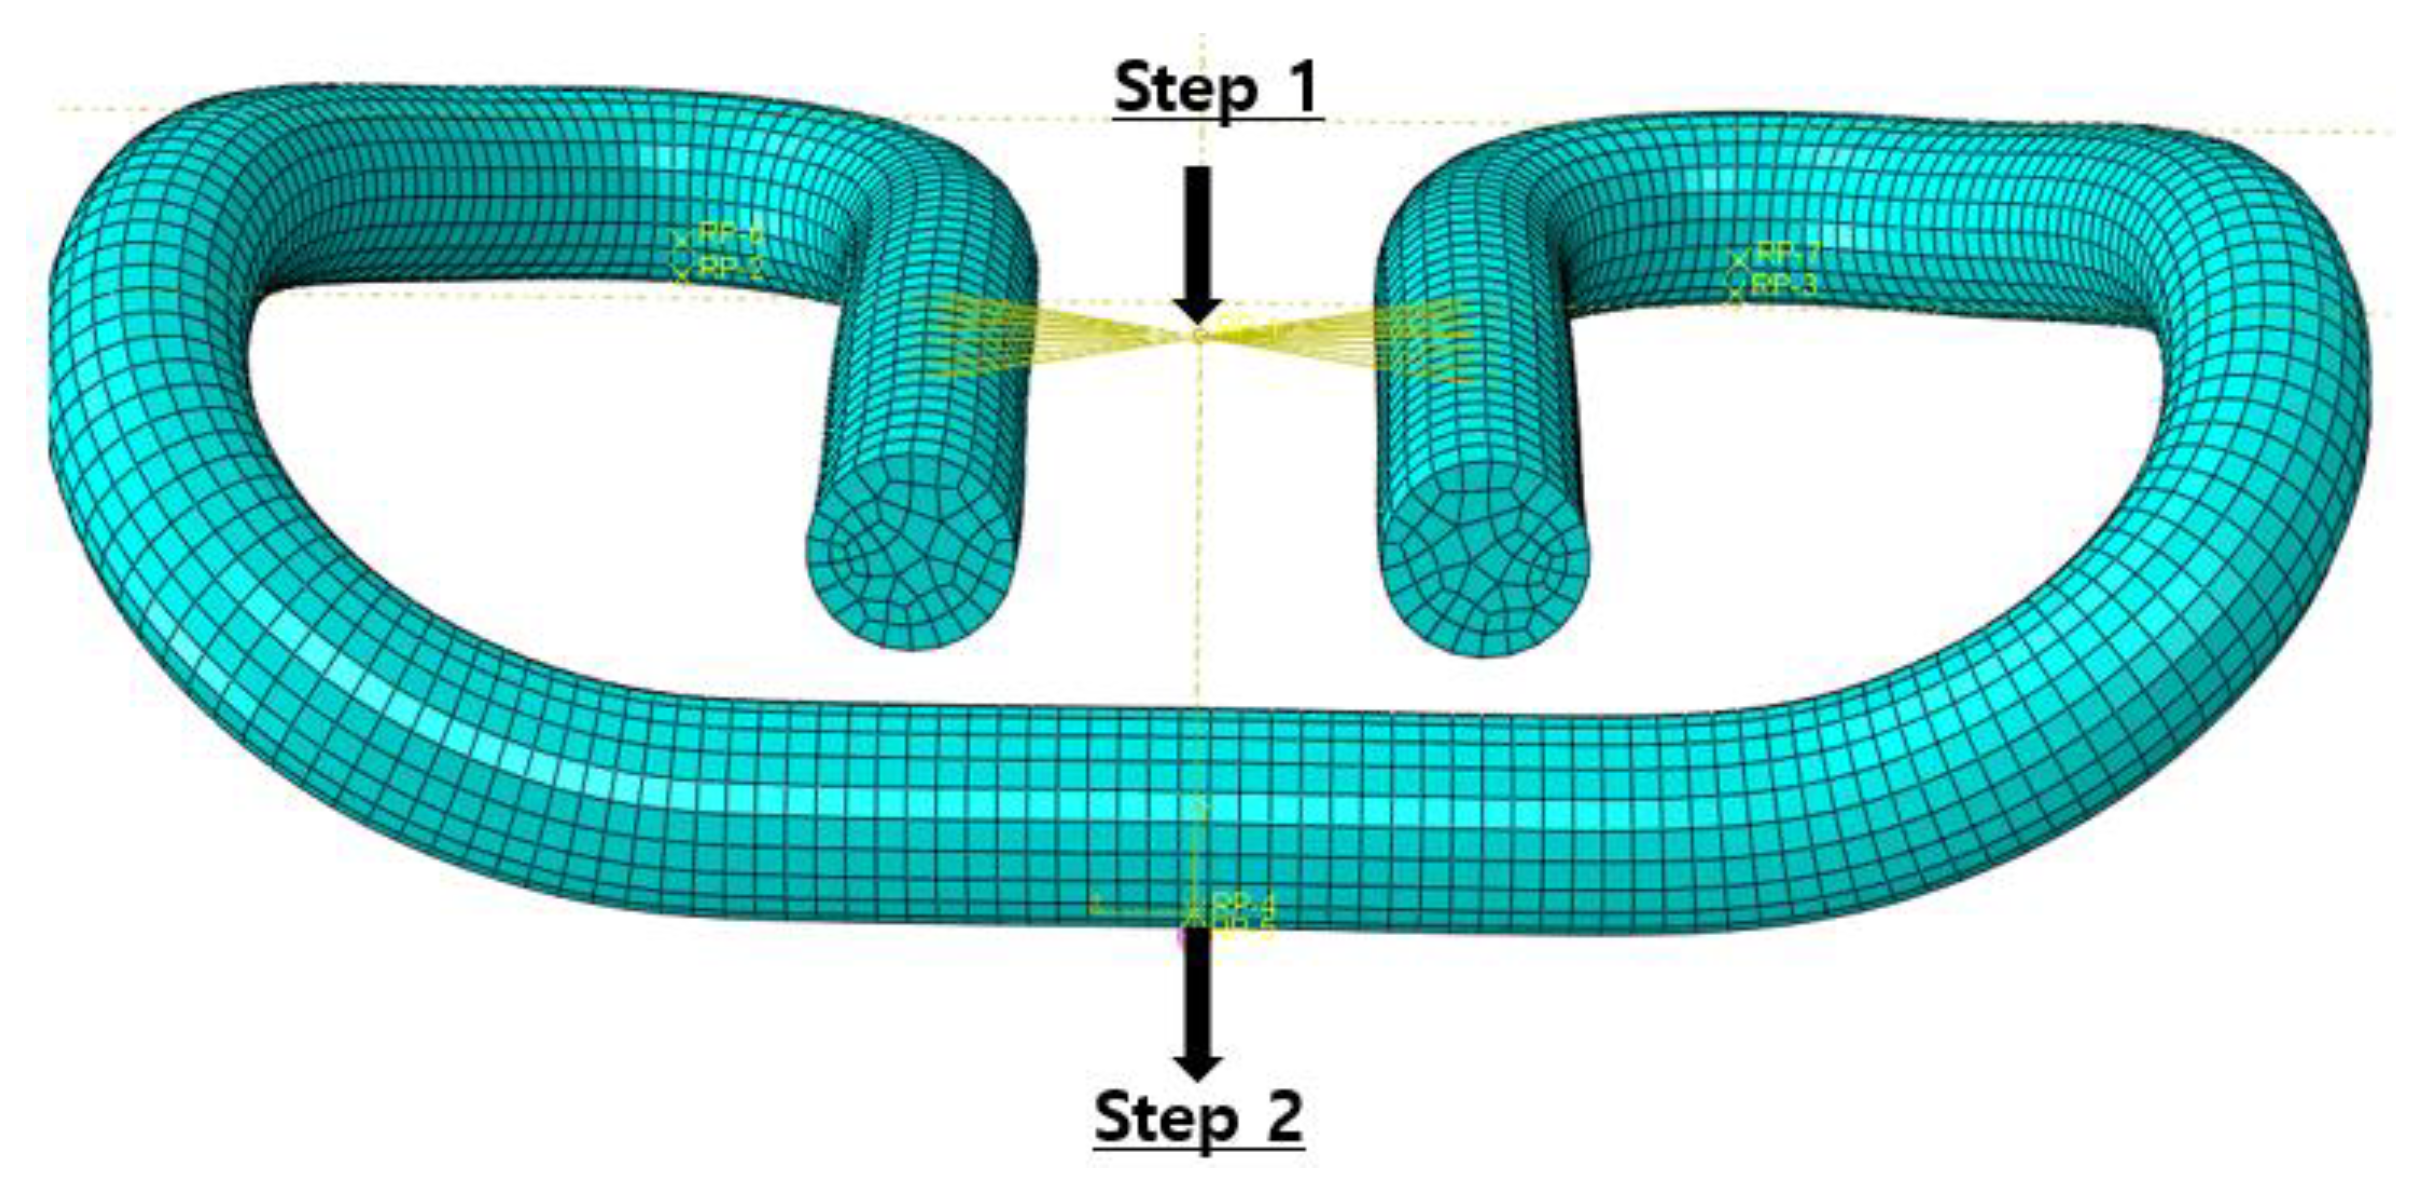
3.1. Modeling Details
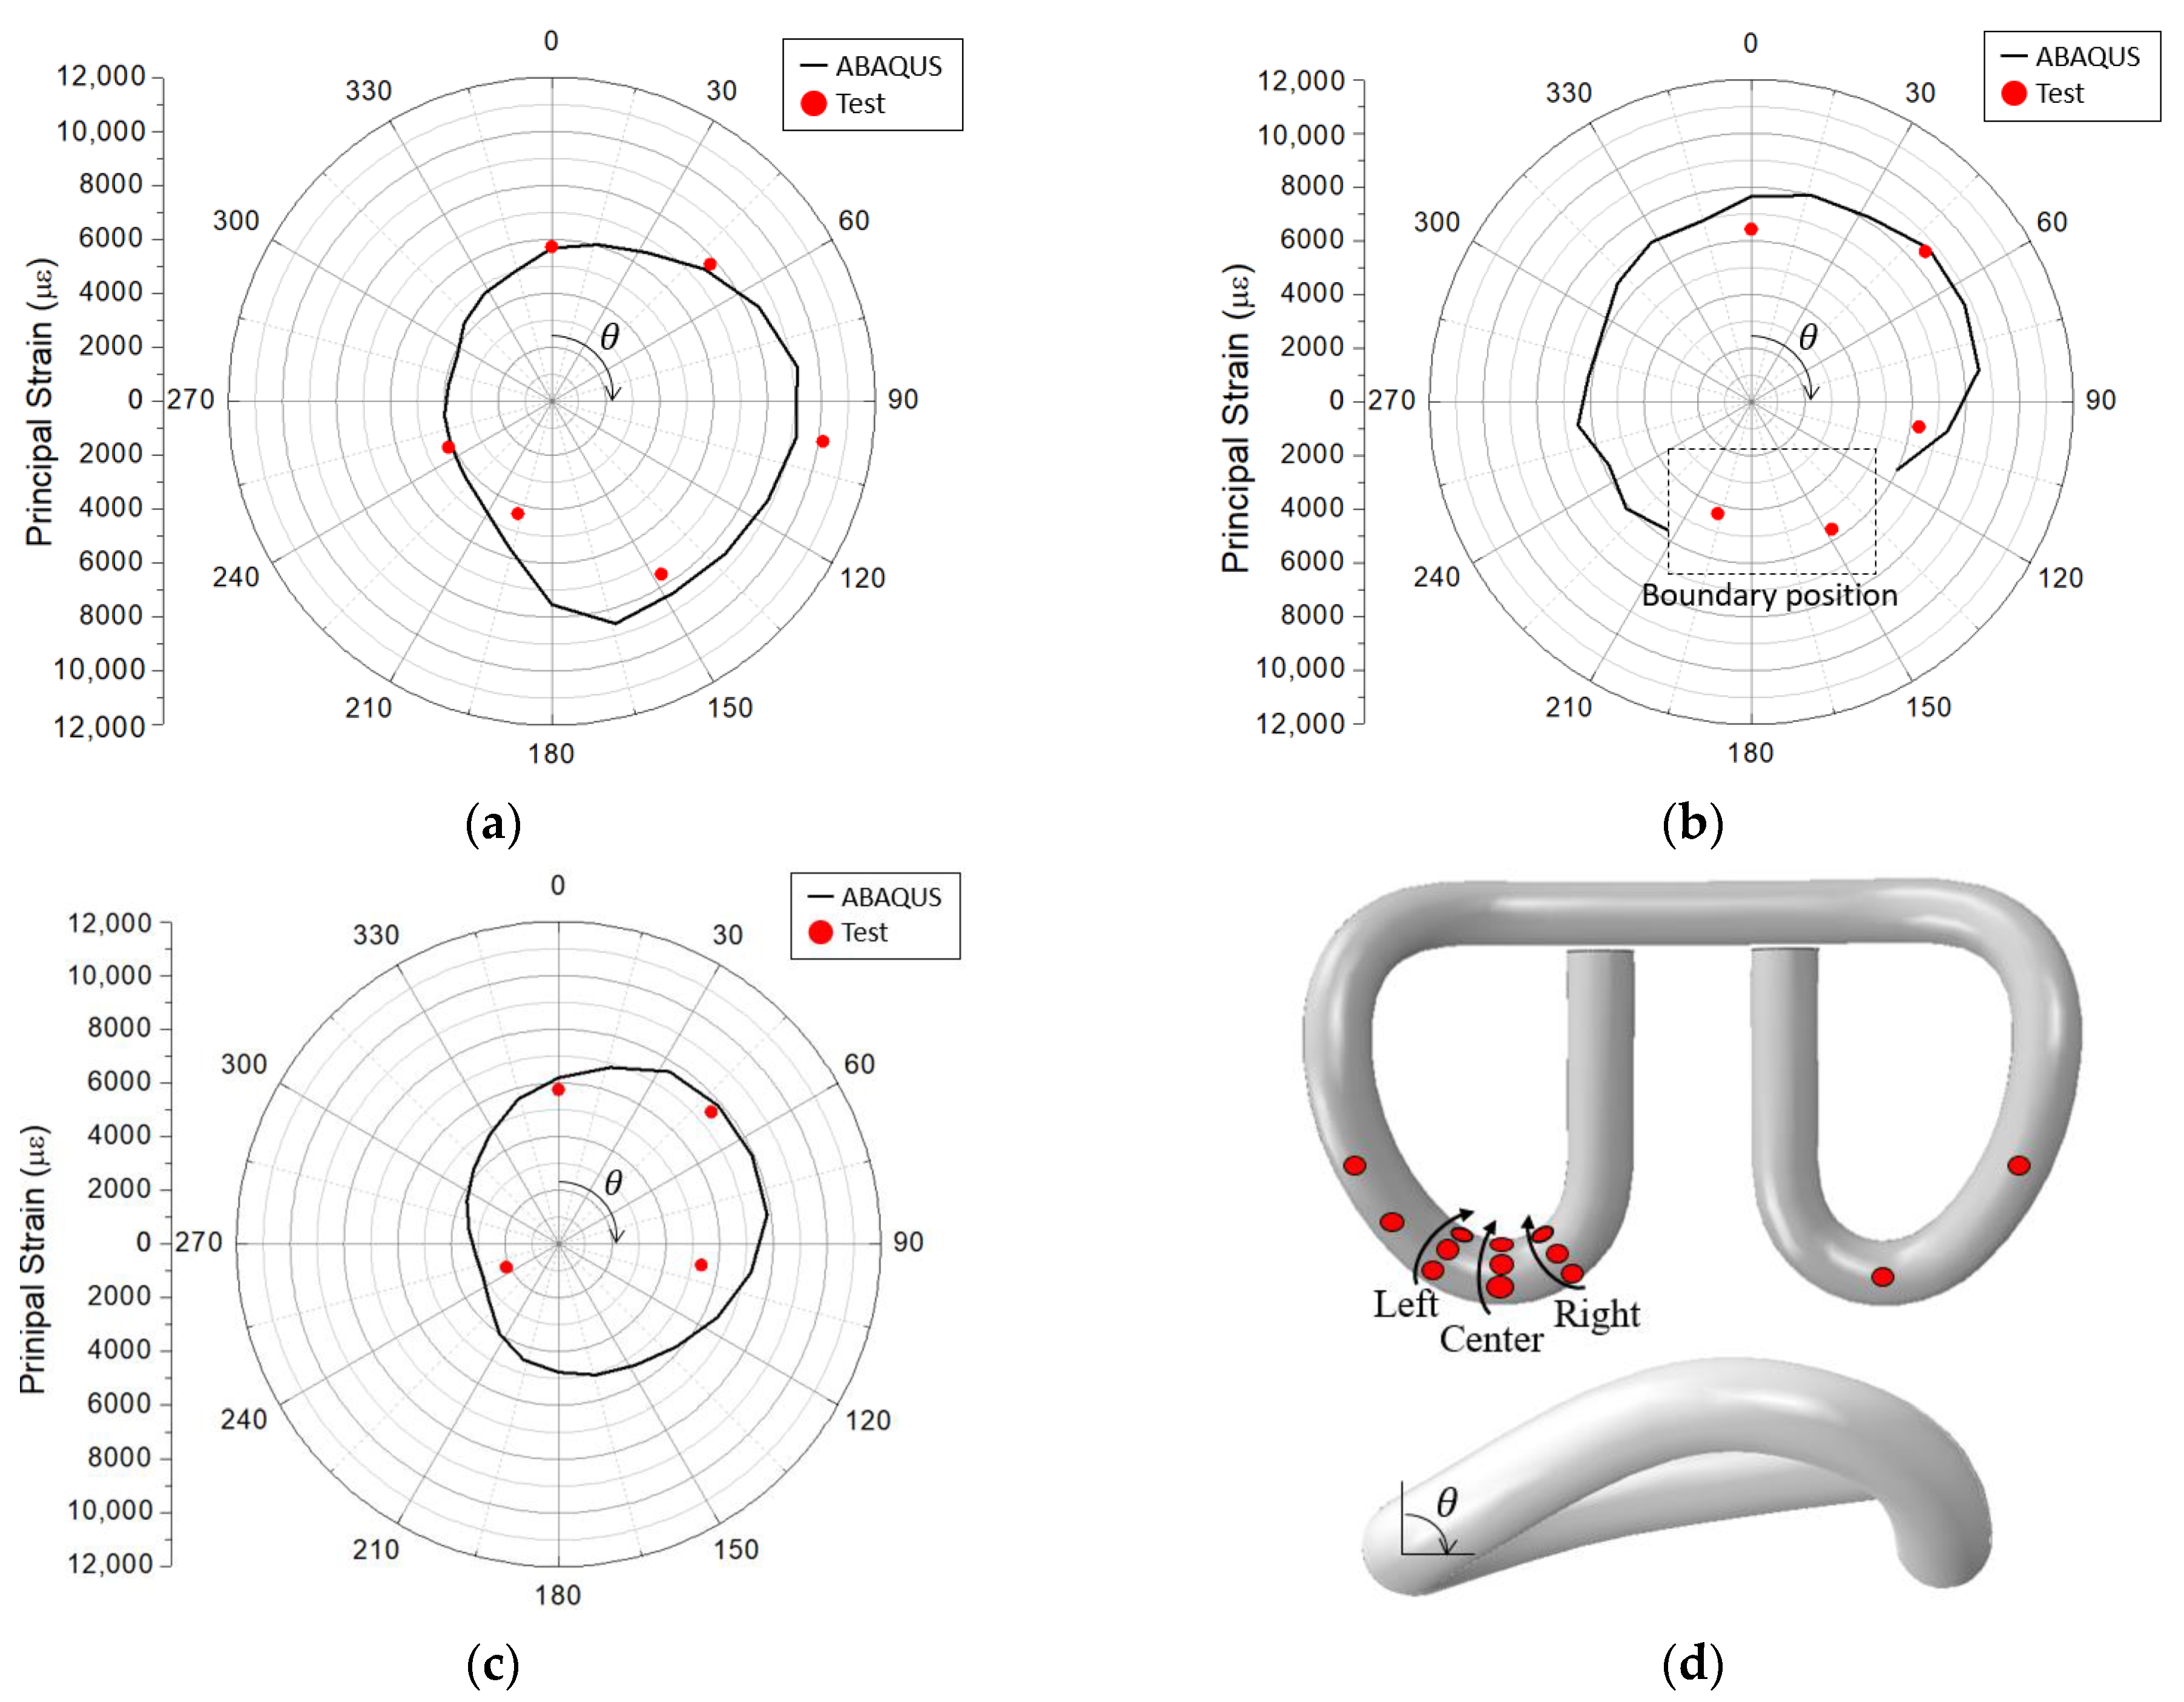
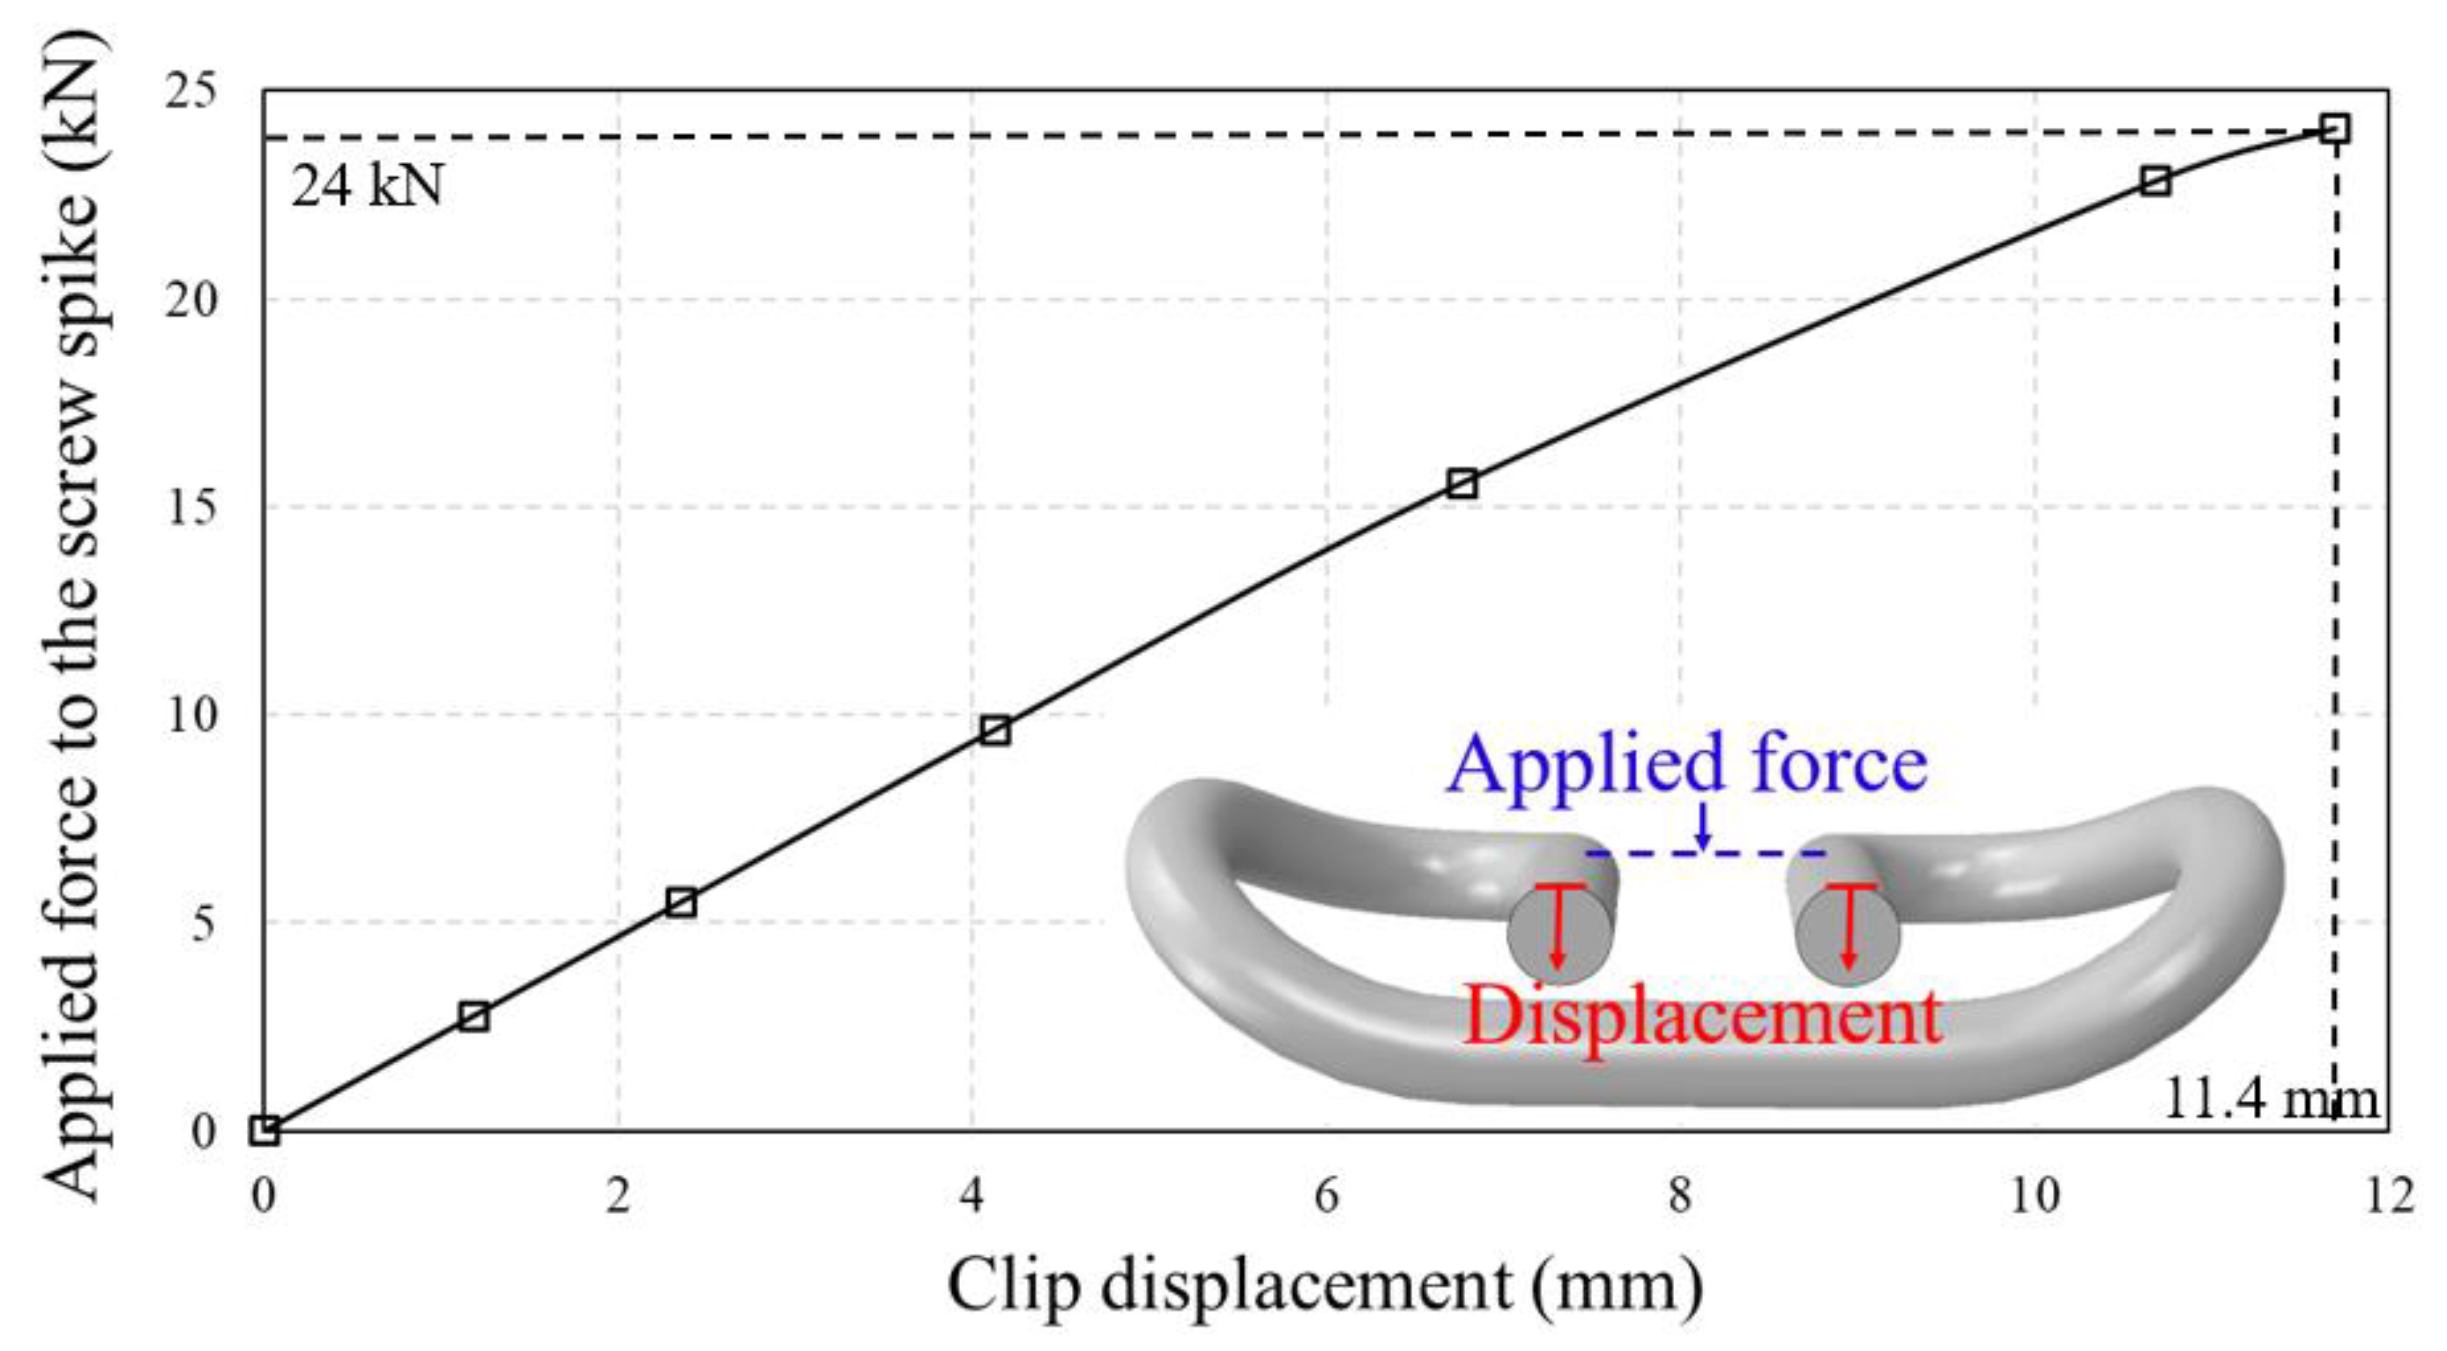
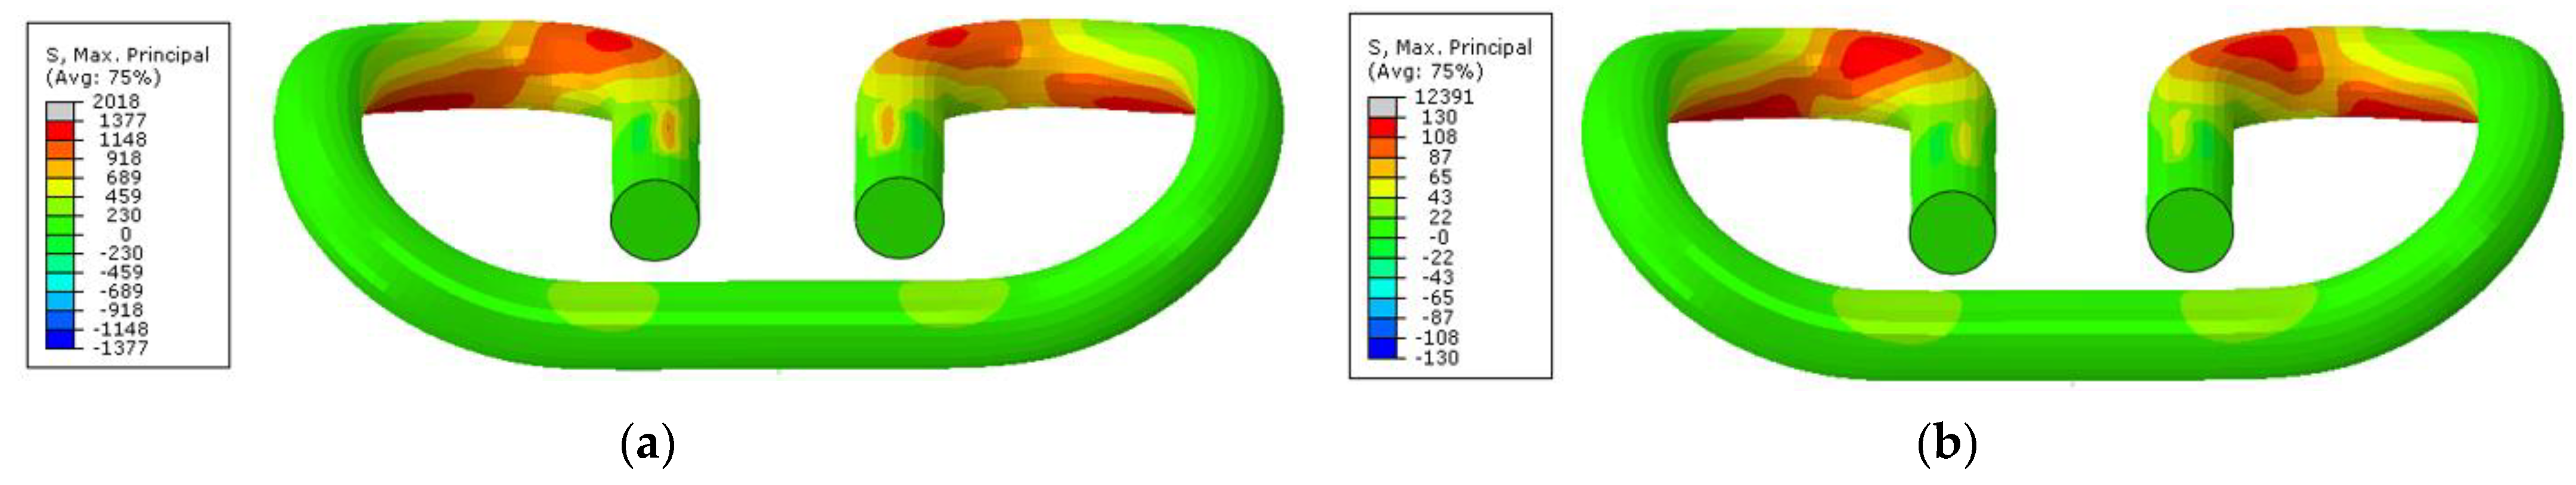
3.2. Results of Analysis
4. Fatigue Performance Evaluation
5. Conclusions
- During assembly testing, a high level of initial tensile stress, exceeding the yield stress, acted in some locations where a high stress concentration was expected. Such high initial stress, when combined with the stress range during train passage, indicates that the rail clip could be vulnerable to fatigue cracking.
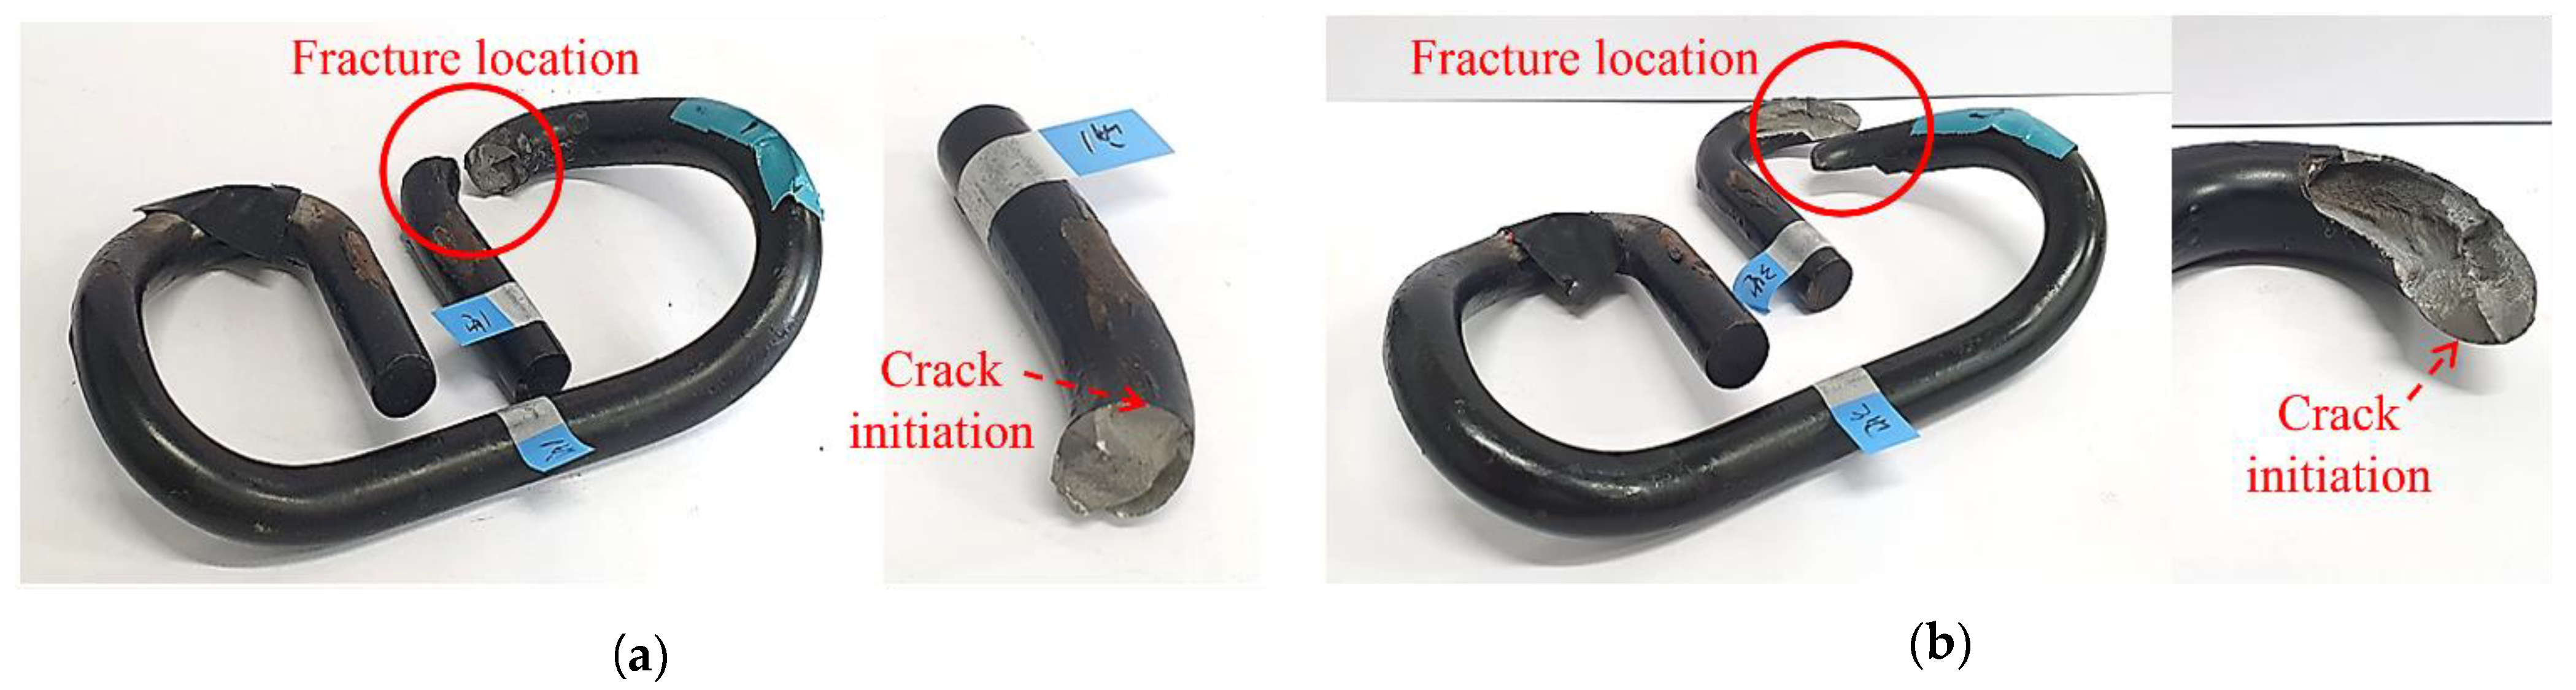
- The fatigue test results of the KR-type rail clips showed two different failure modes. The crack initiation points observed from the test matched well with the maximum principal stress concentration segments obtained through FEA. The comparison of natural frequencies of the clips, between the test results and those obtained through FEA, also showed a good correlation.
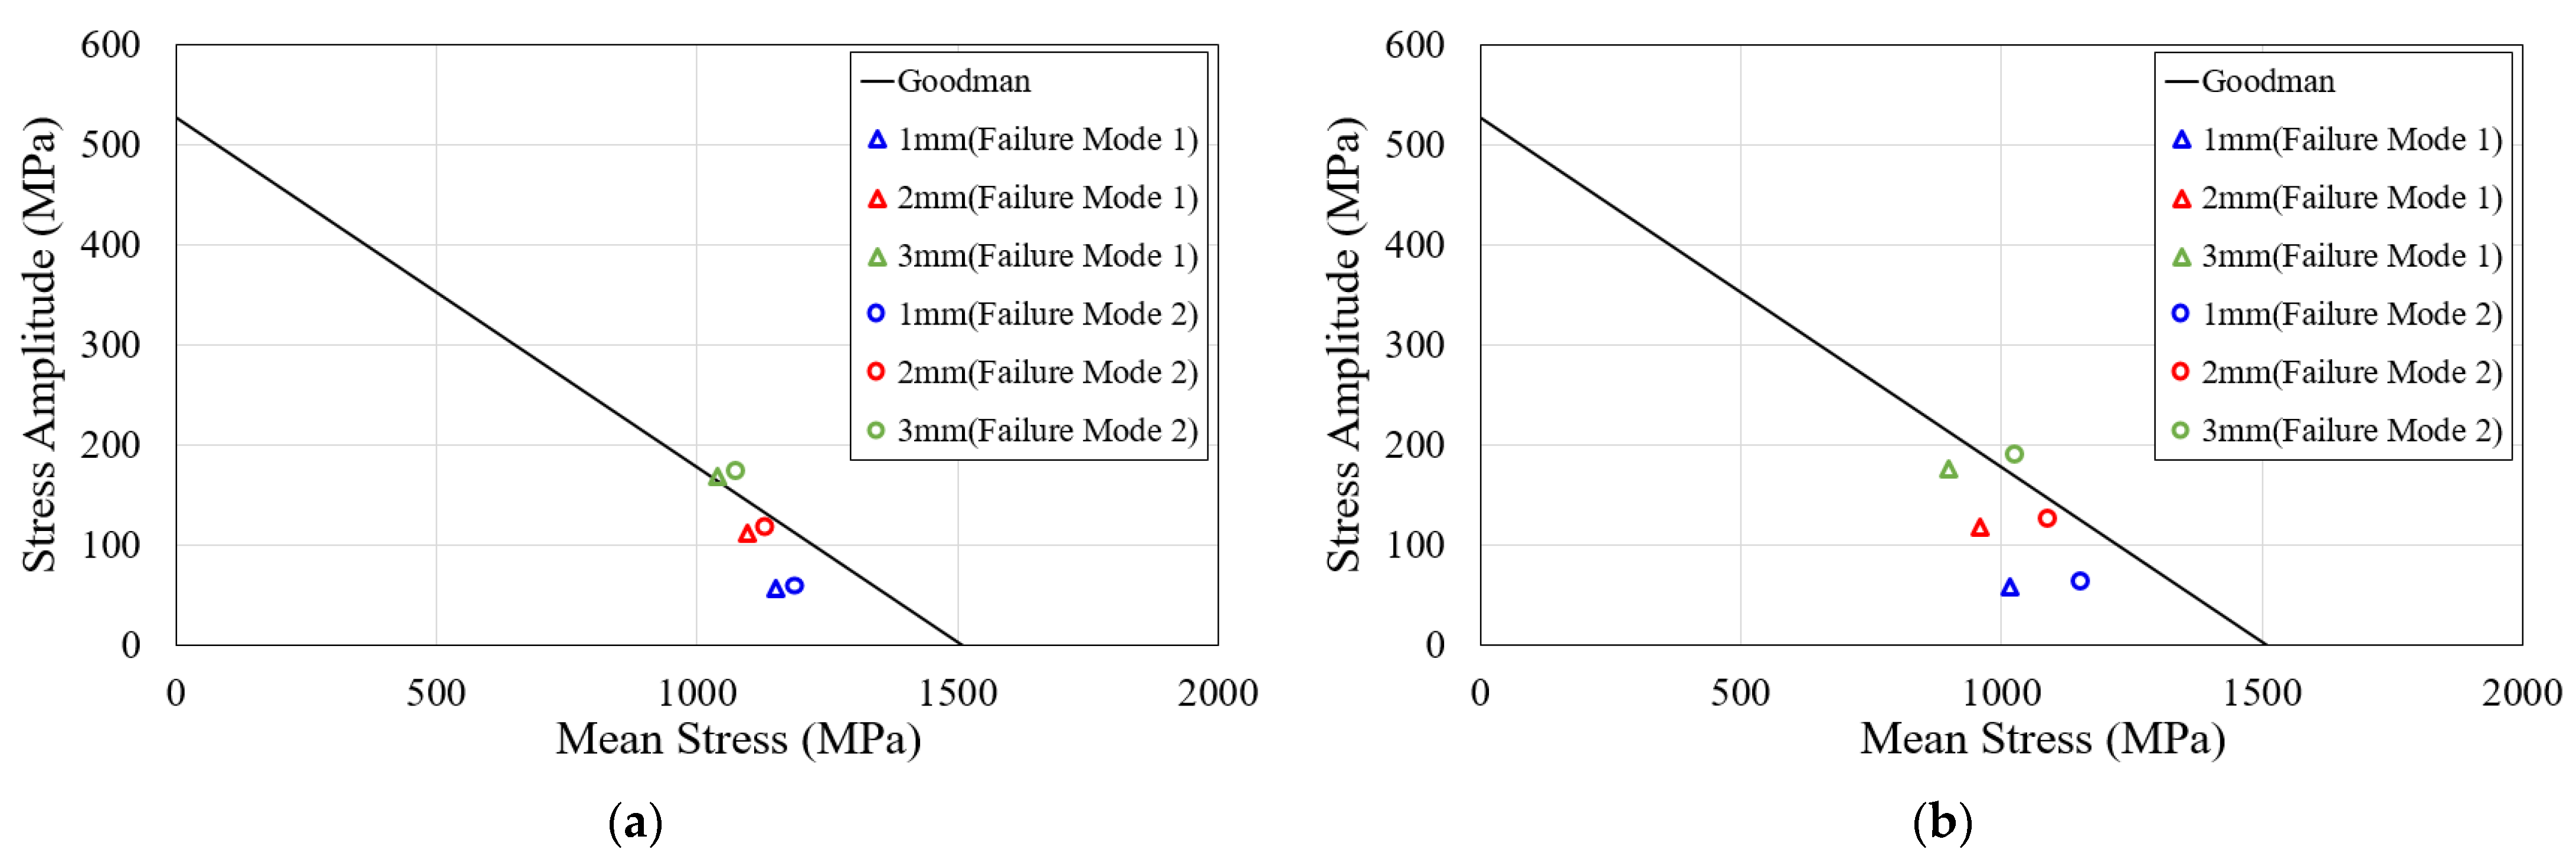
- The results obtained through FEA were used to evaluate the fatigue performance of the KR-type rail clip by adopting the modified Goodman fatigue criteria. The results indicated that when the rail vertical displacement due to train operation was 2 mm or less, it was unlikely for fatigue failure to occur.
- The evaluation of fatigue performance in this study was based on the initial stress and alternating stress acting on the rail clip. Further research, to analyze the impact of other parameters, including the residual stress and decarburized layer of the rail clip, might be required to obtain more conclusive and accurate fatigue evaluation results.
Author Contributions
Funding
Institutional Review Board Statement
Informed Consent Statement
Data Availability Statement
Acknowledgments
Conflicts of Interest
References
- Park, Y.C.; An, C.B.; Sim, H.B.; Kim, M.C.; Hong, J.K. Failure analysis of fatigue cracking in the tension clamp of a rail fastening system. Int. J. Steel Struct. 2019, 19, 1570–1577. [Google Scholar] [CrossRef]
- Schijve, J. Fatigue of Structures and Materials, 2nd ed.; Springer: Dordrecht, The Netherlands, 2009. [Google Scholar]
- Carrascal, I.A.; Casado, J.A.; Polanco, J.A.; Gutiérrez-Solana, F. Dynamic behavior of railway fastening setting pads. J. Eng. Fail. Anal. 2007, 14, 364–373. [Google Scholar] [CrossRef]
- Romero, M.J.G.; Edwards, J.R.; Barkan, C.P.; Wilson, B.; Mediavilla, J. Advancements in Fastening System Design for North American Concrete Crossties in Heavy-Haul Service. In Proceedings of the AREMA 2010 Annual Conference & Exposition, Urbana, IL, USA, 31 August 2010. [Google Scholar]
- Konstantinos, G. Secondary Stiffness of Fastening’s Clip: Influence on the Behavior of the Railway Track Panel. In Proceedings of the Transport Research Arena, Paris, France, 15 April 2014. [Google Scholar]
- Mohammadzadeh, S.; Ahadi, S.; Nouri, M. Stress-based fatigue reliability analysis of the rail fastening spring clip under traffic loads. Lat. Am. J. Solids Struct. 2014, 11, 993–1011. [Google Scholar] [CrossRef] [Green Version]
- Korean Agency for Technology and Standards. KS B 0802: Method of Tensile Test for Metallic Materials; Korean Agency for Technology and Standards: Sejong-si, Korea, 2001. (In Korean)
- Dassault, S. ABAQUS; Version 6.14-1; ABAQUS Inc.: Palo Alto, CA, USA, 2014. [Google Scholar]
- Budynas, R.G. Advanced Strength and Applied Stress Analysis, 2nd ed.; McGraw Hill: New York, NY, USA, 1999; pp. 534–537. [Google Scholar]
- Bannantine, J.A.; Comer, J.J.; Handrock, J.L. Fundamentals of Metal Fatigue Analysis; Prentice Hall: Englewood Cliffs, NJ, USA, 1990. [Google Scholar]
- Park, Y.C.; An, C.B.; Kim, M.C.; Sim, H.B. Effect of the depth of decarburized layer in SKL15 tension clamp on fatigue Strength. Appl. Sci. 2021, 11, 3841. [Google Scholar] [CrossRef]


| Specimen No. | Yield Stress (MPa) | Tensile Strength (MPa) | Elongation at Failure (%) |
|---|---|---|---|
| 1 | 1383 | 1517 | 11.0 |
| 2 | 1379 | 1514 | 9.3 |
| 3 | 1368 | 1497 | 8.5 |
| Mode | Test (Hz) | Abaqus (Hz) | Error (%) | Mode Shape |
|---|---|---|---|---|
| 1st | 871 | 999 | 14.7 |  |
| 2nd | 1025 | 1181 | 15.2 |  |
| 3rd | 1272 | 1478 | 16.2 |  |
| Failure Mode 1 | Failure Mode 2 | ||||||
|---|---|---|---|---|---|---|---|
| Vertical Displacement | 1 mm | 2 mm | 3 mm | 1 mm | 2 mm | 3 mm | |
| Maximum principal stress for step 1 | Maximum stress (step 1) (MPa) | 1208 | 1250 | ||||
| Minimum stress (step 2) (MPa) | 1096 | 983 | 870 | 1135 | 1018 | 902 | |
| Mean stress (MPa) | 1152 | 1095 | 1039 | 1192 | 1134 | 1076 | |
| Stress amplitude (MPa) | 56 | 112 | 169 | 58 | 116 | 174 | |
| Maximum principal stress for steps 1–2 | Maximum stress (step 1) (MPa) | 1076 | 1217 | ||||
| Minimum stress (step 2) (MPa) | 959 | 841 | 723 | 1092 | 965 | 839 | |
| Mean stress (MPa) | 1017 | 956 | 900 | 1155 | 1091 | 1028 | |
| Stress amplitude (MPa) | 59 | 117 | 176 | 63 | 126 | 189 | |
Publisher’s Note: MDPI stays neutral with regard to jurisdictional claims in published maps and institutional affiliations. |
© 2021 by the authors. Licensee MDPI, Basel, Switzerland. This article is an open access article distributed under the terms and conditions of the Creative Commons Attribution (CC BY) license (https://creativecommons.org/licenses/by/4.0/).
Share and Cite
Kim, S.-H.; Fang, X.-J.; Park, Y.-C.; Sim, H.-B. Evaluation of Structural Behavior and Fatigue Performance of a KR-Type Rail Clip. Appl. Sci. 2021, 11, 12074. https://doi.org/10.3390/app112412074
Kim S-H, Fang X-J, Park Y-C, Sim H-B. Evaluation of Structural Behavior and Fatigue Performance of a KR-Type Rail Clip. Applied Sciences. 2021; 11(24):12074. https://doi.org/10.3390/app112412074
Chicago/Turabian StyleKim, Sang-Hyeok, Xiao-Jun Fang, Yeun-Chul Park, and Hyoung-Bo Sim. 2021. "Evaluation of Structural Behavior and Fatigue Performance of a KR-Type Rail Clip" Applied Sciences 11, no. 24: 12074. https://doi.org/10.3390/app112412074