Article

Experimental Study on the Behavior of Polyurethane Springs for Compression Members

1
Department of Civil and Environmental Engineering, Incheon National University, Incheon 22012, Korea
2
Incheon Disaster Prevention Research Center, Incheon National University, Incheon 22012, Korea
*
Author to whom correspondence should be addressed.
Appl. Sci. 2021, 11(21), 10223; https://doi.org/10.3390/app112110223
Submission received: 3 October 2021 / Revised: 26 October 2021 / Accepted: 28 October 2021 / Published: 1 November 2021
(This article belongs to the Special Issue Advances on Structural Engineering, Volume III)

Abstract

:
In this study, the characteristics of the compression behavior of polyurethane springs that can be used as compression members of seismic devices, such as dampers and seismic isolators, were identified, and the effect of the design variables on the performance points of polyurethane springs was investigated. Compressive stiffness and specimen size were set as the design variables of the polyurethane spring, and the performance indicators were set as maximum force, residual strain, and energy dissipation. A total of 40 specimens with different conditions were fabricated and a cyclic loading test was performed to obtain the force-displacement curve of the polyurethane spring and to check the performance indicator. Significant strength degradation was confirmed after the first cycle by repeated loading, and it was confirmed that compressive stiffness and size demonstrated a linear proportional relationship with maximum force. In addition, the design variables did not make a significant change to the recovered strain, including residual strain, and residual strain of about 1% to 3% occurred. Energy dissipation showed a tendency to decrease by about 60% with strength degradation after the first cycle, and this also demonstrated no relationship with the design variables. Finally, the relationship between the design variables and performance indicators set in this study was reviewed and suggestions are presented for developing a simple design formula for polyurethane springs.

1. Introduction

In recent years, we have witnessed the widespread use of elastomeric polymers in engineering applications such as base isolators, structural dampers, and vibration control springs [1,2]. Elastomeric polymers feature a high toughness-to-density ratio and can resist large elastic deformations [2,3,4]. The conventional seismic design of structures tends to generate inelastic deformation in the structural member (e.g., beam and column), which results in residual drift and leads to permanent damage. However, in advanced seismic design, buildings are considered based on a low-damage self-centering system with replaceable fuse devices specially designed with the aim to sustain large deformation [5,6,7,8,9,10,11,12]. In this way, some researchers have tried to design structural damper systems using materials with self-centering characteristics, such as applied superelastic shape memory alloys (SMA) [13,14,15,16,17]. Hu et al. [18] applied SMA to a friction damping brace to study recentering capability and energy dissipation, and proposed an optimal design method for a smart self-centering bracing system. However, despite the excellent self-centering performance of SMA, it is thought that it will take a long time to be applied to actual structures as its price is too high and its workability is relatively poor. Therefore, studies on elastomeric polymers, such as polyurethane, that exhibit similar performance while being more economical and workable than SMA are being actively conducted. In this way, elastomeric polymers, such as polyurethane springs, can be used in structural damper systems that offer not only self-centering but also vibration control [19,20].
In the last decade, some researchers have examined the cyclic response of structures equipped with polyurethane elastomers. Polyurethane is a polymer developed by I. G. Farben and O. Bayer in 1937, and refers to a generic term for compounds with a urethane bond (-NHCO-O-) [21]. The urethane bond of polyurethane is generally formed by reacting a reactive isocyanate group (-NCO) with a hydroxyl group (-OH), such as TDI and MDI. In special cases, it can also be synthesized by the reaction of bischloroformates and amines [22,23]. Mirzai et al. [24] evaluated the behavior of axial polyurethane friction dampers by using finite element (FE) analyses and found that polyurethane springs are able to increase damper stiffness and strength. Cui et al. [25] employed polyurethane elastomers in a rocking wall system and performed 14 sets of experimental tests. Their obtained results showed that the used polyurethane elastomers could produce flag-shaped hysteresis with small residual drifts. Szczepański et al. utilized polyurethane foams in wooden house wall panels and evaluated their seismic behavior through experimental tests [26]. The results showed that polyurethane foams could simultaneously achieve a stable increase in the stiffness and damping properties. Peng and Huang [27] investigated a sliding isolation system, in which polyurethane elastomers were used to effectively minimize the response of buildings to seismic excitation. The obtained results demonstrated that the proposed system had an excellent damping energy dissipation capacity. Choi et al. [28] experimentally evaluated the behavior of the smart damper equipped with dual polyurethane rubber springs and then concluded that these smart dampers initially exhibited rigid behavior in the quasi-static tests because of equipped polyurethane springs under precompression.
Migda et al. [29] revealed that polyurethane foam increased the rigidity of buildings, resulting in the mitigation of the inelastic response of the structure subjected to different seismic excitations. Gökçe et al. [20] evaluated the seismic performance of high-voltage post insulators by using the polyurethane bearing system through a shaking table. The test results indicated that polyurethane bearing systems could help to enhance the seismic safety of the post insulators by providing additional stiffness. Choi et al. [30] evaluated the cyclic compressive behavior of polyurethane bearings through experimental tests. Yuan et al. [31] assessed the mechanical properties of new polyurethane elastomers with a high capacity and established a shear model that defined the nonlinear and rate-dependent shear mechanical properties of the new polyurethane.
Compared with the study of reference [30], this study increased the size and compressive stiffness variables and analyzed the effects of these two variables on the behavior of a polyurethane spring. In addition, the maximum force, residual displacement, and energy dissipation were set as indicators of the polyurethane spring’s behavior, and the relationship between each index and the size and compressive stiffness was confirmed through a cyclic loading test. Through this, the main design parameters and considerations for applying the polyurethane spring as a compression member for seismic devices such as damper systems in the future were reviewed.

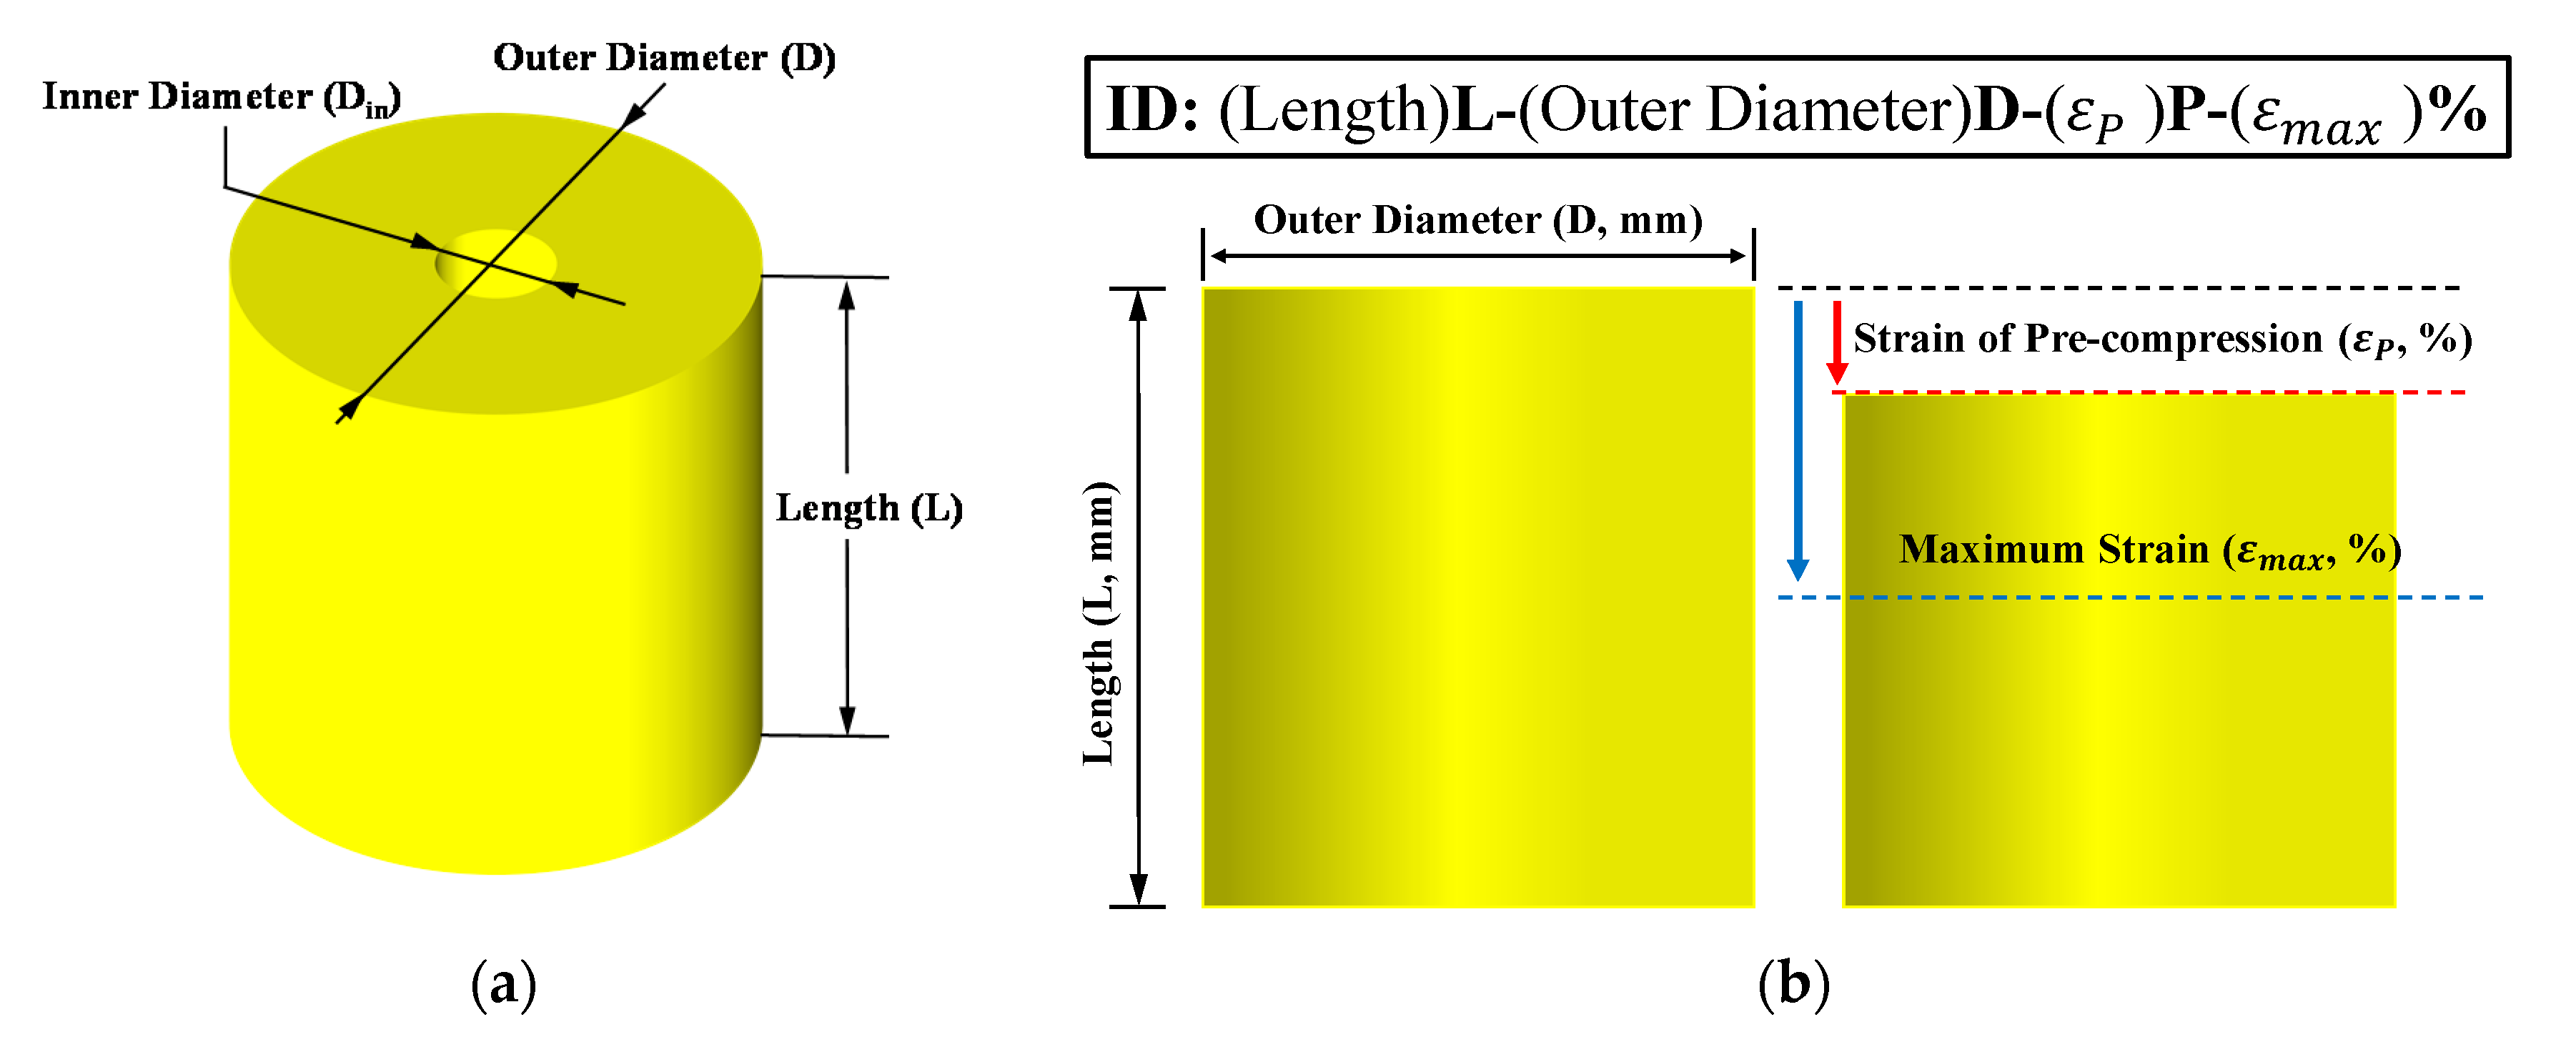
2. Design of Polyurethane Springs

Polyurethane rubber springs capable of restoring their original shape were used as compression members; they are manufactured in a cylindrical shape and are used in various fields that require restoration force from external loads. Therefore, as shown in Figure 1, the polyurethane rubber spring specimen used in this study was manufactured in a cylindrical shape with a hole in the center. The shore hardness of the polyurethane rubber springs was composed of 95A, which was significantly larger than that of typical rubbers; hence, it could secure a high resistance with a relatively small area [32]. In addition, polyurethane rubber can develop desired properties and performance according to the polymer blending, and its microstructure can be confirmed using a scanning electron microscope (SEM) [33,34,35,36]. The outer diameter (D) varied from 100 mm to 72 mm, according to the experimental conditions, and the inner diameter (Din) was uniformly fixed at 20 mm. The 20 mm central holes were drilled in order to prevent the separation of the specimen from the jig during cyclic loading tests by fastening experimental specimens to separation-preventing pins installed on the jig. In addition, these holes provided spaces into which the separation-preventing pins could be inserted to prevent the release of the polyurethane rubber springs from the device when applied to an earthquake damage reduction device, such as an actual damper or a seismic base isolator. The length of the experimental specimens was designed to decrease by 10 mm from 100 mm to 60 mm, depending on the experimental conditions. Moreover, the compressive stiffness (kc) of the specimen could be adjusted by varying both length and outer diameter. A total of 40m of specimens were produced in this study, and the names of the specimens comprised the variables for each case. Thus, the experimental specimens were named in the order of length (L, mm), outer diameter (D, mm), precompression strain ( ε P , %), and maximum strain ( ε m a x , %). as presented in Figure 1. However, since precompression is not considered in this study, precompression was 0. For example, the specimen 100 mm in length, 92 mm in outer diameter, with 0% precompression strain, and a 390% maximum strain was designed as the 100L-92D-0P-30% model.
The experiments were mainly divided into two types. Because polyurethane springs are affected by the shape factor, the compressive stiffness varies depending on the shape. Therefore, in this study, the size and compressive stiffness of the specimens were set as variables and classified into two types. The Type 1 specimens had the same compressive stiffness, but were designed to feature five different sizes. The Type 2 specimens were designed to possess five different compressive stiffness values, in which the outer diameter of the specimen was fixed to 100 mm and the length decreased from 100 mm to 60 mm in steps of 10 mm, respectively. The actual specimens for each type produced for the experimental tests are presented in Figure 2. Ten specimens were designed for their own compressive stiffness by controlling the shape factor (S). In other words, the Type 1 specimens demonstrated almost similar compressive stiffness values because each case had a different length but similar shape factors. The Type 2 specimens had different compressive stiffness values due to an equal outer diameter but different shape factors for each case. The compressive stiffness (kc) of each specimen was calculated in accordance with Equation (1):
k c = E a A L
where Ea indicates the apparent elastic modulus of the polyurethane rubber spring, A is the cross-sectional area, and L stands for the length of the specimen. The apparent elastic modulus was calculated using Equation (2), which is a function of the shape factor and elastic modulus (Eo), where the elastic modulus of the polyurethane rubber spring was composed of 68.95 MPa [37].
E a = E o ( 1.2 + 2 S 2 )
In the Type 1 specimens, for the purpose of equalizing the compressive stiffness of the individual specimens, the values of L presented in Equation (1) were designated as 100, 90, 80, 70, and 60 mm, respectively, and thereafter A was estimated according to the change in L. Therefore, because the inner diameter was fixed at 20 mm, the outer diameter was adjusted at five different values. The outer diameter and length of the specimens for each type are listed in Table 1, and the shape factor was calculated using Equation (3) as follows:
S = loaded   area force   free   area
Here, the loaded area is the cross-sectional area of the specimen directly loaded, whereas the force free area is the area of the side and central inner hole of the specimen. Table 1 shows the compressive stiffness and apparent elastic modulus calculated using Equation (1) as well. The values of kc in the Type 1 specimens ranged from 5.52 kN/mm to 5.96 kN/mm, and the increase rate of kc in the Type 2 specimens was approximately 14.57%. Finally, the value of kc increased as the length decreased.

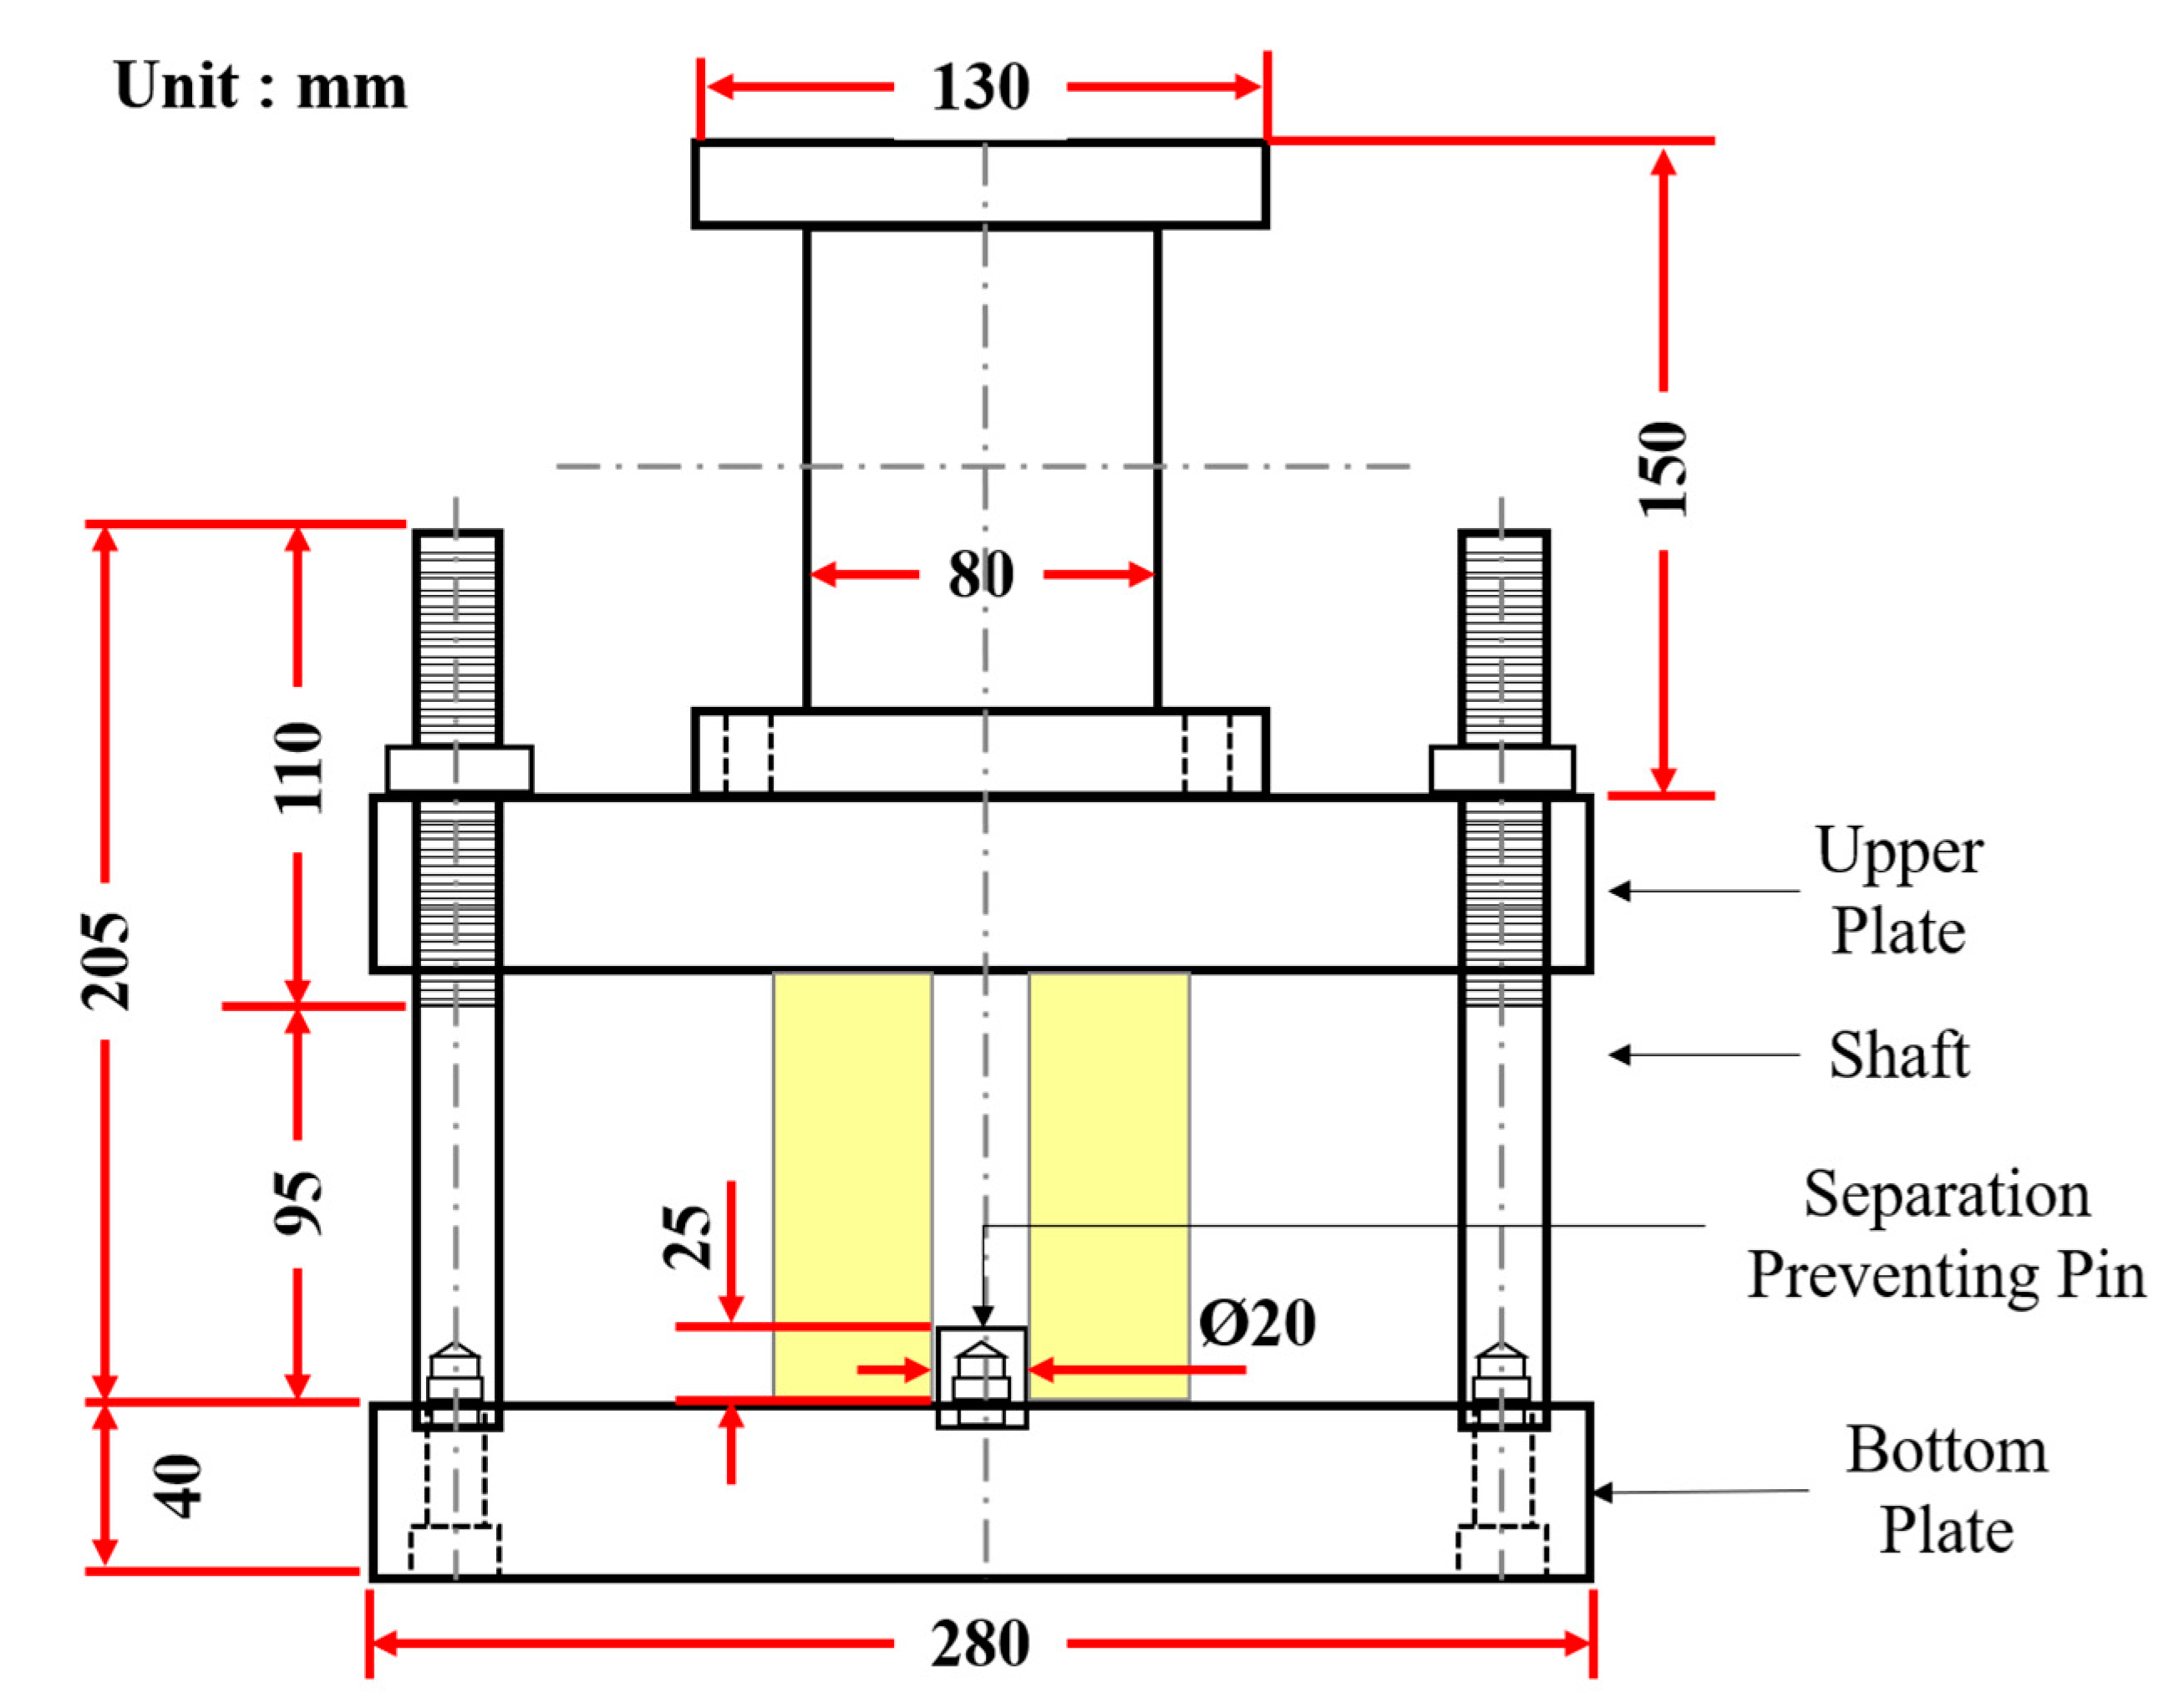
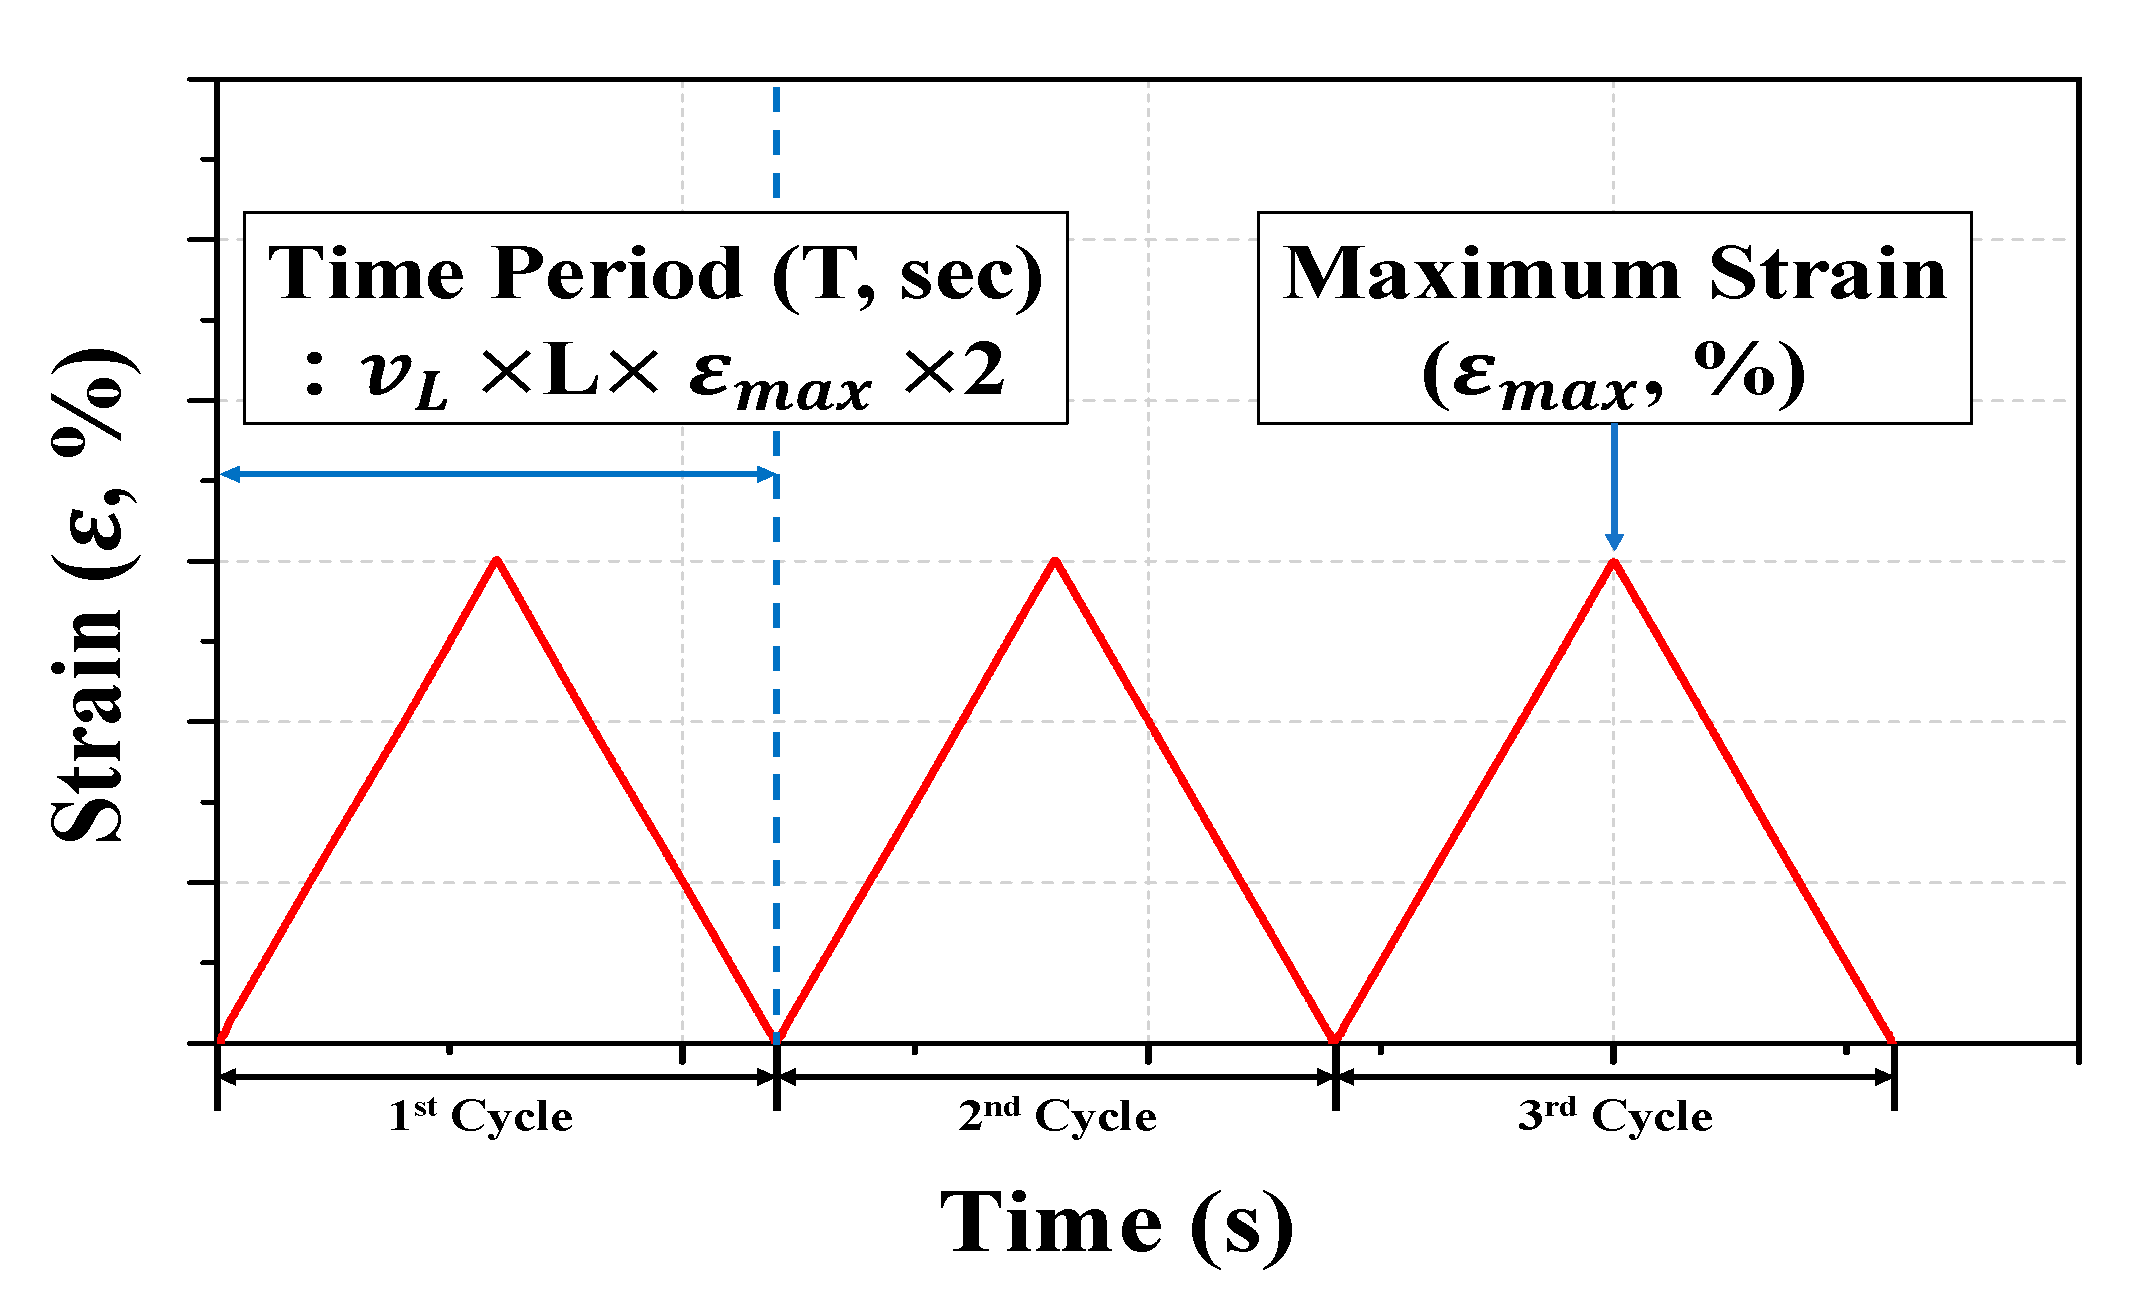
3. Experimental Program

A jig was designed to conduct the cyclic loading tests by using universal testing machine (UTM) equipment, as shown in Figure 3. The compressive load was measured using a UTM load cell, and the displacement of the polyurethane spring was measured using a linear variable displacement transducer (LVDT). In this study, strain is determined by the compressive displacement for the total length of the specimens. The jig was composed of a square-shaped upper plate and a lower plate, and a shaft was installed at each corner. The plate was designed to move along the shaft and to maintain uniform contact with the top and bottom of the polyurethane rubber spring to generate surface pressure. A separation-preventing pin with a diameter of 20 mm and a height of 25 mm was aligned into the center of the lower plate, which completely fixed the polyurethane rubber spring to the jig and prevented the experimental specimens from dislodging during the cyclic loading tests. As summarized in Table 2, the loading speed ( v L ) was 0.5 mm/s, three cycles of displacement control cyclic loading tests were performed, and the maximum strain rate ranged from 25% to 40%.
The loading protocol of the cyclic loading test was repeated three times at a loading speed of 0.5 mm/s based on the maximum strain of each case through displacement control. Figure 4 presents a generalization of the loading protocol of the cyclic loading test. The loading and unloading processes were repeated for three cycles up to the maximum strain rate for each case, in which strain compressed to maximum strain and then returning to zero strain was defined as one cycle. The time period (T) was twice the value of the maximum strain multiplied by the loading speed and indicates the experiment time for one cycle of the case. Therefore, because the total experiment time was three cycles, it took up to three times the time period.

4. Experimental Results and Discussion

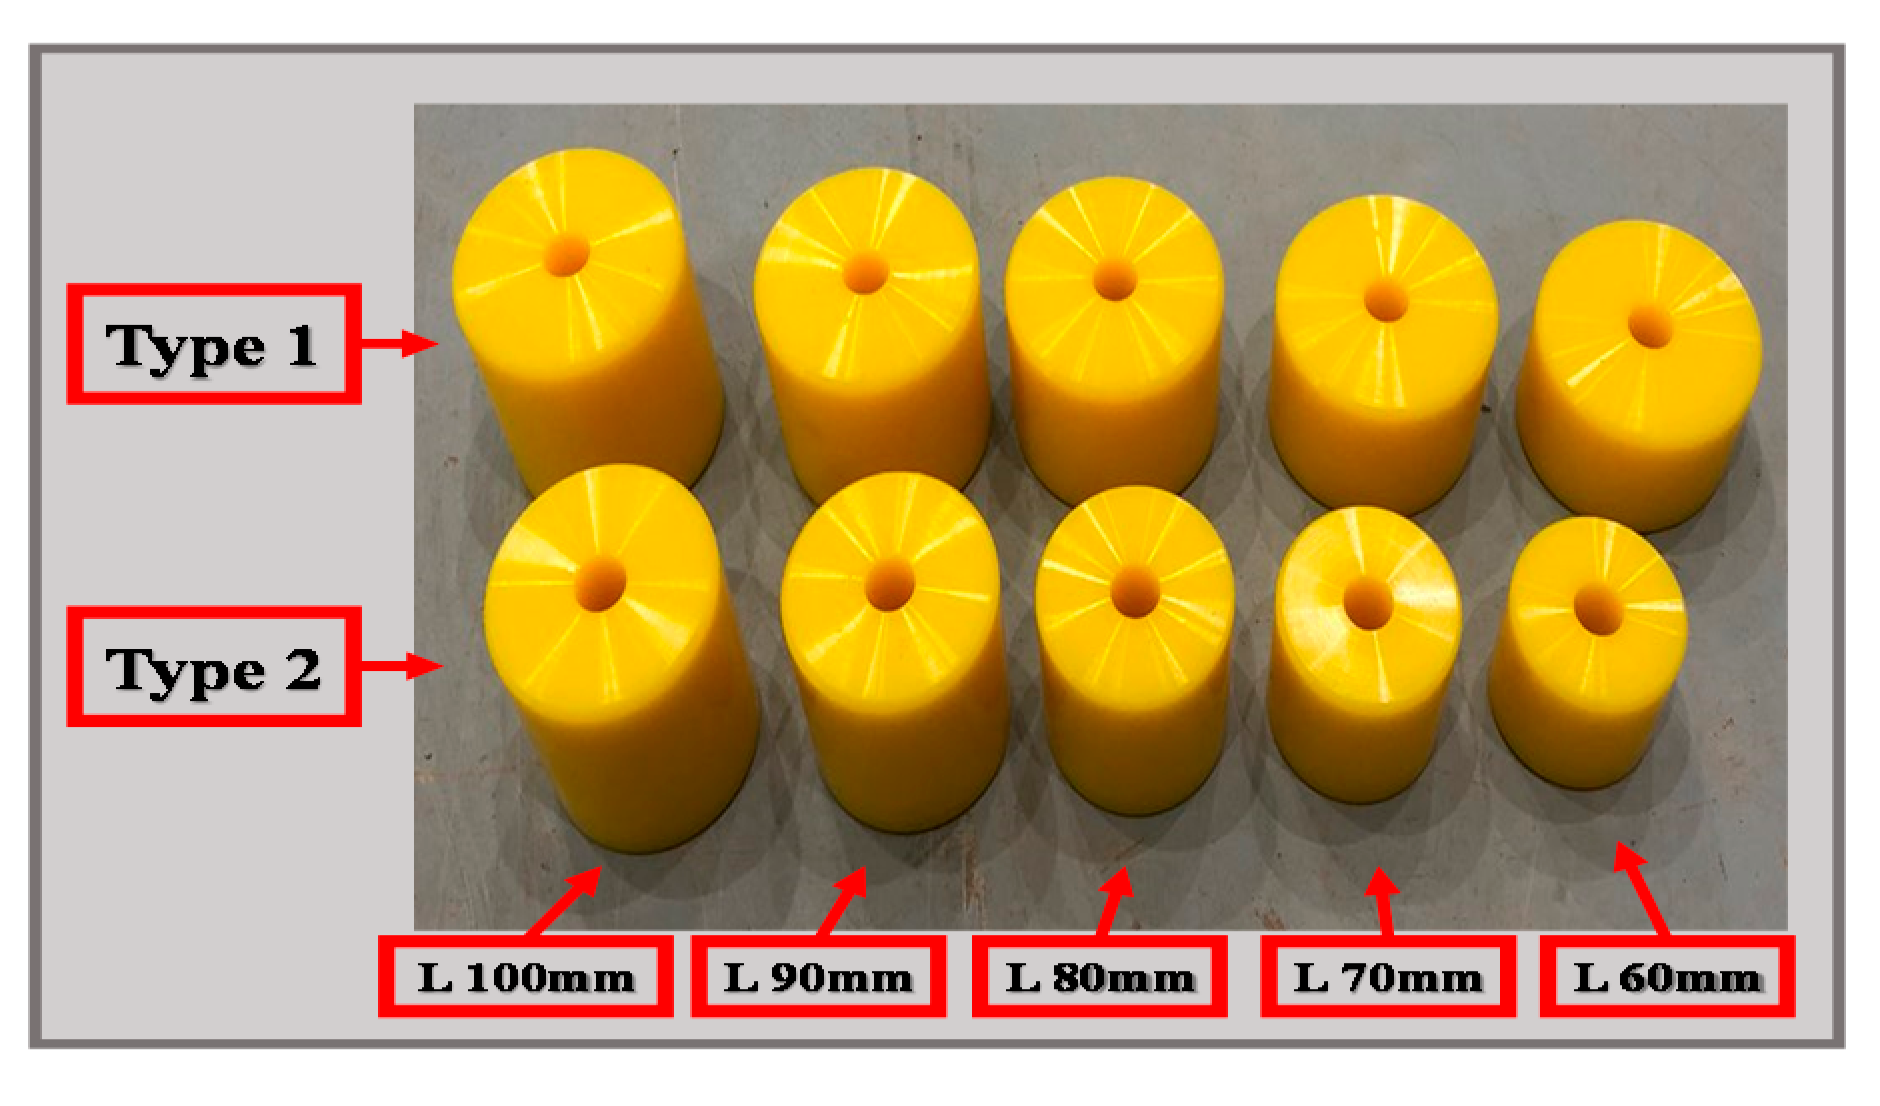
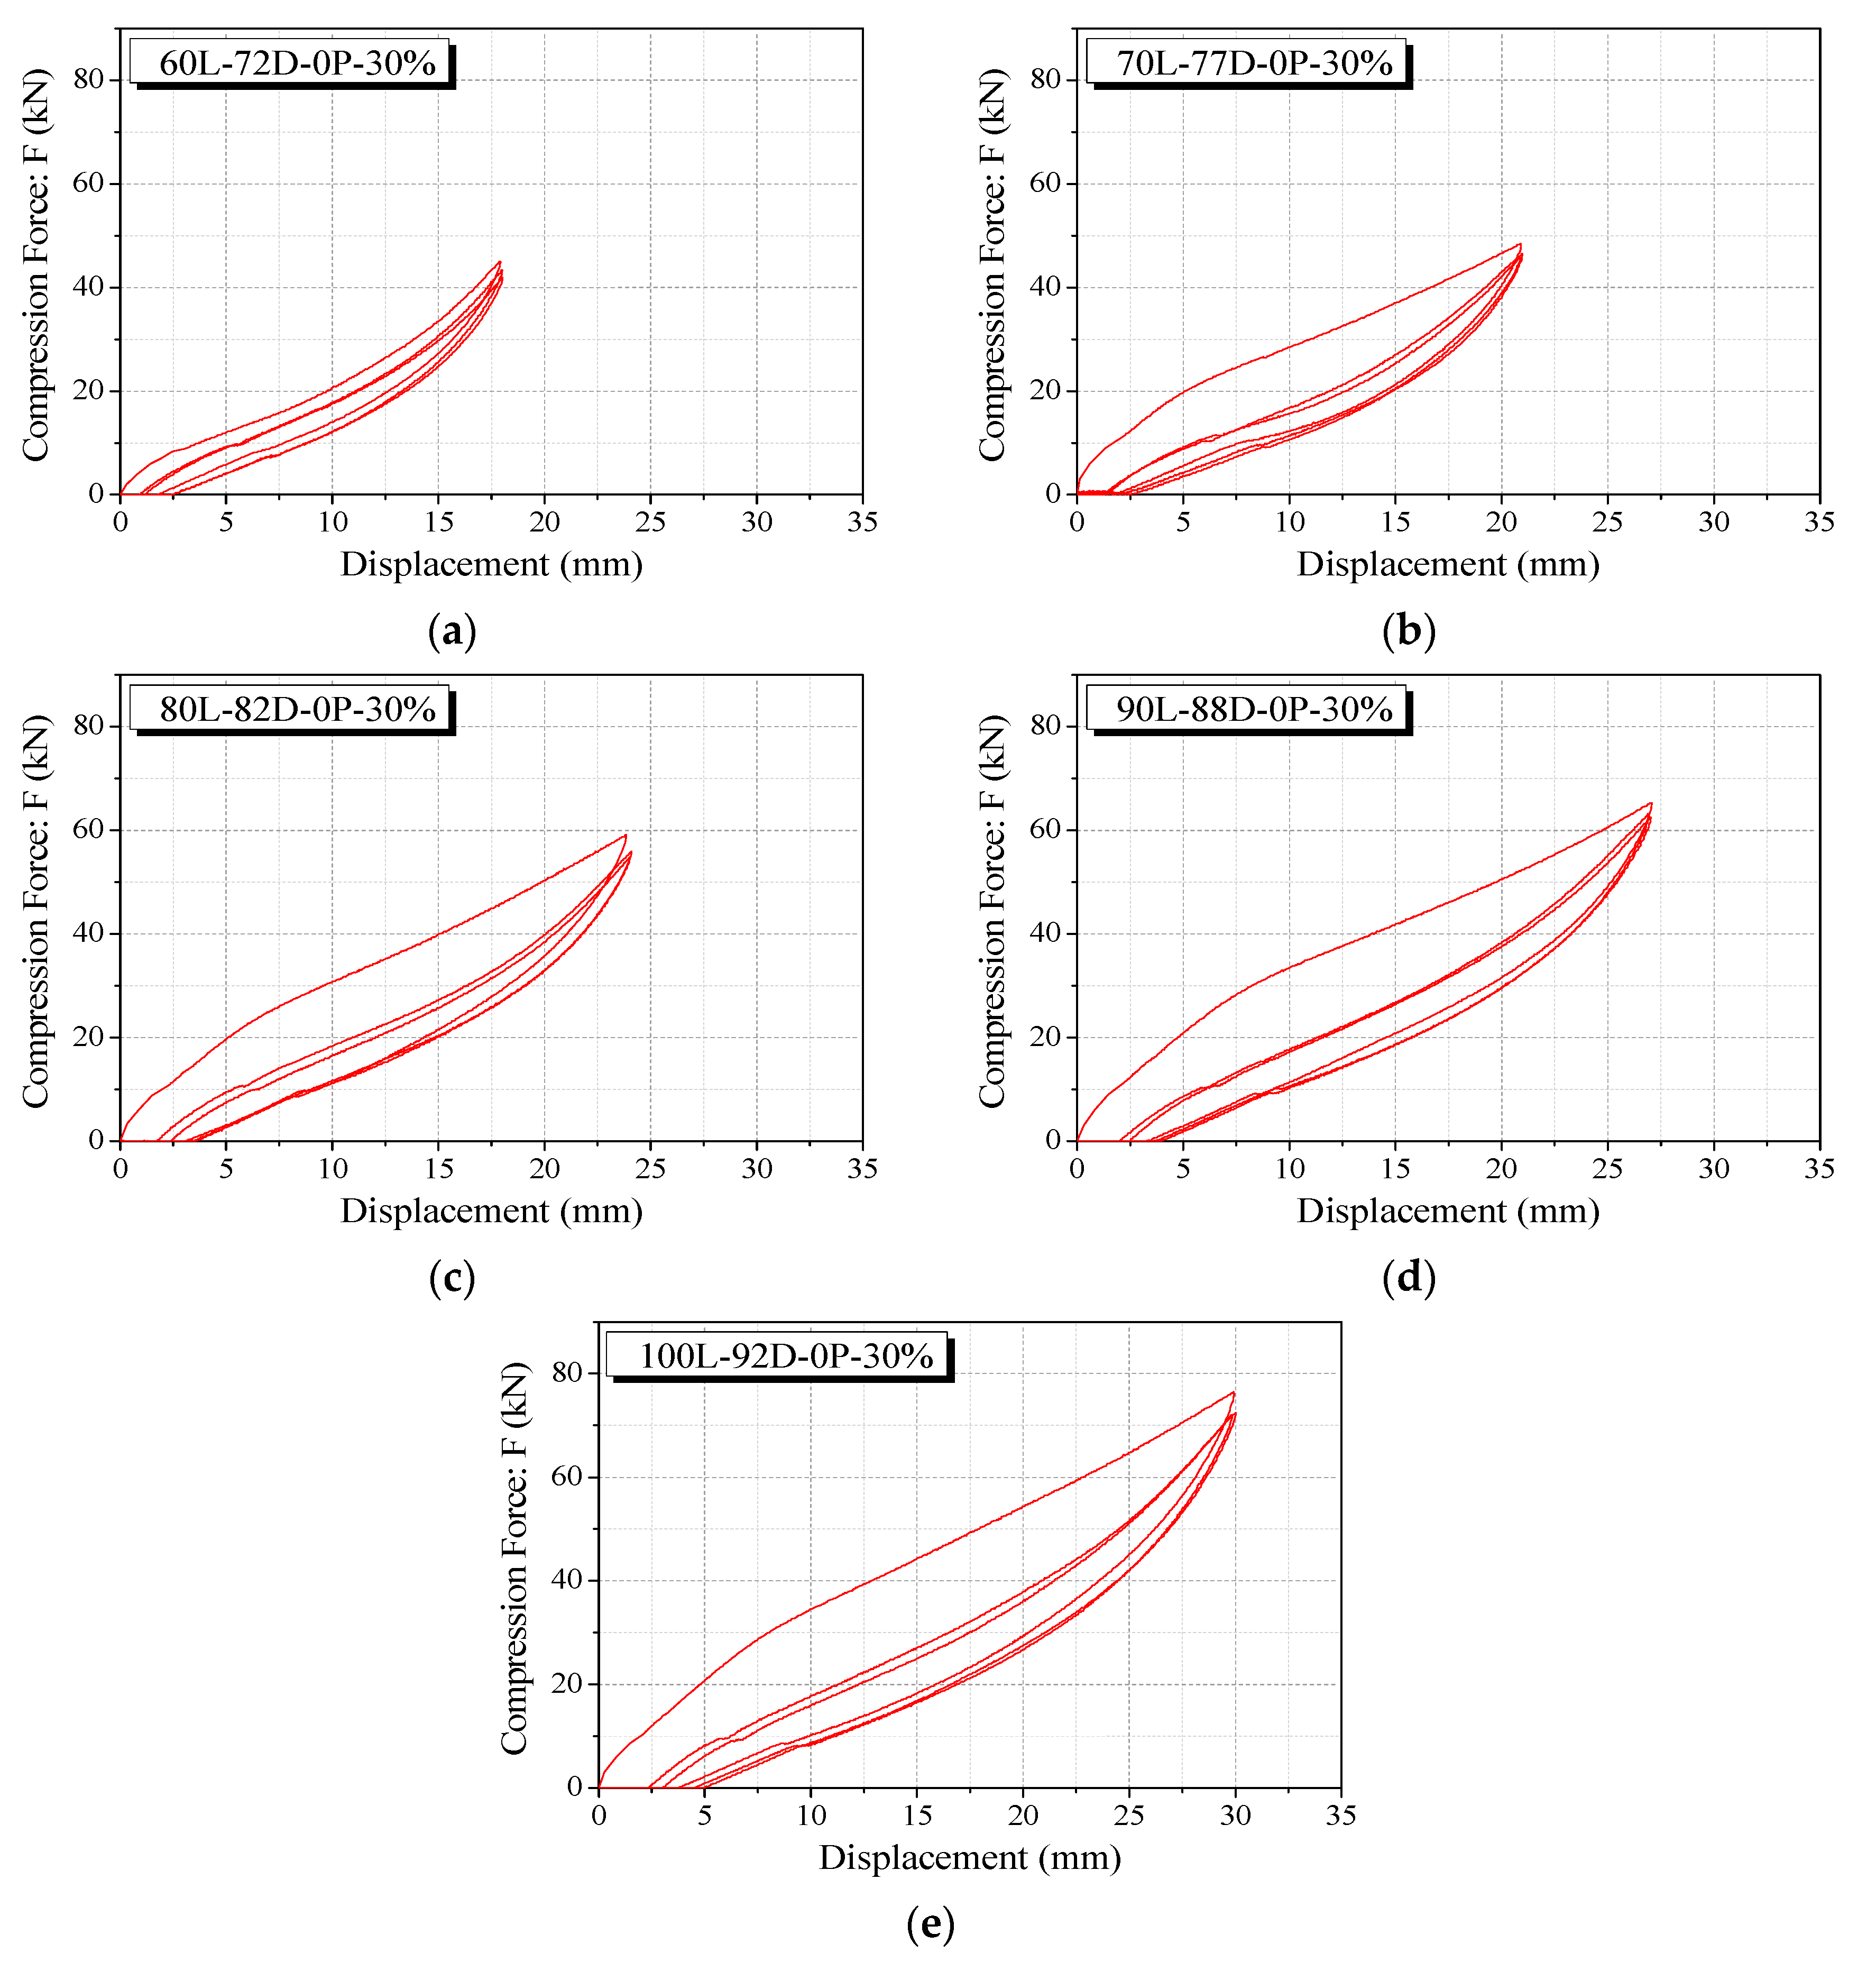
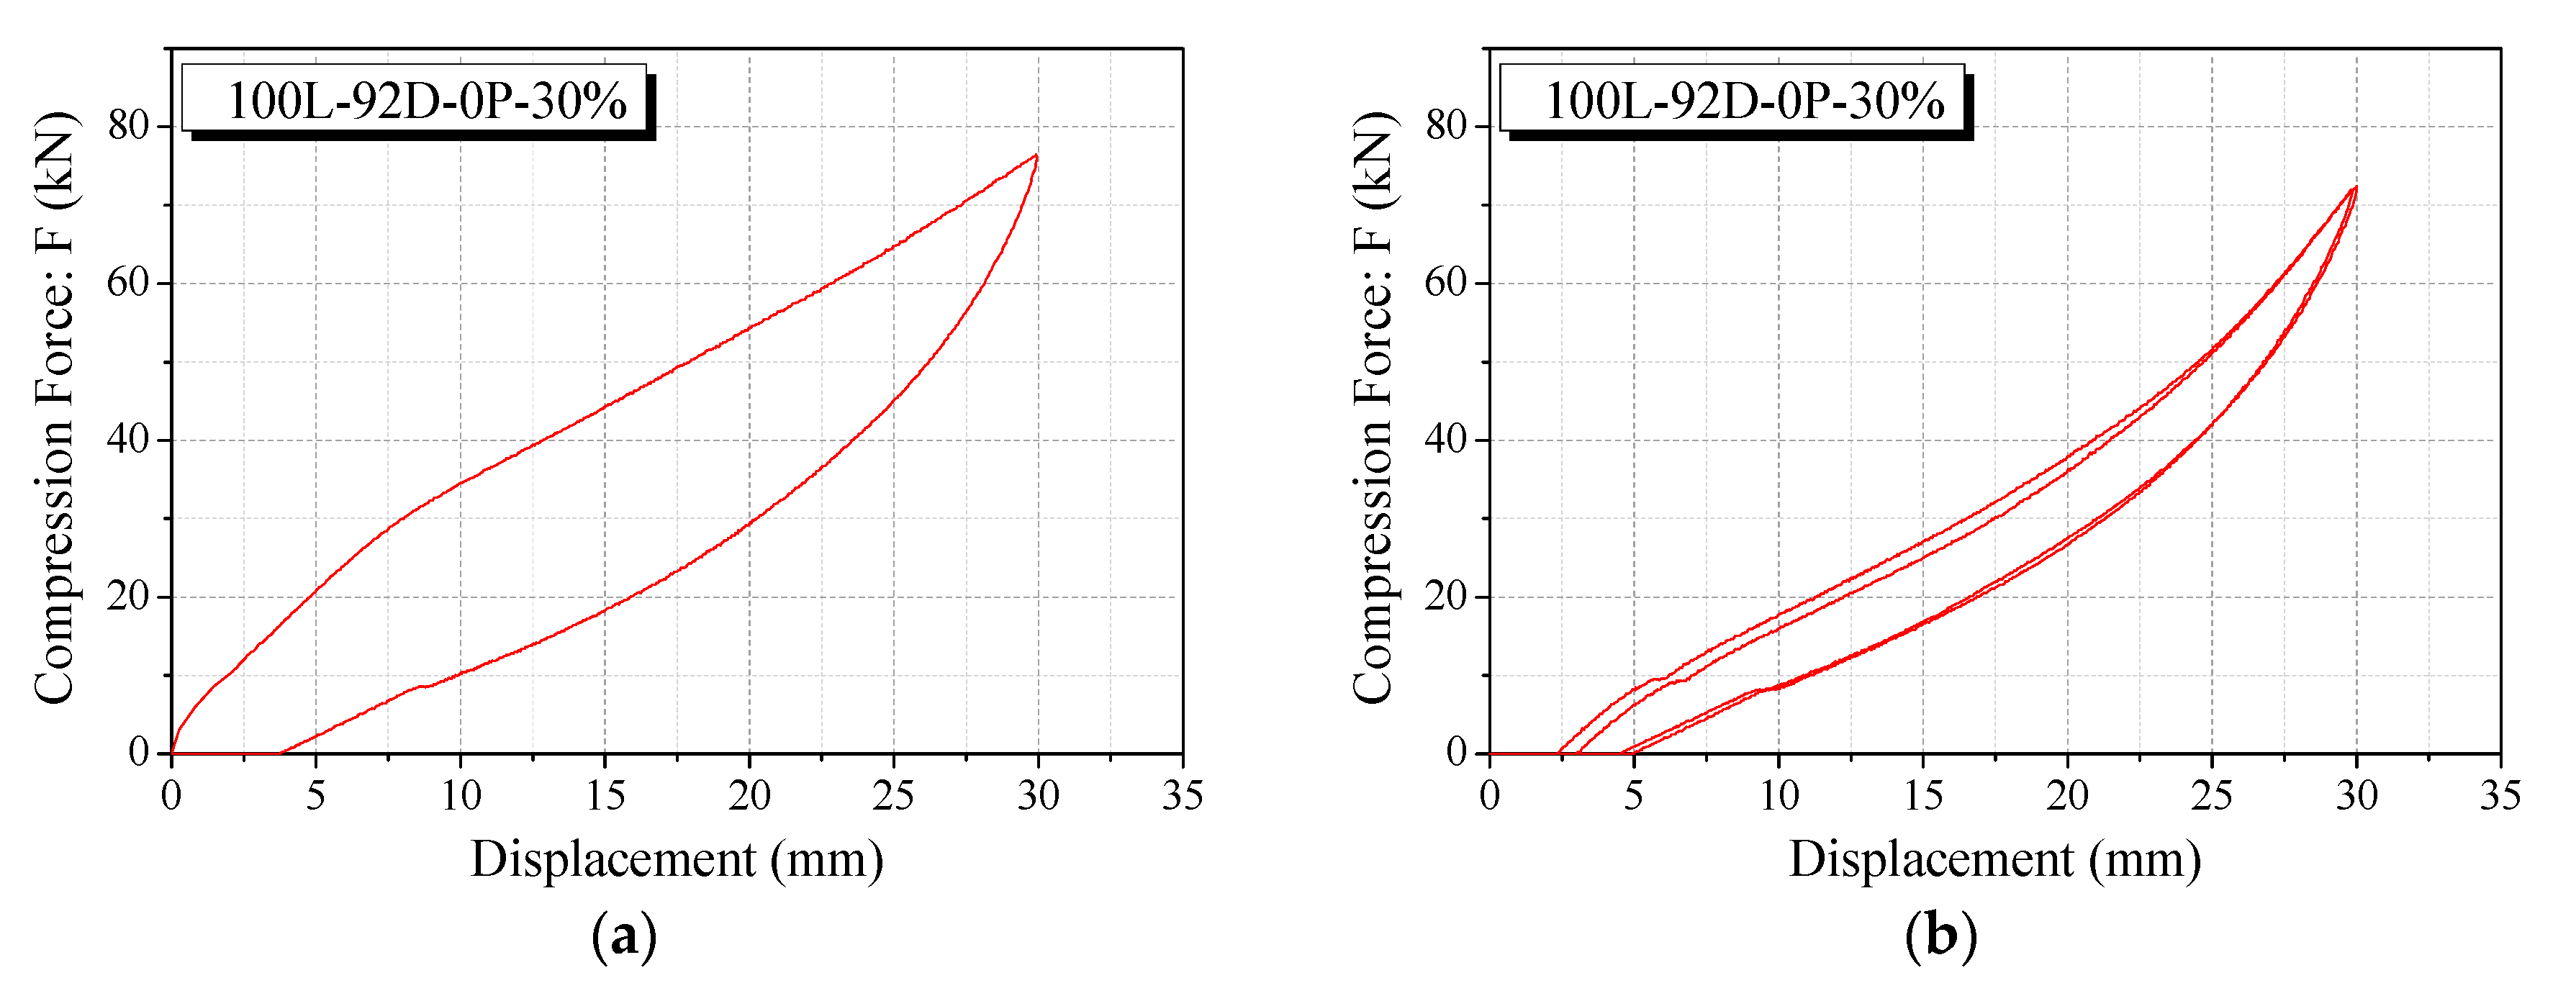
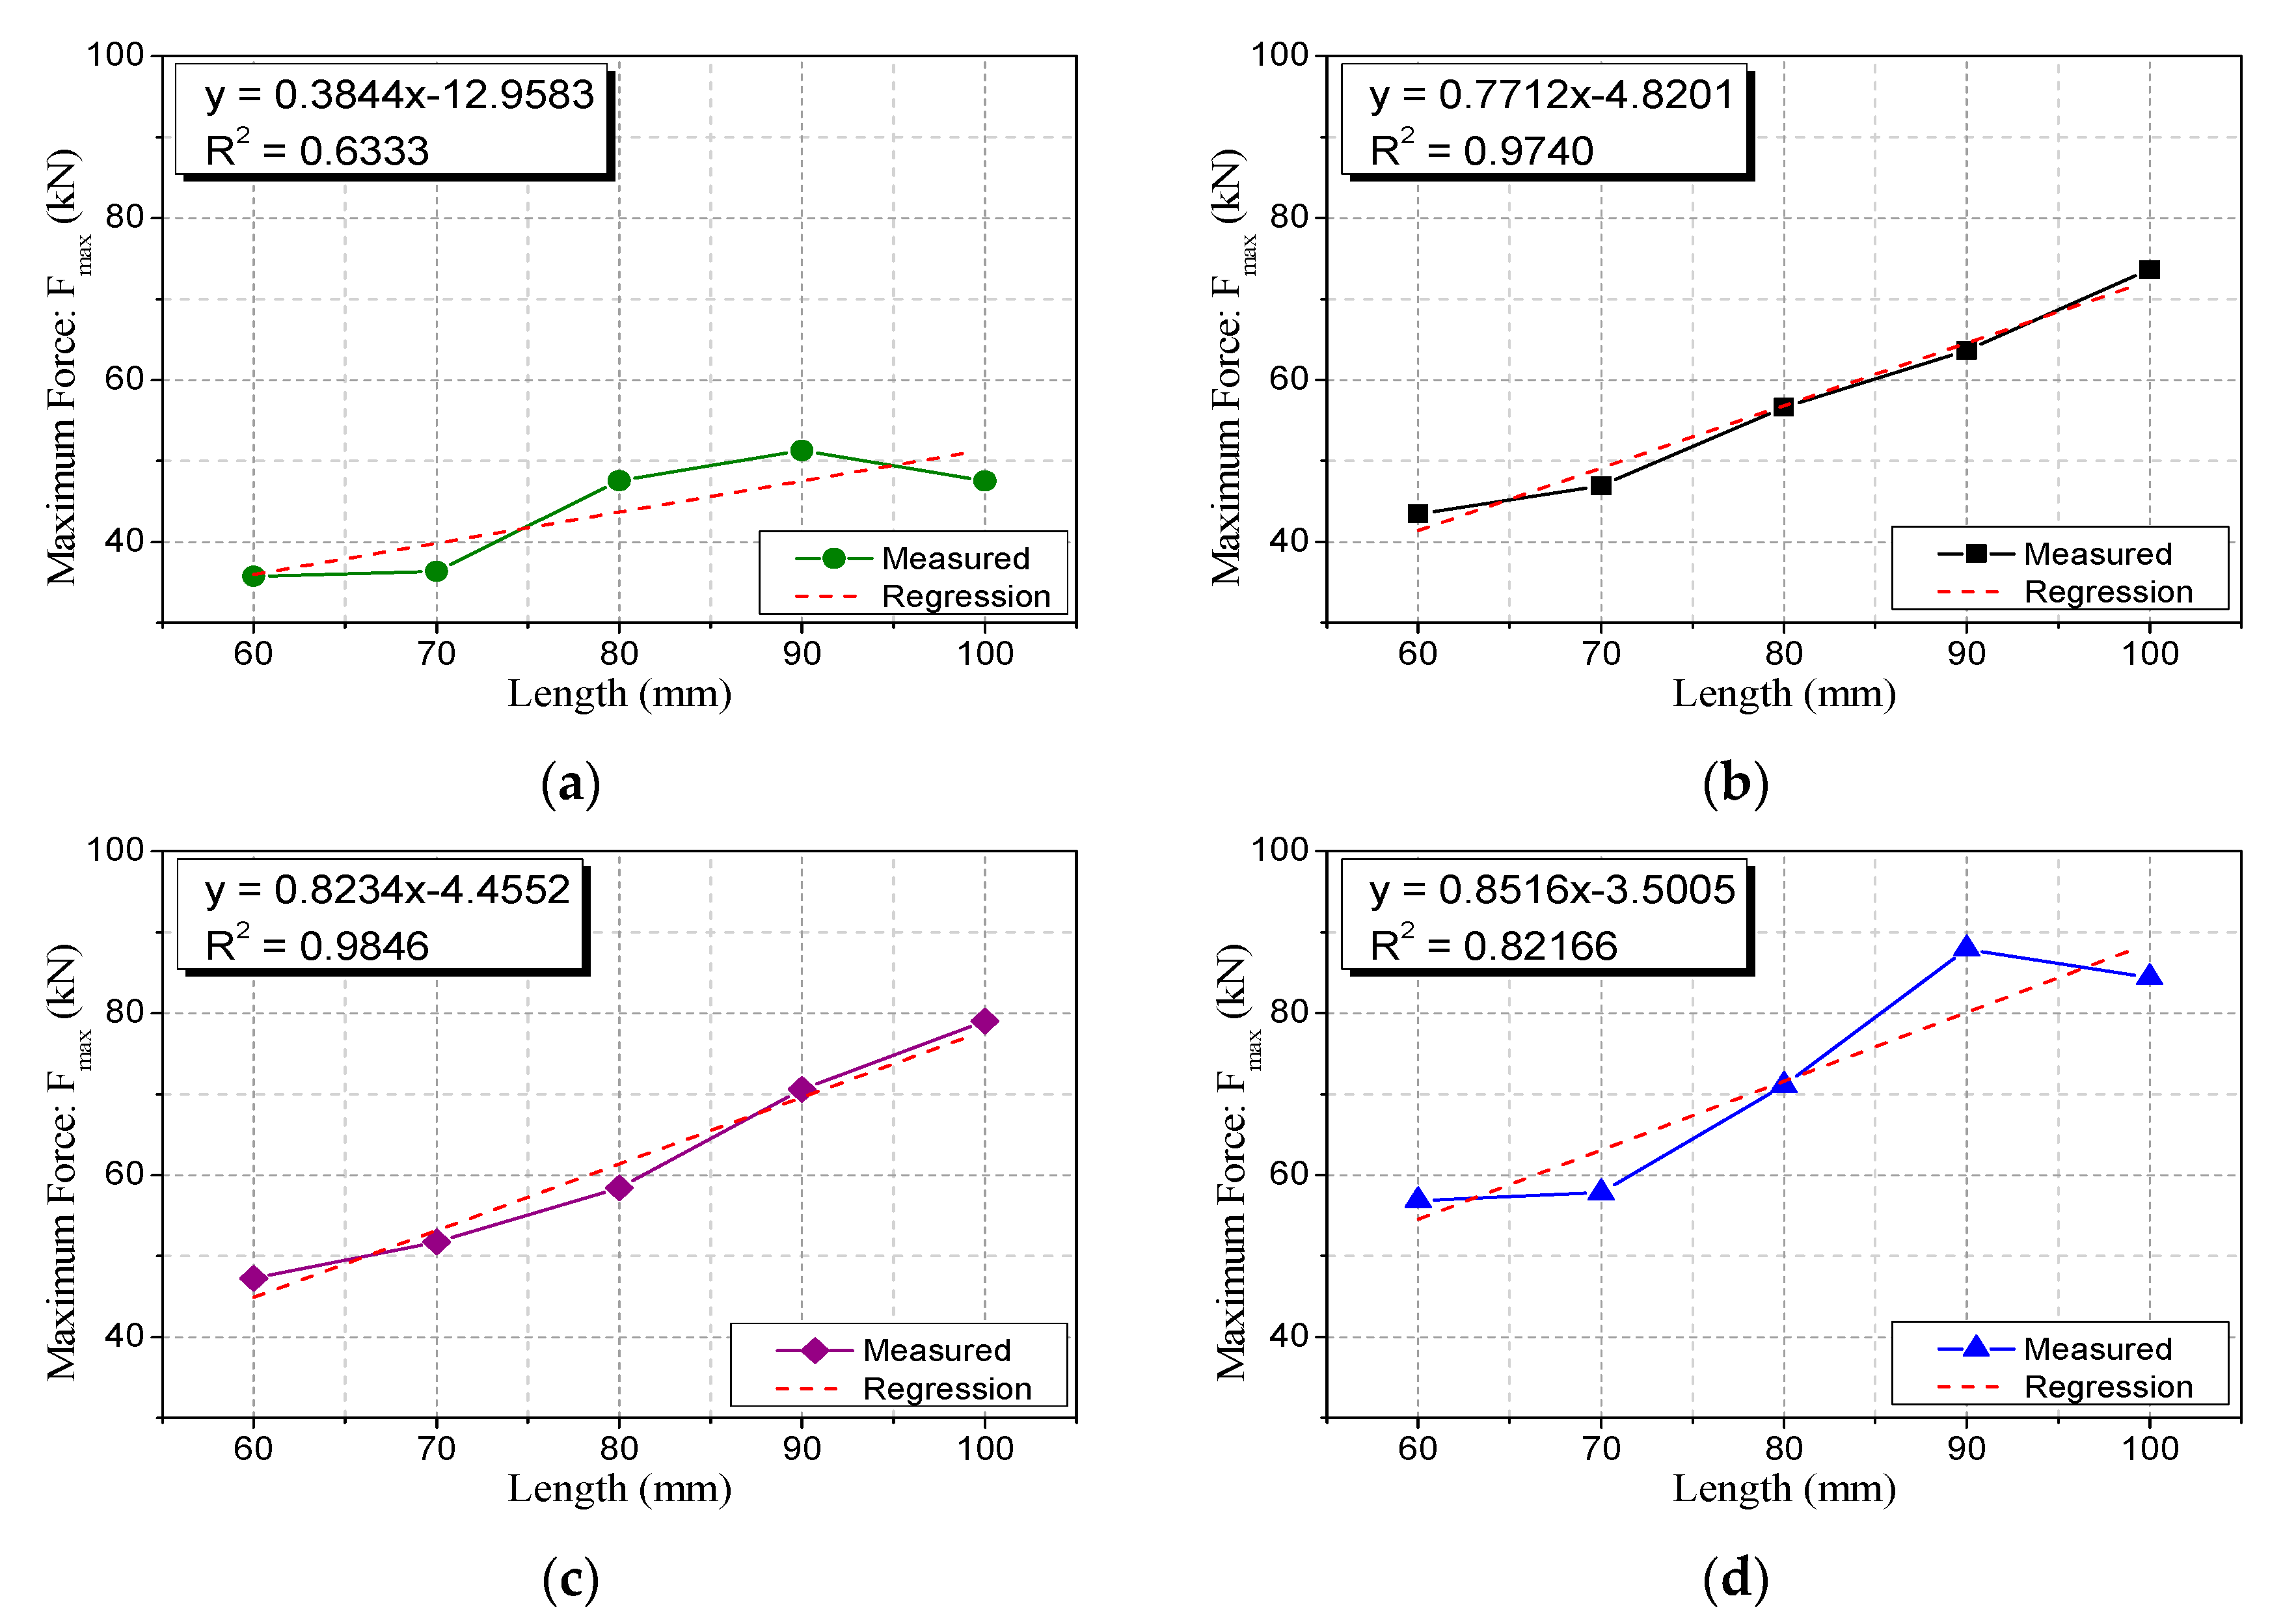
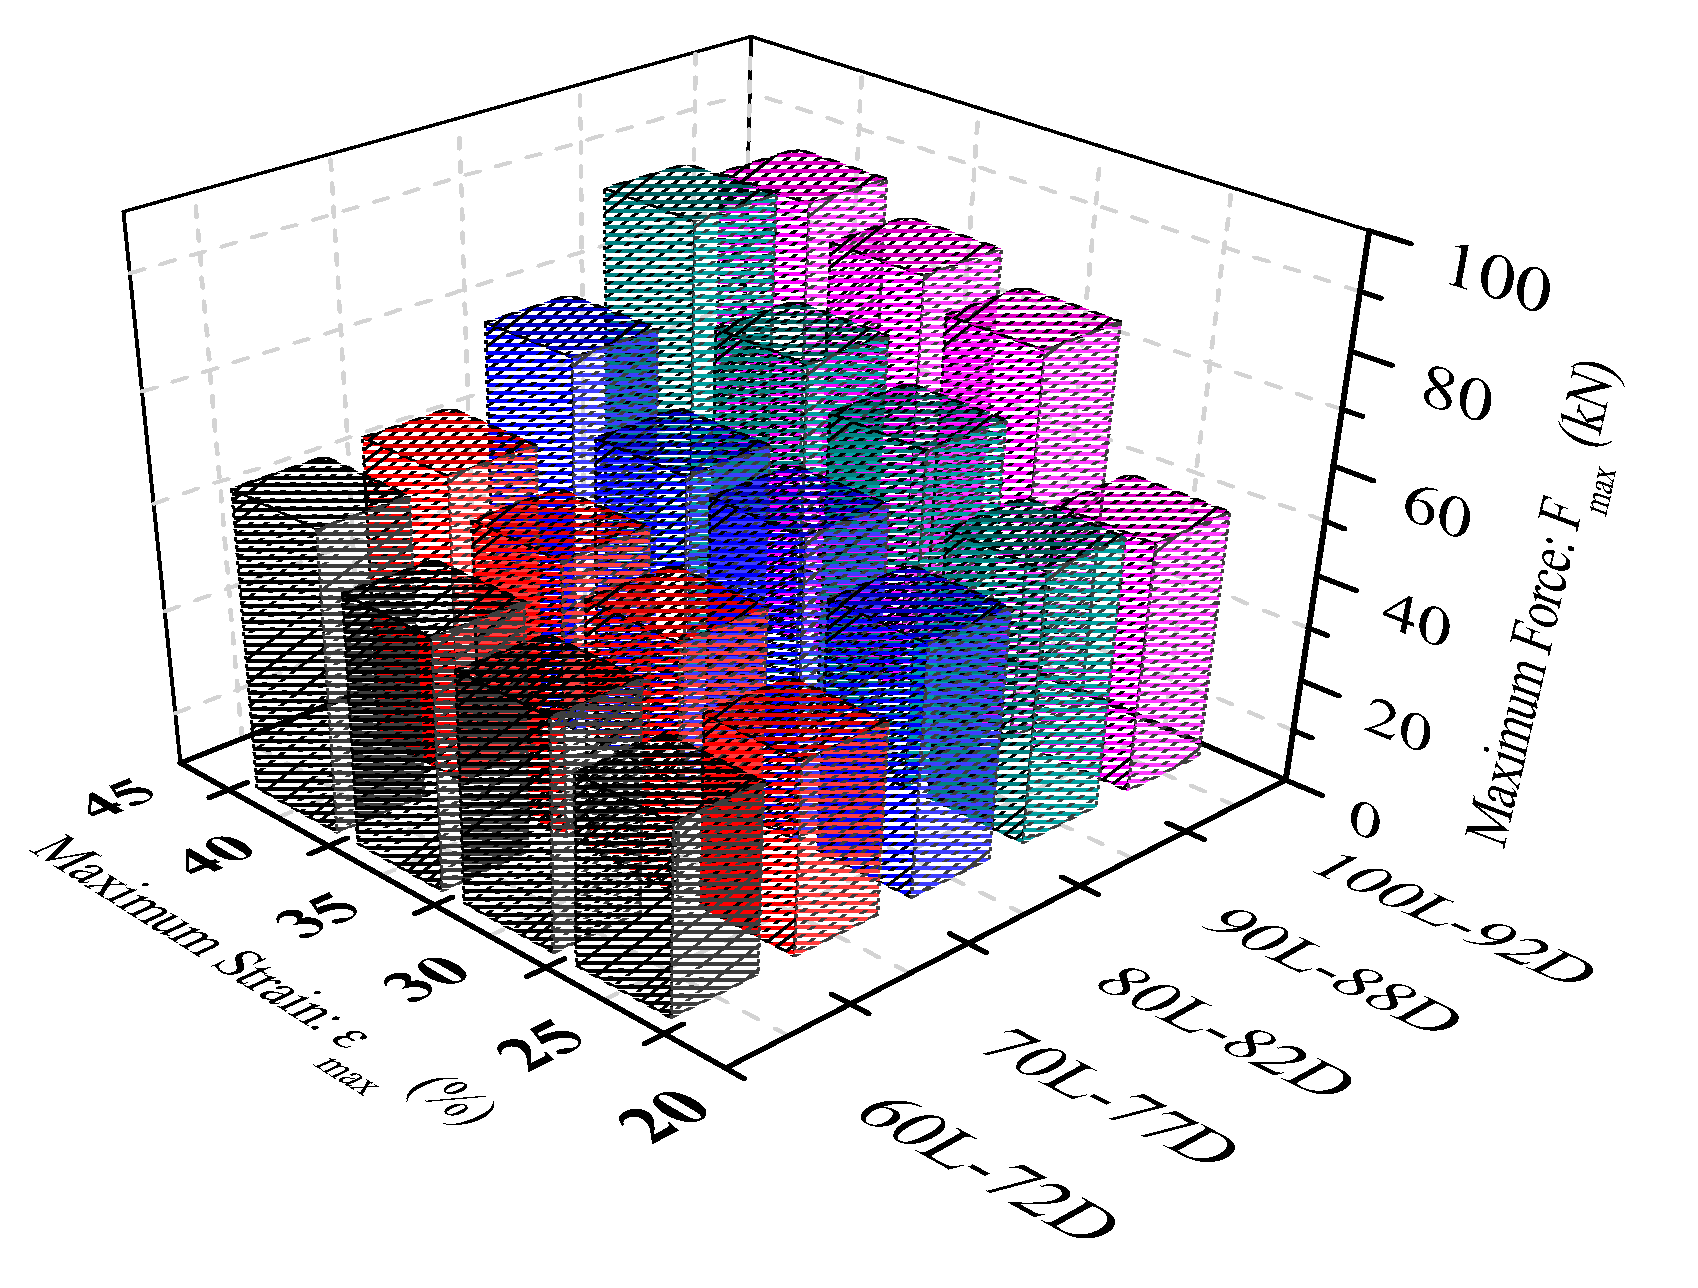
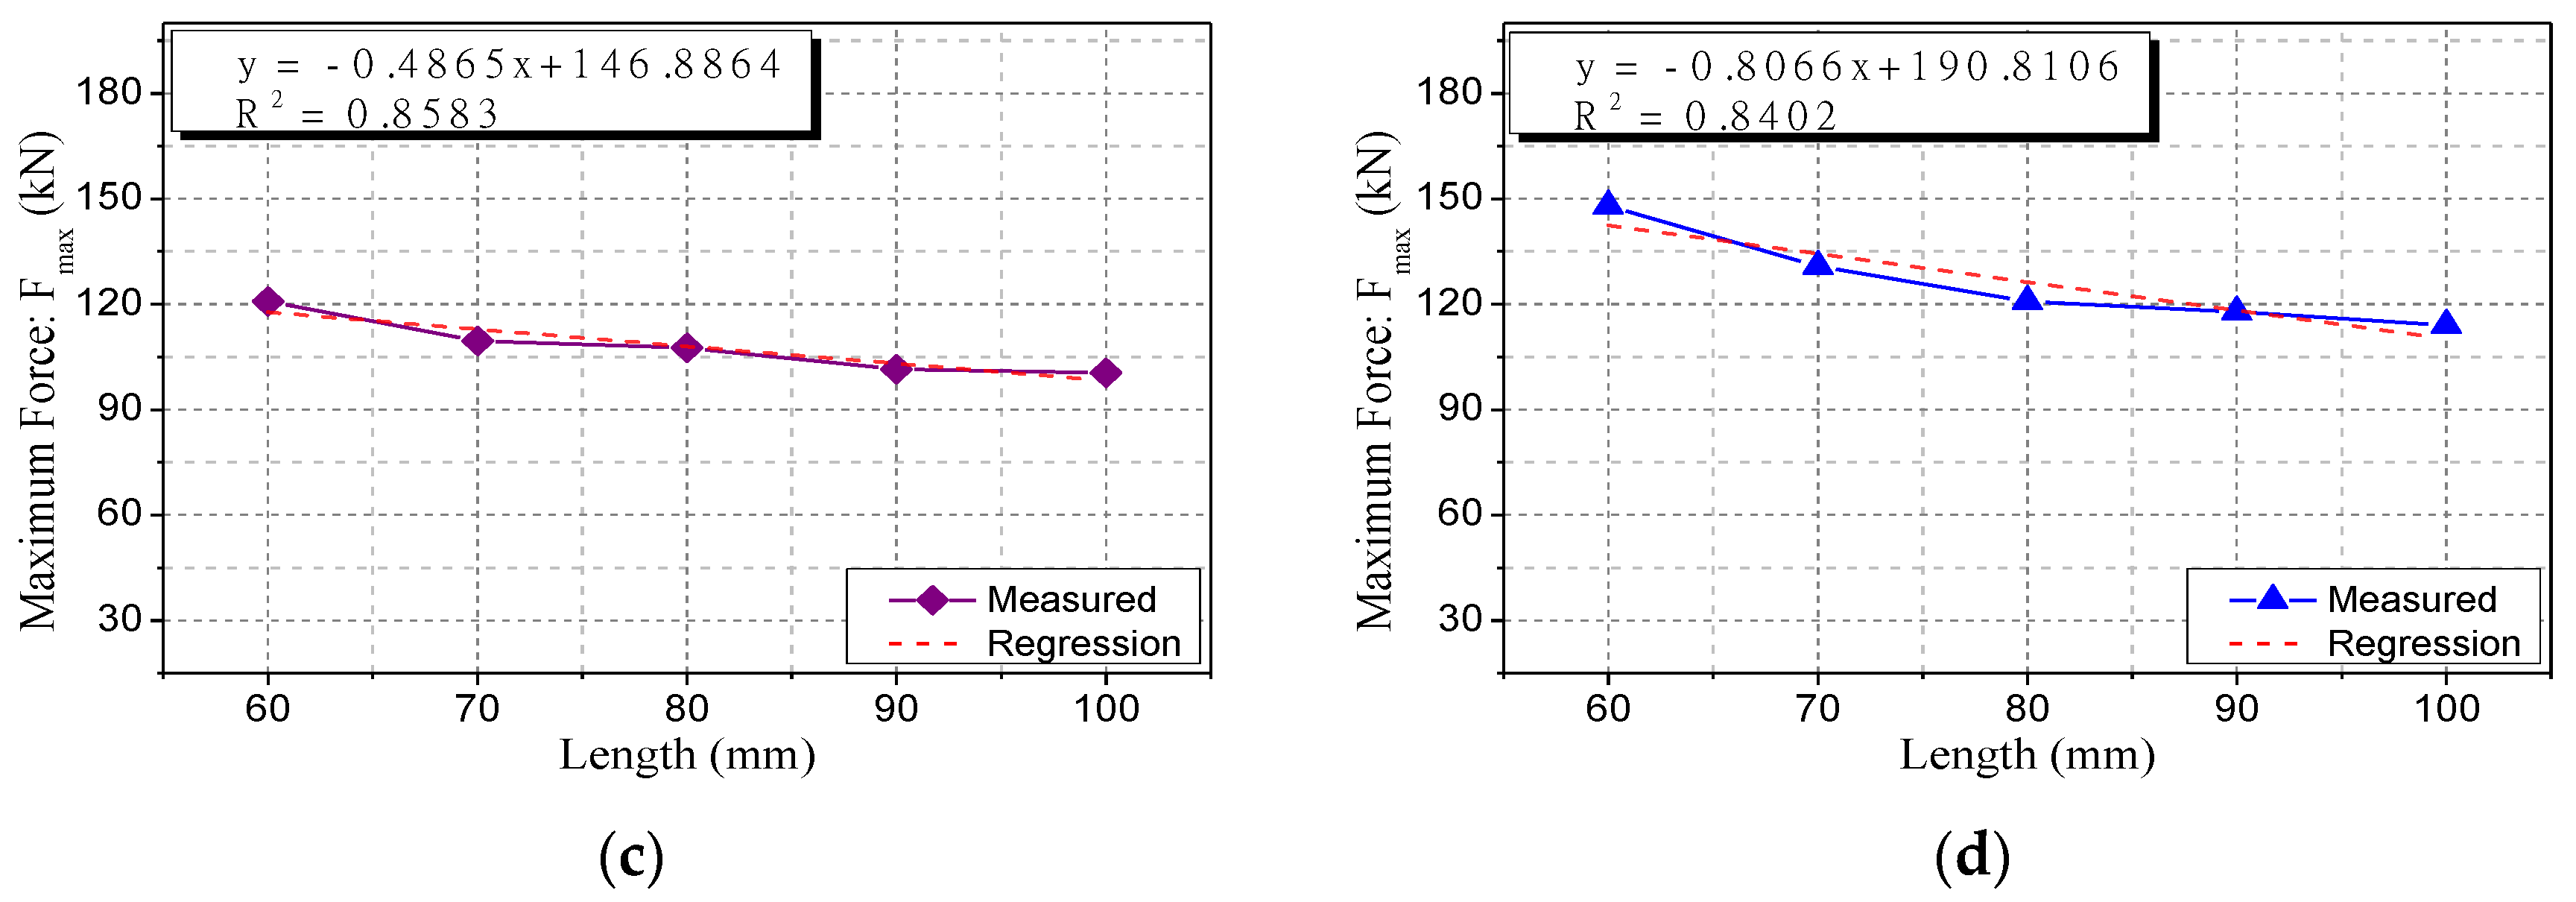
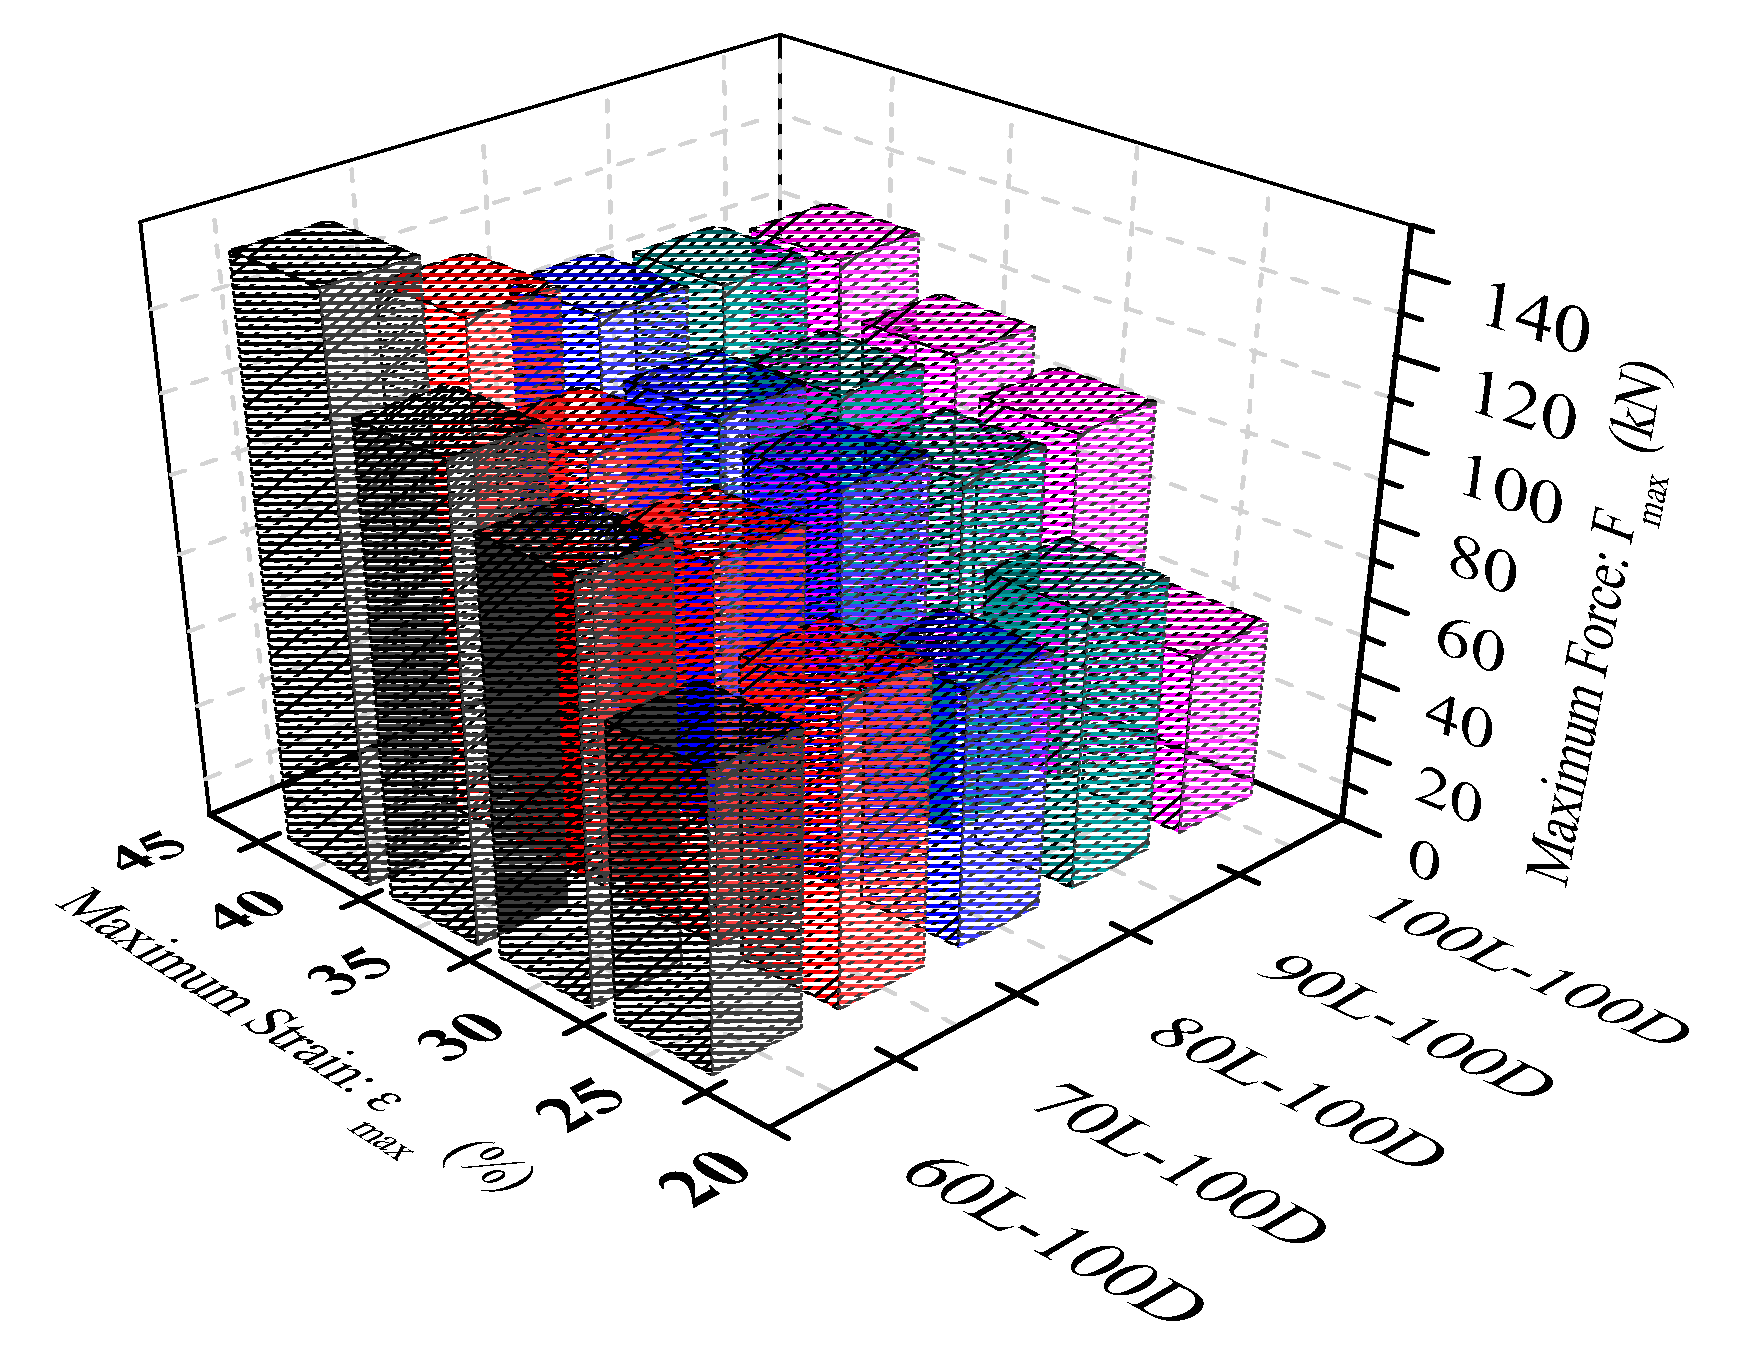
4.1. Type 1 Specimen Size Control

The Type 1 specimens had equal compressive stiffness but consisted of five different sizes, and there were twenty cases for each maximum strain rate of 25%, 30%, 35%, and 40%. The compressive behavior of the five different size specimens for the 30% maximum strain case is presented in Figure 5. The compression force (F) of the experimental specimens considerably decreased from the second loading after the first loading, and the unloading curve displays behavioral characteristics along a relatively similar path. In addition, residual displacement occurred as the compression force reached zero before the end of each cycle period. After the displacement also reached zero, it could be restored to a certain level. In the next cycle, the compression force increased again at the point where the corresponding displacement was not zero. This phenomenon may be attributed to the delay when polyurethane rubber springs are compressed and restored. Unlike other cases, the width of the curve at which the compression force decreased in the first cycle and the second cycle became very narrow (see Figure 5). This behavior took place because of the repeated experimental tests performed on the same specimen, which shows that when polyurethane rubber springs are subjected to a certain level of compression at least once, the same behavior cannot be obtained subsequently.
In general, strength degradation takes place after the initial compression, and subsequently, the rate of decrease declines and thus induces an equal compression force at the same displacement. Figure 6 presents the difference between the compressive behavior of the first cycle and the subsequent cycle. After the first cycle, the closed curve area of the force versus displacement graph greatly reduced, resulting in a significant decrease in the energy dissipation capacity. However, the area of the closed curve slightly decreased from the second cycle, and there was no significant difference between the loading and unloading paths. By analyzing the compressive hysteresis behavior of the same specimen for each cycle separately, the difference between the first and the subsequent cycles can be observed more clearly. Figure 6 presents the clear difference in strength degradation and energy dissipation capacity between the first and the subsequent cycles. Because the compression behavior of the polyurethane rubber springs under cyclic loading demonstrated a large difference between the first cycle and the subsequent cycles, for the purpose of evaluating the performance of the polyurethane rubber springs, such as the energy dissipation capacity, it was classified into the first compression performance and the subsequent performance. The applied performance points were different depending on the application purpose and environment.
As can be seen in Figure 7, within the same maximum strain, the maximum force (Fmax) tended to increase when the length of the specimen increased. The length conditions of the experimental specimens were designed to feature the same stiffness by adjusting the length and cross-sectional area of the Type 1 specimens, and therefore the change in length can reflect the variables of the specimen sizes. At 25% and 40% maximum strains, specimens with a length of 90 mm demonstrated a greater maximum force than those that were 100 mm in length. On the other hand, at 30% and 35% strains, both the specimen length and maximum force demonstrated an almost perfectly linear relationship. When the singularity for the 25% and 40% strains is considered, the overall trend demonstrates that the specimen length and the maximum force were proportional. This proportionality indicates that regardless of the stiffness of the specimen, the maximum force applied to the specimen can be adjusted according to the size of the specimen. Additionally, the maximum force and size of the specimen exhibited a positive linear relationship under the same stiffness and the size conditions of the designed specimens.
The maximum force and strain of the specimens with the same size and compressive stiffness were linearly proportional. The maximum force increased with the maximum strain (see Figure 8), and as mentioned above, the size of the specimen and the maximum force also increased proportionally. In addition, as can be seen in Table 3, which lists a summary of the results of the linear regression analysis of the relationship between maximum force and maximum strain, the R2 was almost 1, and it can be statistically inferred that the two variables had a linear relationship. Here, slope (a) means the slope of the linear regression equation, and Const. (b) means the y-intercept of the regression equation. Moreover, the slopes of the regression equations for 60L-72D-0P, 70L-77D-0P, and 80L-82D-0P demonstrated close values of 6.6998, 7.2369, and 6.9310, respectively. The slopes for 90L-88D-0P and 100L-92D-0P are 11.683 and 11.592, respectively, which are close. Accordingly, when cases for similar slopes are grouped, and the average slopes of three cases with a relatively small size and a relatively large size are compared, the case with a large size exhibits a gradient about 1.67 times larger. This indicates that even at the same compressive stiffness, the larger the size of the specimen, the higher the compressive force that can be accommodated at the same strain level. It was found that the difference in capacity reacted sensitively to the specimen size.
At the point where strain is not zero in the unloading curve of one cycle, the first strain, known as the unloading strain ( ε U L ), occurs, at which point the compressive force becomes zero. In addition, the unloading strain is restored immediately. This restored strain is defined as the recovered strain ( ε R C ), and the remaining strain, excluding the immediately restored strain, is defined as the residual strain ( ε R D ). The unloading strain, recover strain, and residual strain covered in this study are expressed as the average values for each cycle. Figure 9 presents a schematic drawing of the three strains defined above and the polyurethane rubber spring.
The unloading strain increased or decreased as the size of the specimen changed without any tendency, under other maximum strain conditions (see Figure 10a), except for the 40% maximum strain condition. However, the increase and decrease were small and occurred at a relatively constant level regardless of the change in the specimen size under the same maximum strain condition. The unloading strains of 3.87%, 4.83%, and 4.98% occurred on average under maximum 25%, 30%, 35%, and 40% strain conditions, respectively. Additionally, the size of the specimen remained constant, but when the maximum strain was varied, the unloading strain tended to increase with the maximum strain. Therefore, the unloading strain of the polyurethane rubber spring with the same compressive stiffness was generated at a constant level regardless of the size and in proportion to the maximum force. The residual strain also displayed a similar tendency to the unloading strain, and occurred at a similar level regardless of the specimen size under the same maximum strain conditions (see Figure 10b). The average residual strains were 1.81%, 1.45%, 2.29%, and 2.04% under the maximum strain conditions of 25%, 30%, 35%, and 40%, respectively. By contrast, when the maximum strain was a variable of the same size, the residual strain also increased with the maximum strain only for 100L-92D, and no distinct trend was observed in other specimens. It can be confirmed that the recover strain occurred at a constant level under the same maximum strain condition, irrespective of the change in size (see Figure 10c). The recover strains of 0.99%, 1.61%, 1.79%, and 1.48% took place under each maximum strain condition. Moreover, when the size was fixed and the maximum strain was varied, the recovered strain increased when increasing the maximum strain. In summary, the unloading, residual, and recovered strains were relatively constant, irrespective of the size, under the same compressive stiffness conditions, and were proportional to the maximum strain when the strain varied from 25% to 40%.

4.2. Type 2 Specimen Compressive Stiffness Contorl

In Type 2, a constant outer diameter of 100 mm was maintained, and the lengths of individual specimens were different at 60, 70, 80, 90, and 100 mm, so that the compressive stiffness of each case was designed to feature different values. The compressive behavior of each case demonstrated similar behavior without a significant difference from Type 1, and after the first cycle, compressive behavior stabilized with stress reduction.
The compressive stiffness decreased as the length of the specimen increased (see Figure 11). In other words, the change in the length of the specimen can be regarded as a change in the compressive stiffness of the specimen. Therefore, the relationships between the compressive stiffness and the maximum force were almost similar between the length and the maximum force. Because the cross-sectional area was constant, as the length increased in steps of 10 mm (from 60 mm to 100 mm) each, the compressive stiffness decreased in inverse proportion and the two variables had a negative linear relationship.
The relationships between the length and the maximum force under the same maximum strain condition were also observed between the compressive stiffness and the maximum force, considering the variation in the length of the specimen as a change in the compressive stiffness. As the compressive stiffness of each specimen decreased under the maximum strain conditions of 25%, 30%, 35%, and 40%, a decrease in maximum force was also observed, as presented in Figure 12, and the two variables displayed a relatively linear relationship. The R2 values obtained through the linear regression analysis for the 35% and 40% maximum strain conditions were 0.858 and 0.840, respectively, and the relationships between the two variables were relatively clear. However, the 25% and 30% maximum strain conditions yielded the R2 values of 0.1673 and 0.628, respectively, demonstrating weaker relationships between the two variables than the other strain cases.
The relationships between the maximum force, maximum strain and compressive stiffness of the specimens are depicted in Figure 13. As mentioned above, the maximum force increased as the compressive stiffness decreased, and the maximum force increased proportionally with the maximum strain. The first-order linear regression equations for the maximum strain and maximum force for each specimen are listed in Table 4. For all the specimens, the R2 values are close to 1, and thus the regression equation accurately reflects the measured data. As can be observed in the Type 1 specimens, the relationships between the strain and maximum force of the specimen in a fixed compressive stiffness state exhibited a linear relationship. The relationships between the two variables can be simplified through a first-order linear regression analysis.
The unloading strain slightly increased or decreased as the length of the specimen varied, but the increase and decrease were small and occurred at the same level, respectively (see Figure 14a). Under the conditions of 25%, 30%, 35%, and 40% of the maximum strain, the average unloading strains were 2.54%, 4.13%, 4.18% and 5.42%, respectively. It can be inferred that the stiffness of the specimen did not significantly influence the unloading strain. In addition, when the unloading strain had the same length as the specimen, the specimens with the lengths of 80, 90, and 100 mm displayed a tendency to increase as the maximum strain increased. However, in the relatively short specimens of 60 mm and 70 mm lengths, the maximum strain rate of 30% was greater than the 35% of the unloading strain. Figure 14b presents the variation in the length and strain of the residual strain. Under each maximum strain condition, the average residual strains were 1.51%, 2.48%, 2.54%, and 2.39%, respectively. However, when the maximum strain was changed in the same size of specimen, 60L-100D tended to increase proportionally to the maximum strain, as with the unloading strain. However, from 70L-100D, the longer the length, that is, the smaller the stiffness, the smaller the residual strain that occurred under 40% the maximum strain condition compared with the 35% condition. The recovered strain occurred at a constant level regardless of the stiffness of the specimen under the same maximum strain condition (see Figure 14c), and the average values were 0.83%, 1.62%, 1.29%, and 2.08% at maximum strains of 25%, 30%, 35%, and 40%, respectively. From these results, it can be inferred that when the load was removed, the recovery level and stiffness of the specimen were not significantly correlated.

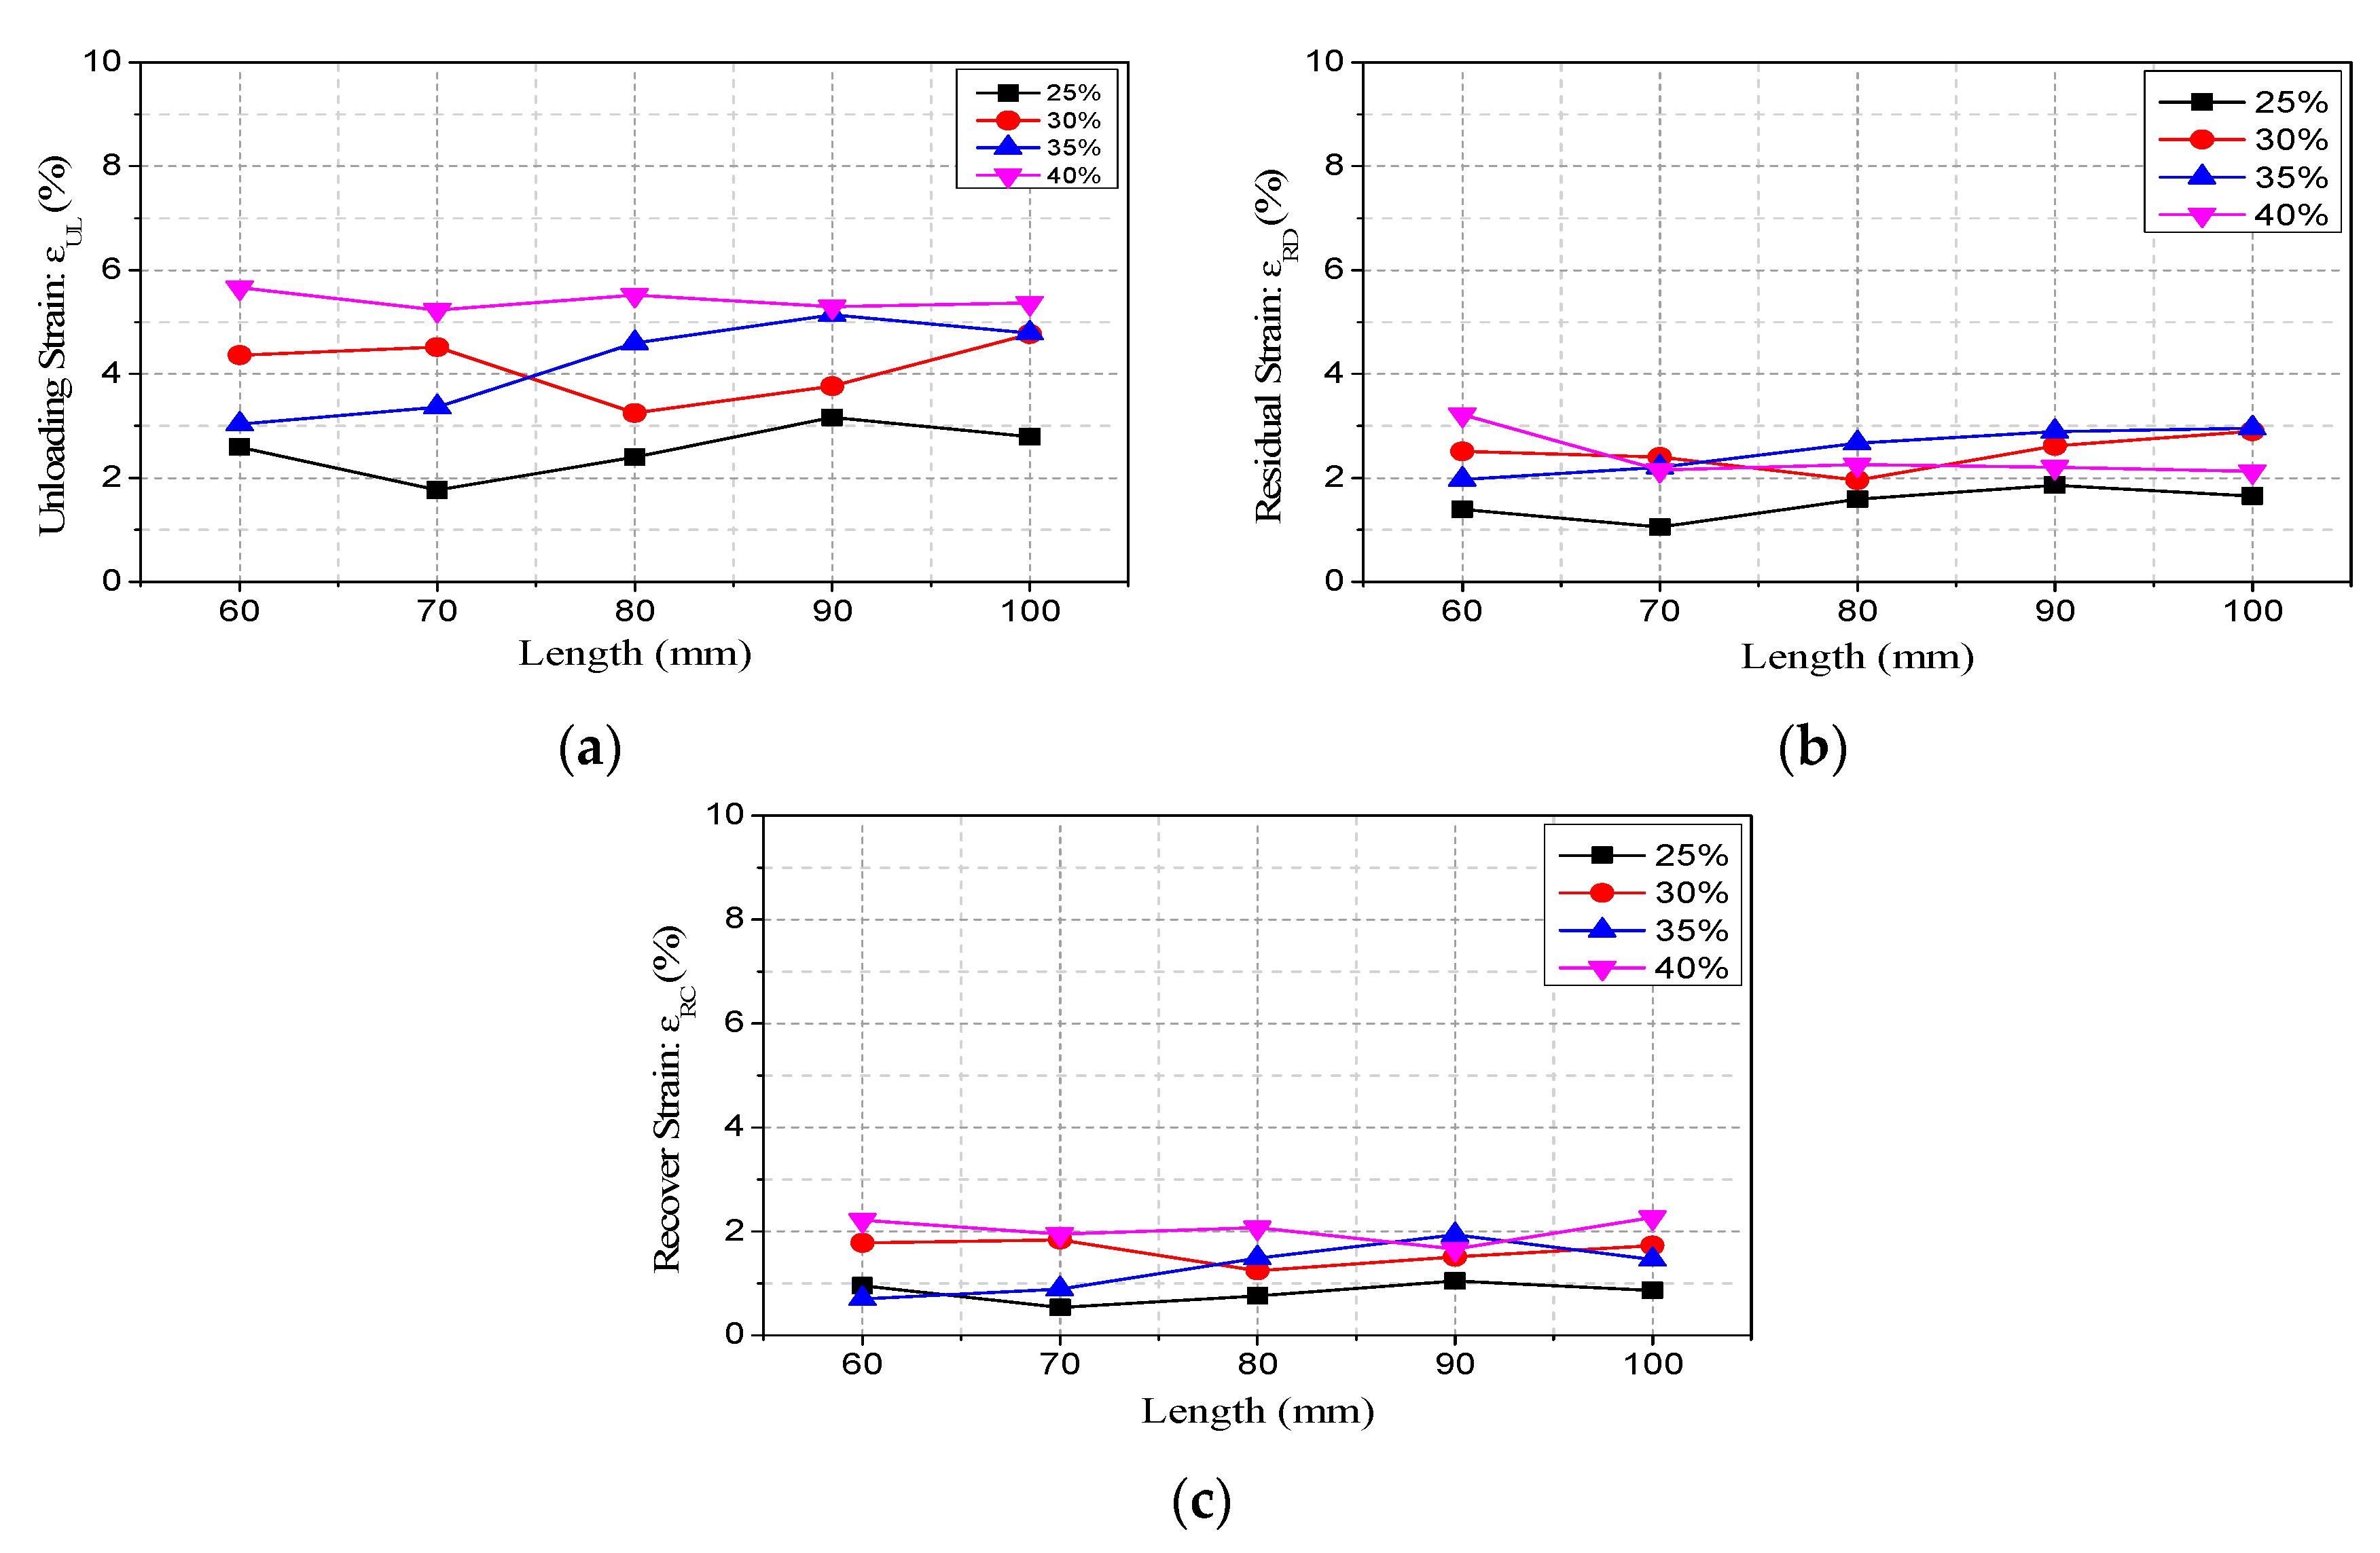
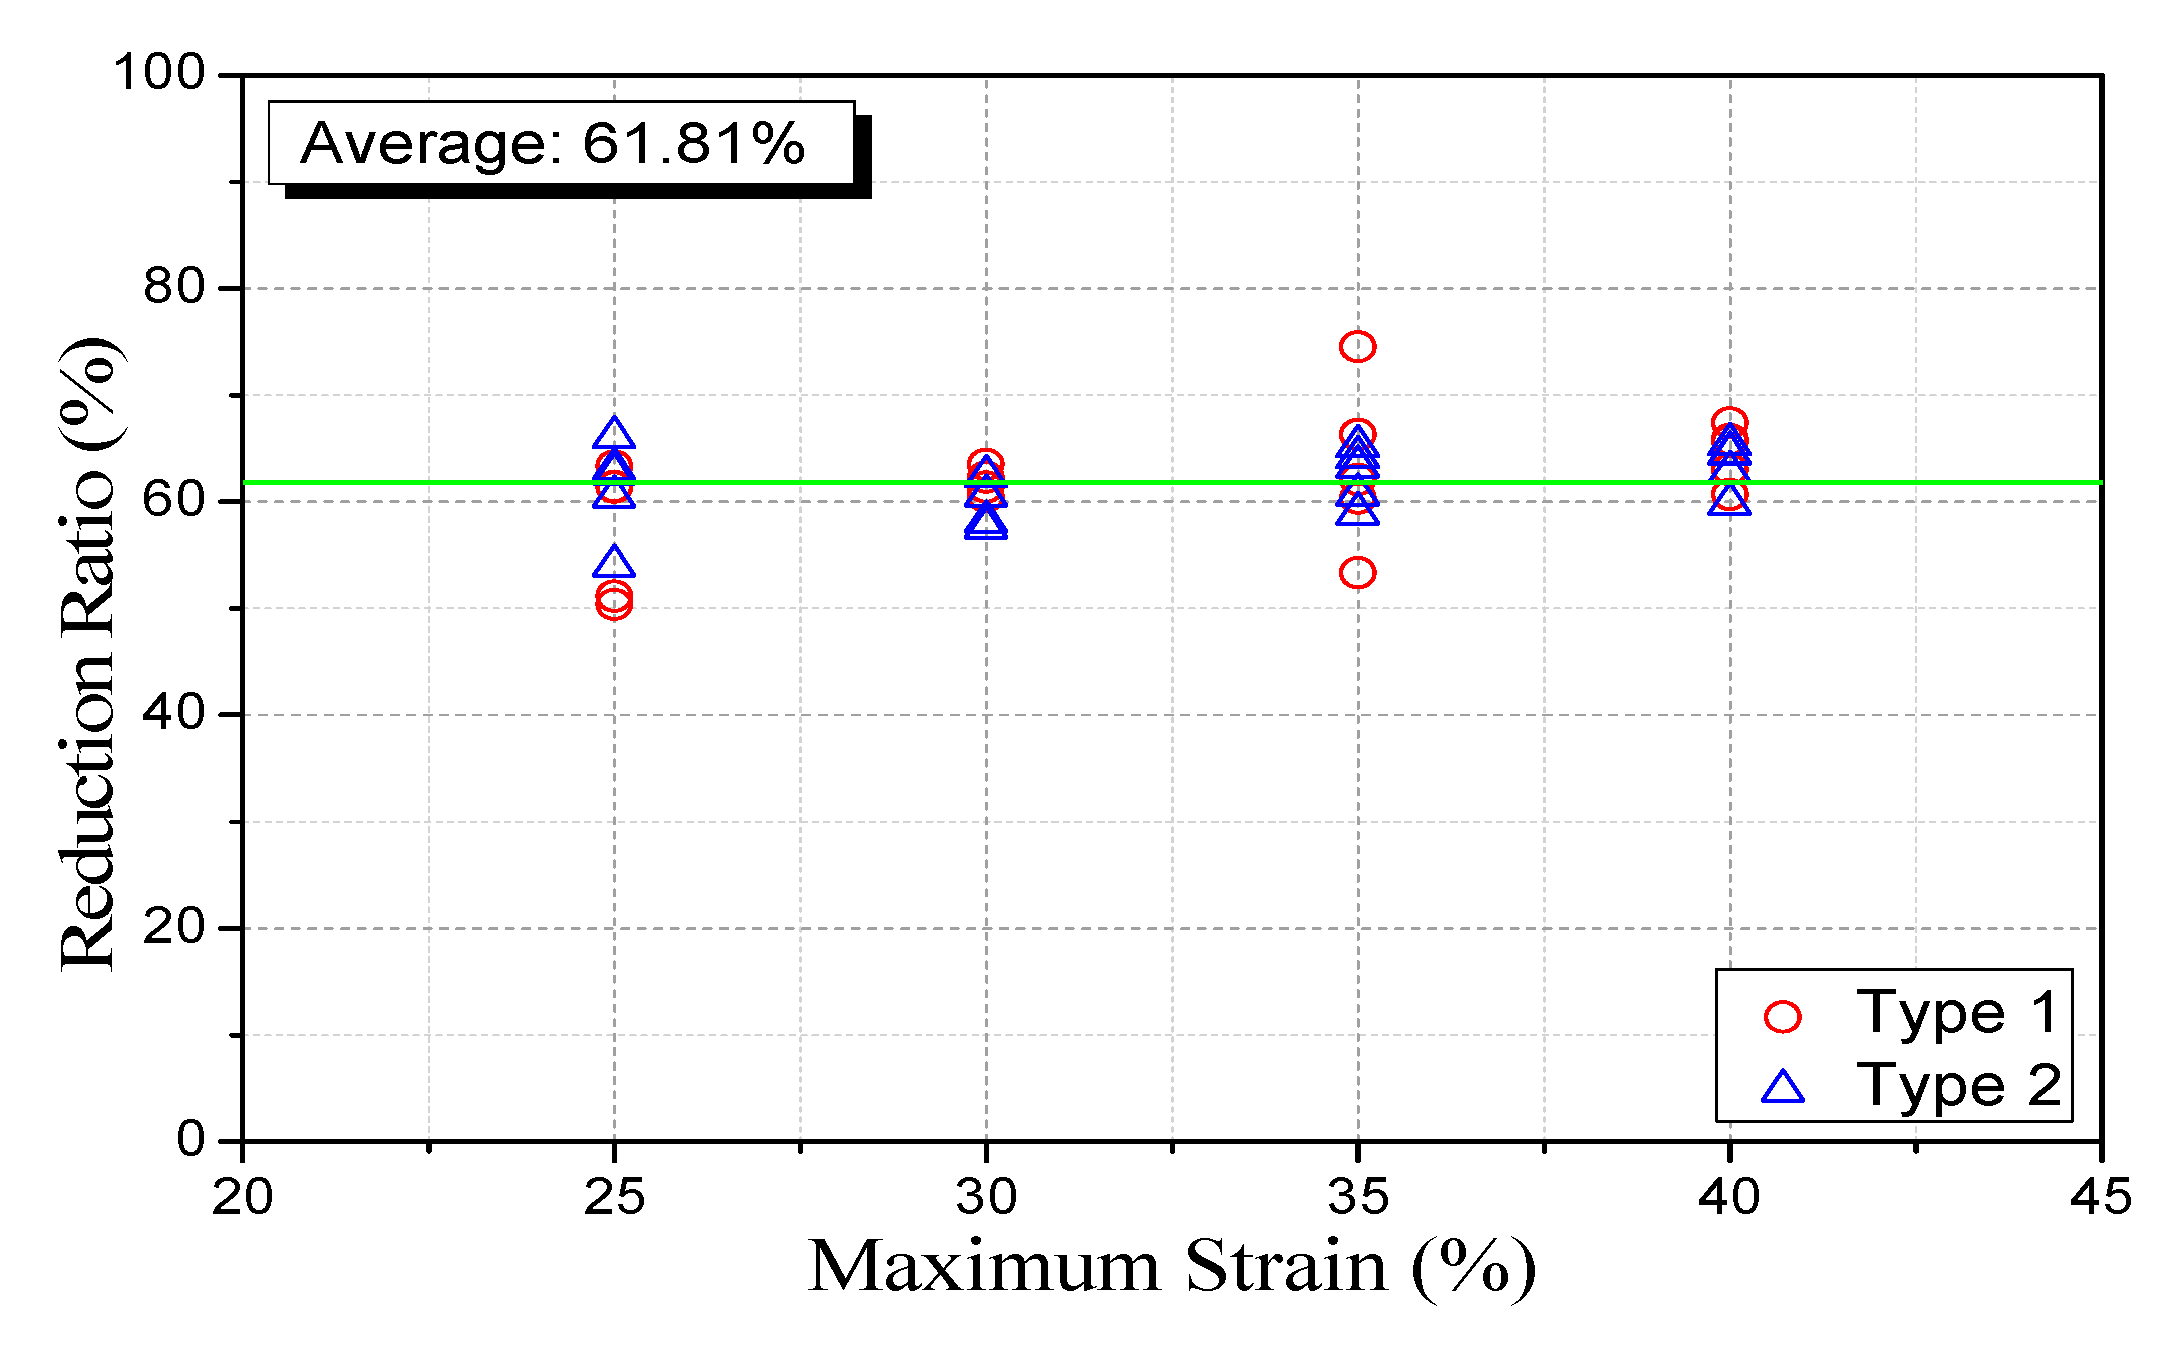
4.3. Energy Dissipation

Energy dissipation is an essential factor for evaluating the cyclic behavior of seismic devices, such as dampers and seismic isolators [38]. The energy dissipation of the polyurethane spring as a compression member can contribute to the energy dissipation capacity of the seismic device [39,40]. The energy dissipation of a pseudo static test can be defined as the area of the closed curve. Polyurethane rubber springs exhibit significant stress reduction after the first cycle. Here, the energy dissipation also decreased greatly. By calculating the reduction ratio of the energy dissipation defined by Equation (4), the amount reduced after the first cycle was confirmed. Here, E1 means the energy dissipation of the first cycle, and E2 means energy dissipation of the second cycle. Therefore, the reduction ratio means the ratio of the amount of reduction compared to the energy dissipation of the first cycle.
Reduction   Ratio = E 1 E 2 E 1   100   ( % )
Figure 15 shows the reduction ratio of all the cases, but two cases were excluded as they were measured through retest. Since polyurethane springs experience a significant reduction in energy dissipation from the second loading once they experience a load that exceeds the elastic range, the reused specimens were excluded from the results. As can be observed in Figure 15, the reduction ratio of the energy dissipation demonstrated a slight deviation for all cases, but was concentrated near an average of 61.81%. The reduction rate of the energy dissipation by compressive stiffness and size did not demonstrate a significant trend, which was judged according to the material properties of the polyurethane spring used in this study. However, the average values of the reduction ratios of Type 1 and Type 2 for each maximum strain were 59.38%, 60.79%, 62.88%, and 63.97%, respectively, demonstrating a greater decrease in energy dissipation as the maximum strain increased. The reduction ratio after the second cycle was an average of 10.81%, which decrease to about 1/6 of the reduction rate after the first cycle, and it can be seen that the energy dissipation was slightly decreased but relatively stable.

5. Conclusions

In this study, the compression behavior characteristics of polyurethane springs that can be used as compression members in seismic devices, such as dampers and seismic isolators, were experimentally verified. A cyclic loading test was performed on 40 specimens with different conditions, and size and compressive stiffness were set as the design variables. The maximum force, residual strain, and energy dissipation were used as performance indicators, the relationship with each design variable was identified, and the possibility of using a polyurethane spring as a compression member and considerations were reviewed. The main conclusions are as follows:
The polyurethane springs underwent stress relaxation after the first loading owing to the Mullins effect under cyclic loading conditions, and they were relatively stabilized in the second cycle. Under the same stiffness conditions, the size and maximum force of the specimens were almost proportional, and at 35% and 40% of the maximum strain, the compressive stiffness and maximum force demonstrated a linear relationship.
At the maximum strain of 25% to 40%, the maximum force typically presented a linear relationship with the maximum strain. This trend can be applied by idealizing the linear relationship with the maximum force within a specific strain range and introducing it into the design formula of a polyurethane spring.
The unloading, residual, and recovered strain could not confirm a significant trend according to compressive stiffness and size. However, except for some cases, the unloading strain and residual strain tended to increase in proportion to the maximum strain. Furthermore, they appeared at a similar level irrespective of the two variables. Therefore, it is concluded that it is necessary to study other variables that affect unloading, residual, and recovered strain.
The energy dissipation demonstrated a decrease rate of about 61.81% after the first cycle under cyclic loading conditions. The reduction ratio of the energy dissipation displayed a tendency to be concentrated near the average value, although there was a slight deviation. It is concluded that the two variables set in this study did not significantly affect the reduction of energy dissipation and were determined by the intrinsic properties of the material. In addition, under cyclic loading conditions, the polyurethane spring lost its original performance significantly by reducing its initial energy dissipation ability by more than 60%. Therefore, the energy dissipation of polyurethane springs is not expected to significantly contribute to the energy dissipation capacity of the system.
Finally, as a result of analyzing the effect of the compressive stiffness and size established in this study on the performance index of the polyurethane spring, the relationship with the maximum force could be clearly verified. If additional research is carried out, the possibility of deriving a simple design formula by linearly simplifying the nonlinear compression behavior of polyurethane springs can be confirmed. However, in the case of residual displacement and energy dissipation capacity, significant results were not obtained, so studies for deriving additional design variables should be conducted.

Author Contributions

Conceptualization, Y.H.J. and J.W.H.; methodology, Y.H.J. and J.W.H.; validation, Y.H.J. and J.W.H.; investigation, Y.H.J. and J.W.H.; writing—original draft preparation, Y.H.J. and J.W.H.; writing—review and editing, Y.H.J. and J.W.H.; visualization, Y.H.J. and J.W.H.; supervision, J.W.H.; project administration, Y.H.J. and J.W.H.; funding acquisition, J.W.H. All authors have read and agreed to the published version of the manuscript.

Funding

This work was supported by the National Research Foundation of Korea (NRF) grant funded by the Korea government (MSIT) (NRF-2021R1A2B5B02002599).

Institutional Review Board Statement

Not applicable.

Informed Consent Statement

Not applicable.

Data Availability Statement

Not applicable.

Conflicts of Interest

The authors declare no conflict of interest.

References

  1. Somarathna, H.; Raman, S.; Mohotti, D.; Mutalib, A.; Badri, K. The use of polyurethane for structural and infrastructural engineering applications: A state-of-the-art review. Constr. Build. Mater. 2018, 190, 995–1014. [Google Scholar] [CrossRef]
  2. Somarathna, H.; Raman, S.; Mohotti, D.; Mutalib, A.; Badri, K. Rate dependent tensile behavior of polyurethane under varying strain rates. Constr. Build. Mater. 2020, 254, 119203. [Google Scholar] [CrossRef]
  3. Damanpack, A.R.; Bodaghi, M.; Liao, W.-H. Contact/impact modeling and analysis of 4D printed shape memory polymer beams. Smart Mater. Struct. 2020, 29, 085016. [Google Scholar] [CrossRef]
  4. Li, P.; Guo, Y.; Shim, V. A rate-sensitive constitutive model for anisotropic cellular materials—Application to a transversely isotropic polyurethane foam. Int. J. Solids Struct. 2020, 206, 43–58. [Google Scholar] [CrossRef]
  5. Chou, C.-C.; Tsai, W.-J.; Chung, P.-T. Development and validation tests of a dual-core self-centering sandwiched buckling-restrained brace (SC-SBRB) for seismic resistance. Eng. Struct. 2016, 121, 30–41. [Google Scholar] [CrossRef]
  6. Fan, X.; Xu, L.; Li, Z. Seismic performance evaluation of steel frames with pre-pressed spring self-centering braces. J. Constr. Steel Res. 2019, 162, 105761. [Google Scholar] [CrossRef]
  7. Huang, H.; Chang, W.-S. Seismic resilience timber connection-adoption of shape memory alloy tubes as dowels. Struct. Control Health Monit. 2017, 24, e1980. [Google Scholar] [CrossRef] [Green Version]
  8. Oudah, F.; El-Hacha, R. Joint performance in concrete beam-column connections reinforced using SMA smart material. Eng. Struct. 2017, 151, 745–760. [Google Scholar] [CrossRef]
  9. Qiu, C.; Du, X. Seismic performance of multistory CBFs with novel recentering energy dissipative braces. J. Constr. Steel Res. 2019, 168, 105864. [Google Scholar] [CrossRef]
  10. Wang, Y.; Zhou, Z.; Xie, Q.; Huang, L. Theoretical analysis and experimental investigation of hysteretic performance of self-centering variable friction damper braces. Eng. Struct. 2020, 217, 110779. [Google Scholar] [CrossRef]
  11. Mirzai, N.M.; Attarnejad, R.; Hu, J.W. Enhancing the seismic performance of EBFs with vertical shear link using a new self-centering damper. Ingegneria Sismica 2018, 35, 57–76. [Google Scholar]
  12. Mirzai, N.M.; Attarnejad, R.; Hu, J.W. Analytical investigation of the behavior of a new smart recentering shear damper under cyclic loading. J. Intell. Mater. Syst. Struct. 2019, 31, 550–569. [Google Scholar] [CrossRef]
  13. Hu, J.W.; Leon, R.T. Analyses and evaluations for composite-moment frames with SMA PR-CFT connections. Nonlinear Dyn. 2011, 65, 433–455. [Google Scholar] [CrossRef]
  14. Song, G.; Ma, N.; Li, H.-N. Applications of shape memory alloys in civil structures. Eng. Struct. 2006, 28, 1266–1274. [Google Scholar] [CrossRef]
  15. Tamai, H.; Kitagawa, Y. Pseudoelastic behavior of shape memory alloy wire and its application to seismic resistance member for building. Comput. Mater. Sci. 2002, 25, 218–227. [Google Scholar] [CrossRef]
  16. Seo, J.; Kim, Y.C.; Hu, J.W. Pilot Study for Investigating the Cyclic Behavior of Slit Damper Systems with Recentering Shape Memory Alloy (SMA) Bending Bars Used for Seismic Restrainers. Appl. Sci. 2015, 5, 187–208. [Google Scholar] [CrossRef]
  17. McCormick, J.; Desroches, R.; Fugazza, D.; Auricchio, F. Seismic Assessment of Concentrically Braced Steel Frames with Shape Memory Alloy Braces. J. Struct. Eng. 2007, 133, 862–870. [Google Scholar] [CrossRef] [Green Version]
  18. Hu, J.W.; Lee, J.; Seo, J. Performance-based optimal design of self-centering friction damping brace systems between recentering capability and energy dissipation. J. Mech. Sci. Technol. 2014, 28, 3129–3136. [Google Scholar] [CrossRef]
  19. Kikuchi, M.; Aiken, I.D. An analytical hysteresis model for elastomeric seismic isolation bearings. J. Int. Assoc. Earthq. Eng. 1997, 26, 215–231. [Google Scholar] [CrossRef]
  20. Gökçe, T.; Yüksel, E.; Orakdöğen, E. Seismic performance enhancement of high-voltage post insulators by a polyurethane spring isolation device. Bull. Earthq. Eng. 2018, 17, 1739–1762. [Google Scholar] [CrossRef]
  21. Oertel, G. Polyurethane Handbook; Hanser Publishers: Munich, Germany, 1994. [Google Scholar]
  22. Jeong, B.; Cheon, J.; Chun, J.; Mok, D.; Lee, H. Synthesis and Characterization of Polyurethane Elastomer. J. Adhes. Interface 2009, 10, 169–173. [Google Scholar]
  23. Petrovic, Z.S.; Ferguson, J. Polyurethane elastomers. Prog. Polym. Sci. 1991, 16, 695–836. [Google Scholar] [CrossRef]
  24. Mirzai, N.M.; Hu, J.W. Pilot study for investigating the inelastic response of a new axial smart damper combined with friction devices. Steel Compos. Struct. 2019, 32, 373–388. [Google Scholar] [CrossRef]
  25. Cui, H.; Wu, G.; Zhang, J.; Xu, J. Experimental study on damage-controllable rocking walls with resilient corners. Mag. Concr. Res. 2019, 71, 1113–1129. [Google Scholar] [CrossRef]
  26. Szczepański, M.; Migda, W.; Jankowski, R. Experimental Study on Dynamics of Wooden House Wall Panels with Different Thermal Isolation. Appl. Sci. 2019, 9, 4387. [Google Scholar] [CrossRef] [Green Version]
  27. Peng, Y.; Huang, T. Sliding implant-magnetic bearing for adaptive seismic mitigation of base-isolated structures. Struct. Control Health Monit. 2019, 26, e2431. [Google Scholar] [CrossRef]
  28. Choi, E.; Lee, J.; Youn, H. An Experimental Study on the Performance of a Damper Fabricated by Dual Rubber Springs. Int. J. Steel Struct. 2020, 20, 1891–1903. [Google Scholar] [CrossRef]
  29. Migda, W.; Szczepański, M.; Jankowski, R. Increasing the Seismic Resistance of Wood-frame Buildings by Applying PU Foam as Thermal Insulation. Period. Polytech. Civ. Eng. 2019, 63, 480–488. [Google Scholar] [CrossRef] [Green Version]
  30. Choi, E.; Jeon, J.S.; Seo, J. Cyclic compressive behavior of polyurethane rubber springs for smart dampers. Smart Struct. Syst. 2017, 20, 739–757. [Google Scholar] [CrossRef]
  31. Yuan, Y.; Wang, S.; Tan, P.; Zhu, H. Mechanical performance and shear constitutive model study of a new high-capacity polyurethane elastomeric bearing. Constr. Build. Mater. 2020, 232, 117227. [Google Scholar] [CrossRef]
  32. Qi, H.; Boyce, M. Stress–strain behavior of thermoplastic polyurethanes. Mech. Mater. 2005, 37, 817–839. [Google Scholar] [CrossRef]
  33. Jeon, J.-H.; Park, S.-M.; Um, G.-Y.; Bea, J.-W. A Study on Friction-induced Surface Fracture Behaviors of Thermoplastic Polyurethane (TPU)/Rubber Blends. Adhes. Interface 2013, 14, 121–127. [Google Scholar] [CrossRef] [Green Version]
  34. Zhang, Y.; Zhang, P.; Zhang, S.; Wang, Z.; Li, N.; Silva, S.R.P.; Shao, G. A flexible metallic TiC nanofiber/vertical graphene 1D / 2D heterostructured as active electrocatalyst for advanced Li–S batteries. InfoMat 2021, 3, 790–803. [Google Scholar] [CrossRef]
  35. Zhang, Y.; Zhang, P.; Li, B.; Zhang, S.; Liu, K.; Hou, R.; Zhang, X.; Silva, S.R.P.; Shao, G. Vertically aligned graphene nanosheets on multi-yolk/shell structured TiC@C nanofibers for stable Li–S batteries. Energy Storage Mater. 2020, 27, 159–168. [Google Scholar] [CrossRef]
  36. Zhang, P.; Li, Y.; Zhang, Y.; Hou, R.; Zhang, X.; Xue, C.; Wang, S.; Zhu, B.; Li, N.; Shao, G. Photogenerated Electron Transfer Process in Heterojunctions: In Situ Irradiation XPS. Small Methods 2020, 4, 2000214. [Google Scholar] [CrossRef]
  37. Koblar, D.; Škofic, J.; Boltežar, M. Evaluation of the Young’s Modulus of Rubber-Like Materials Bonded to Rigid Surfaces with Respect to Poisson’s Ratio. Strojniški Vestnik—J. Mechan. Eng. 2014, 60, 506–511. [Google Scholar] [CrossRef] [Green Version]
  38. Mirzai, N.M.; Attarnejad, R.; Hu, J.W. Experimental investigation of smart shear dampers with re-centering and friction devices. J. Build. Eng. 2021, 35, 102018. [Google Scholar] [CrossRef]
  39. Darwin, D.; Nmai, C.K. Energy Dissipation in RC Beams Under Cyclic Load. J. Struct. Eng. 1986, 112, 1829–1846. [Google Scholar] [CrossRef]
  40. Al-Jaberi, Z.; Myers, J.J.; ElGawady, M. Pseudo-static cyclic loading comparison of reinforced masonry walls strengthened with FRCM or NSM FRP. Constr. Build. Mater. 2018, 167, 482–495. [Google Scholar] [CrossRef]
Figure 1. Design of experimental specimens. (a) Isometic view. (b) Identification (ID) of specimens.
Applsci 11 10223 g001
Figure 2. Two types of experimental specimens.
Applsci 11 10223 g002
Figure 3. Dimension of the jig.
Applsci 11 10223 g003
Figure 4. Loading protocol of the cyclic loading test.
Applsci 11 10223 g004
Figure 5. Compressive behavior without precompression (Type 1 specimens). (a) 60L-72D-0P-30%; (b) 70L-77D-0P-30%; (c) 80L-82D-0P-30%; (d) 90L-88D-0P-30%; (e) 100L-92D-0P-30%.
Applsci 11 10223 g005
Figure 6. Force-displacement curve cycle separation. (a) Behavior of 1st cycle; (b) behavior of 2nd and 3rd cycle.
Applsci 11 10223 g006
Figure 7. Relationship between length and maximum force. (a) Type 1-25%; (b) Type 1-30%; (c) Type 1-35%; (d) Type 1-40%.
Applsci 11 10223 g007
Figure 8. Relationship between maximum strain and maximum force.
Applsci 11 10223 g008
Figure 9. Schematic drawing of hysteretic behavior.
Applsci 11 10223 g009
Figure 10. Behavior of three types of strain corresponding to each maximum strain in Type1. (a) Unloading strain; (b) residual strain; (c) recover strain.
Applsci 11 10223 g010
Figure 11. Relationships between compressive stiffness and length in Type 2 specimens.
Applsci 11 10223 g011
Figure 12. Relationships between stiffness, length, and maximum force. (a) Type 2-25%; (b) Type 2-30%; (c) Type 2-35%; (d) Type 2-40%.
Applsci 11 10223 g012aApplsci 11 10223 g012b
Figure 13. Relationships between maximum strain and maximum force.
Applsci 11 10223 g013
Figure 14. Behavior of three types of strain corresponding to each maximum strain in Type 2. (a) Unloading strain; (b) residual strain; (c) recover strain.
Applsci 11 10223 g014
Figure 15. Energy dissipation reduction ratio of all Types.
Applsci 11 10223 g015
Table 1. Properties of experimental specimens.
TypeD (mm)Din (mm)L (mm)SEa (MPa)kc (kN/mm)
192201000.1887.215.52
8820900.2088.035.85
8220800.2088.375.72
7720700.2189.035.80
7220600.2389.975.96
2100201000.2188.576.87
10020900.2389.947.75
10020800.2691.868.90
10020700.2994.6510.48
10020600.3498.9512.79
Table 2. Experimental conditions.
Maximum   Strain   ( ε m a x ,   % ) 25, 30, 35, 40
Loading Speed
( v L , mm/s)
0.5
Loading Cycle3
Temperature (°C)25
Table 3. Regression between maximum strain and force in Type 1.
SpecimenSlop (a)Const. (b) R 2
60L-72D-0P6.699829.0970.9757
70L-77D-0P7.236540.3410.9299
80L-82D-0P6.931030.9000.9699
90L-88D-0P11.68339.1630.9731
100L-92-0P11.59242.1760.8388
Table 4. Regression between maximum strain and force in Type 2 specimens.
SpecimenSlop (a)Const. (b) R 2
60L-100D-0P22.94655.510.9826
70L-100D-0P17.04461.3120.9906
80L-100D-0P16.70957.5570.8801
90L-100D-0P14.51359.8380.9784
100L-100-0P20.75736.7560.8649
Publisher’s Note: MDPI stays neutral with regard to jurisdictional claims in published maps and institutional affiliations.

