1. Introduction
People’s life rhythm has rapidly changed and it has caused an unreasonable dietary structure as well as irregular work and rest. Therefore, blood pressure (BP)-related diseases, such as cardiovascular diseases, hypertension, etc., have become more and more common [
1]. BP is one of the important physiological parameters for preventing BP-related diseases. In the early stage of these diseases, there are no obvious symptoms outside the body and motoring BP can effectively prevent these diseases. Therefore, developing a BP estimation is significant for routine healthcare.
Cuff-based BP monitoring devices are commonly used to estimate BP, but these devices are inconvenient and uncomfortable for patients. To overcome some of these problems, many researchers developed cuffless BP estimations, which are based on pulse transit time (PTT), photoplethysmography (PPG), or electrocardiogram (ECG) [
2,
3,
4,
5]. Generally, PTT refers to the time it takes a pulse wave to travel between two arterial sites and can be calculated by using ECG and PPG [
2]. However, the PTT-based approaches used fixed relationships between BP and PTT, which will be easily affected by vascular tone or physiological status. Thus, the PTT-based approaches have low accuracy and robustness.
Some studies have shown that ECG and PPG signals can be used to effectively estimate BP and increase the accuracy of the estimation [
6,
7,
8,
9,
10,
11]. Chen et al. applied a support vector machine and random forest regression model to estimate the BP [
7]. Proença et al. adopted a nonlinear equation to express the relationship between pulse arrival time (PAT) and BP [
8]. Whong and Poon used linear regression to find the relationship between BP, PAT, and heart rate [
9]. For these approaches, only simple machine learning methods were adopted to estimate BP. Therefore, novel machine learning methods have been successfully used in many applications and can effectively increase the accuracy of BP estimation.
Recently, deep learning had been successfully applied in many applications, and then much research had been proposed to accurately estimate BP [
10,
11,
12,
13,
14,
15]. Wu et al. used a backpropagation neural network and radial basis function to estimate the BP. However, the backpropagation neural network has weak generalization ability [
10]. Wu applied deep learning and human physiological characteristics to estimate BP, which can obtain better results compared with backpropagation neural networks [
11]. However, it has high computational complexity and is not suitable for real-time applications. Baek et al. proposed a convolutional neural network (CNN)-based BP estimation model, which processes sequential ECG and PPG signals for estimating BP [
12]. However, the CNN-based BP estimation model did not use the time-serious information of ECG and PPG signals. Therefore, Argha used long short-term memory (LSTM) to improve the performance of the BP estimation [
13]. Nowadays, CNN-LSTM has been developed to combine the advantages of CNN and LSTM. CNN-LSTM can estimate BP by using ECG and PPG signals [
14,
15], but these methods are still not convenient enough. To improve the performance of CNN-LSTM, an attention mechanism had been proposed and applied to many applications [
16,
17]. Therefore, integrating the attention mechanism with CNN-LSTM can efficiently increase the accuracy of BP estimation.
In this study, an attention mechanism-based CNN-LSTM is proposed to predict BP by using ECG and PPG signals. To precisely represent the characteristics of ECG and PPG signals, time and frequency domain ECG and PPG signals are selected as the inputs of neural networks. To correctly extract the features of ECG and PPG signals, the CNNs are adopted to process the time and frequency domain signals. To identify the meaningful features, the attention mechanism is applied. To model the characteristics of time series, the LSTM layers are used. Finally, the fully connected networks are used to integrate the information of previous neural networks and to estimate BP.
2. Blood Pressure Estimation Methods
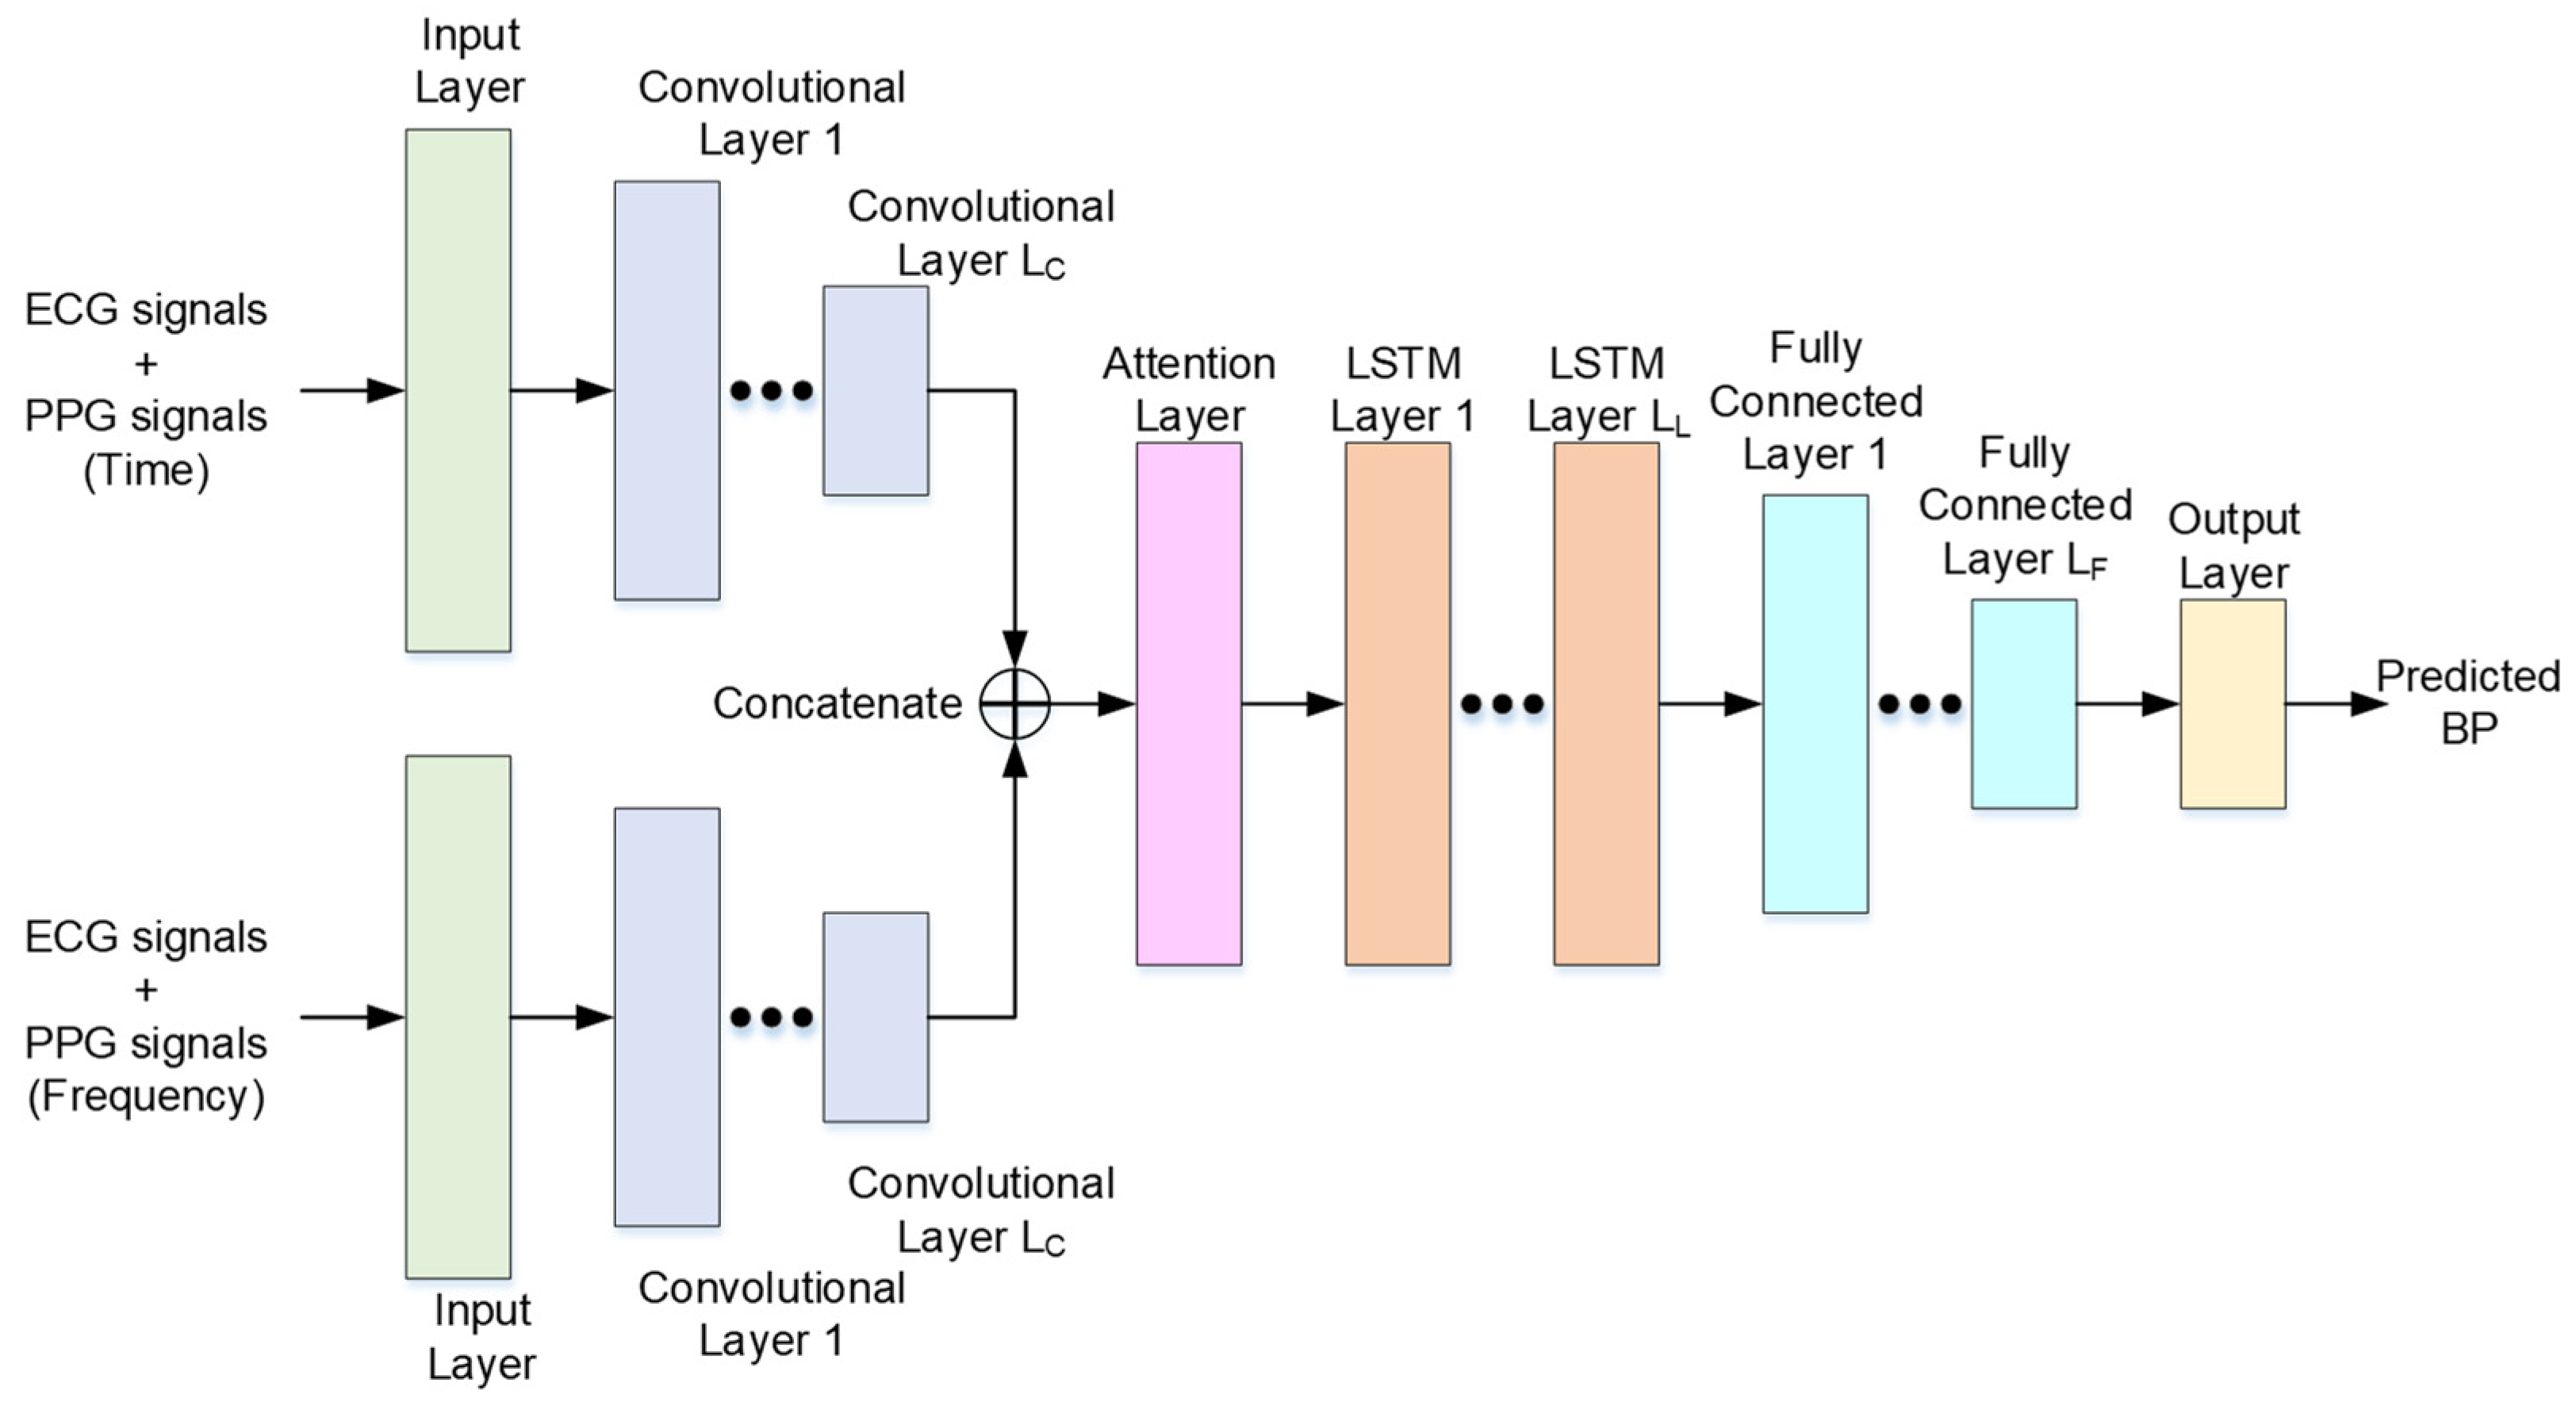
The proposed attention mechanism-based CNN-LSTM is shown in
Figure 1. First, the preprocessing is used to remove the motion artifacts of ECG and PPT signals, and then signals are transformed into the frequency domain. Second, the corresponding features of EEC and PPG signals in the time domain and frequency domain are extracted by using convolutional neural networks. Third, the attention networks (ANs) are applied to estimate the importance of features. Fourth, the LSTM networks are adopted to model the variations of time series. Finally, the fully connected networks are used to integrate the information of previous neural networks and to predict the BP. The proposed approaches are detailed in the following paragraphs.
2.1. Signal Preprocessing
The obtained ECG and PPG signals (denoted as
and
) have zero values or meaningless values and these signal segments are removed. The main component of the PPG signals is between 0.5 and 11 Hz, and the main component of the ECG signals is 30 Hz or lower [
18,
19]. Therefore, a low-pass filter with a cutoff frequency of 35 Hz is applied to the PPG signals. A high-pass filter with a cutoff frequency of 0.5 Hz and a low-pass filter with a cutoff frequency of 35 Hz are sequentially applied to the ECG signals.
The ECG and PPG signals are segmented into sequences of ECG and PPG segments denoted as and , respectively. The is the number of segments of and . The and segments are blocked into frames of Lf samples and each adjacent frame is separated by Lk samples. For each frame, the Hamming window is applied to reduce leakage, and then the fast Fourier transform is applied to estimate the corresponding frequency responses. Then, the frequency responses of and are denoted as and . Therefore, the corresponding frequency input sequence for ECG and PPG signals can be found and denoted as and . Finally, the inputs of convolutional neural networks are and for input vectors in the time domain and frequency domain, respectively.
2.2. Convolutional Neural Networks
In this work, a convolutional network contains a convolutional layer, a rectified linear unit, and a pooling layer. For the convolutional layer, convolution kernels are used to convolve the inputs of the previous layer and it can be defined as
where
xn,
wn, and
b are the outputs of the previous layer, the weight of the convolutional kernel, and the bias value, respectively.
f(•) is the rectified linear unit, which is a non-linear activation function. The rectified linear unit is used to activate only certain neurons. Thus, the neurons can be activated if the output of the linear transform is greater than or equal to 0.
Finally, a max-pooling layer is adopted to perform downsampling operations. The max-pooling layer can effectively reduce the parameters of networks for reducing complexity and keeping important features.
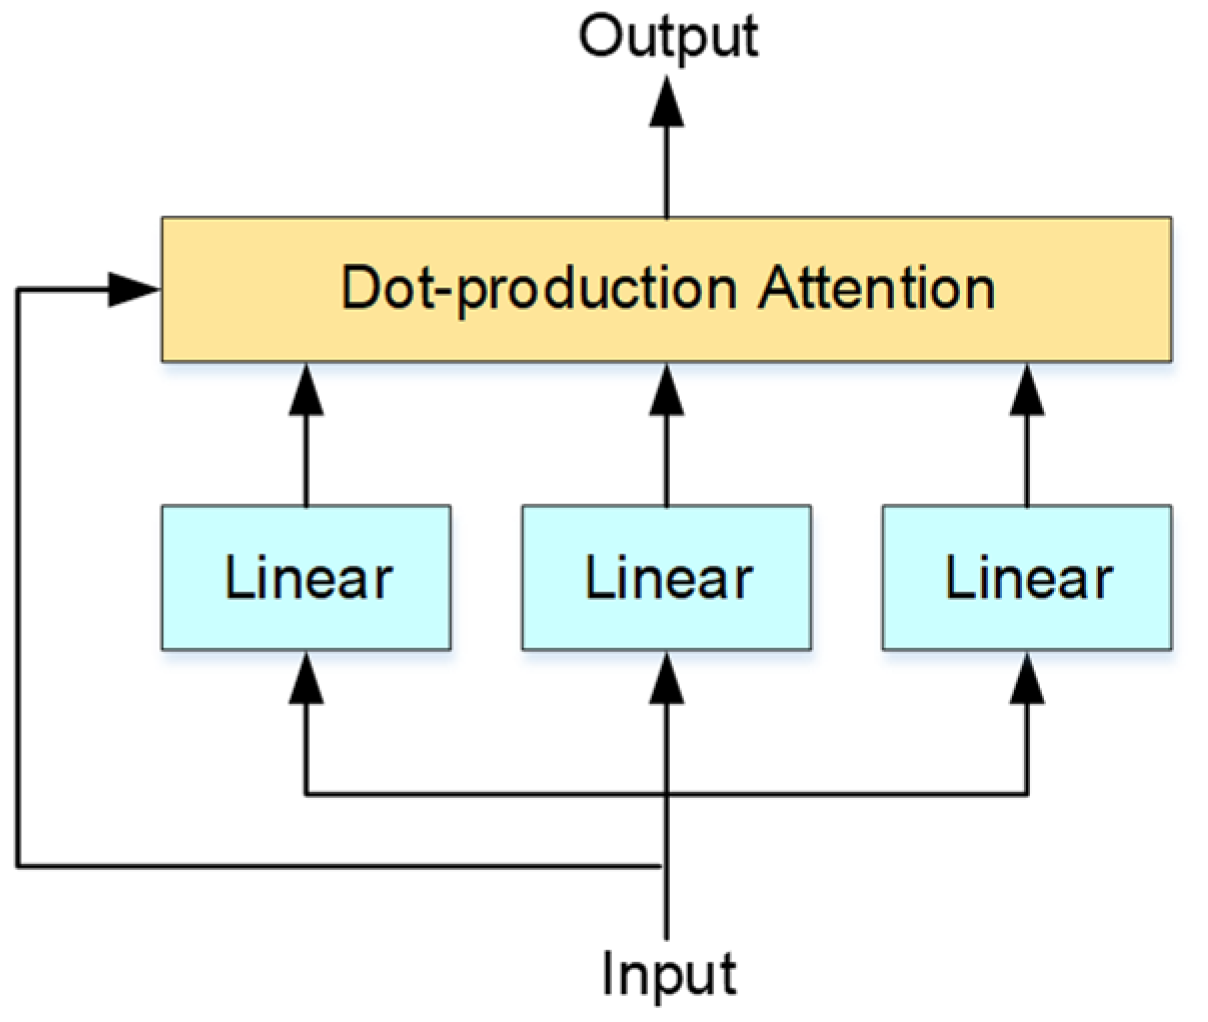
2.3. Attention Neural Networks
After the convolutional neural networks, a self-attention mechanism (as shown in
Figure 2) is used to focus on the relevant part of features [
20]. The input of the self-attention layer is the previously convoluted results
ai. The
ai is multiplied by three weights matrix
wq,
wk, and
wv that are trained in the training process, and then the query vector
Qi, the key vector
Ki, and the value vector
Vi can be obtained as follows.
When the
Qi,
Ki, and
Vi are obtained, the self-attention operation
Attention(•), which is modeled as dot-production attention, is used to find the weighted self-attention outputs
SAi.
Attention(•) is defined as
where
softmax(•),
T, and
d are the softmax function, the transpose operation, and the scaling factor, respectively.
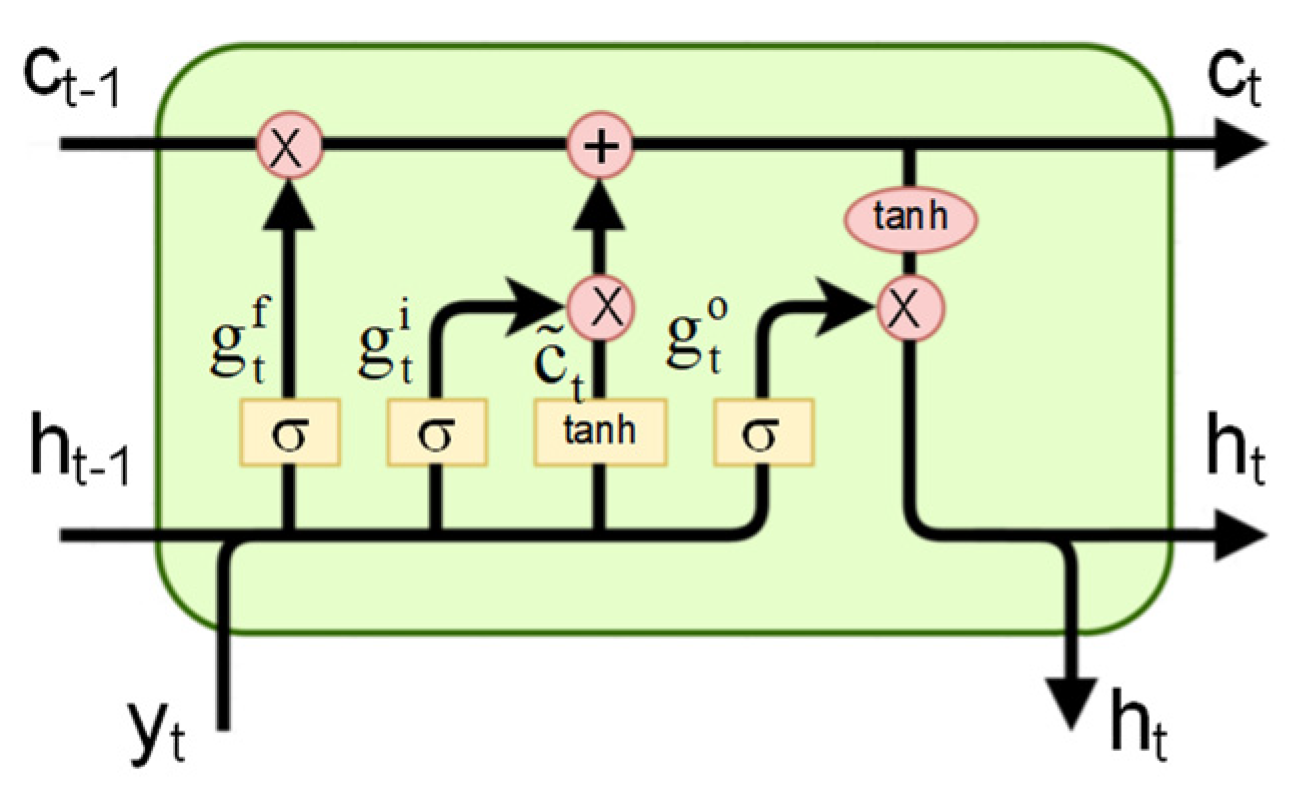
2.4. LSTM Neural Networks
After the meaningful features are extracted, the LSTM is adopted to model the characteristics of the time series of features. The structure of the LSTM unit is shown in
Figure 3. The inputs of the first LSTM layer and the other LSTM layers are the output of attention layer
SAi and the outputs of previous LSTM units, respectively. In time slot
t, the input and the output of the LSTM unit are
yt and
ht, respectively. For an LSTM unit, it composes an input gate
gi, a forget gate
gf, an output gate
go, a mapping function
mt, and a memory cell
ct.
Mathematically, each vector in these components of the LSTM unit can be computed as follows.
and are the sigmoid function and elementwise multiplication. Wi, Wf, Wo, and Wm are the weighted matrices, and bi, bf, bo, and bm are bias vectors of LSTM. These parameters are learned during training. Three gates have their weights and then each LSTM unit works like a state machine. Therefore, the LSTM neural network can deal with sequence problems.
2.5. Fully Connected Neural Networks
Each neuron in the fully connected layer is connected to all neurons of the previous layer, and it follows the basic method of feedforward artificial neural network. In this study, a conventional multi-layer perceptron neural network is utilized.
3. Experimental Results
In this study, ECG and PPG signals collected in PhysioNet’s Multi-parameter Intelligent Monitoring for Intensive Care (MIMIC) database [
21] were used to evaluate the proposed approaches. There are 45 patients (27 males and 18 females, the average age is 66.8 years) and patients have one of 13 diseases, including angina, bleeding, brain injury, cardiogenic shock, congestive heart failure/pulmonary edema, cord compression, myocardial infarction, postoperative coronary artery bypass graft, renal failure, postoperative valve, respiratory failure, trauma, and sepsis. The signals were obtained through invasive methods, and for each patient, around 11,000 segments were randomly extracted. When the high-level motion artifacts were not removed by using the proposed preprocess, these segments, which contain motion artifacts, were manually removed.
An input signal of neural networks should contain at least two periods of ECG signals. According to the possible heart rate range, the duration of the input ECG signals is more than 4 s. Thus, the length of and is 1024. Lf and Lk are 512 and 256, respectively. Moreover, the length of the hamming window and the size of FFT are 512. Therefore, the size of inputs to neural networks for the time and frequency domain are 512 and 256, respectively. N-fold cross-validation (N = 10) was used to evaluate the proposed approaches by subject cross-validation and the results are detailed in the following subsections.
3.1. Experimental Setup
In this study, the results of BP were estimated by using root mean square error (RMSE) and mean absolute percentage error (MAPE). Moreover, the somewhat less stringent Association for the Advancement of Medical Instrumentation (AAMI) standard [
22], which recommends a mean error of less than 5 mmHg and a standard deviation of error of not more than 8 mmHg.
The model was trained in a fully supervised manner, and the weights and biases of each layer were initialized by randomly selected values. The cross-entropy is selected as the loss function, which was used to estimate the error between the true value and the predicted value. Adam, which is a stochastic optimization algorithm, was selected as the optimizer. The detailed parameters of the proposed neural network are shown in
Table 1.
3.2. Results of Feature Evaluation and Selection
Using single biomedical signals such as ECG or PPG to estimate the BP including systolic blood pressure (SBP) and diastolic blood pressure (DBP) can increase the value of smart devices [
3,
23]. Therefore, the effects of ECG and PPG signals are examined and then three types of inputs were designed as I(ECG), I(PPG), and I(ECG, PPG). I(•) is used to represent the selected signals and the experimental results are shown in
Table 2. Using both ECG and PPG signals, the proposed system can achieve the best performance. However, the performance of using a single ECG or PPG still achieves acceptable results. For practical applications, the complexity of the proposed approach can be reduced without severely losing accuracy. Thus, the proposed structure of the neural network is suitable for practical applications.
Next, the effects of input signals represented as time and frequency sequences are examined and the results are shown in
Table 3. The results show that the performance using time and frequency signals is higher than that using only time or frequency signals. Previous studies showed that the relationship between ECG and PPG signals in the time domain can be used to predict BP [
2]. Moreover, the performance using time signals is higher than that using frequency signals. Therefore, the proposed approach can learn the relationship between ECG and PPG signals in the time domain, and then the accuracy can be increased. However, integrating with frequency information, the accuracy can be effectively increased by using the proposed neural network.
3.3. Analysis of Network Structure
In this subsection, the impact of network structure is examined. The CNN and fully connected networks were treated as the basic network structure. The attention network (AN) and the LSTM network in the proposed network structure were sequentially removed and the experimental results are shown in
Table 4. Comparing the basic network structure, the prediction accuracy obtained by using the network structure with AN or the LSTM network can be improved. The proposed network structure, which uses both AN and LSTM networks, can achieve the highest accuracy.
The results of CNN + LSTM are slightly better than that of CNN + AN, but the layers for CNN + LSTM and CNN + AN are 2 and 1, respectively. CNN + AN and CNN + LSTM focus on identifying meaningful features and modeling the characteristics of time series, respectively. These two approaches focus on different characteristics of input sequences; thus, integrating these two networks can greatly improve the accuracy of BP estimation.
3.4. Experimental Results Compared with AAMI Standard
In this subsection, the accuracy of BP estimation of the proposed approach was compared with the AMMI standard, which is the guideline for the evaluation of cuffless BP monitoring devices. The results evaluated by using mean absolute error (MAE) were shown in
Table 5. It is clear that using LSTM or AN can improve the performance of CNN. Moreover, the performance of LSTM is better than that of AN. According to the network structure, the LSTM can save previous ECG information and compare it with current ECG information, thus the variance of ECG signals can be effectively improved. Therefore, the blood pressure can be accurately estimated by using the variance of ECG signals. The effects of AN are sometimes modeled in the CNN; thus, the benefit of AN cannot be fully demonstrated. When LSTM and AN are integrated together, AN may reduce the variety of inputs of LSTM. Thus, the proposed approaches can achieve the best performance.
The mean error and the standard deviation of error for these four approaches are less than 5 and 8 mmHg, respectively. Moreover, the proposed approach can obtain the smallest standard deviation and the most accurate. Thus, these approaches are sufficiently high for clinical use.
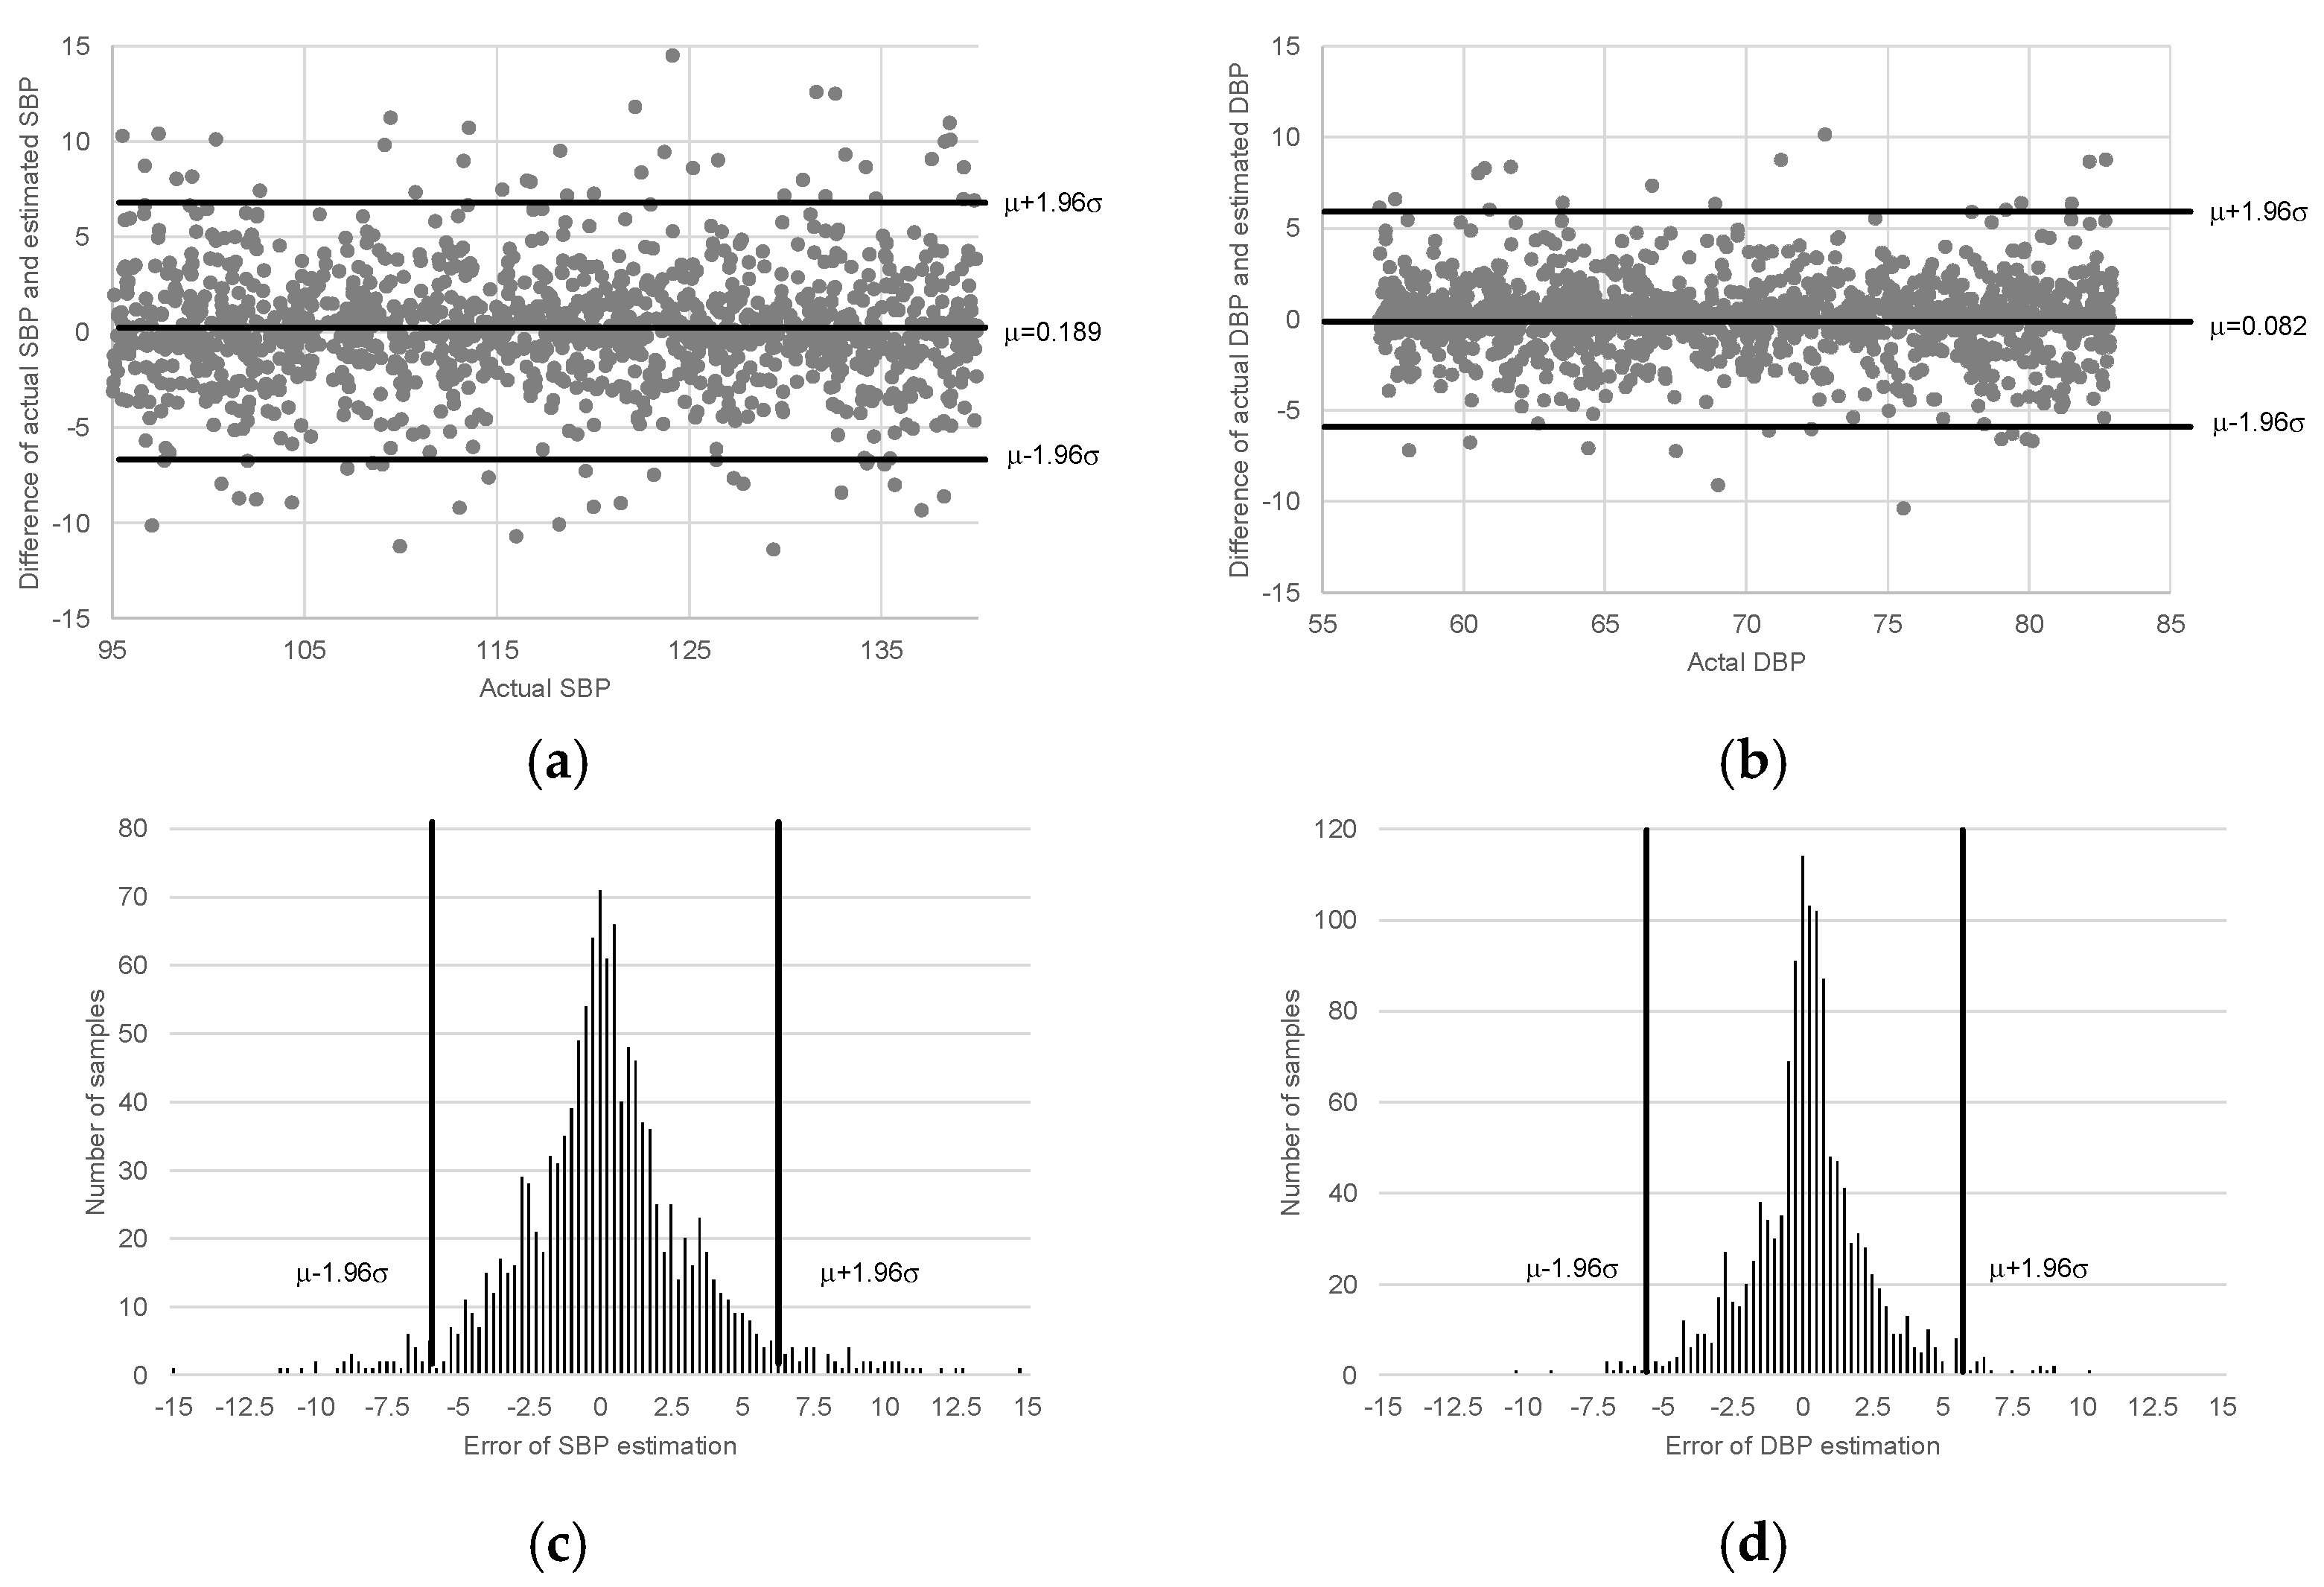
In order to detail the characteristics of proposed approaches, the Bland–Altman plot and the error distribution of the actual BP and the estimated BP are adopted, and the results are shown in
Figure 4. The mean difference of SBP and DBP were 0.189 mmHg and 0.082 mmHg, respectively. The standard derivations of SBP and DBP were 3.96 and 3.19, respectively. Moreover, within the error range of 7.76 mmHg and 6.25 mmHg for SBP and DBP (95% confidence level), the cumulative percentages in the predicted values of SBP and DBP were 96.57% and 98.57%, respectively. Thus, the performance for predicting DBP is better than that for predicting SBP.
4. Conclusions
In this study, an attention mechanism-based CNN-LSTM had been successfully proposed to predict BP by using ECG and PPG signals. ECG and PPG signals in time and frequency domain are useful to precisely predict BP and the proposed network structure can correctly model the relations between ECG and PPG signals in time domain. The convolutional neural network can automatically extract the features of ECG and PPG signals. Moreover, the meaningful features and the characteristics of time series are effectively modeled by using AN and LSTM, respectively. The experimental results showed that the proposed approach outperforms CNN and CNN-LSTM. Besides this, for practical applications, the computational complexity should be decreased. Without severely reducing the prediction accuracy, the proposed approaches can meet the condition of computational complexity by removing some types of input signals. Moreover, the proposed approach, which is assessed by using AAMI standard, can possibly be grafted into medical devices. In this study, the motion artifacts were manually removed, which will degrade the performance of the proposed approaches. Therefore, developing advanced approaches to remove the motion artifacts can improve the performance of BP estimation.


 and
and 


