Article

Ultimate Axial Load Prediction Model for X65 Pipeline with Cracked Welding Joint Based on the Failure Assessment Diagram Method

1
National Engineering Laboratory for Pipeline Safety, MOE Key Laboratory of Petroleum Engineering, Beijing Key Laboratory of Urban Oil and Gas Distribution Technology, China University of Petroleum-Beijing, Beijing 102249, China
2
PipeChina Engineering Technology Innovation Company, Tianjin 300456, China
3
Natural Gas Marketing Company, PetroChina Company Limited, Beijing 100101, China
*
Author to whom correspondence should be addressed.
Appl. Sci. 2021, 11(24), 11780; https://doi.org/10.3390/app112411780
Submission received: 7 November 2021 / Revised: 5 December 2021 / Accepted: 8 December 2021 / Published: 11 December 2021

Abstract

:
Crack defects in the girth welds of pipelines have become an important factor affecting the safe operation of in-service oil pipelines. Therefore, it is necessary to analyze the factors affecting the safe operation of pipelines and determine the ultimate load during pipeline operation. Based on the failure assessment diagram (FAD) method described in the BS 7910 standard, the key factors affecting the evaluation results of the suitability of X65 pipeline girth welds are analyzed, and the effects of crack size, pipe geometry, and material properties on the evaluation results are investigated. The results indicate that the crack depth is more crucial to the safe operation of the pipeline than the crack length. While the effect of wall thickness is not significant, the misalignment can seriously aggravate the stress concentration. In general, the higher the yield ratio and tensile strength of the pipe material, the more dangerous the condition at the weld. The ultimate axial load that a crack-containing girth weld can withstand under different combinations of the above factors was determined. Furthermore, a data driven model via the optimized support vector regression method for the ultimate axial load of the X65 pipe was developed for engineering application, and the comparison results between the FEM results and the predicted results proved its accuracy and reliability.

1. Introduction

For in-service pipelines, internal inspection can identify possible defects which may endanger pipeline operation. However, we can control the maximum axial load during service to ensure that the pipeline continues to operate. Take the Mo-Da line as an example, which is the first large-diameter crude oil pipeline in China passing through the alpine permafrost. This pipeline is made of APL X65 line pipe steel with a diameter equal to 813 mm. The pipeline passes through the mountainous island permafrost in the northern part of the Greater Khingan Mountains, where there are numerous swamps and well-developed river systems. Frost heaving in winter and thaw settlement in summer can easily cause damage to the pipeline (e.g., pipeline folding, bending, and even rupture), and can seriously affect its safety [1]. In recent years, several accidents have occurred in the pipe due to the weld cracks [2].
In general, geometric defects, such as cracks and misalignments, as well as the discontinuity of materials, can lead to the concentration of stress at the girth weld joint. This can result in the reduction of the deformation-bearing capacity of girth welds and even fracture failure under the axial load. Due to such accidents, girth weld cracking has become an important factor affecting the safe operation of oil and gas pipelines. Therefore, there is a need to investigate effective fracture control methods for circumferential weld joints of in-service steel pipelines.
At the early development stages of welded structures, in order to avoid the failure of oil and gas pipelines and prevent accidents, no measurable crack defects were allowed in welded joints. However, this failure prevention approach tended to lead to waste of resources and increased costs. To this end, the British Welding Institute proposed the “Fitness-For-Service” principle [3], where the possibility of deviations and defects in welded structures is acknowledged, and the impact of existing defects on the integrity of the welded structure is scientifically analyzed based on economic considerations to ensure that the welded structure will not fail by any known mechanism.
To assess the safety of pipelines with defects, a relatively comprehensive pipeline integrity management system and related technical standards have been established. In addition, a variety of safety assessment methods have been developed, including the plastic damage-based evaluation method [4,5,6], strain-based evaluation method [7,8], and numerical simulation analysis based on the finite element method [9,10,11]. Among them, the failure assessment diagram (FAD) method is the most widely used. Bloom et al. [12] conducted experimental research to obtain the load changes in the crack growth stage. By comparing the results with the FAD, it was verified that the FAD can predict the ductile tearing behavior of metal samples. Based on the FAD, Milne [13] proposed a failure assessment curve considering strain hardening, which improved the accuracy of applying the FAD method. The EPRG standard [14] broadens the scope of evaluation of girth weld defects in long transmission pipelines, which sets tolerance limits for the length and height of girth defects and enables rapid evaluation of weld defects in the field. Based on full-scale tests, J. Lukács et al. [15] investigated the role of external reinforcing technics on the integrity reconstruction of damaged transporting steel pipelines, providing a solution for the rehabilitation of pipelines containing defects.
First of all, it is necessary to clarify the acceptability for pipeline defects. Several standards, such as R6 [16], BS 7910-2019 [17], CSA Z662-2015 [18], and API 579-1-2016 [19], recommend the use of the FAD method to evaluate the applicability of pipeline girth welds. Among them, after more than 40 years of research, BS 7910 has made significant developments in both breadth and depth. In particular, BS 7910 is a safe and reliable defect assessment standard which can provide assurance for new structures in the design phase, for structural integrity in the manufacturing phase, and for the entire life of the structure in the operational phase [20,21,22].
Meanwhile, the calculation of the ultimate axial load of pipelines with crack defects is challenging and time consuming, since numerous influencing factors affect the failure behavior of pipes. To this end, the prediction of the ultimate axial load based on data driven models is necessary to assess the safety of pipelines with cracks. The machine learning technology has been recently utilized for prediction. Support vector regression (SVR) is a machine learning algorithm which is highly applicable for nonlinear, and high-dimensional pattern recognition problems. The algorithm can also achieve a balance between accuracy and complexity of regression models by simultaneously minimizing the empirical errors and maximizing the geometric marginal zones.
Behrooz et al. [23] used SVR models to perform prediction analysis on the maximum pitting corrosion depth in oil and gas pipelines. Their research results demonstrated that SVR models are capable of providing a more precise prediction. Chang et al. [24] performed prediction research on the crack propagation in aviation aluminum alloy. The results suggest that their prediction model was effective, since the crack growth was predicted accurately. Tian et al. [25] performed discrete sizing optimization of a stepped cylindrical silo using the PSO method and implicit dynamic finite element analysis.
In this paper, a BS 7910 stress-based FAD method is used for the X65 pipeline with a diameter of 813 mm, i.e., the Mo-da crude oil pipeline in China. Considering crack parameters (crack depth ratio; crack length-to-cycle ratio), pipeline geometric parameters (wall thickness; misalignment), and material parameters (tensile strength; yield ratio), the effect of various influencing factors on the serviceable evaluation results is systematically analyzed under axial loads equal to 0.5–0.9 times the minimum yield strength. Moreover, the effect of various influencing factors on the ultimate axial load is clarified as well. To this end, an ultimate axial load database of the X65 pipeline with cracks is constructed. With the help of particle swarm optimization (PSO) and SVR, a prediction model of the ultimate axial load of the X65 pipeline based on stress failure assessment criteria is developed, providing reference and guidance for ensuring the intrinsic safety of the X65 pipeline with cracks.

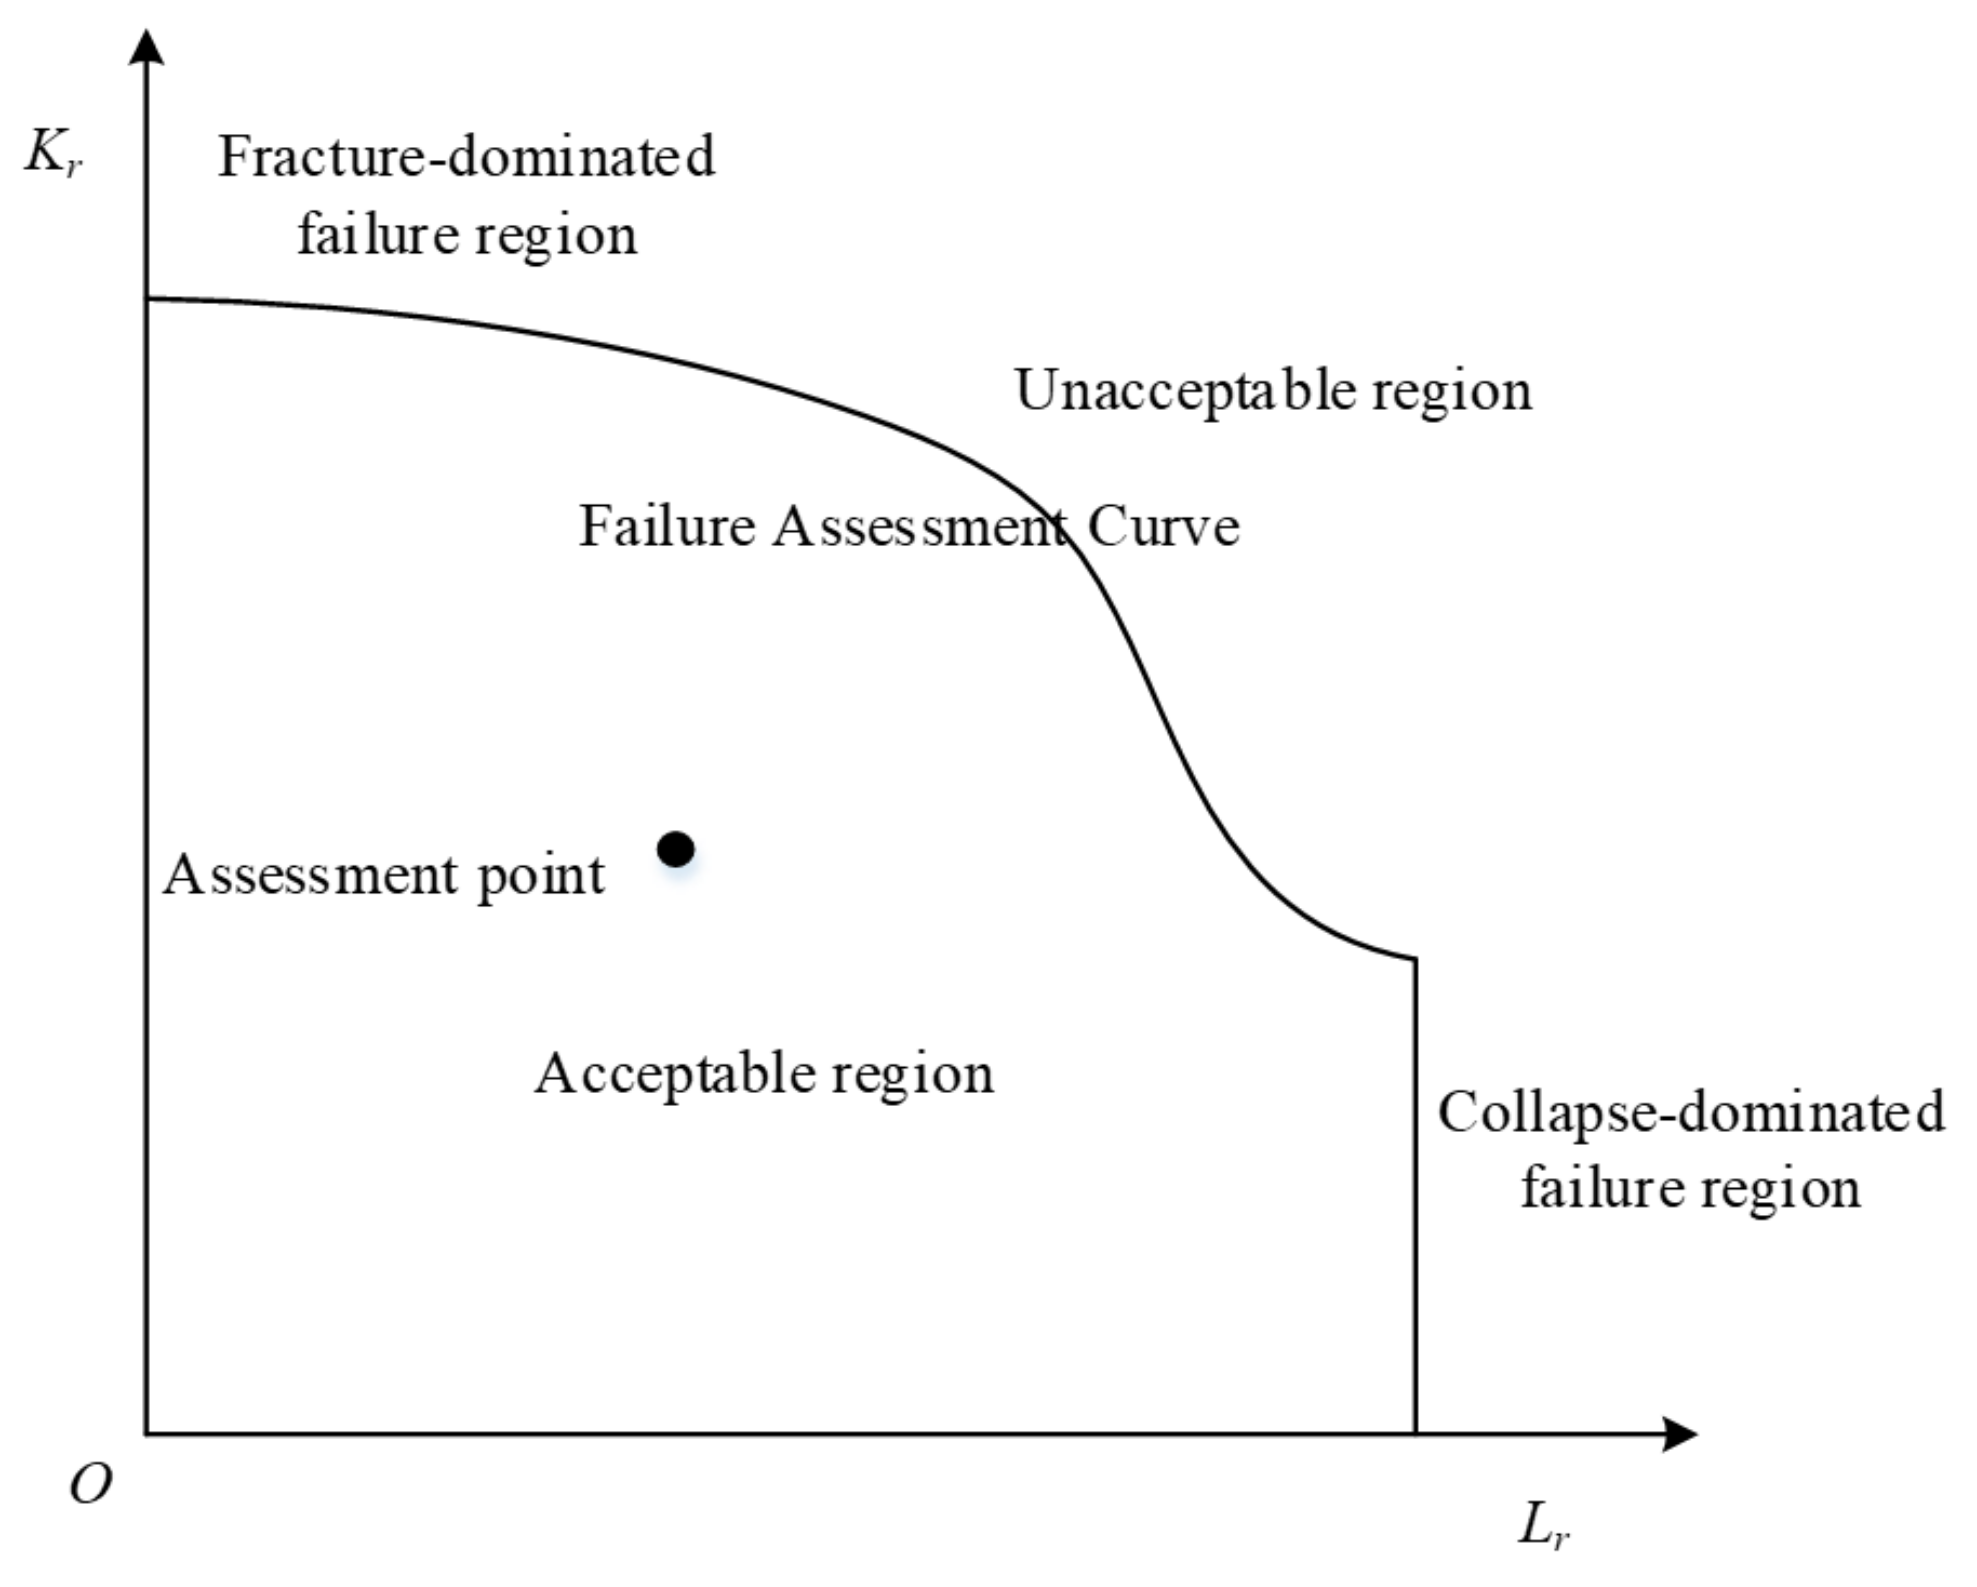
2. Definition of FAD

When a metal structure with defects is subjected to an external load, it is impossible to predict brittle cracking or plastic failure in advance. Through stress and material analyses, the FAD method takes the fracture ratio Kr and load ratio Lr as two important decisive factors. As can be seen in Figure 1, for a given circumferential welded structure with cracks, the corresponding Kr and Lr values can be calculated, and the evaluation point A (Lr, Kr) in the diagram can be obtained. The final evaluation result can be determined based on the spatial relationship between the evaluation point and the failure assessment curve. If the evaluation point A falls within the boundary line, the structural state is considered as safe; otherwise, the structure is unsafe.
As mentioned above, among a series of methods and standards, currently, the commonly used standard for girth weld fracture evaluation is the evaluation method specified in BS 7910. The latest version of the standard is “Guide to methods for assessing the acceptability of flaws in metallic structures” (BS 7910: 2019). In addition, the API 579 standard also evaluates the engineering criticality based on fracture mechanics; nevertheless, it is usually applied in process equipment. Consequently, the safety evaluation of girth weld defects of the MoDa X65 steel pipeline will be performed according to the failure evaluation method specified in BS 7910.

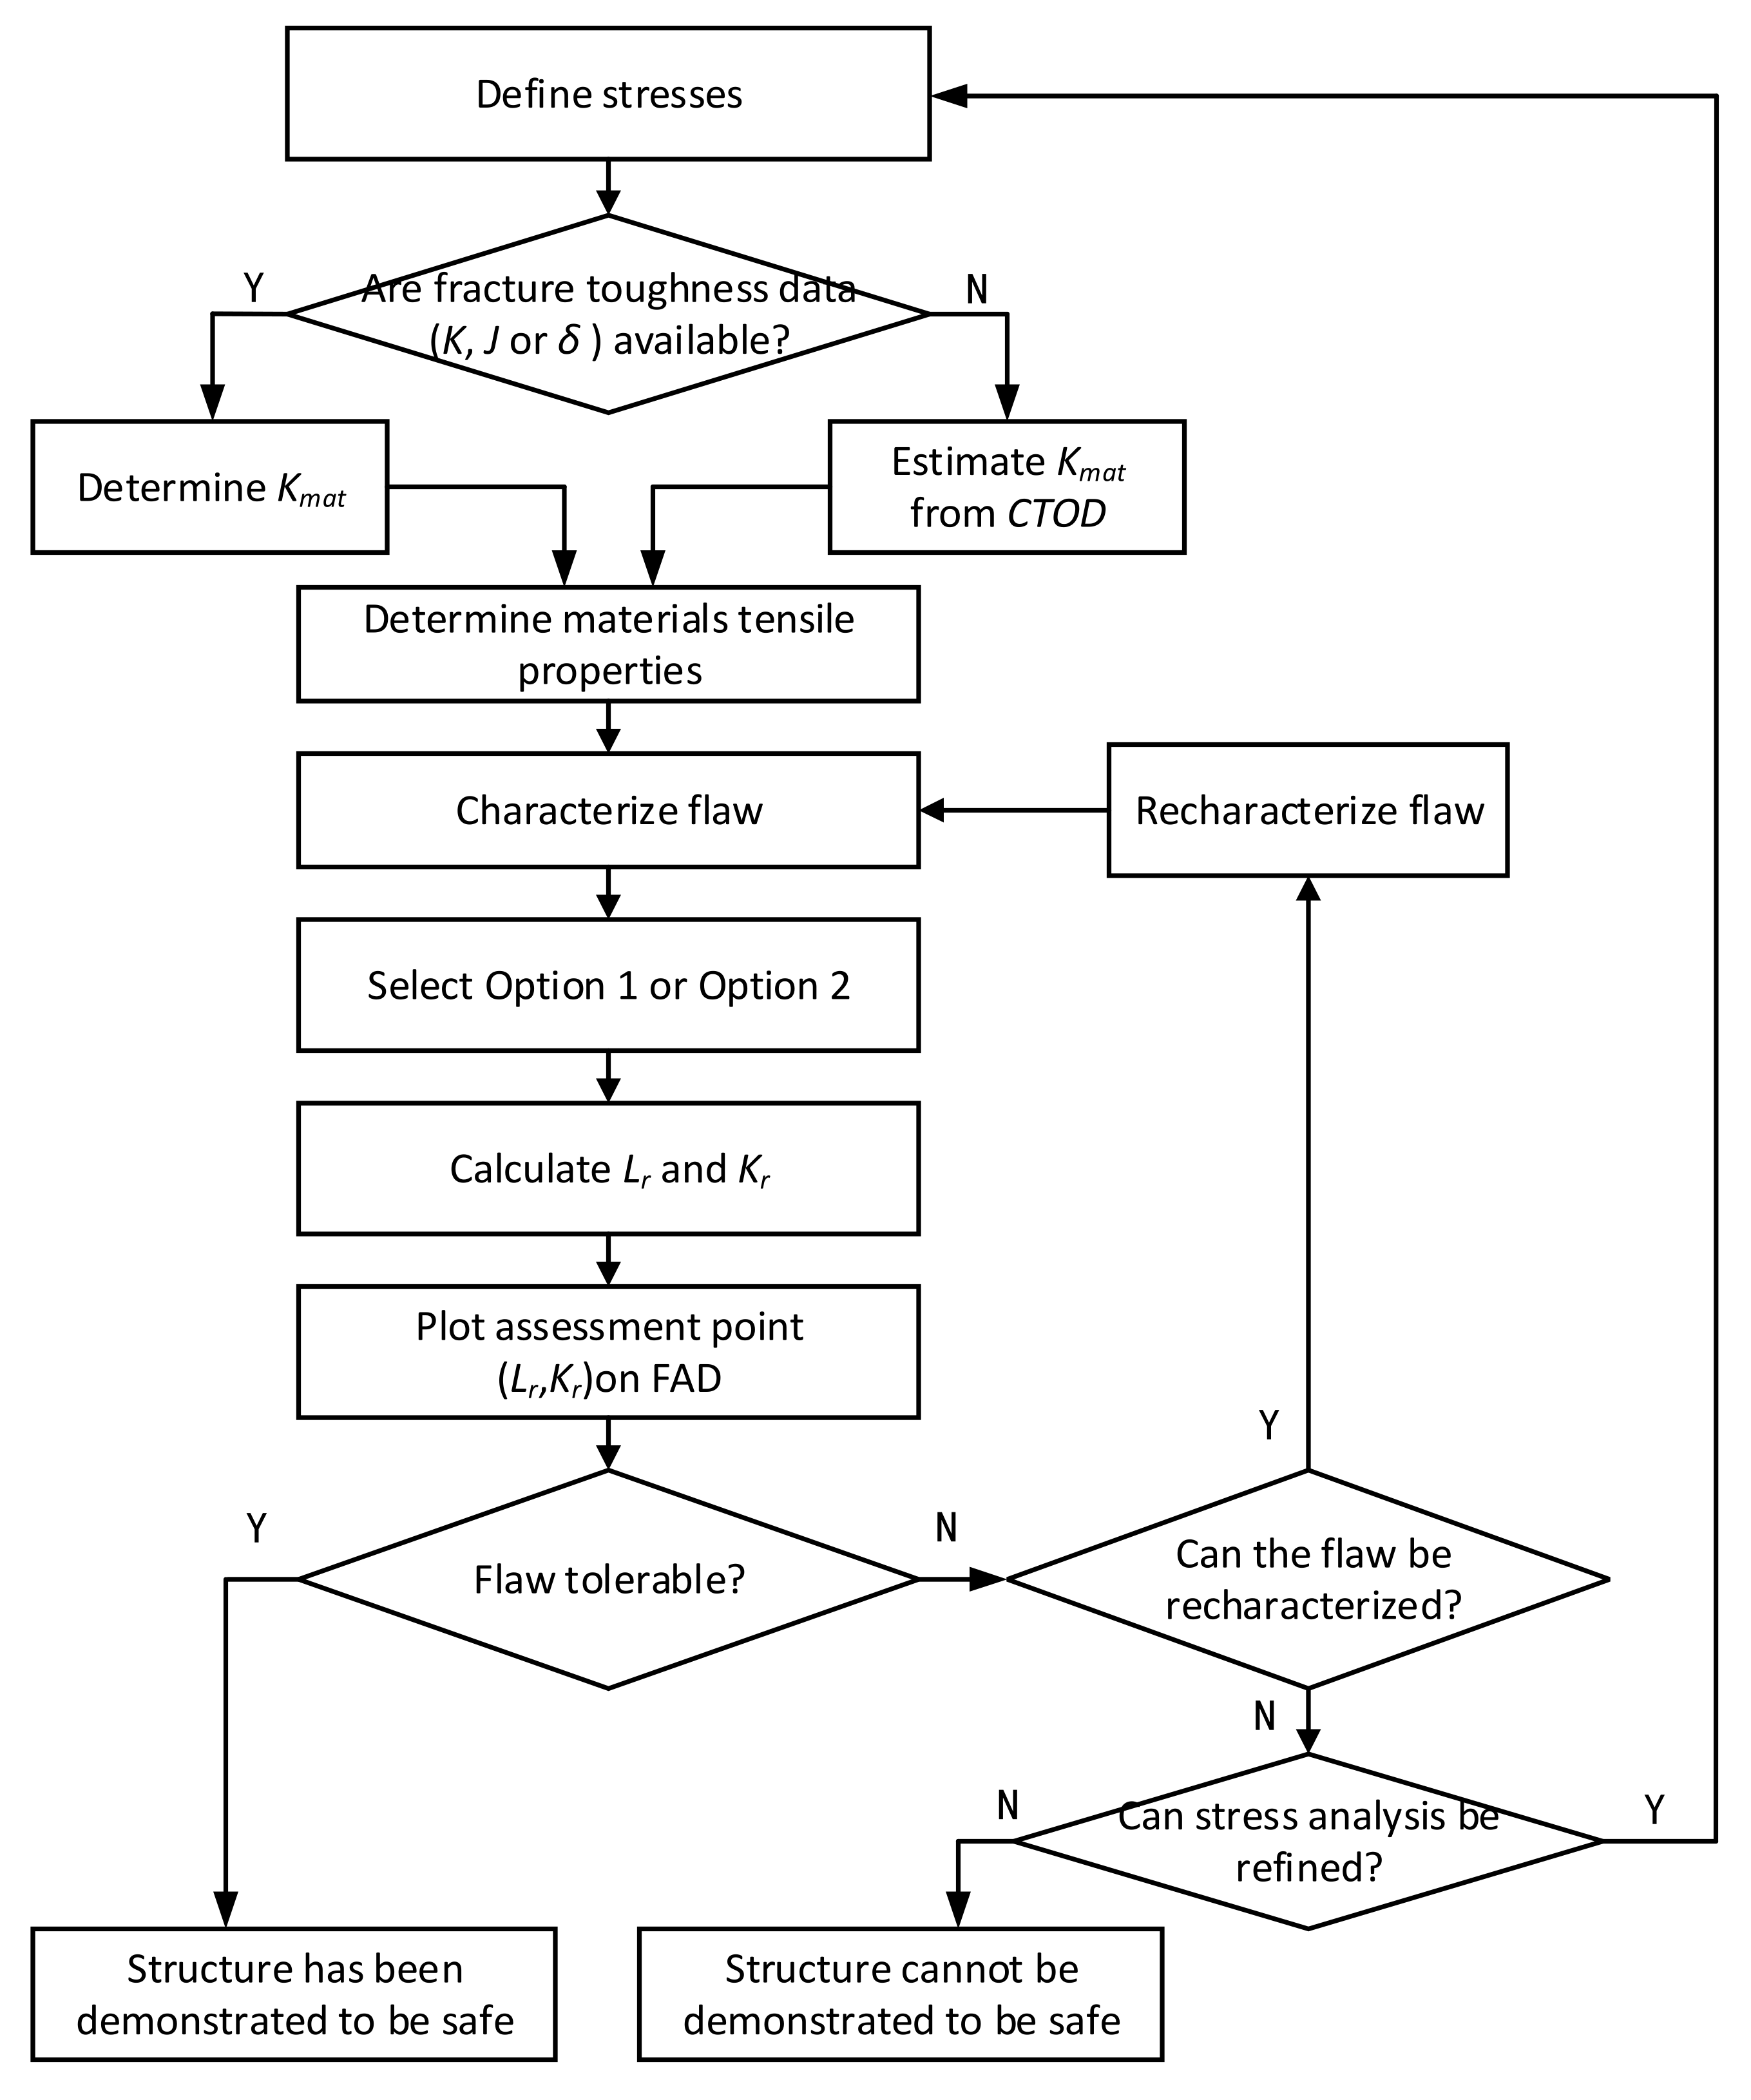
3. Evaluation Process of the BS 7910 Method

The BS 7910 evaluation method is proposed on the basis of engineering critical assessment (ECA), which provides guidelines and suggestions for assessing the acceptability of flaws in metallic structures. The methods described in this standard can be applied to all stages of design, manufacturing, and operation over the lifecycle of a structure. The BS 7910-2019 standard describes three different options, which are summarized as follows:
(1)
Option 1 is a conservative evaluation process, which is relatively simple to apply. The evaluation level does not require detailed stress-strain data of the analyzed materials.
(2)
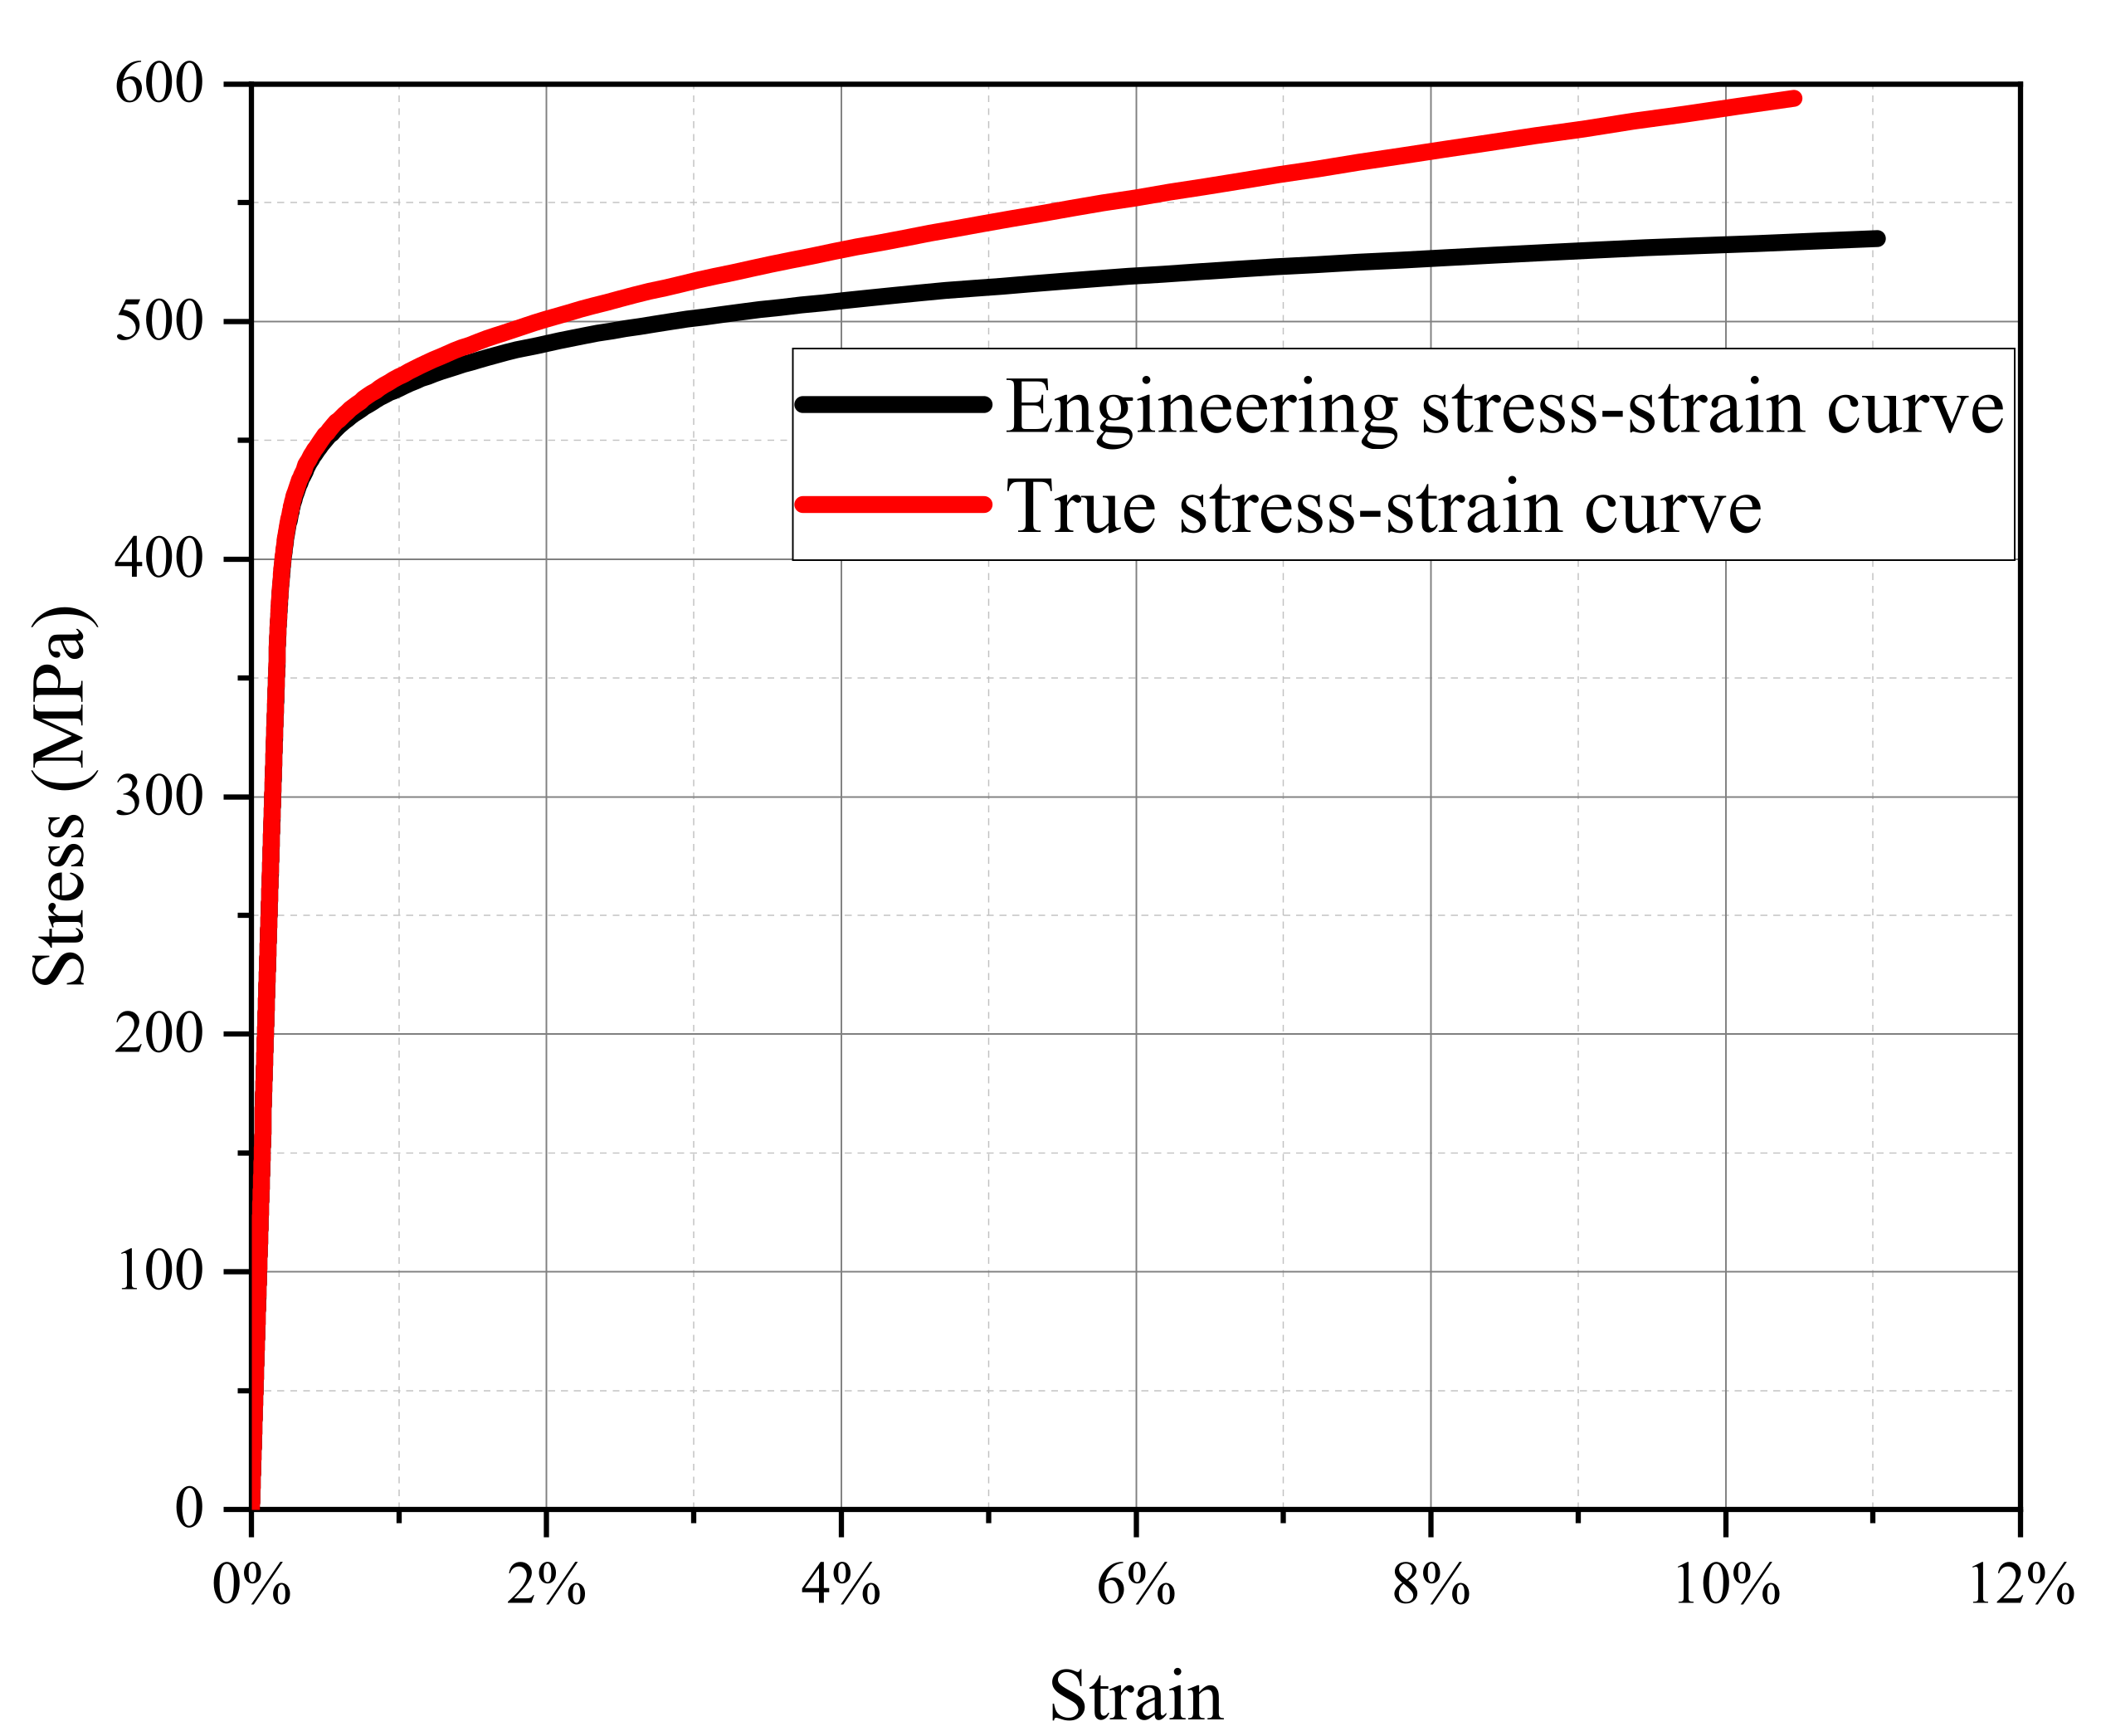
Option 2 is an evaluation method based on the application of the stress-strain curve of materials.
(3)
Option 3 uses the numerical simulation method to generate a FAD. The evaluation method of this level is not limited to materials with ductile tearing.
In this presented study, the true stress-strain data were derived by the Ramberg-Osgood model and corresponding parameter values. At the same time, considering the convenience of calculation and appropriate conservativeness, the assessment of the girth weld safety of the X65 steel pipeline will be guided by Options 1 and 2 described in BS 7910. Based on the specific design conditions and through stress level analysis of the girth weld, the reliability of the girth weld defects under specific operation conditions will be determined through nondestructive testing. In the evaluation process, the load and stress conditions of the pipeline, fracture toughness, and crack characteristics will be determined, the material curves and failure assessment curves will be constructed, the load and fracture ratios will be calculated, and the FAD will be drawn and evaluated (Figure 2).

4. Introduction of FAD Key Parameters

4.1. Definition for the Stresses in ECA

In the ECA process, the stress of the pipeline can be divided into principal and secondary stress. The principal stress can reach a certain magnitude, which is sufficient to cause plastic failure of the pipeline. It includes the membrane stress and bending stress caused by internal pressure and external loads. The secondary stress is a self-balanced stress caused by local yield, heat treatment, and other factors. It includes the thermal stress and participating stress. The secondary stress originates from limited strain or displacement, and although it will not lead to plastic failure, the local conditions at the crack tip deteriorate. Similar to the principal stress, the secondary stress can also be divided into membrane and bending stress components.
In this paper, the pipe axial stress σP is the stress component Pm of the principal stress. Due to misalignment at the pipeline interface, a corresponding bending stress σs is generated, which is the bending stress component Pb of the principal stress.

4.2. Definition for Fracture Toughness

Fracture toughness is used to characterize the ability of a material to prevent crack propagation, and can be determined based on the stress intensity factor K, crack tip opening displacement (CTOD), and J integral. In the case of the X65 pipeline in Mo-Da pipeline, the minimum Charpy impact energy of the weld and heat affected zone is 38 J, and the average value is 45 J [2]. The apparent fracture toughness of the material can be calculated according to the method proposed in CSA Z662-2015 [18], and it was determined to be 0.2 mm expressed in CTOD. Based on the equation for calculating the stress intensity factor K and the CTOD determined through the deep notch test, the fracture toughness was calculated to be 5570.1 MPa·mm0.5.
K m a t = 1.517 σ Y / σ u 0.3188 σ Y δ m a t E 1 v 2
where E is the modulus of elasticity (210 GPa); v is the Poisson’ s ratio (0.3); σY and σU are respectively the yield and tensile strength of the tested material at the fracture toughness test temperature; and δmat is the fracture toughness expressed by the CTOD (mm).

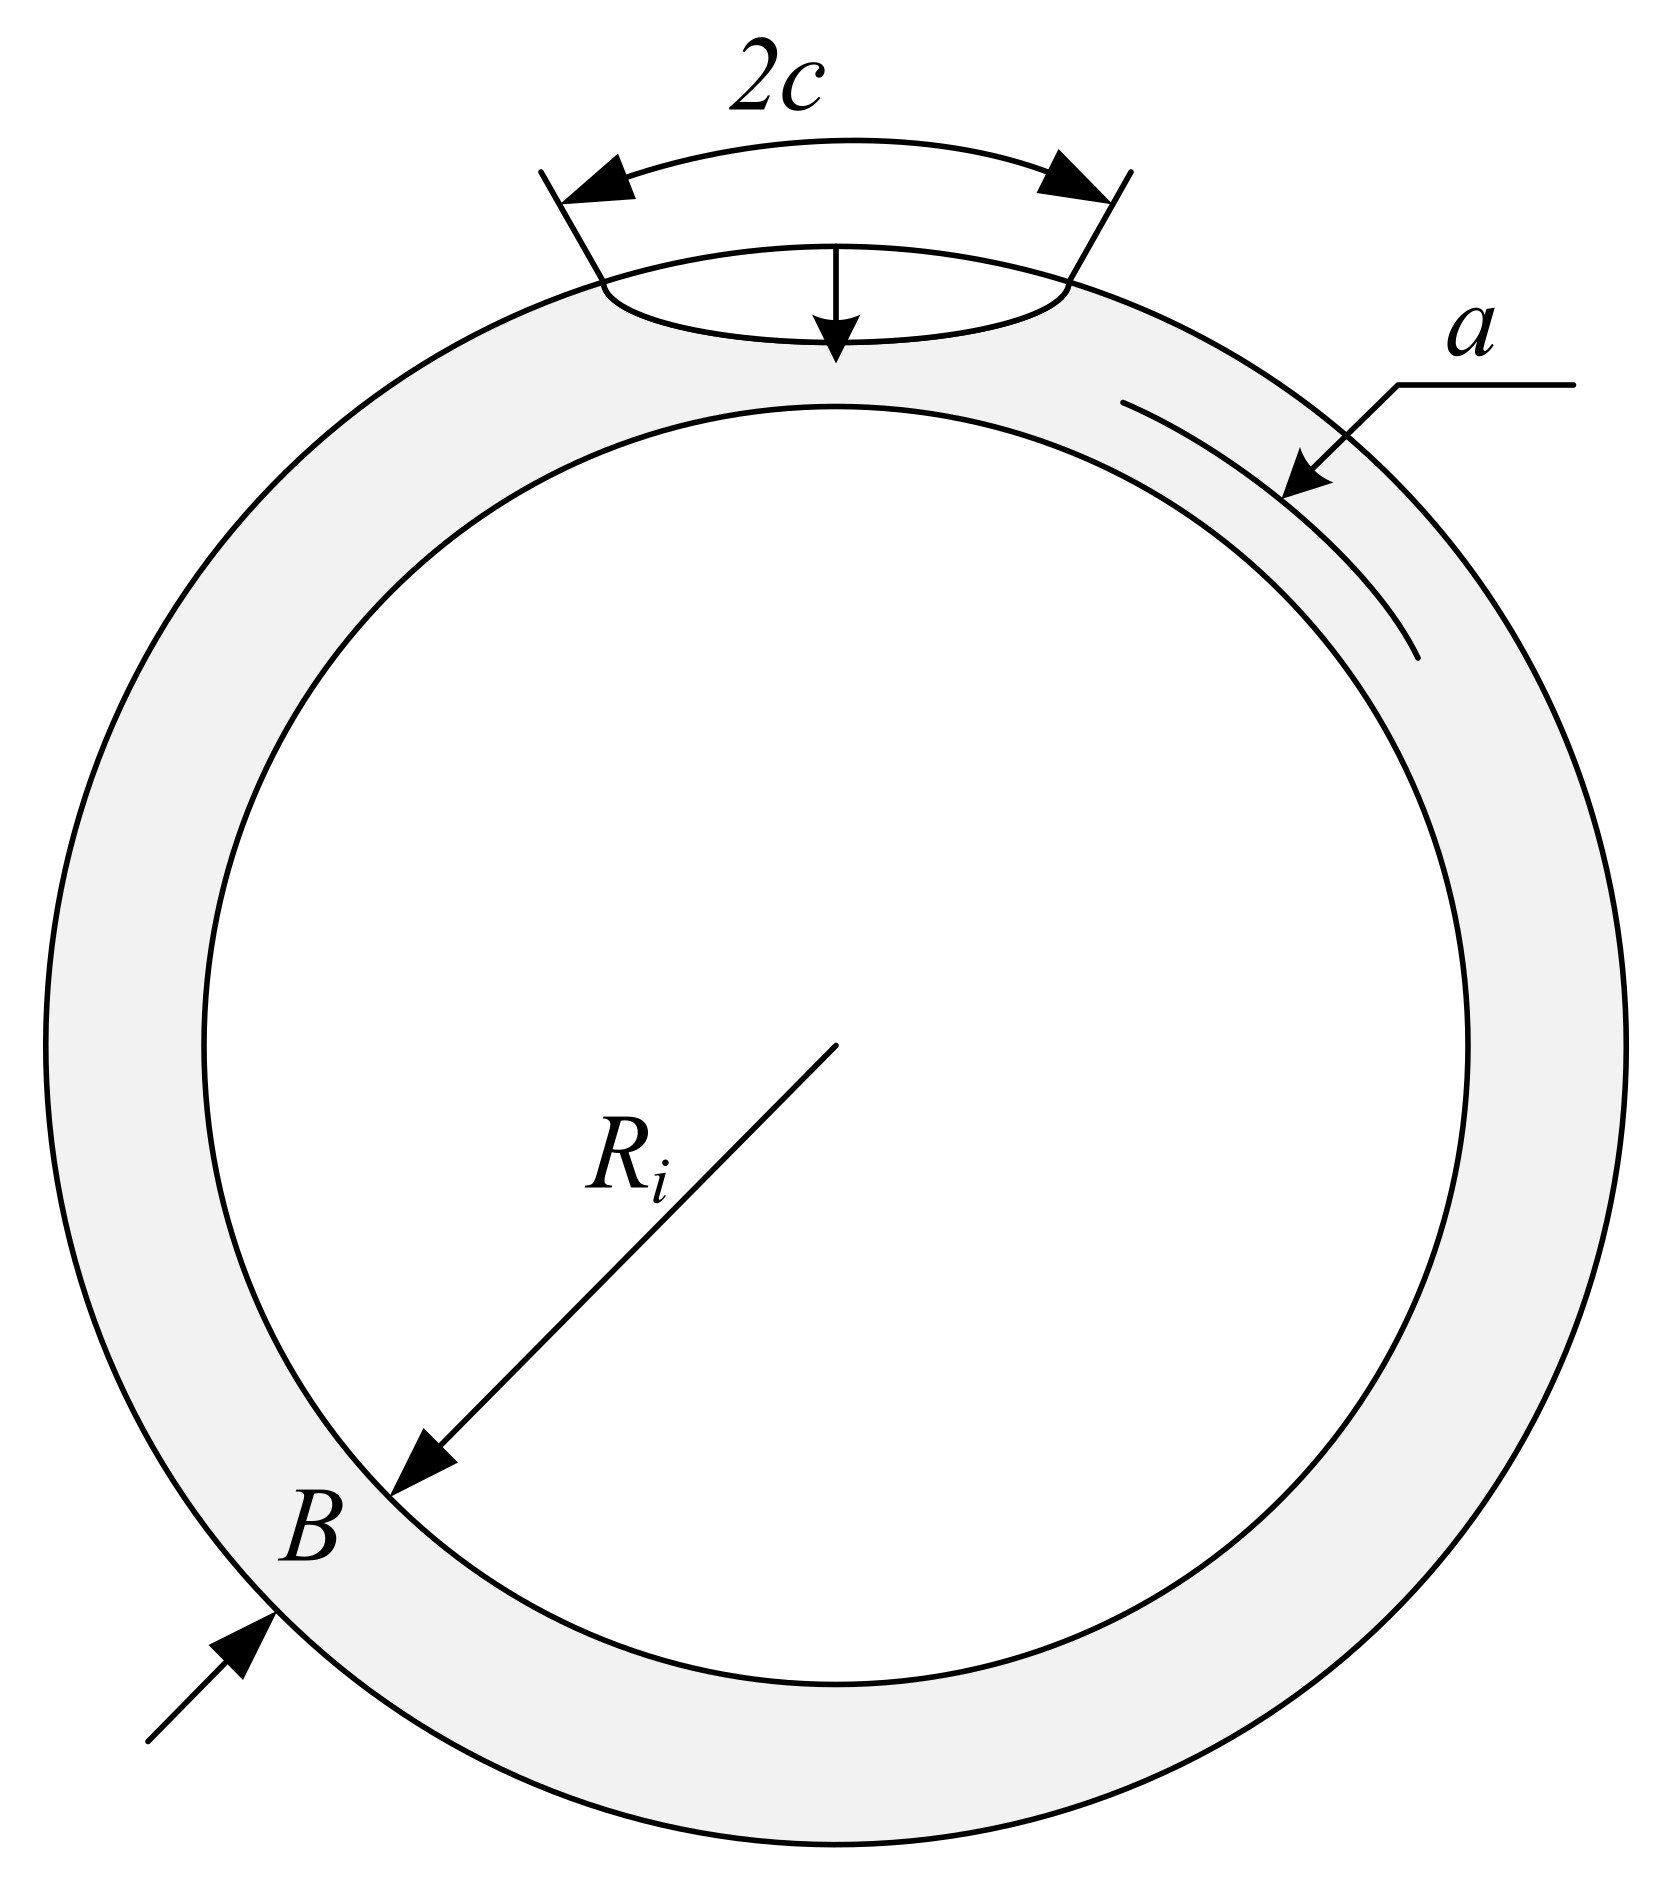
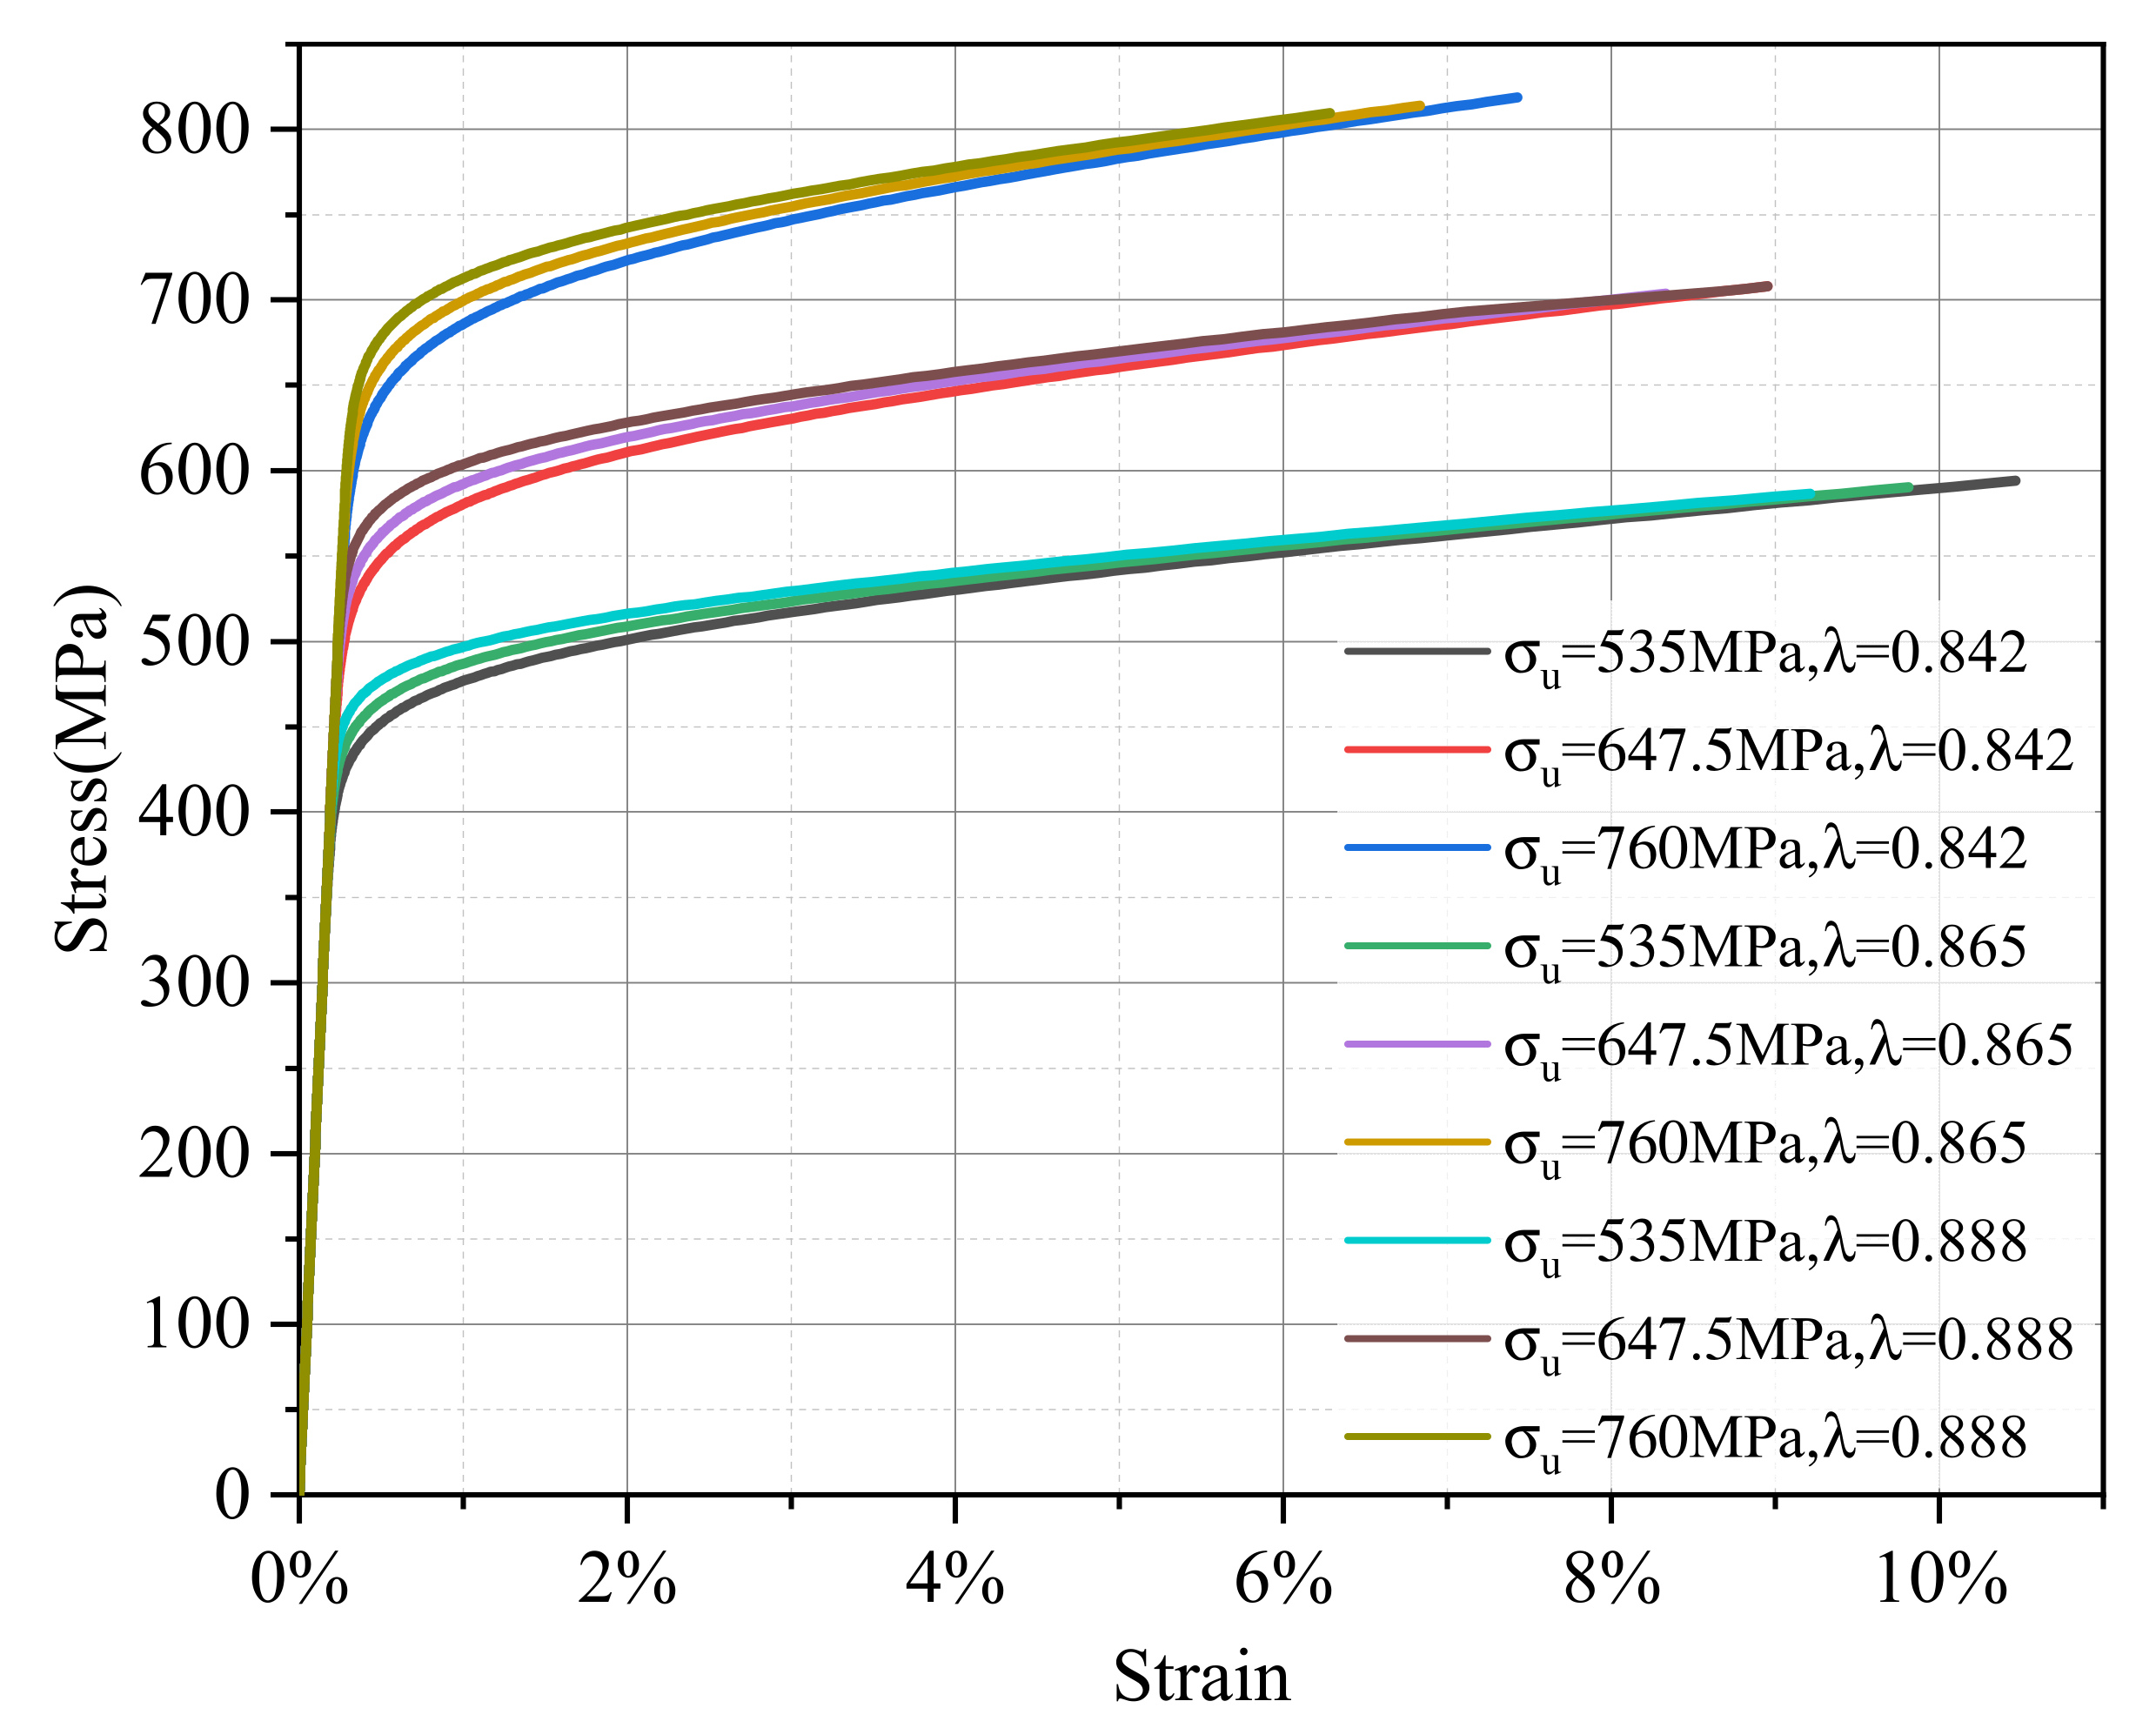
4.3. Material Properties and Crack Geometry

Taking the data of the Mo-Da pipeline as an example, the methods given as Options 1 and 2 in the BS 7910 standard were used for evaluation. The minimum yield strength and tensile strength of the X65 material specified in the API 5L were employed in the Ramberg-Osgood model (Equation (2)) to obtain the engineering stress-strain curve of the X65 pipe steel to derive conservative results for X65 pipes (Figure 3).
ε = σ E + A r σ Y E σ σ Y n A r = E ε Y σ Y 1 n = 1 0.3 1 σ Y / σ u
where Ar and n are the hardening coefficient and power hardening index of steel pipe, σY/σu is yield ratio (λ).
The engineering stress-strain curve of the pipe was converted into the true stress-strain curve using Equation (3).
σ t r u e = σ e n g 1 + ε e n g ε t r u e = l n 1 + ε e n g
In practice, multiple adjacent cracks interact with each other, and the effect of this interaction is much stronger than that of a single crack. If multiple cracks exist, the interaction of each crack with the adjacent cracks should be assessed based on the original size of each crack, and, if necessary, combined into a single crack. Based on the combined crack method in BS 7910, a circumferential surface defect was assumed to exist on the outer surface of the pipe girth weld (Figure 4).

4.4. Construction of Failure Assessment Curves

Each option of the BS 7910 FAD method consists of an assessment curve, which is obtained by the curve equation Kr = f(Lr), and a cut-off value Lr,max. If the calculated rating point (Lr, Kr) is located within the area surrounded by the vertical line of the axis, the rating line, and the cut-off value Lr,max, then, the crack passes; if it is located outside that area, then, the crack fails. The cut-off value Lr,max is determined according to Equation (4), in which the average tensile strength is generally used. In this case, due to a lack of statistical data regarding the performance of the parent material, the minimum tensile strength of the X65 steel was used to calculate the cut-off value for conservative consideration.
L r , m a x = σ Y + σ u 2 σ Y
As the stress-strain curve has no yield plateau, the Option 1 failure assessment curve can be determined according to Equations (5) and (6):
f L r = 1 + 0.5 L r 2 0.5 0.3 + 0.7 e x p μ L r 6 L r 1 f L r = 1 L r N 1 / 2 N 1 < L r L r , m a x
μ = min 0.001 E σ Y , 0.6 N = 1 n = 0.3 1 σ Y σ u
where Lr is the load ratio, which is the independent variable in the FAD; E is the modulus of elasticity; μ and N are the coefficients in Equation (4), for the minimum performance parameters used in X65 steel, μ = 0.4667 and N = 0.0477.
The Option 2 failure assessment curve can be determined according to Equation (7):
f L r = E ε r e f L r σ Y + L r σ Y 3 2 E ε r e f 0.5                       L r L r , m a x
where σref is the reference stress, and εref is the corresponding strain in the true stress-strain curve of the material, i.e., σref = Lr × σY.
Figure 5 displays the Option 1 and 2 evaluation curves of the X65 base material of the Ø813 × 17.5 mm pipe used in this paper.

4.5. Calculation of Lr and Kr

According to BS 7910, the fracture ratio (Kr) and load ratio (Lr) can be calculated as follows:
K r = K I K m a t Y σ P = M f w k t m M k m M k P m + k t b M k b M b P b + k m 1 P m π a Y σ S = M m Q m + M b Q b
L r = σ r e f σ Y
where ()P is the contribution from principle stresses; ()S is the contribution from secondary stresses; KI is the tensile stress intensity factor; a is the crack depth; M is the Bulging correction factor, which is M = 1 for the outer surface circumferential crack; fw is the finite width correction factor, which in this case is fw = 1.000; Mm and Mb are the stress intensity magnification factors of membrane and bending stress components, respectively; Mkm and Mkb are respectively the membrane and bending stress intensity magnification factors at the weld toe; km is the stress concentration factor due to misalignment; σref is the reference stress corresponding to the applied load; σY is the base material yield stress, and ktm and ktb are the membrane and bending stress concentration factors, respectively. Since the specific equation is not provided in Annex B, the membrane and bending stress concentration factors are not considered for the time being, and are taken as 1.

4.6. Stress Concentration Factor Due to Misalignment

The presence of misalignment can cause additional bending stress when the girth weld is subjected to axial tensile load. Therefore, in the calculation of the load and fracture ratios, it is necessary to consider the stress concentration factor induced by misalignment and the magnitude of the bending stress. According to Appendix D in BS 7910-2019 [5], the calculation equation is as follows:
k m = 1 + σ s P m
where km is the stress concentration factor due to misalignment; σs is the bending stress caused by the misalignment; and Pm is the primary stress that the ring weld withstands axially.
The bending stress for axial misalignment at girth welds in pipes with or without thickness changes (Figure 6) could be calculated as follows:
σ s = 6 e B 1 1 v 2 1 1 + B 2 / B 1 1.5 P m σ s P m < 1 2.6 e B 1 1 1 + 0.7 B 2 / B 1 1.4 P m σ s P m 1
where e is the misalignment level; and B1 and B2 is the wall thickness of the pipe on both sides of the misalignment of the girth weld. In this paper, it is assumed that the wall thickness on both sides is the same; that is, B1 = B2.

5. Parametric Analysis on the Assessment Results

The fracture behavior of the weld joint is mainly affected by three factors: load, flaw, and material. The effects of crack size, pipeline geometric conditions, and material properties on the evaluation results are analyzed in the following subsections. In Section 5.1 and Section 5.2, the minimum specified values of the X65 steel, i.e., yield strength of 450 MPa and tensile strength of 535 MPa, were selected for the material properties; in Section 5.3, to analyze the effect of the material properties on the evaluation results, the maximum and mean values were used.

5.1. Effect of Crack Size

By analyzing the data of the circumferential weld anomalies detected in each pipe section obtained through high-definition magnetic flux leakage test results [26], it was found that most of the circumferential weld anomalies are distributed at a height of 30% of the wall thickness and the length of 200 mm. Only a small number of defects are found at heights greater than 40% the wall thickness and length greater than 250 mm. All of the detected abnormalities in girth welds did not exceed 50% of the wall thickness. To cover most of the crack size ranges, different crack depth ratios (a/B = 0.1, 0.2, 0.3) and crack length-to-cycle ratios (2c/πD = 0.01, 0.03, 0.05, 0.07) were selected to determine and analyze the effect of crack size on the applicability evaluation results of Ø813 × 17.5 mm pipeline girth welded joints in the Mo-Da pipeline.
By comparing the evaluation results obtained for different crack sizes (Figure 7), it can be deduced that, the larger the crack size, the closer the pipeline to the critical failure state, i.e., the higher the risk of pipeline operation. Moreover, based on the effect trends of changing the size parameters on the evaluation results, it can be seen that the effect of the crack depth on pipeline safety is far more significant than that of the crack length.

5.2. Effects of Pipe Wall Thickness and Misalignment

In the previous subsection, the effect of the crack size on the evaluation results of the girth welds on Ø813 × 17.5 mm pipes were compared and analyzed. Based on the current internal detection accuracy control requirements and crack size control specifications, the possible maximum crack depth (a) and length (2c) of a pipe girth welding are 2.5 mm and 25 mm, respectively. At the actual position of the crack, the wall thickness and misalignment are not necessarily the same. According to relevant standards [27], the axial stress of the pipeline under normal service conditions should not exceed 0.9 times the minimum yield strength of the base metal.
Based on this assumption, in this section, the results of axial pipeline loading with different misalignment levels and wall thickness values are analyzed under loads equal to 0.5–0.9 times the minimum yield strength. Figure 8a demonstrates the results of pipe girth welds with different misalignment and wall thickness values when loaded with an axial load of 0.9 times the minimum yield strength. In addition, Figure 8b shows the results of the Ø813 × 11 mm pipe girth welds with different misalignment when loaded with axial loads of 0.5–0.9 times the minimum yield strength.
According to Figure 8, the smaller the pipe wall thickness, the larger the corresponding load and fracture ratios, and the greater the possibility of failure. Therefore, by increasing the pipeline wall thickness, the safety of the pipeline can be effectively improved. When there is no misalignment at the girth weld, the difference between the load ratios corresponding to different wall thickness values is not large. Nevertheless, with the increase of the misalignment level, the distance between the evaluation points corresponding to different wall thickness values increases gradually, indicating that the existence of misalignment significantly increases the stress concentration, and the greater the misalignment, the more severe the stress concentration.
By comparing the results obtained for different misalignment levels, it can be found that, when the girth weld does not contain any misalignments, the evaluation results corresponding to all wall thickness values meet the safety requirements under loads equal to 0.5–0.9 times the minimum yield strength. When there is a misalignment of 1 mm or more, not all crack evaluation results under all loading conditions can pass the evaluation. This is attributed to that a high level of misalignment results in high bending stress, which makes the bearing state of the circumferential weld extremely dangerous.

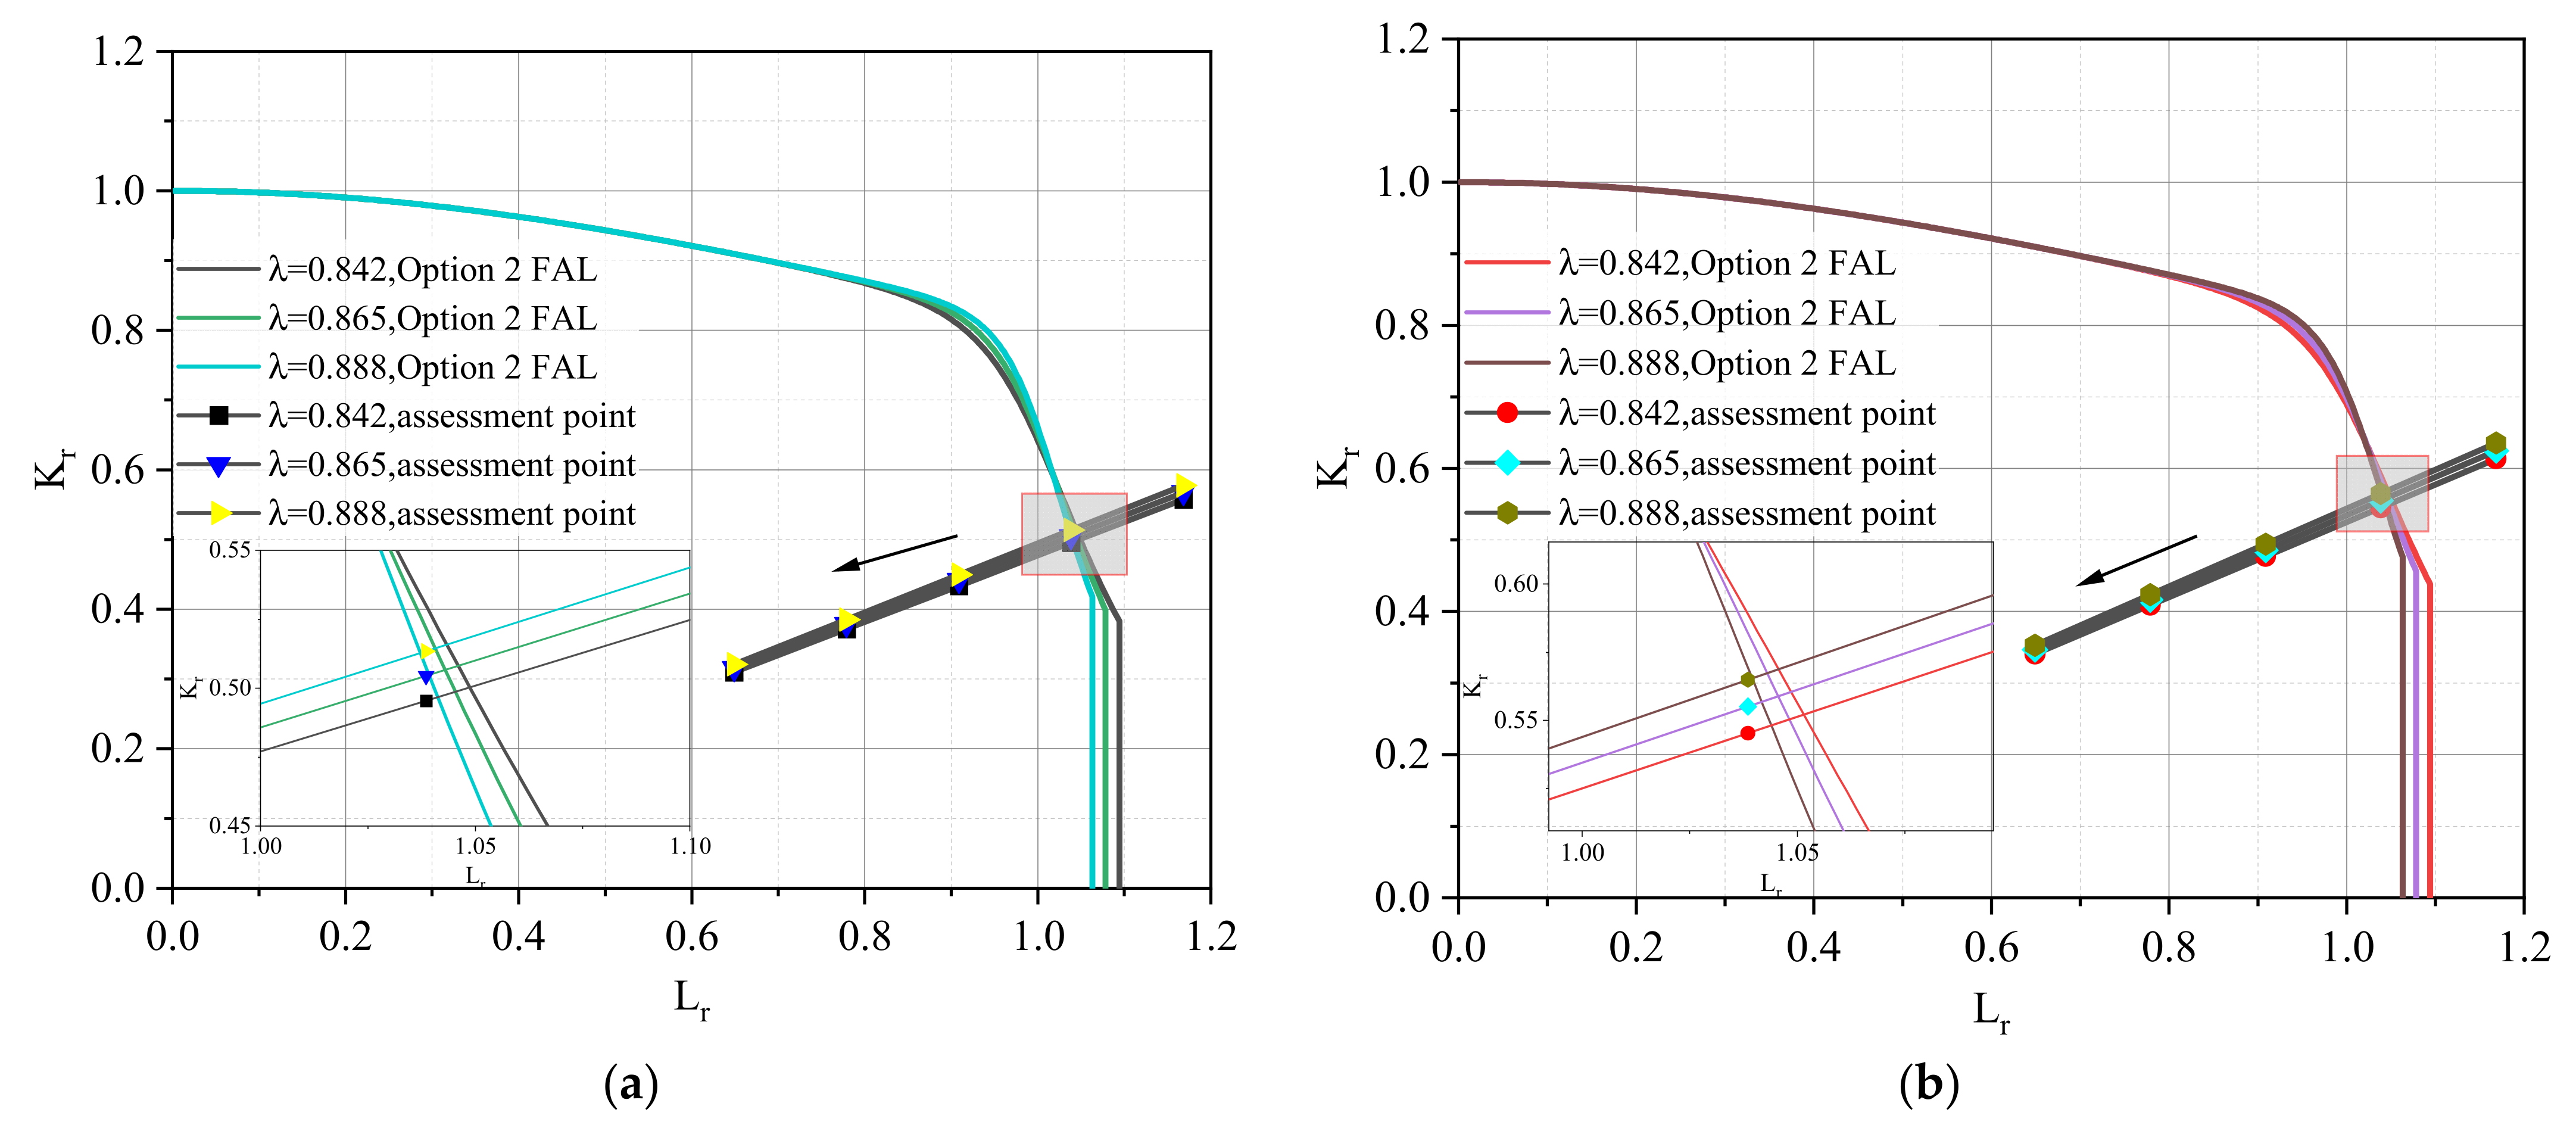
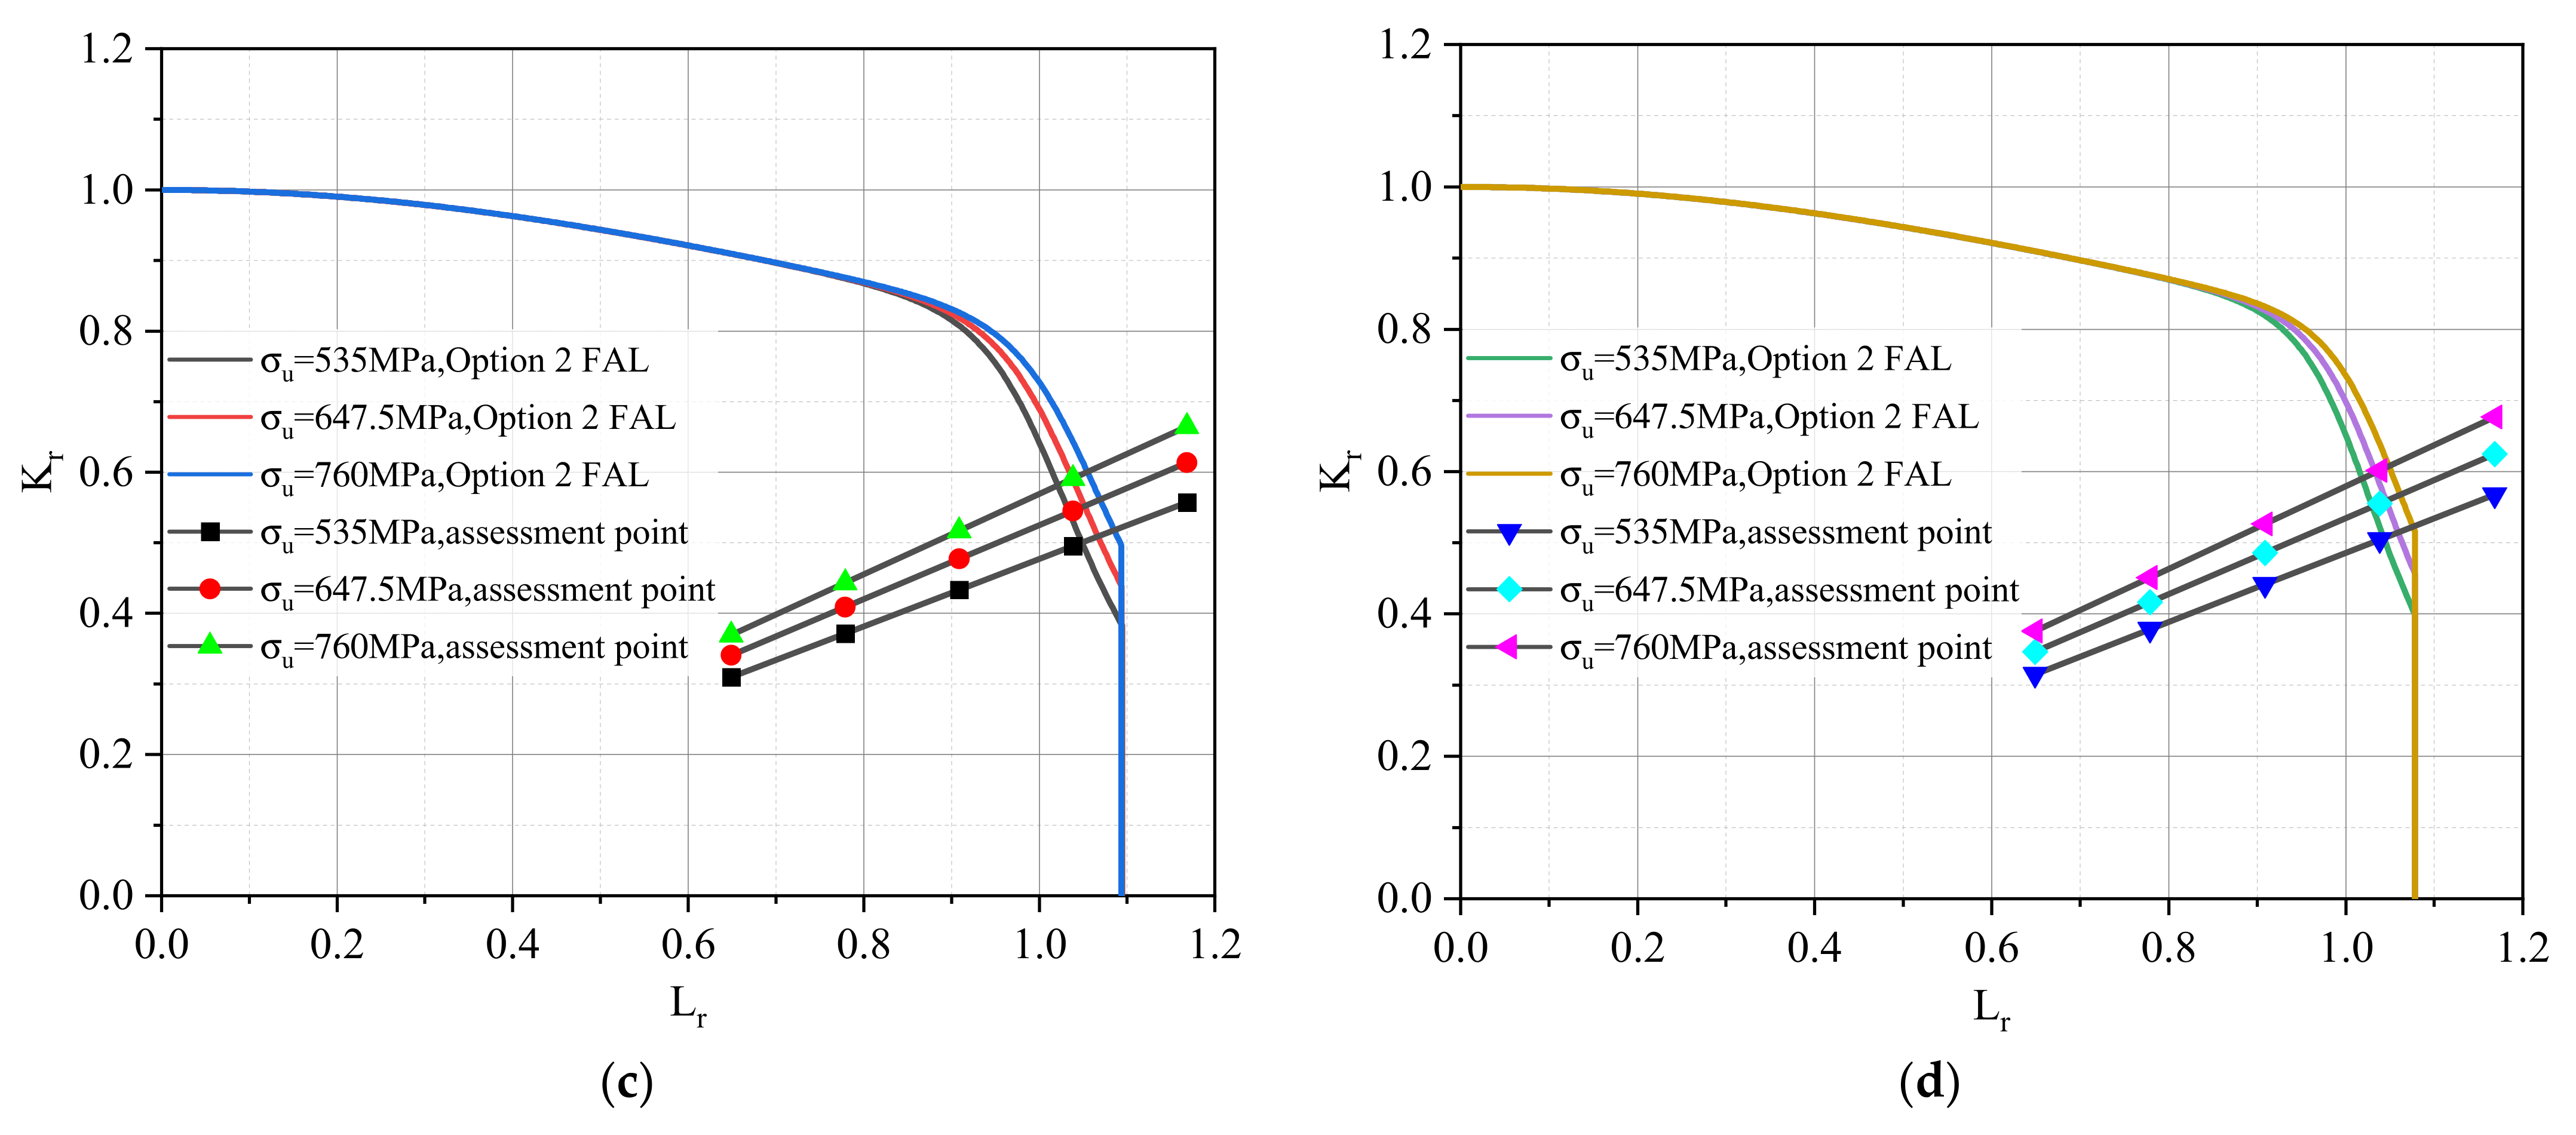
5.3. Effect of Material Properties

When evaluating welded joints, BS 7910 suggested using the tensile properties of materials with lower strength, which is a more conservative approach. In Option 2, uniaxial tensile stress-strain curves of materials with lower strength should also be used. The girth weld joints are generally matched with equal strength or high strength, considering the effect of strength matching; as such, the bearing capacity of the pipe section depends mainly on the material properties of the base metal [28]. Even if the same grade of steel pipe is used for the pipeline, the performance parameters are not completely consistent.
Therefore, in order to verify the effect of the X65 steel performance parameters on the evaluation results, the maximum and mean values of the tensile strength and yield ratio were selected to analyze their effect on the evaluation results. The final calculation results and the corresponding true stress-strain curves are shown in Table 1 and Figure 9, respectively.
From the above section, it can be seen that, the thinner the wall thickness, the higher the risk of cracks in the pipe; accordingly, the Ø813 × 11 mm pipeline girth weld crack risk is the highest. Consequently, in this section, the results of the Ø813 × 11 mm pipeline girth weld with 25 mm × 2.5 mm cracks with different material properties under an axial load of 0.9 times the minimum yield strength are analyzed (Figure 10).
According to the results shown in Figure 10a,b, under the same tensile strength, the lower the yield strength, the higher the corresponding cutoff value, and the wider the envelope range of the failure assessment curve. The increase range is concentrated mainly in the plastic deformation area. In addition, the higher the yield strength, the higher the fracture ratio of the evaluation point, which indicates that a too high yield ratio is not conducive to pipeline safety.
According to Figure 10c,d, under the same yield ratio, the higher the tensile strength of steel, the wider the envelope range of the corresponding failure evaluation curve. Moreover, the higher the fracture ratio of the evaluation point, the wider the envelope range of the evaluation curve, which can provide a larger safety margin. However, the increase in the fracture ratio of the evaluation point increases the risk. Consequently, whether the increase of the tensile strength of the steel has a positive effect on the evaluation results requires further investigation.

6. Analysis of Ultimate Axial Load under Various Service Conditions

The above analysis indicated that the crack size (depth ratio and length-to-cycle ratio), geometric conditions, and material properties all affect the applicability evaluation results of circumferential welds with cracks. The fracture behavior of the structure is mainly affected by three factors: load, flaw, and material. For girth welded joints, if the fracture toughness and crack size are known, the minimum load can be determined. Therefore, in this section, the maximum axial load that the ring welded joint can withstand under different factor combinations (Table 2) is calculated. Moreover, the effects of crack depth ratio, length-to-cycle ratio, pipe wall thickness, girth welded joint misalignment, and material properties on the ultimate load are analyzed.

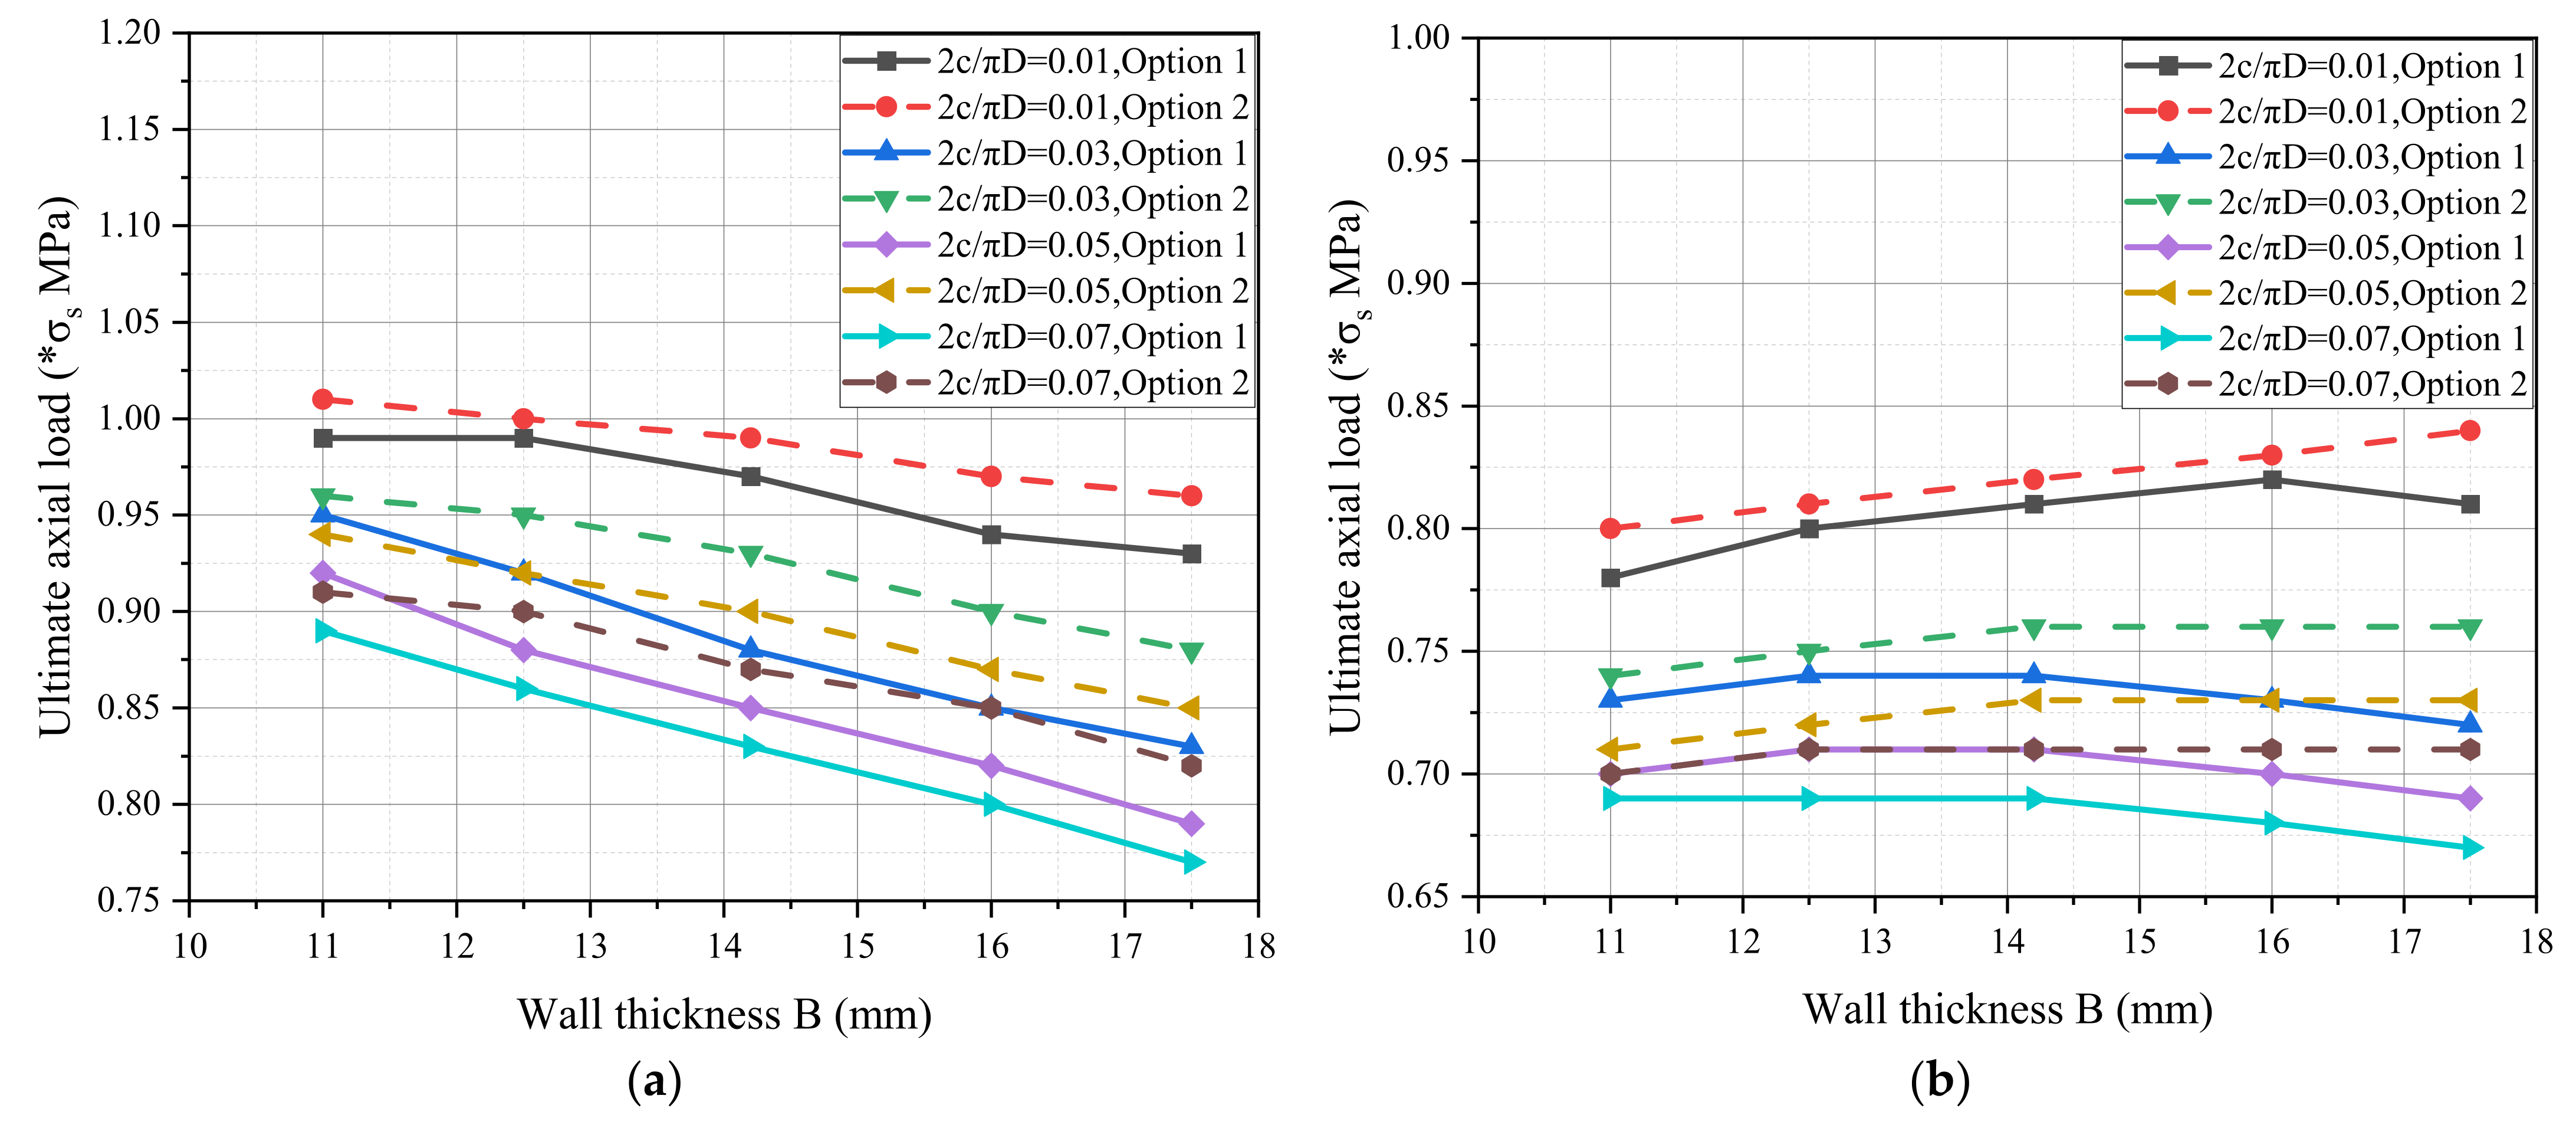
6.1. Effect of Crack Size

The effect of the crack depth ratio on the ultimate axial load was analyzed based on the evaluation results without and with 1 mm pipe misalignment under a fixed crack length-to-cycle ratio of 0.01 (Figure 11).
It can be observed that the larger the crack depth ratio, the lower the ultimate axial tensile load that the girth welded joint can withstand. The conservative degree of Option 2 evaluation was lower than that of Option 1 evaluation; thus, the ultimate axial load of the Option 2 evaluation was higher than that of the Option 1 evaluation. According to the Option 1 evaluation, when the crack depth ratio is 0.3, the maximum axial load should not exceed 0.93 times the specified minimum yield strength of the pipeline without misalignment during operation. Under the same conditions and 1 mm misalignment, the maximum axial load should not exceed 0.78 times the specified minimum yield strength during operation.
The effect of crack perimeter ratio on the ultimate axial load was analyzed based on the evaluation results without and with 1 mm pipe misalignment under a fixed crack depth ratio of a/B = 0.3.
According to Figure 12, the larger the crack length-to-cycle ratio, the lower the ultimate axial tensile load that the girth welded joint can withstand. In addition, the Option 2 evaluation was less conservative than the Option 1 evaluation; thus, the ultimate axial load under the Option 2 evaluation was higher than that under the Option 1 evaluation. According to the Option 1 evaluation, when there is no pipeline misalignment and the crack length-to-cycle ratio has the maximum value of 0.07, the maximum axial load should not exceed 0.77 times the specified minimum yield strength during operation. Under the same conditions and 1 mm misalignment, the maximum axial load should not exceed 0.67 times the specified minimum yield strength during operation.
Without pipeline misalignment, the ultimate axial load value decreases slightly with increasing wall thickness. This is because the width of the weld toe increases with the increase of the wall thickness, and the effect of stress concentration becomes more significant. The load is at the limit of plastic collapse, and its non-conservative degree increases. However, when there is pipeline misalignment, the ultimate axial load value increases slightly with the increasing wall thickness, which is attributed to the fact that the stress concentration of the weld toe is weakened with the occurrence of misalignment. In general, the greater the wall thickness, the higher the safety of the pipeline, and the ultimate axial load value increases as well.

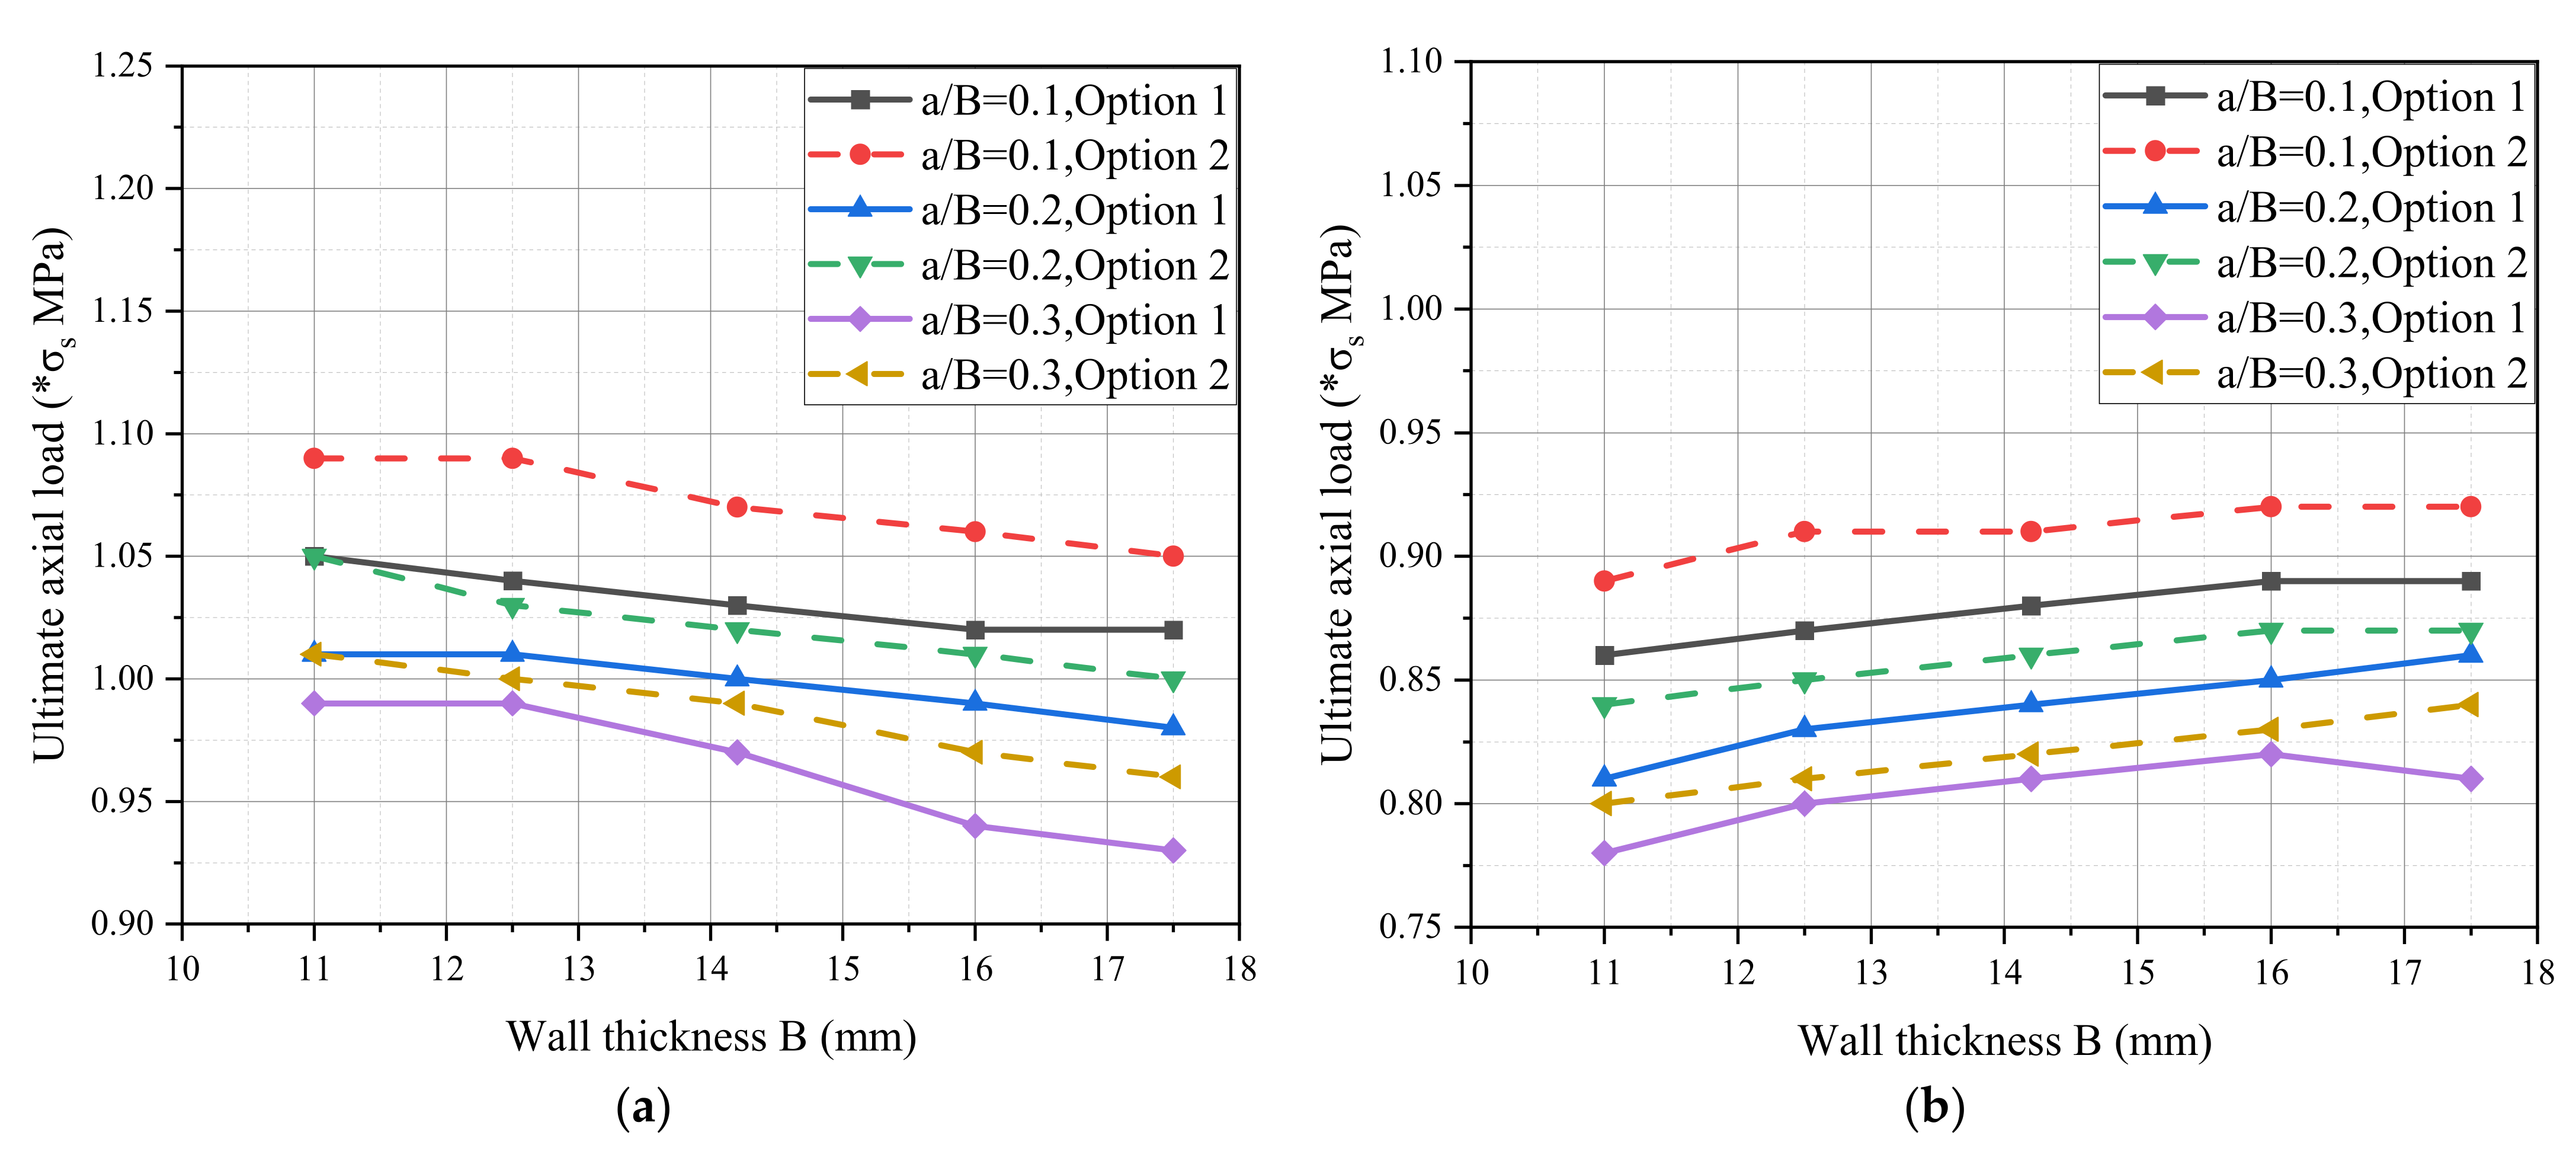
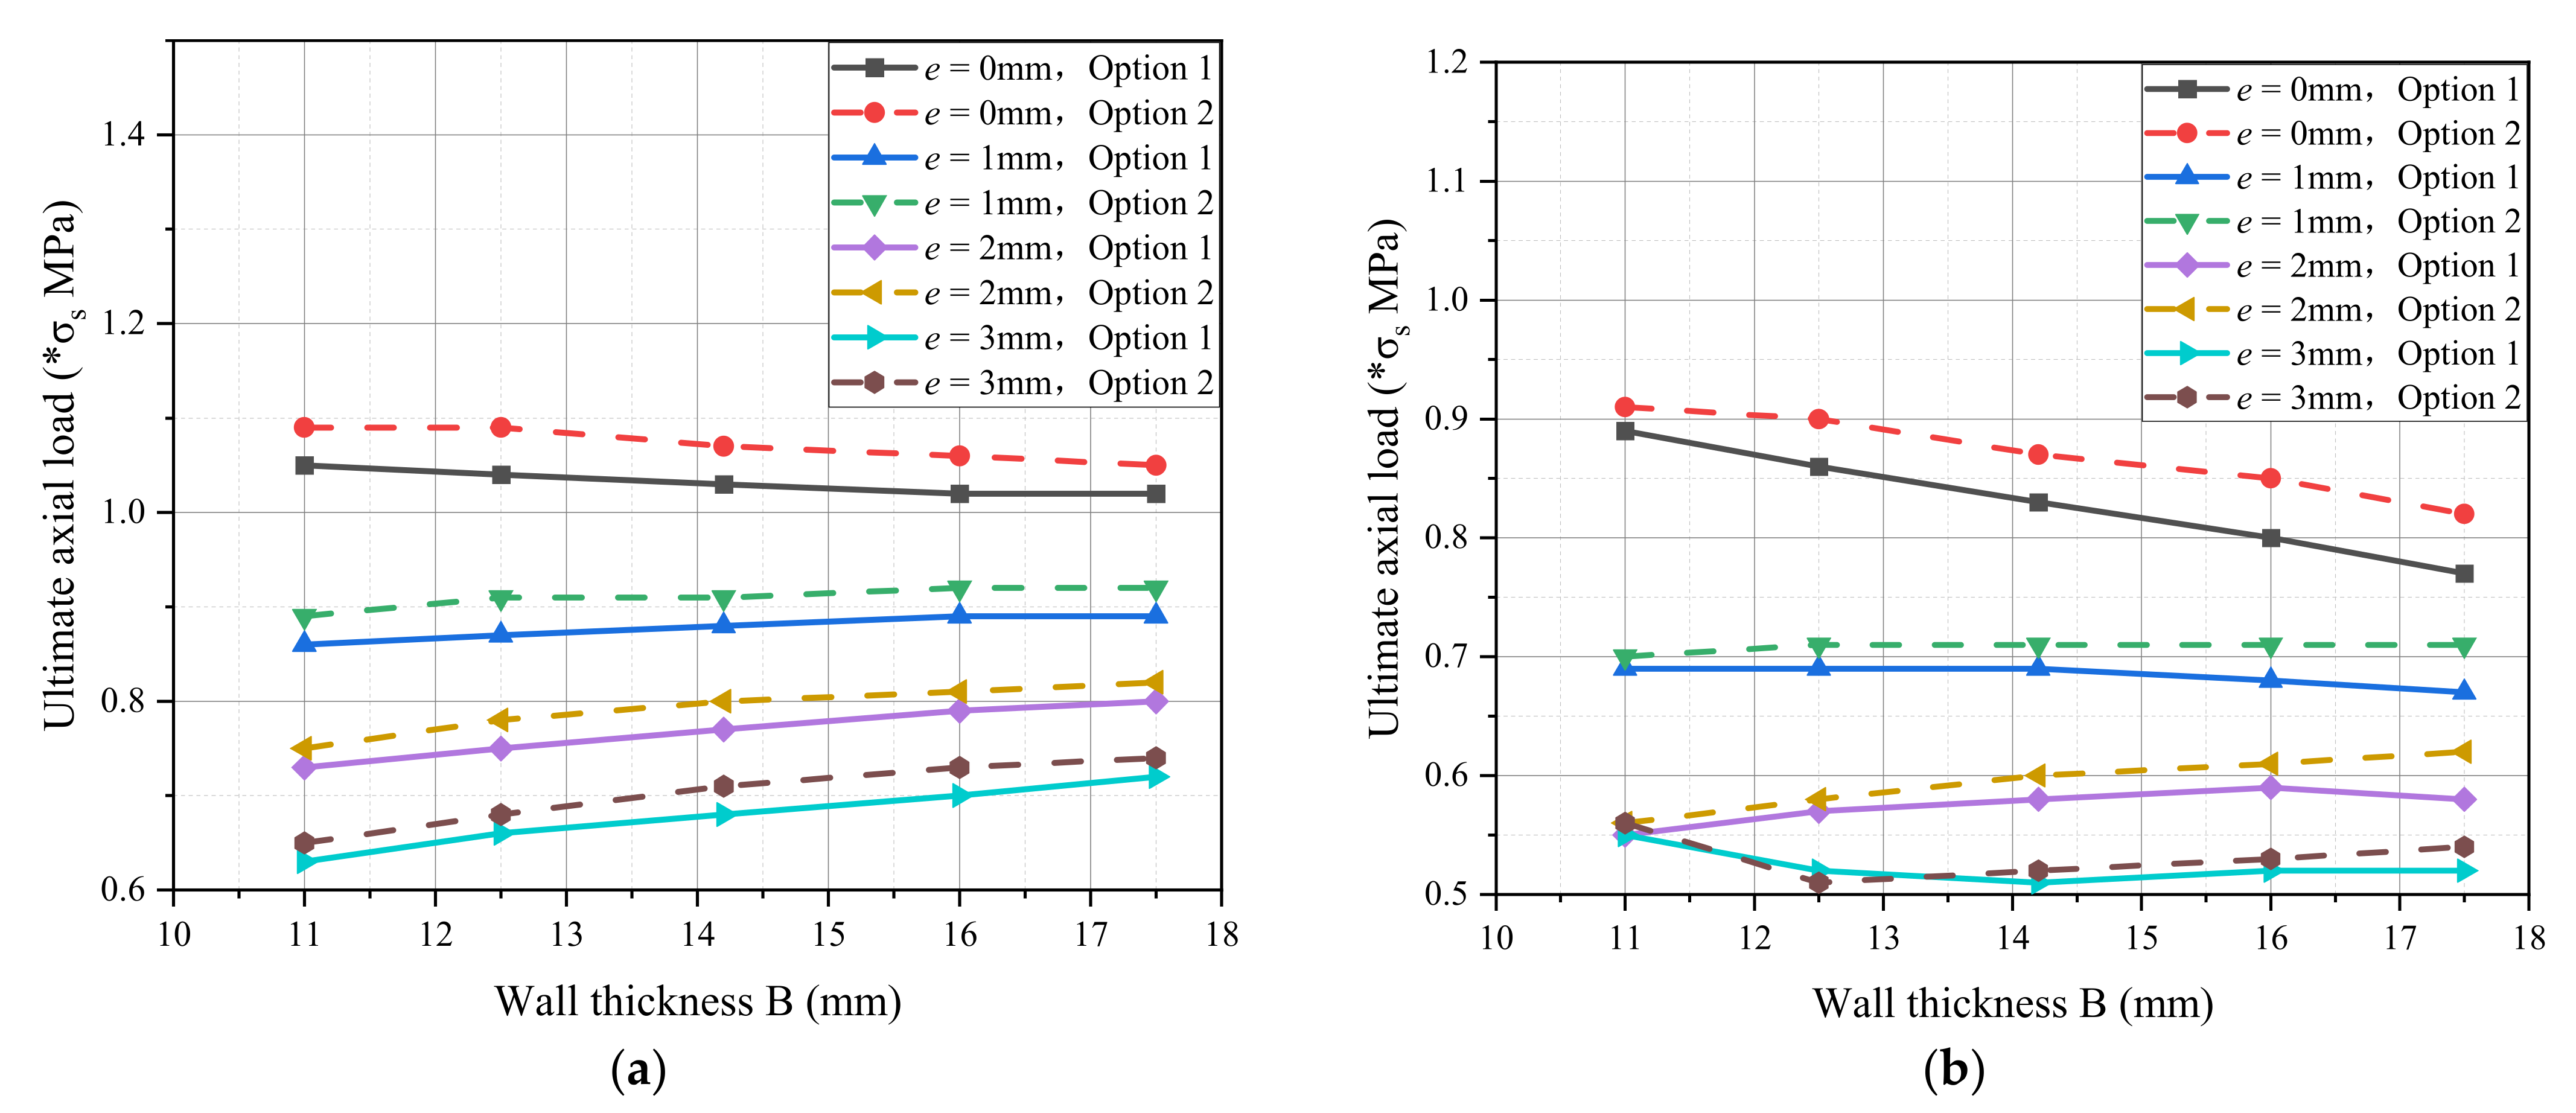
6.2. Effect of Wall Thickness and Misalignment

Due to effects related to the welding environment, labor conditions, and other factors, girth welded joints often have misalignments. By controlling the maximum and minimum crack size, the effects of wall thickness and misalignment on the ultimate axial load were analyzed and the results are presented in Figure 13.
It can be observed that, the larger the level of misalignment, the lower the ultimate axial tensile load that the ring welded joint can withstand. According to the Option 1 evaluation, when the size of the crack is the smallest and the misalignment is 3 mm, the maximum axial load should not exceed 0.62 times the minimum yield strength. Under the same conditions and when the crack size is the largest, the maximum axial load should not exceed 0.51 times the minimum yield strength. For different crack sizes with respect to the depth ratio, the effect of the wall thickness on the axial load does not exhibit a completely consistent trend, which also indicates that the ultimate axial load that the girth weld can bear is the result of multi-factor comprehensive effects, and the effect of wall thickness alone is not significant.

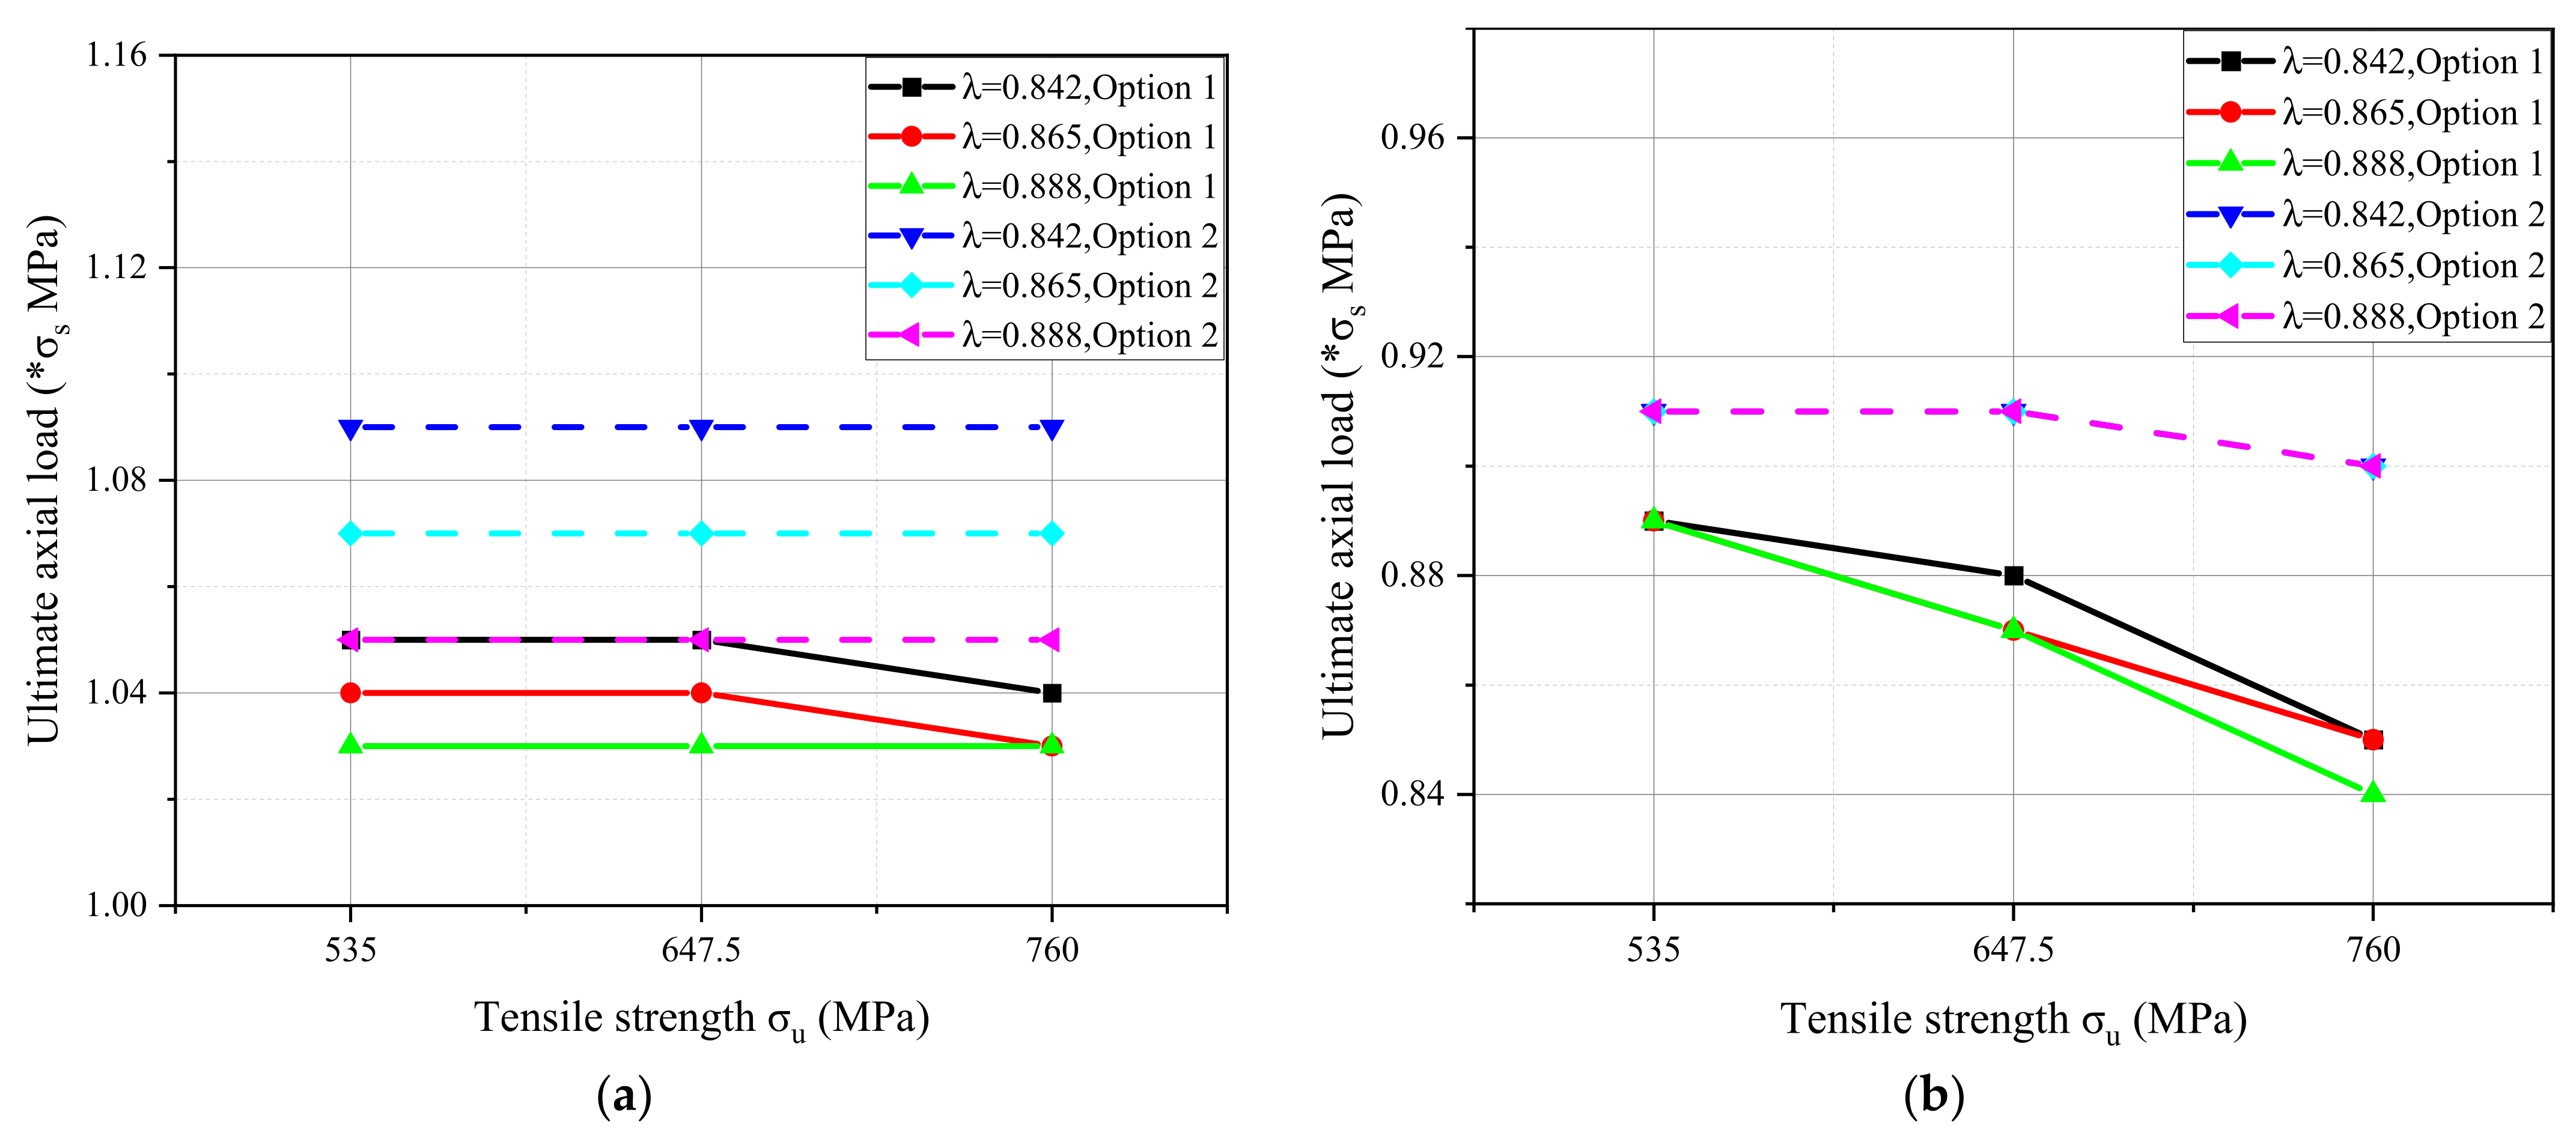
6.3. Effect of Material Properties

In this subsection, the effect of material properties on the ultimate axial load of the girth weld is analyzed considering the maximum and minimum crack size under a wall thickness of 11 mm and no misalignment.
According to Figure 14, under the same tensile strength, the higher the yield ratio of the steel, the lower the ratio of ultimate axial load to yield strength that the girth weld can withstand. This is more apparent when the crack size is small, and the effect of the yield ratio on the ultimate axial load weakens with increasing crack size. Under the same yield ratio, the higher the tensile strength, the lower the ratio of ultimate axial load to yield strength that the girth weld can withstand. This is more apparent when the crack size is large, and less significant when the crack size is small. The maximum axial load should not exceed 0.91 times the minimum yield strength specified in the relevant standards for circumferential welds with maximum size cracks without considering misalignment. This is consistent with the conclusion in relevant standards that the axial stress of the pipeline under normal service conditions shall not exceed 0.9 times the specified minimum yield strength of the base metal.

7. Data Driven-Based Prediction of the Ultimate Axial Load

In this paper, based on the BS 7910 FAD method and the stress failure criterion, the ultimate axial load of a X65 pipeline with cracks under 2160 different working conditions and different crack parameters, pipeline geometric parameters, and material parameters has been calculated. The investigated values for each influencing factor are listed in Table 2. In order to accurately assess the effects of the different influencing factors on the prediction results of the ultimate axial load of a X65 pipeline with cracks, this section conducts a parallel calculation under different working conditions based on different combinations of material yield ratio, misalignment, wall thickness, and crack size values. In total, 2160 sets of data were produced.
In this paper, the LIBSVM toolkit was used to train the above database and establish the support vector regression (SVM) model for ultimate axial load prediction. According to the operation process of the LIBSVM toolkit, the ranges of the penalty function c and kernel function g are selected based on experience, and the above parameters are optimized by the PSO algorithm. The PSO algorithm is a population intelligence-based optimization algorithm with good convergence and wide applicability, especially for more complex engineering problems. The objective function is the mean square error (MSE) of the prediction results and finite element results. When MSE ≤ 10−4, the optimization of the parameters is completed. The optimized values are given as cbest and gbest, and the SVR model is trained by these parameters, in order to accurately predict the evaluation results.
Error analysis is an important method for evaluating the accuracy of prediction models. The predictive accuracy of the developed SVR model can be determined based on statistical criteria, such as MSE and R. To assess the accuracy of the evaluation results, MSE and R are taken as the error analysis indices, which can be obtained using the following equations:
MSE = 1 m i = 1 m y i y ^ i 2
where m is the total number of samples, y i refers to the actual results, and y ^ i denotes the prediction results.
r x y = n x i y i x i y i n x i 2 x i 2 0.5 n y i 2 y i 2 0.5
where x is the actual result and y the prediction result.
As can be observed in the prediction error diagram of the PSO-SVR model (Figure 15), the error between most prediction results and finite element calculation results was less than 10%. As can be seen in Table 3, the correlation coefficients of the two models were higher than 99%, and the predicted results were found to be in good agreement with the numerical simulation ones, indicating that the proposed model has high prediction accuracy and reliability. Consequently, the prediction method proposed in this paper can be utilized for the safety evaluation of X65 pipelines with crack defects.

8. Conclusions

Based on the BS 7910 FAD method, this paper analyzed the important factors affecting the ultimate axial load of the X65 pipeline with cracked girth welds, and developed a prediction model for the ultimate axial load of the X65 pipeline, which provides a reference for the applicability evaluation and safe operation of X65 pipeline with girth weld cracks. The final conclusions are as follows:
(1)
The larger the crack size, the higher the risk to the safe operation of the pipeline. For pipeline girth welds without misalignment, the safety requirements are met if the axial load does not exceed 0.9 times the yield strength, even when there is a large-size crack. Moreover, according to the results regarding the effect of crack size parameters on the evaluation results, the effect of crack depth on pipeline safety is far greater than that of crack length.
(2)
The smaller the pipeline wall thickness, the higher the load and fracture ratios, and the greater the possibility of damage. The presence of misalignment significantly increases the stress concentration, and the greater the misalignment, the more severe the stress concentration. Increasing the pipeline wall thickness or reducing misalignment can effectively improve the safety of the pipeline.
(3)
Under the same tensile strength, the higher the yield strength, the narrower the envelope range of the failure evaluation curve, and the higher the fracture ratio of the evaluation point. This indicates that a high yield ratio of steel is not conducive to pipeline safety. On the other hand, whether the improvement of the tensile strength of steel under the same yield ratio has a positive effect on the evaluation results requires further investigation.
(4)
When there is no pipeline misalignment, the ultimate axial load decreases slightly with increasing wall thickness. When there is pipeline misalignment, the ultimate axial load increases slightly with increasing wall thickness, which is because the stress concentration of the weld toe weakens with the occurrence of misalignment. In general, the larger the wall thickness, the higher the safety of the pipeline, and the ultimate axial load increases as well.
(5)
Under the same tensile strength, the higher the yield ratio of steel, the lower the ultimate axial load that the girth weld can withstand, which is more apparent when the crack size is small. Therefore, when the crack size increases, the effect of the yield ratio on the ultimate axial load weakens. Under the same yield ratio, the higher the tensile strength, the lower the ultimate axial load that the circumferential weld can bear. This this is more obvious when the crack size is large, and less significant when the crack size is small.
(6)
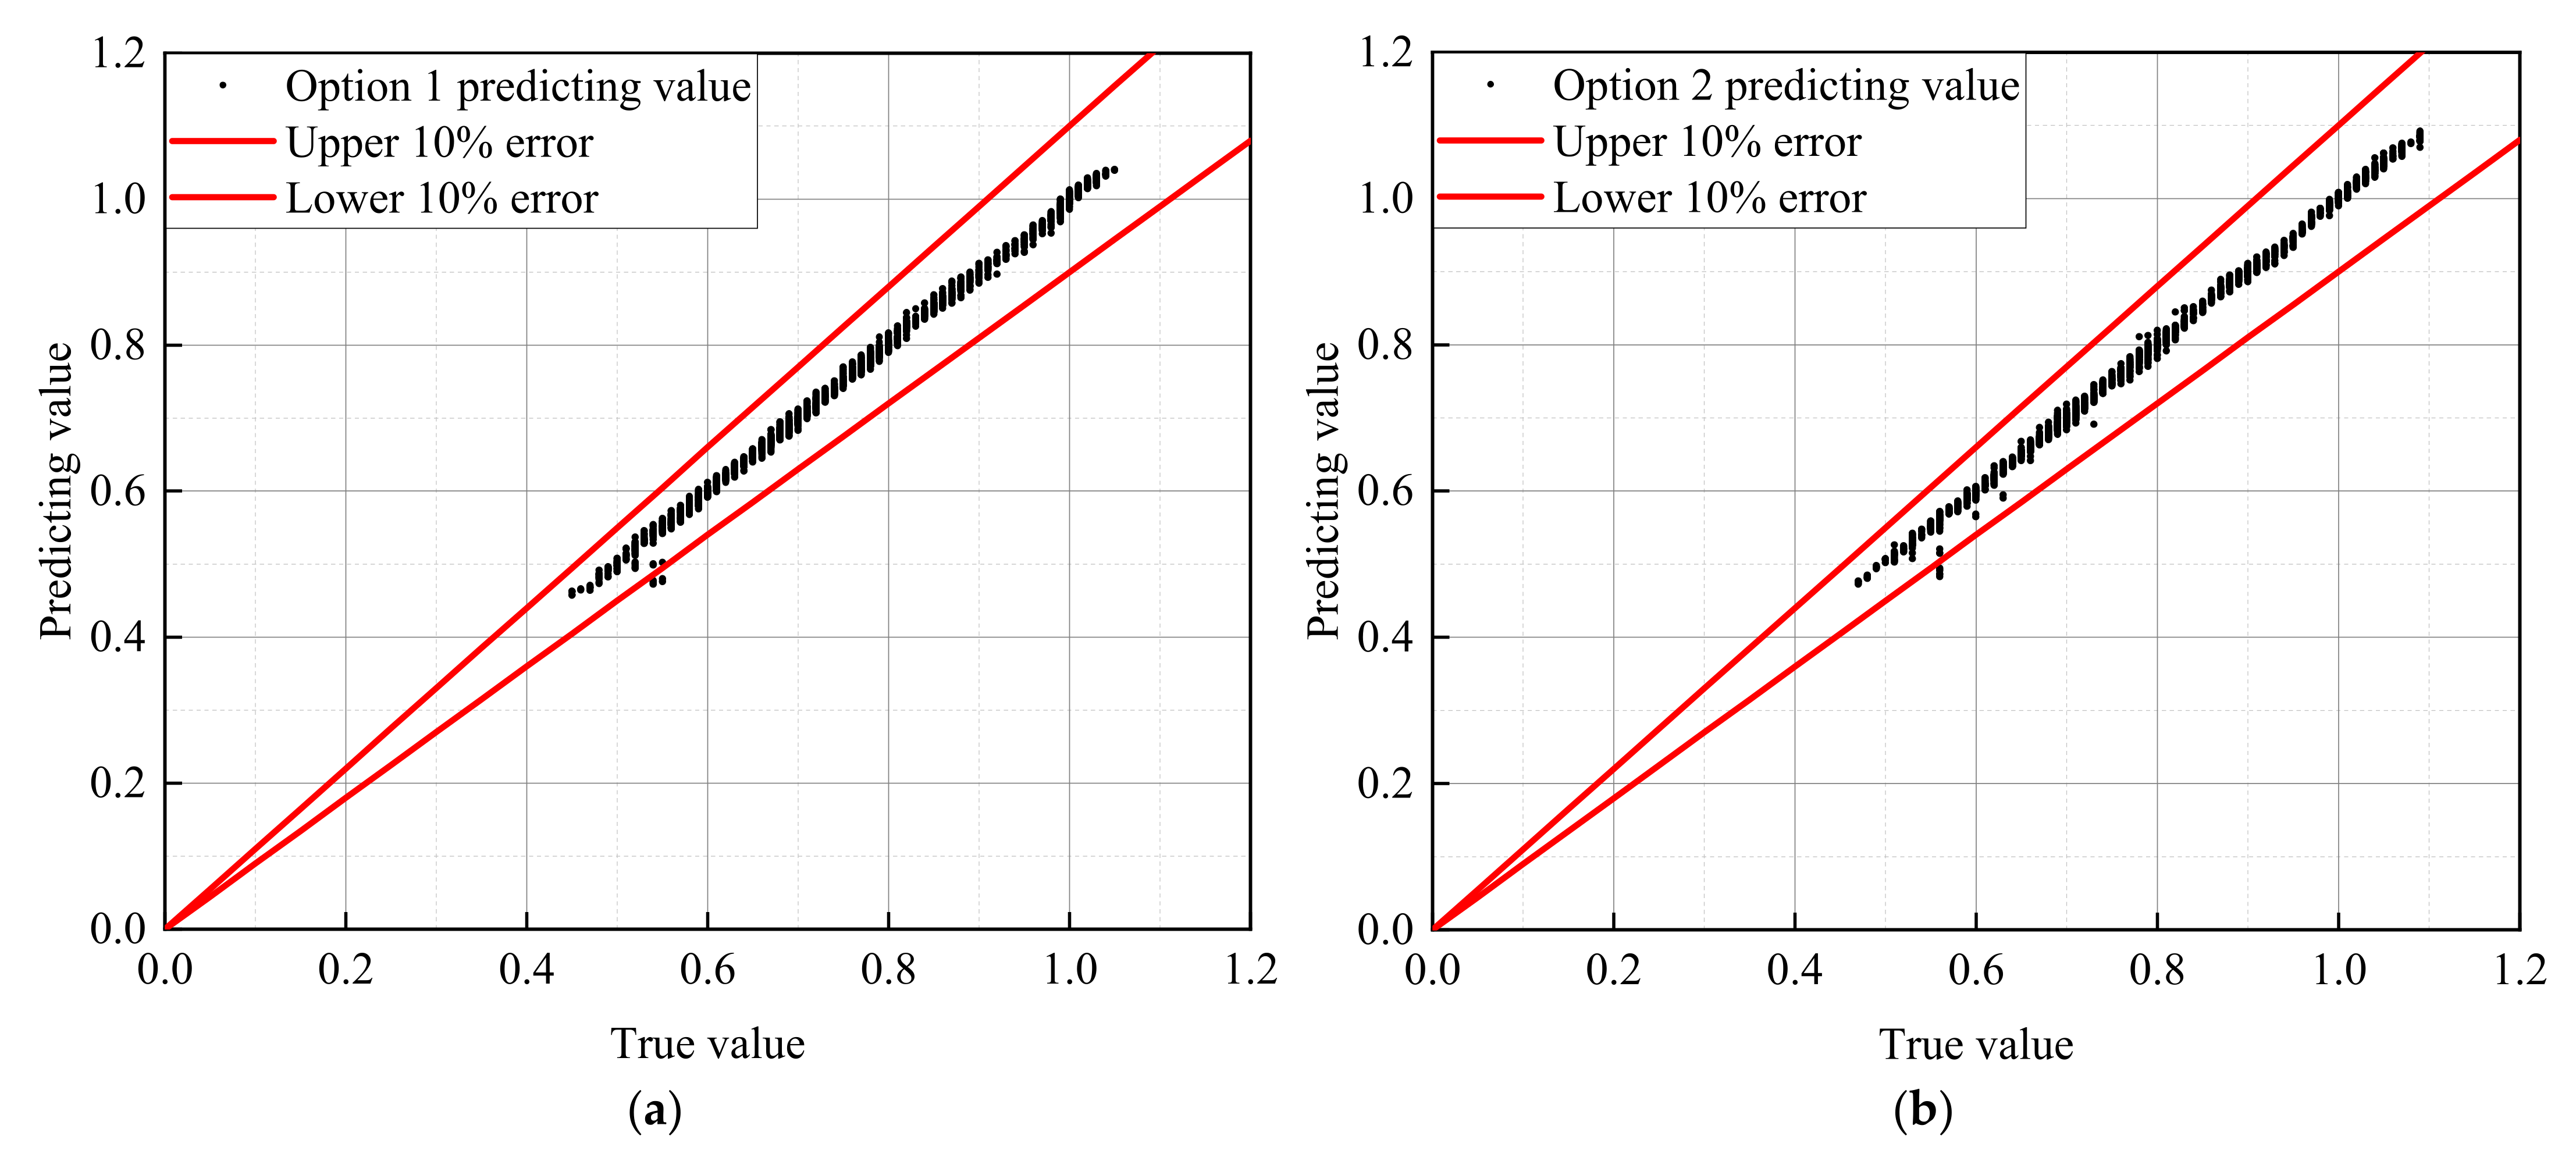
In this paper, a prediction model for the ultimate axial load of the X65 pipeline based on stress failure assessment criteria was developed. The correlation coefficients of the Option 1 and Option 2 evaluation models were above 99%, indicating that the prediction results of the PSO-SVR model are accurate and reliable.

Author Contributions

Conceptualization, H.Z.; data curation, writing and editing, S.W.; Methodology and formal analysis, J.L. and D.Z.; Supervision, X.L.; Validation, X.Z. All authors have read and agreed to the published version of the manuscript.

Funding

This research has been co-financed by Beijing Municipal Natural Science Foundation (Grant No. 8214053), National Science Foundation of China (Grant No. 52004314), Tianshan Youth Program (Grant No. 2019Q088), the Open Project Program of Beijing Key Laboratory of Pipeline Critical Technology and Equipment for Deepwater Oil & Gas Development (Grant No. BIPT2020005), PipeChina scientific research and technology development project-Research on failure mechanism for girth weld of high steel pipeline (No. WZXGL202105), Science Foundation of China University of Petroleum, Beijing (No. 2462020YXZZ045).

Institutional Review Board Statement

Not applicable.

Informed Consent Statement

Not applicable.

Data Availability Statement

Not applicable.

Acknowledgments

This work acknowledges the support of the above foundations, as well as the graduate students as participants from China University of Petroleum, Beijing.

Conflicts of Interest

The authors declare no conflict of interest.

References

  1. Li, G.Y.; Ma, W.; Wang, X.L.; Jin, H.; Wang, Y.-P.; Zhao, Y.-P.; Cai, Y.-J.; Zhang, P. Frost hazards and mitigative measures following operation of Mohe-Daqing line of China-Russia crude oil pipeline. Rock Soil Mech. 2015, 36, 2963–2973. [Google Scholar]
  2. Zhang, H.; Liu, X.B. Design strain calculation model for oil and gas pipelines subject to geological hazards. Oil Gas Storage Transp. 2017, 36, 91–97. [Google Scholar]
  3. Cosso, G.L.; Rizzo, C.M.; Servetto, C. Fitness-for-service assessment of defected welded structural details by experimental evaluation of the fatigue resistance S-N curve. Weld. World 2016, 60, 847–858. [Google Scholar] [CrossRef]
  4. Kastner, W.; Rohrich, E.; Schmitt, W.; Steinbuch, R. Critical crack sizes in ductile piping. Int. J. Press. Vessel. Pip. 1981, 9, 197–219. [Google Scholar] [CrossRef]
  5. Miller, A.G. Review of limit loads of structure containing defects. Int. J. Press. Vessel. Pip. 1988, 32, 191–327. [Google Scholar] [CrossRef]
  6. The American Society of Mechanical Engineers. Rules for Inservice Inspection of Nuclear Power Plant Components: ASME BPVC. XI-2015; ASME: New York, NY, USA, 2015. [Google Scholar]
  7. Lee, S.J.; Yoon, Y.-C.; Hwang, S.S.; Cho, W.Y.; Zi, G. Development of an Evaluation Method for the Compressive-Bending Plastic Buckling Capacity of Pipeline Steel Tube Based on Strain-Based Design N Structural Engineering and Construction. Procedia Eng. 2011, 14, 312–317. [Google Scholar] [CrossRef] [Green Version]
  8. Lee, J.S.; Kim, M.H. Strain-Based Failure Assessment Based on a Reference Strain Method for Welded Pipelines. J. Offshore Mech. Arct. Eng. 2020, 142, 1–27. [Google Scholar] [CrossRef]
  9. Bruschi, R.; Leonzio, V.; Ferrulli, A.; Scarsciafratte, D. ECA for girth welds of offshore pipelines: A modified BS7910 analytical approach Vs 3D FE analyses. In Proceedings of the ASME 2015 34th International Conference on Ocean, Offshore and Arctic Engineering, St. John’s, NL, Canada, 31 May–June 5 2015; pp. 1–10. [Google Scholar]
  10. Motohashi, H.; Hagiwara, N. Effect of strength matching and strain hardening capacity on fracture performance of X80 line pipe girth welded joint subjected to uniaxial tensile loading. J. Offshore Mech. Arct. Eng. 2007, 129, 318–326. [Google Scholar] [CrossRef]
  11. Carlucci, A.; Bonora, N.; Ruggiero, A.; Iannitti, G.; Testa, G. Crack initiation and propagation of clad pipe girth weld flaws. In Proceedings of the ASME 2014 Pressure Vessels and Piping Conference, Anaheim, CA, USA, 20–24 July 2014; Volume 7, pp. 1–7. [Google Scholar]
  12. Joseph, M.B. Prediction of ductile tearing using a proposed strain hardening failure assessment diagram. Int. J. Fract. 1980, 16, R73–R77. [Google Scholar]
  13. Milne, I. Failure Assessment Diagrams and J Estimates: A Comparison for Ferritic and Austenitic Steels. Int. J. Press. Vessel. Pip. 1983, 13, 107–125. [Google Scholar] [CrossRef]
  14. Andrews, R.M.; Denys, R.; Knauf, G.; Zarea, M. EPRG guidelines on the assessment of defects in transmission pipeline girth welds-Revision 2014. J. Pipeline Eng. 2015, 14, 9–21. [Google Scholar]
  15. Lukács, J.; Koncsik, Z.; Chován, P. Integrity reconstruction of damaged transporting pipelines applying fiber reinforced polymer composite wraps. Procedia Struct. Integr. 2021, 31, 51–57. [Google Scholar] [CrossRef]
  16. Milne, I.; Ainsworth, R.A.; Dowling, A.R.; Stewart, A.T. Assessment of Integrity of Structures Containing Defects. CEGB Report R/H/R6-rev 3, 1986. Int. J. Pvp. 1988, 32, 3–104. [Google Scholar]
  17. BS 7910. Guide to Methods for Assessing the Acceptability of Flaws in Metallic Structures; British Standards Institution: London, UK, 2019. [Google Scholar]
  18. Canadian Standards Association. Oil and Gas Pipeline Systems: CSA Z662-2015; Canadian Standards Association: Toronto, ON, Canada, 2015. [Google Scholar]
  19. Fitness-For-Service Joint Committee. Fitness-for-Service: API 579-1-2016; API and ASME: Washington, DC, USA, 2016. [Google Scholar]
  20. Larrosa, N.O.; Ainsworth, R.A. Comparisons of the solutions of common FFS standard procedure s to benchmark problems. Int. J. Press. Vessel. Pip. 2016, 139–140, 36–46. [Google Scholar] [CrossRef]
  21. Ainsworth, R.A.; Budden, P.J.; Dowling, A.R.; Sharples, J.K. Developments in the flaw assessment procedure s of R6 Revision 4 and BS7910. In Proceedings of the Asme Pressure Vessels and Piping Conference, Cleveland, OH, USA, 20–24 July 2003; pp. 1–7. [Google Scholar]
  22. Hadley, I. The history of BS 7910 flaw interaction. In Proceedings of the ASME 2011 Pressure Vessels & Piping Division Conference, Baltimore, ML, USA, 11–27 July 2011; pp. 1–7. [Google Scholar]
  23. Seghier, M.; Keshtegar, B.; Tee, K.; Zayed, T.; Abbassi, R.; Trung, N.T. Prediction of maximum pitting corrosion depth in oil and gas pipelines. Eng. Fail. Anal. 2020, 112, 104505. [Google Scholar] [CrossRef]
  24. Chang, J.C.; Wang, Z.H.; Zhu, Q.Y.; Wang, Z. SVR Prediction Algorithm for Crack Propagation of Aviation Aluminum Alloy. J. Math. 2020, 2020, 1–12. [Google Scholar] [CrossRef]
  25. Tian, Z.K.; Jiao, D.M. Discrete sizing optimization of stepped cylindrical silo using PSO method and implicit dynamic FE analysis. Eng. Comput. 2021, 37, 1015–1047. [Google Scholar] [CrossRef]
  26. CPPE LOPE201654313. Study on the Effect of Parallel Pipeline Blasting Construction on the Defects of Girth Welds; China Petroleum Pipeline Engineering Corporation: Langfang, China, 2017. [Google Scholar]
  27. ASME B31.8-2018. Gas Transmission and Distribution Piping Systems; The American Society of Mechanical Engineers: New York, NY, USA, 2018. [Google Scholar]
  28. Deng, K.; Ren, G.; Li, X. Research on Bearing Capacity of Full Automatic Welded Girth Weld Pipe Section with Defects. Welded Pipe Tube 2020, 43, 23–27. [Google Scholar]
Figure 1. Schematic of the FAD.
Applsci 11 11780 g001
Figure 2. FAD Evaluation Process based on BS 7910-2019.
Applsci 11 11780 g002
Figure 3. X65 line-pipe steel stress-strain curve.
Applsci 11 11780 g003
Figure 4. Schematic diagram of cracks at the girth weld.
Applsci 11 11780 g004
Figure 5. Option 1 and 2 evaluation curves of the Ø813 × 17.5 mm X65 pipe base metal.
Applsci 11 11780 g005
Figure 6. Axial misalignment at girth welds in pipes.
Applsci 11 11780 g006
Figure 7. Effect of crack size on the evaluation results of Ø813 × 17.5 mm pipeline girth welded joints. (a) a/B = 0.3; (b) 2c/πD = 0.07.
Applsci 11 11780 g007
Figure 8. Effects of wall thickness and misalignment on the crack evaluation of pipe girth welds. (a) σP = 0.9σY (b) B = 11 mm.
Applsci 11 11780 g008
Figure 9. True stress-strain curves of pipeline steels based on material properties.
Applsci 11 11780 g009
Figure 10. Effect of material properties on the evaluation results of a circumferential weld crack on the Ø813 × 11 mm pipeline. (a) σu = 535 MPa (minimum value); (b) σu = 647.5 MPa (mean value); (c) λ = 0.842; (d) λ = 0.865.
Applsci 11 11780 g010aApplsci 11 11780 g010b
Figure 11. Ultimate axial load of girth weld cracks in pipes with different wall thickness values (2c/πD = 0.01). (a) e = 0 mm; (b) e = 1 mm.
Applsci 11 11780 g011
Figure 12. Ultimate axial load of girth weld cracks in pipes with different wall thickness values (a/B = 0.3). (a) e = 0 mm; (b) e = 1 mm.
Applsci 11 11780 g012
Figure 13. Effects of wall thicknesses and misalignment on the ultimate axial load of pipeline girth weld cracks. (a) a/B = 0.1; 2c/πD = 0.01; (b) a/B = 0.3; 2c/πD = 0.07.
Applsci 11 11780 g013
Figure 14. Effect of material properties on the ultimate axial load of pipeline girth weld cracks. (a) a/B = 0.1; 2c/πD = 0.01; (b) a/B = 0.3; 2c/πD = 0.07.
Applsci 11 11780 g014
Figure 15. Evaluation prediction error diagram. (a) Option 1; (b) Option 2.
Applsci 11 11780 g015
Table 1. Material performance parameters.
Tensile Strength
σu (MPa)
Yield Strength
σY (MPa)
Yield Ratio
λ
Hardening Coefficient
Ar
Power Hardening Index
n
5354500.8421.3320.98
462.50.8651.2724.60
4750.8881.2129.72
647.55450.8420.9321.06
5600.8650.8824.67
5750.8880.8329.77
7606400.8420.6421.11
657.50.8650.6024.72
6750.8880.5629.80
Table 2. Value ranges of the investigated influencing factors.
Influencing FactorsValues
Crack depth ratio a/B0.1, 0.2, 0.3
Crack length-to-cycle ratio 2cD0.01, 0.03, 0.05, 0.07
Wall thickness B (mm)11.0, 12.5, 14.2, 16.0, 17.5
Misalignment e (mm)0, 1, 2, 3
Tensile strength σu (MPa)535, 647.5, 760
Yield ratio λ0.842, 0.865, 0.888
Table 3. Prediction errors.
ParametersOption 1 Prediction ErrorOption 2 Prediction Error
MSE (mean square error)1.55 × 10−41.39 × 10−4
R (correlation coefficient)99.75%99.77%
Publisher’s Note: MDPI stays neutral with regard to jurisdictional claims in published maps and institutional affiliations.

