1. Introduction
In the view of the current upward trend in electrical energy prices, there are growing concerns in all branches of industry and installations about ways to reduce the costs of energy consumers. These concerns aim at the large-scale use of energy from renewable sources and at improving existing facilities and equipment so that their energy consumption is reduced. Last but not least, the impact on the environment of the various installations must be taken into account both in terms of the emissions they release into the atmosphere during production and exploitation and in terms of the possibility of recycling the component materials at the highest possible percentage too.
In the context of those listed above is also the topic addressed in this paper, namely the determination of an optimal thickness of insulation, so that the energy consumption is as low as possible, in the case of cold storage.
By balancing the necessary costs for the initial investment to build the cold storage and estimating the necessary costs to ensure the refrigeration load, we established an optimal thickness of the insulation. This was performed for the cold storage placed in different climatic zones on the Romanian territory (according to the national regulations, in Romania there are five climatic zones), insulated with sandwich panels with PUR insulation.
Many authors have recently shown interest in determining the optimal thickness of insulation for different applications or constructions in correlation with the climatic zones they are located in.
Alsayed M. et al. in 2019 [
1] performed a study regarding the optimization of insulation thickness in buildings external walls based on a Life Cycle Costing (LCC) approach and analysed the building insulation’s effects on annual heating and cooling loads in Palestine. Kurekci in 2016 [
2] determined the optimum insulation thicknesses, total net saving amount, reimbursement period change based on the fuels and insulation materials for 5 different provincial centers (İzmir, İstanbul, Ankara, Sivas and Erzurum) selected according to their degree/day values, placed in Turkey. Ziapour B. et al. in 2020 [
3] conducted a thermo-economic analysis for determining the optimal insulation thickness for new composite prefabricated wall blocks. Although the study is focused on Iran, it can be generalised to other countries.
The above-mentioned examples reinforce the fact that the choice of the optimal insulation thickness is a present concern in the field of constructions as is an extremely important aspect to be considered when analysing the energy performance of the building envelope. This study begins to be widely used in other types of construction, such as cold storage containers or other enclosed spaces that require heating or cooling. Sarbu I. et al. [
4] highlights the importance of the insulation quality and thickness for an economical operation with minimal energy consumption for a cooled room. The authors developed a rating optimization model of various types of insulations. Kecebas [
5] performed an extended analysis on a cold storage placed in Turkey concerning the optimum insulation thickness effect on costs and savings. Mohammad A. [
6] et al. developed a study to determine the optimum insulation thickness of cold storage walls for all climate zones in Jordan.
Specific energy consumption values for various refrigerated food cold stores were evaluated by Evans [
7] and are considered as a reference.
The authors of this paper contribute to the improvement of the current state of knowledge in the field by conducting a complex study on cold and freezing storage rooms placed in different areas in Romania, with the main output data being the optimal insulation thickness and a life cycle cost examination. The thermal insulation panels are according to the national regulations “EN 14509: 2007 Self-supporting double skin metal faced insulating panels-Factory made products-Specifications” [
8] and they are characterized primarily by a low weight, good rigidity and resistance to mechanical shocks. The panels were chosen to be resistant to temperature changes and exposure to various atmospheric conditions. Another reason was the fact that they must be recyclable.
2. Materials and Methods
To carry out this study, the authors considered a cold storage placed in a Logistic Centre, with geometrical dimensions L × l × H = 40 × 20 × 12 m. The cooling reference temperatures for cold storage are given in
Table 1 [
9]. The storage warehouse is made of sandwich panels, with a PUR insulating layer, composed of a thermal insulation core and two steel sheets. The outer layer has 0.06 mm thickness, and the inner layer is of 0.4 mm thickness, both being covered with a layer of polyester and organic protective layers.
The average temperatures for the hottest month by climate zone are shown in
Table 2 and were extracted from a weather database, [
10].
In the case of cold storage, the role of thermal insulation is particularly important to minimize the penetration of heat from the outside, so that the energy consumption necessary to maintain a low temperature inside is minimal and as an effect, the operating costs are as low as possible.
The heat transfer through building parts (wall, floor and ceiling) was evaluated with the general relation (1) [
11]:
where:
—Overall heat transfer coefficient given in Equation (2) [W/m2⋅K];
—Total area of storage warehouse [m2];
—Temperature difference between the outside and inside conditions [K]
—convection heat transfer coefficient for indoor surfaces [W/m2⋅K];
—convection heat transfer coefficient for outdoor surfaces [W/m2⋅K];
—insulation thickness [m]; There were considered thicknesses between 0.03 ÷ 0.2 m;
—material thermal conductivity for PUR = 0.027 W/m·K [
12,
13].
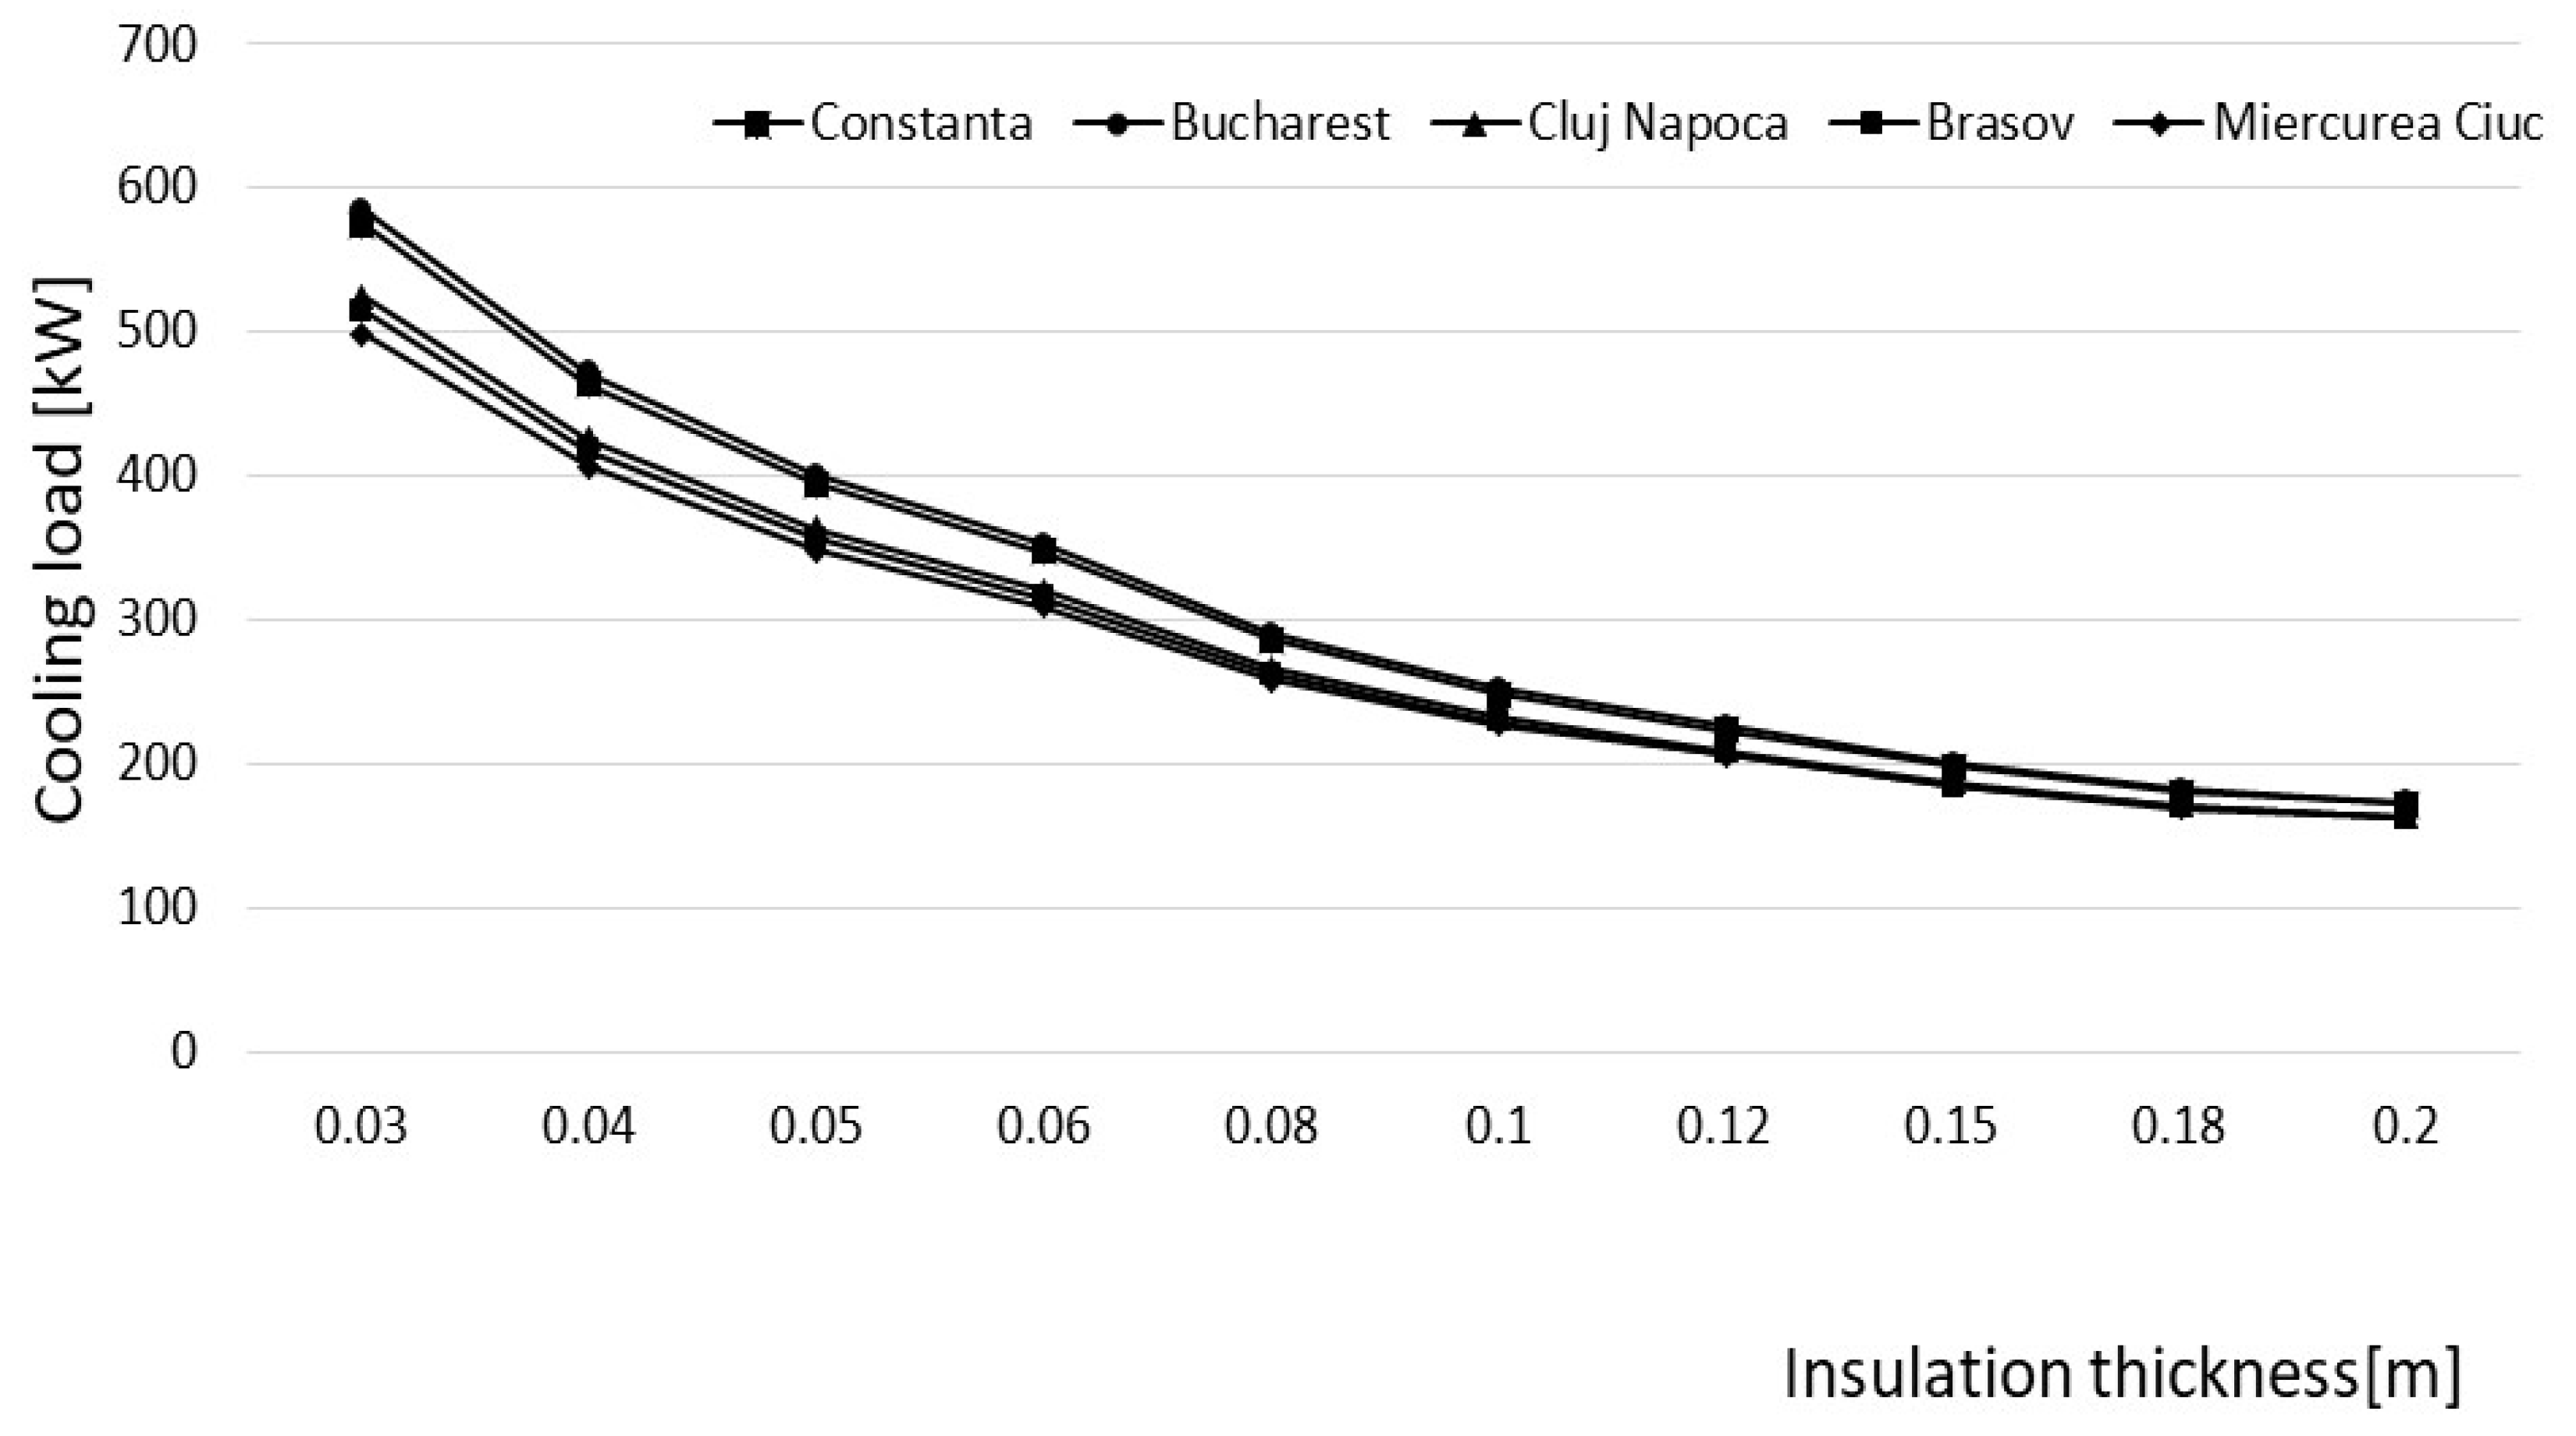
The heat transfer through building parts depends on the thickness of the insulating layer, indoor space temperature as well as on the climatic zone, the variation is presented below in
Figure 1.
There can be noticed a decrease in the heat transfer through building parts by about 49.12% for a thickness of the insulating layer of 200 mm when compared to 100 mm. The same trend resulted from calculations made by the authors for the heat loads at frozen storage, but the values increased with an average of 76% when compared with cold storage.
By taking into account the auxiliary heat inputs due to doors opening (we considered an average of 4 h/day when products are introduced or extracted from the cold/frozen storage rooms) [
14,
15,
16,
17], respiration heat [
11], air change per day [
16], lightning, evaporator fans, heat emissions from people performing various activities, handling equipment [
18], the total cold required for each cooled space is shown in
Figure 2 and
Figure 3.
The calculated cooling load was increased by 10%, to provide a safety factor for possible discrepancies between the design criteria and actual operation [
19].
By analyzing
Figure 2 and
Figure 3 one could notice that the cooling load required for refrigeration is higher than in the case of frozen storage. The reason is that although the temperature is much lower in frozen storage, in this case products are introduced directly frozen do not imply respiration rates and the intake of fresh air is eliminated.
The study was conducted for a 50% load of vegetables and fruits and a 50% load of meat respectively, in the refrigerated storage. The average heat of respiration for vegetables and fruits was 100 mW/kg product [
11] and the Air Change Factor (ACF) was 4 (storage room/24 h), [
16].
Under these conditions, by using Coolpack Software, Version 1.5 [
20], the following percentage data on the components of the cooling load resulted: 10 ÷ 15% transmission loads, 10 ÷ 20% infiltration loads, 47 ÷ 52% products and other loads (including heat of respiration) 13 ÷ 33%.
Figure 2 and
Figure 3 show that the refrigerating load required to cool the storage spaces decrease with the increase in the insulating layer thickness. The transmission heat transfer dictates the cooling power decreasing trend. The cooling capacity is delivered by a vapor compression system with an air-cooled condenser.
The total amount of energy consumption for cold/frozen storage is calculated by using the following Equation (3).
where:
—total cooling load [kW]; —Refrigeration system’s Energy Efficiency Ratio [–].
The coefficient EER used in calculations is assumed to be
for the refrigeration system in the cold storage as a function of the outside temperature climatic zone and
for frozen storage. The reason for the fact that in the first case the value is found around a certain interval is that it depends on the outside temperature, and implicitly on the climatic zone. Instead, in the second situation, the cooling system used is a Booster refrigeration system type that is not influenced by the outside temperature and that is why we assumed a fixed value. The input data for EER calculations are presented in
Table 3.
The total of the operating hours for the refrigeration system is 20 h/day, 365 days/year corresponding to 10 years lifetime as we considered that for an interval of 4 h daily the products are introduced or extracted from the cold storage and during that time the refrigeration system does not work.
By using the CoolPack Software [
20], the authors simulated the real thermodynamic cycles for each climatic zone working using the input data given by
Table 3.
The electricity cost value available for a day interval between Monday to Friday is given in
Table 4. For weekend the price is fixed at 0.033 EUR/kWh [
21,
22].
The cost of a sandwich panel per unit surface was taken from the price list of the main distributors from the Romanian market and it corresponds to the summer of 2021, and it is presented in
Table 5, [
23,
24].
The annual net energy saving amount for cold/frozen storage when using insulation different to OIT can be calculated as:
where:
—The total cooling cost at an insulation lower than OIT (100 mm for cold storage and 150 mm for frozen storage) [Eur/m2 year];
—The total cooling cost at OIT [Eur/m2 year]
The payback period (PP) is given by:
where:
—is the cost of insulation material [Eur/m2].
One of the objectives of this paper is to determine a SEC value (Specific Energy Consumption) for Romania. SEC value is dependent on the volume of cold/frozen storage. In order to achieve this goal, we used the following formula:
3. Results
OIT corresponding to each climatic zone that was analysed in these two constructive variants; the cold and frozen storages are presented in
Figure 4 and
Figure 5.
The diagrams show the variation curves of investment costs, depending on the insulation thickness, the variation curves of the electricity costs (determined by the heat transfer through building parts with thickness of the insulation), as well as the curves resulting from the sum between the investment and operating costs (i.e., electricity cost). The minimum points represent the optimal value of the OIT. The insulation cost is increasing linearly with the thickness of insulation, while the electricity cost is decreasing.
By analysing
Figure 4 and
Figure 5, it can be noticed that, for cold storage, OIT is 150 mm regardless of the climatic zone, and for frozen storage OIT is similarly 180 mm. Therefore, OIT versus each thickness insulation at different storage temperatures of 0 and −23 °C is inversely proportional to EER. These results were in concordance with [
18,
25,
26].
Although the maximum temperature difference is 9 °C between the 5 climatic zones from Romania, given the fact that the energy efficiency and the electricity costs are different, this leads to the same OIT value.
In the evaluation of the energy consumption for storage spaces, specific indicators were used, such as SEC (Specific Energy Consumption). This term was determined according to the energy consumption/m
3 cooled and year for each type of storage space. The values of this indicator are represented in
Figure 6, which shows a downward trend of the SEC value for cold storage, depending on the climatic zone from Romania. For frozen storage, the deviation is between 0.4… 3.6% compared to the maximum value obtained in Bucharest, which is 75.93 kWh·m
3/yr. For Romania, the average values of the SEC indicator resulting from the calculation are 54.83 kWh·m
3/yr for cold storage and 74.55 kWh·m
3/yr for frozen storage. The average values obtained in this paper were compared with those presented by Evans [
7,
27] and resulted in a deviation of about 1.58% for cold storage and 4.1% for frozen storage, respectively.
The correspondence between the cold storage energy consumption and the storage capacity was also investigated. The energy consumption per unit volume for a cold space at 150 mm thickness insulation was found between 0.0058…0.0075 kW/mc and for frozen storage at 180 mm thickness insulation between 0.01…0.0104 kW/mc respectively.
4. Discussion
The European strategy for reducing energy consumption in buildings sets directions for increasing energy efficiency throughout the life cycle of buildings. The EU is dedicated to developing a sustainable, competitive, safe, and decarbonized energy system to reduce greenhouse gas emissions and save energy in line with existing directions at the Union level [
28].
The main purpose of this paper was to determine the OIT value together with the amount of energy savings when using a PUR panel sandwich for cold storage at 0 °C and frozen storage at −23 °C in different Romanian cities chosen as representatives of the five climate zones. Heat transfer through building parts represented a maximum of 15% from total cooling load for cold storage and 31% for frozen storage, which is higher due to the increase in the temperature difference between and inside air temperature. Therefore, only in the case of cold storage, as a peculiarity for Romania, the main influence in determining the optimal thickness of the insulation layer is that of electricity, the influence of the climate zone being small.
The technical-economic analysis highlights the fact that in Romania, although there are 5 climatic zones, with different maximum average temperatures in summer, this does not cause a difference in OIT values. Subsequently, OIT for cold storage is 150 mm and 180 mm for frozen storage, respectively.
On the one hand, this aspect can be caused by the maximum outside temperatures, which are not extremely different from each other (the maximum temperature difference being of 9 °C). On the other hand, as regards the electrical energy price, this is different in these 5 climatic zones (different energy suppliers). The increase in the investment cost for insulation thicknesses from 100 mm to 150 mm is about 25% and the difference regarding the energy cost is about 13%. The price is higher in climate zones III, IV and V, compared to the climate zones I and II.
The energy saving and payback periods were determined for each one of the five climatic zones. The total cost decreases with insulation thickness, increasing from 0.03 m up to OIT, then it decreases. The choice of an insulation thickness higher than the OIT is not justified, because the energy saved (electricity costs) is not significant. Thus, in the case of cold storage, if it is chosen, an insulation thickness of 180 mm, which is higher than the OIT, the investment cost increases by 41%, and the electricity energy costs decrease by 8.3%. The same trend is registered in the case of frozen storage, if it is chosen, where there is an insulation thickness of 200 mm, higher than the OIT, and the investment cost increases by 20% and the electricity energy costs decrease by 6.7%.
However, most of the time, the investors decide on insulation thicknesses smaller than OIT for the cold storage, which involves lower initial investment costs, accepting higher electricity costs. For example, in the case of cold storage, when adopting an insulation thickness of 120 mm, which is lower than OIT, the investment saving decreases by 21.45%, but the operating costs will increase by about 11%.
If the investors adopt an insulation thickness higher than the OIT (160 mm), the investment costs are higher, but the operating costs are recovered over a longer period. Thus, for the climate zones I and II the payback time is over 6 years and for the other climate zones III, IV and V, they are close to 2 years. It can be generalized that climate zones with higher outside temperatures will have longer payback periods with lower energy savings at 0 °C reference inside temperatures in comparison with colder climates.
In the case of frozen storage, the authors obtained a payback time between 3.8…5.6 years for an insulation thickness of 200 mm higher than the OIT (180 mm).
Taking into account the increasing cost of the electricity in all EU States (in Romania cost increased 3.6 times from August to November 2021), the authors made a simulation by using the method previously presented in order to highlight the impact on the OIT value. By considering all that is stated in the previous paragraph, we noticed an increase in OIT in both the cold/frozen storage. Thus, the OIT value reached 200 mm.
The study has important implications, mainly related to energy efficiency. This research has identified a “result oriented” methodology, permitting the quantification of benefits associated to correctly and appropriately insulate the storage cold rooms. These benefits are both of an economic and an environmental nature and as such, contribute to sustainability, being not only a legal obligation but an opportunity for all stakeholders.
5. Conclusions
The novelty of the study comes from the fact that we determined OIT for each climate zone specific to Romania, considering the specific investment and exploitation costs, which are significantly different to other states in the European Union. There is a need for a correct dimensioning of the thickness of the insulation layer on the way to achieve energy savings in the cold storage market, which is in a continuous development. In the available literature on the topic, OIT was determined for walls made of concrete or brick [
3,
4,
5,
6]. Instead, we determined this parameter for a sandwich panel in our study. The context in which we preferred this approach is in line with current trends to use lightweight modular units that can be built on site in a short time.
Another important contribution is the determination of the SEC value for the climatic conditions in Romania, which is necessary for the global energy assessments found in the national development strategies and which can also be compared with the values related to other countries.


