Article

Techniques for Calculating Software Product Metrics Threshold Values: A Systematic Mapping Study

1
Molde University College—Specialized University in Logistics, Faculty of Logistics, 6410 Molde, Norway
2
Department of Software Engineering, Atilim University, Ankara 06830, Turkey
3
Department of Software Engineering, Jordan University of Science and Technology, Irbid 22110, Jordan
4
Department of Computer Science and Engineering, Qatar University, Doha 2713, Qatar
5
Department of Computer Engineering, Istanbul Kultur University, Istanbul 34158, Turkey
*
Author to whom correspondence should be addressed.
Appl. Sci. 2021, 11(23), 11377; https://doi.org/10.3390/app112311377
Submission received: 12 October 2021 / Revised: 15 November 2021 / Accepted: 22 November 2021 / Published: 1 December 2021
(This article belongs to the Collection Software Engineering: Computer Science and System)

Abstract

:
Several aspects of software product quality can be assessed and measured using product metrics. Without software metric threshold values, it is difficult to evaluate different aspects of quality. To this end, the interest in research studies that focus on identifying and deriving threshold values is growing, given the advantage of applying software metric threshold values to evaluate various software projects during their software development life cycle phases. The aim of this paper is to systematically investigate research on software metric threshold calculation techniques. In this study, electronic databases were systematically searched for relevant papers; 45 publications were selected based on inclusion/exclusion criteria, and research questions were answered. The results demonstrate the following important characteristics of studies: (a) both empirical and theoretical studies were conducted, a majority of which depends on empirical analysis; (b) the majority of papers apply statistical techniques to derive object-oriented metrics threshold values; (c) Chidamber and Kemerer (CK) metrics were studied in most of the papers, and are widely used to assess the quality of software systems; and (d) there is a considerable number of studies that have not validated metric threshold values in terms of quality attributes. From both the academic and practitioner points of view, the results of this review present a catalog and body of knowledge on metric threshold calculation techniques. The results set new research directions, such as conducting mixed studies on statistical and quality-related studies, studying an extensive number of metrics and studying interactions among metrics, studying more quality attributes, and considering multivariate threshold derivation.

1. Introduction

Software engineering aims to determine and advance the quality of software throughout the software development life cycle. For achieving this aim, software metrics are applied to consider the qualitative aspects of software components quantitatively [1]. Arar and Ayan [1] observed that software metrics can measure software from different perspectives, but embody the internal quality of software systems. Software metrics without threshold values do not help much to evaluate the quality of software components [2]. In order to tackle this problem, it is crucial that dependable threshold values be selected [3]. The application of metrics encompasses thresholds to ascertain if a specific value is acceptable or abnormal and, thus, provides denotation to metrics, enabling them to become a decision-making device pre- and post-software release [4]. However, determining appropriate threshold values is a rigorous task as thresholds attained by achieving a correlation analysis are only for a defined group of identical software systems [5]. This is further supported by Zhang et al. [6], who note that thresholds cannot be inferred and depend on distinct domains. Arar and Ayan [1] observed that process of defining a threshold is built on benchmark data related to views and that data should be analyzed statistically. Alves et al. [7] and Sanchez-Gonzalez et al. [8] pointed out that this process should be repeatable and clear. Beranic and Hericko [3] concluded that thresholds are critical for software metric analyses and, hence, they are important in practice [2]. Beranic and Hericko [3] stressed that software metric threshold calculation is a significant research topic, and for this reason, the present study is an attempt to further this research direction. Ferreira et al. [2] stated that a lack of knowledge on metric threshold values constrains the wide use of software metrics, and several metrics are very useful to improve software design. Lanza and Marinescu [9] also recommended focusing on the calculation of metrics to be able to use them in practice. The sources, namely statistical information and widely accepted knowledge, are given in their article.
Over the last decade, the object-oriented programming paradigm and systems based on this paradigm have been used in the software industry to build efficient, effective, and scalable systems. Object-oriented metrics were proposed in the early 1990s and are widely used by researchers to design better software systems [10]; however, it is difficult to evaluate the qualities of software based on a single value. Therefore, threshold values are vital to have a generic view of different software applications. An appropriate threshold value is an orientation for the developer in the task of maintenance, testing, and evolution. Ferreira et al. [2] calculated some threshold values for object-oriented metrics based on several characteristics of software and reported that these threshold values are valid for object-oriented systems. They further observed that recommended thresholds could help to identify problematic classes, which do not follow design principles, and metric threshold values can help for this purpose. However, a threshold value might be affected by several factors, such as organization, programmer experience, language, and development tools [11]. Several studies have been conducted to conclude the threshold values for different types of metrics, such as Chidamber and Kemerer (CK) metrics [10]. These threshold values have been applied to evaluate various software projects.
Although several threshold calculation methods exist in the literature, there is no systematic mapping study on threshold calculation methods. In this paper, we focus on object-oriented metrics. Systematic mapping is one of the main mechanisms of evidence-based software engineering [12], which helps to categorize research papers within a field. Metric threshold values help in maintainability prediction, quality assessment, vulnerability prediction, and fault prediction [13,14,15,16,17]. Arar and Ayan [1] reported that compared to the immense interest in software fault-prediction studies, there are fewer metric threshold derivation studies. Boucher and Badri [18] suggested that non-supervised fault-proneness prediction models, notably thresholds-based models, can efficiently be automated and provide valuable insights to developers and testers. Therefore, this study can contribute to novel research perspectives about this area. In essence, a systematic mapping study in this area is timely because the knowledge of threshold calculation methods is growing rapidly. Not only academics, but also practitioners in the software market, can benefit from this study and identify the available methods to implement as a utility within products. To have an illustration of the existing research, a systematic mapping study of object-oriented metrics and their threshold values is discussed in this paper.
The following sections are structured as follows. Section 2 provides an analysis of the object-oriented metrics and previous studies in this field. Section 3 explains the systematic mapping study. Section 4 shows the results. Section 5 provides a discussion of the results. Section 6 shows the limitations. Finally, Section 7 concludes the paper.

2. Background and Related Work

To better understand the rest of the paper, this section contributes a brief backdrop on the concept of object-oriented metrics and their threshold values. Furthermore, since the present work is a secondary study, a brief review of other secondary studies in software metrics is provided. These recent studies show that this area is an active field of research interest among software engineering researchers. Therefore, our study advances these two earlier studies in terms of rigor of analysis, digital libraries, and research questions.

2.1. Object-Oriented Metrics

Software metrics are measures of software development processes and the quality of the produced software. The current software metrics have been classified into traditional and object-oriented metrics [19]. This paper focuses on object-oriented metrics. A significant number of these metrics are suggested in the literature. For example, there are CK metrics proposed by Chidamber and Kemerer [10], Li’s metrics [20], and Lorenz and Kidd’s metrics [4]. Among these, the CK metrics are the most frequently used.
Chidamber and Kemerer (CK) are the researchers who defined the CK metric suite, which includes the following six metrics: Number of Children (NOC), Depth of Inheritance Tree (DIT), Coupling Between Objects (CBO), Weighted Methods per Class (WMC), Lack of Cohesion in Methods (LCOM), and Response for a Class (RFC). The purpose of this metric suite is to measure the complexity of object-oriented software. Li [21] proposed another metric suite for object-oriented software; it includes six metrics: Number of Ancestor Classes (NAC), Class Method Complexity (CMC), Number of Local Methods (NLM), Number of Descendent Classes (NDC), Coupling Through Message Passing (CTM), and Coupling Through Abstract Data Type (CTA). Lorenz and Kidd [4] defined a metric suite consisting of eleven metrics to calculate the static aspects of software design. These metrics were classified into three groups, namely, class size (Number of Public Methods (NPM), Number of Methods (NM), Number of Public Variables (NPV), Number of Variables per Class (NV), Number of Class Variables (NCV), Number of Class Methods (NCM)), class inheritance (Number of Methods Inherited (NMI), Number of Methods Overridden (NMO), and Number of New Methods (NNA)), and class internal (Average Parameters per Method (APM) and Specialization Index (SIX)).

2.2. Object-Oriented Metrics Thresholds

Despite the importance of object-oriented metrics in software engineering, they have not been adequately applied in the software industry [2,22,23]. The reason is that the thresholds of a majority of metrics are not identified. The thresholds are described as “heuristic values used to set ranges of desirable and undesirable metric values for measured software” [4]. Identifying these values is crucial because they allow the metrics to be applied to evaluate quality issues in software. Furthermore, without the insight of these thresholds, one cannot comment on questions such as “which class has the largest number of methods?” or “which method has a large number of parameters?” [24].
In recent years, several studies have been performed to derive the threshold values of object-oriented metrics. These studies use different methods to determine threshold values for various metrics categories. Shatnawi used log transformation to derive threshold values for CK metrics [25], alternatively, Malhotra and Bansal [26] used a statistical model derived from logistic regression to identify the thresholds of CK metrics. These two studies are only two examples of a large number of research papers that will be analyzed and classified in the present study.

2.3. Related Work

There have been some secondary studies in the area of software metrics. Beranic and Hericko [3] presented a preliminary review on approaches for software metrics threshold derivation from 14 primary studies. According to their observations, the majority of the studies presented new ways and generally applied statistical techniques for threshold derivation. In addition, they selected a programming language, for which the metrics are derived (i.e., Java, C, C++, and C#). They answered four research questions related to approaches and methods used for software metrics threshold derivation, as well as the objective of threshold derivation for which software metrics thresholds are derived, and finally the available tools for metric collection and threshold derivation. In another study, Ronchieri and Canapro [27] provided a preliminary mapping study of software metrics thresholds, which was limited to the Scopus database and two research queries: which papers are currently most important in the software metrics threshold research community, and whether software metrics threshold papers can be meaningfully aggregated. Thus, this study was the first attempt, but its scope was very limited in terms of topic and venue of publications (i.e., journals and conferences). Kitchenham conducted a preliminary mapping study of software metrics research to identify influential software metrics research published between 2000–2005. In addition, the authors aimed to investigate the possibility of using secondary studies for integrating the research results [28].
Tahir and MacDonell [29] published a systematic mapping study of research on dynamic metrics. They identified and evaluated 60 papers, which were classified based on three different aspects: research focus, research type, and research contribution. Vanitha and ThirumalaiSelvi [30] performed a literature review to identify and analyze the metrics for some quality factors. In addition, their review aimed to provide a general overview of the software metrics to guide researchers in identifying which metrics can be applied to assess different software quality attributes. Despite their contributions to the field, none of these studies focused on object-oriented metrics, nor did they pay attention to identifying the threshold values.

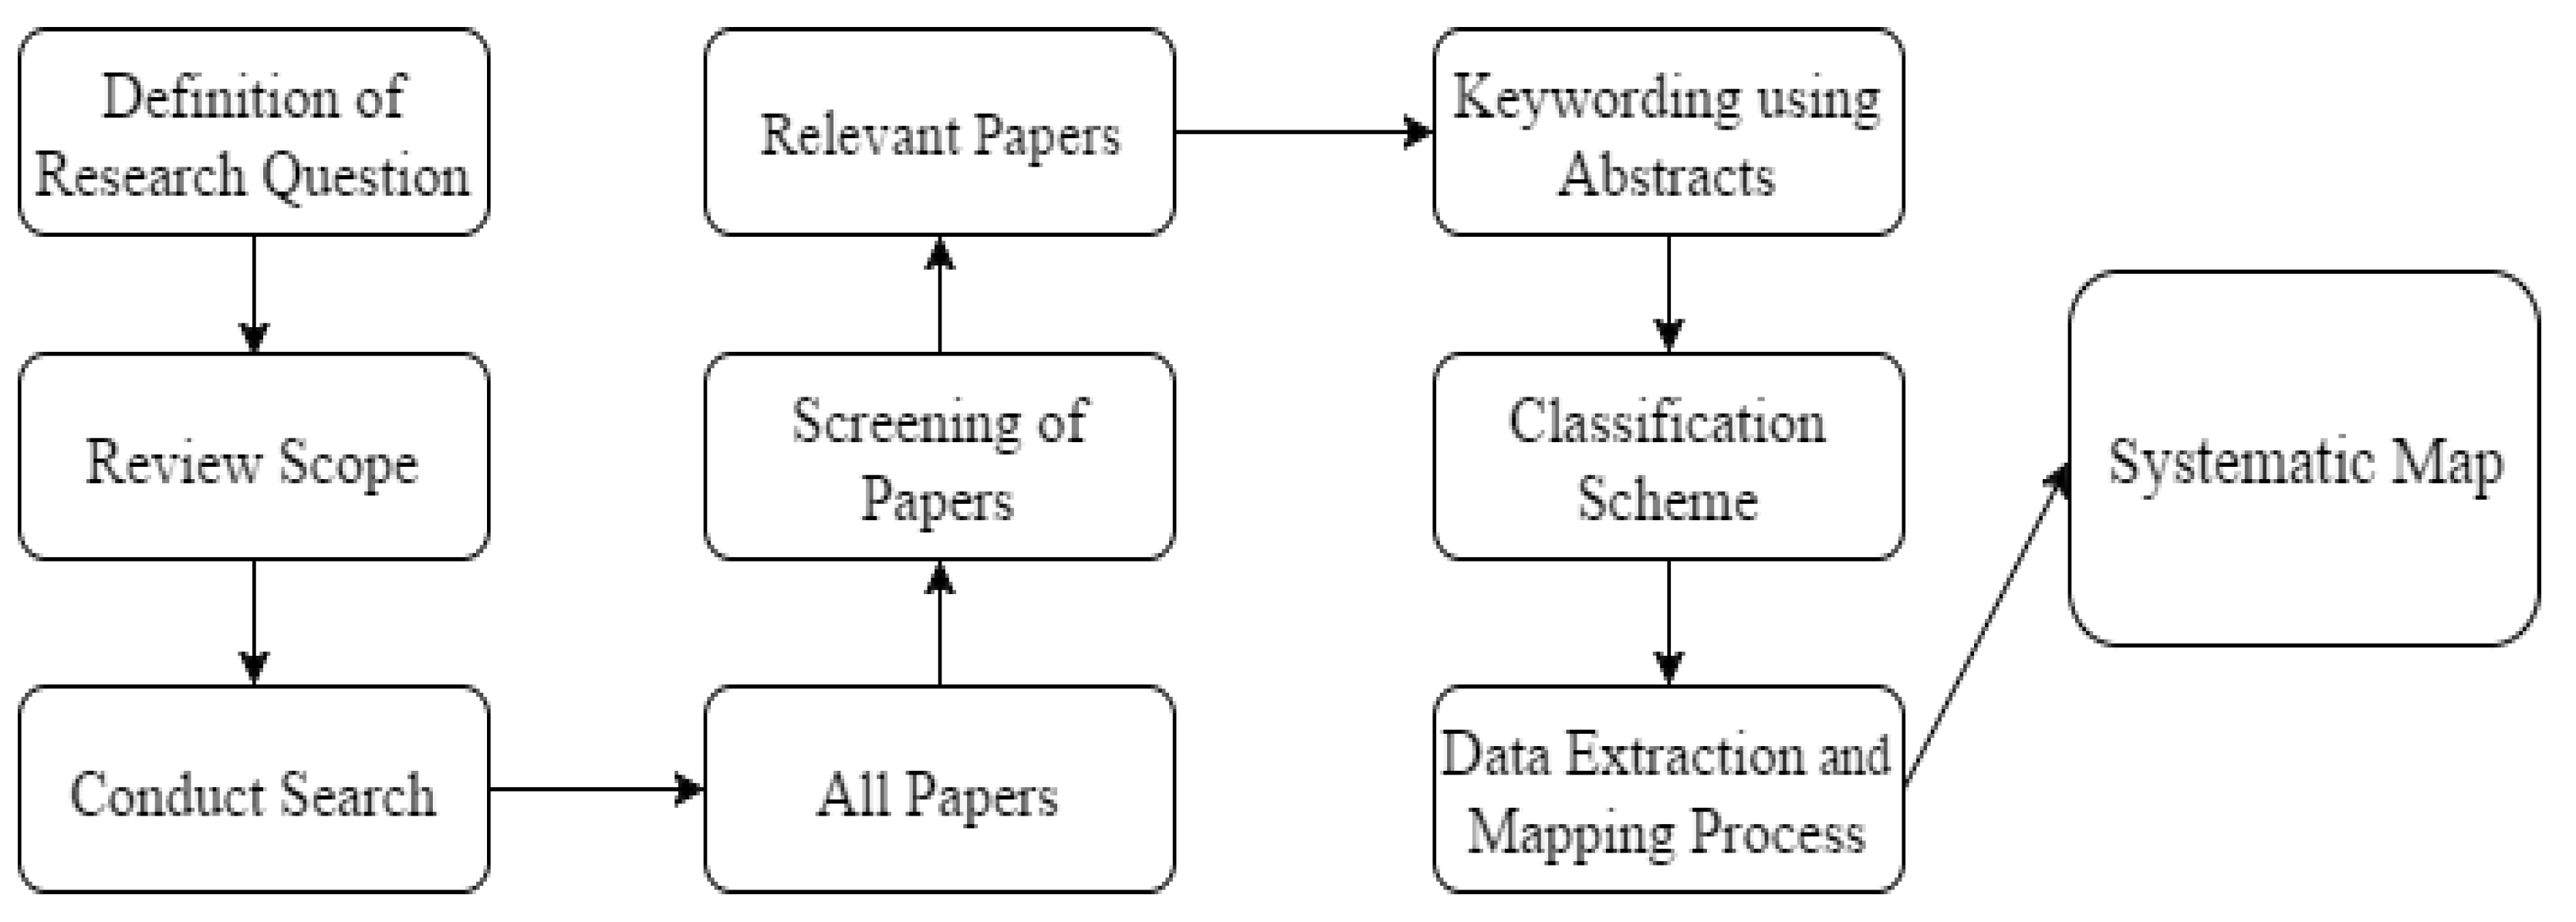
3. Systematic Mapping Process

Systematic mapping studies are applied to structure a research area and to provide a classification (i.e., structure) of the type and results of articles that have been published by classifying them. The main process steps of this systematic mapping research are to include the research questions, conducting the search for relevant papers, screening of papers, keywording of abstracts, data extraction, and mapping [31]. Figure 1 illustrates the steps of a systematic mapping study. In this article, systematic mapping is applied to software quality in studies that focus on threshold values of object-oriented metrics.

3.1. Definitions of Research Questions

The main objective of the present systematic mapping study is to understand, clarify, and identify threshold values of object-oriented metrics that were most used and published in relevant papers. According to the area and the application of object-oriented metrics, the research questions are formulated in Table 1.

3.2. Search Strategy

Based on the current trend in software metrics, we extracted some keywords to query the primary study. The essential keywords were initially identified as “thresholds value”, “object-oriented metrics”, and “software metrics”. To build search strings, we used different combinations of keywords with potential synonyms and required logical operations. The resulting search strings were: “Threshold values” AND (“Object-Oriented metrics” OR “Object-Oriented measurements” OR “Software metrics”), (“Threshold values of object-oriented metrics”). These search strings were applied in five digital libraries, namely IEEE Xplore (Institute of Electrical and Electronics Engineers), Science Direct, Springer, Wiley, and ACM. Papers published in the last 20 years were included.

3.3. Screening

In this phase, we focused on the title, abstract, keywords. However, in some papers, the entire text had to be read. After finishing this step, a set of inclusion/exclusion criteria was applied to select the relevant papers. The third column of Table 2 reports articles that are initially selected. Table 3 indicates the selection criteria for articles; these are mainly inclusion and exclusion criteria to select or reject any article for our study. Papers were included if:
  • They mention the object-oriented metrics and thresholds in the title, abstract, or keywords;
  • The threshold values are the main topic in the study; and
  • They provide approaches and applications to calculate the threshold values.
Papers were excluded if:
  • They do not identify threshold values of object-oriented metrics;
  • They explain object-oriented metrics without focusing on thresholds; and
  • They are duplicate papers.
Certain contradictory papers were examined by two members of the team to make a better decision whether to include or exclude them. After the screening phase, the number of papers was reduced to 45 for final inclusion in this mapping study.

3.4. Classification Scheme

The papers were classified based on the general expert knowledge (i.e., attributes) and specific information extracted during the screening phase. We defined twelve classification attributes. The last column of Table 2 represents the number of final studies that were selected. The following information was recorded for each study as general properties:
  • Paper title sorted from A to Z.
  • Year, when the paper was published.
  • Author.
  • Publication type (e.g., conference, journal, workshop).
In addition to the classification of research works, this study also addresses the following issues in detail:
  • Threshold calculation methods: to determine calculation methods used in each paper.
  • The quality attributes for threshold calculation methods: to determine the quality attributes for threshold calculation methods.
  • Metrics categories used: to identify which metrics sets are used in research papers.
  • The most relevant and least relevant metrics: to list relevant and irrelevant metrics to the method that was used in the studies.
  • The types of projects used in the studies.

3.5. Extraction

The real mapping of relevant papers to categories of the classification scheme is executed during this phase. An excel sheet was used to document the data extraction process based on the attributes provided in the classification scheme. When the reviewers filled in the data of a paper into the scheme, they provided a short rationale why the paper should be in a certain category (e.g., why the paper has been considered to be an empirical approach). From the final table, the frequencies of publications in each category could be calculated.

3.6. Final Pool of Research Studies

After the primary search and the analysis to exclude unrelated works, the pool of the selected papers was finalized to 45 studies as listed in Appendix A. The classification of the selected publications according to the classification scheme is described in Section 3.4.
We present the annual trend of the included studies and the number of studies according to the publication type. Figure 2 shows the annual trend of publications included in our mapping study. We can observe that the earliest research paper was published in 2000. Figure 3 shows the number of research studies based on the publication type (e.g., conference, journal, workshop). We can observe that most of the studies were published in conferences (45%), and the fewest have appeared in workshops, book chapters, and thesis (2%).
Table 4 shows the evaluation phases and the corresponding scope.

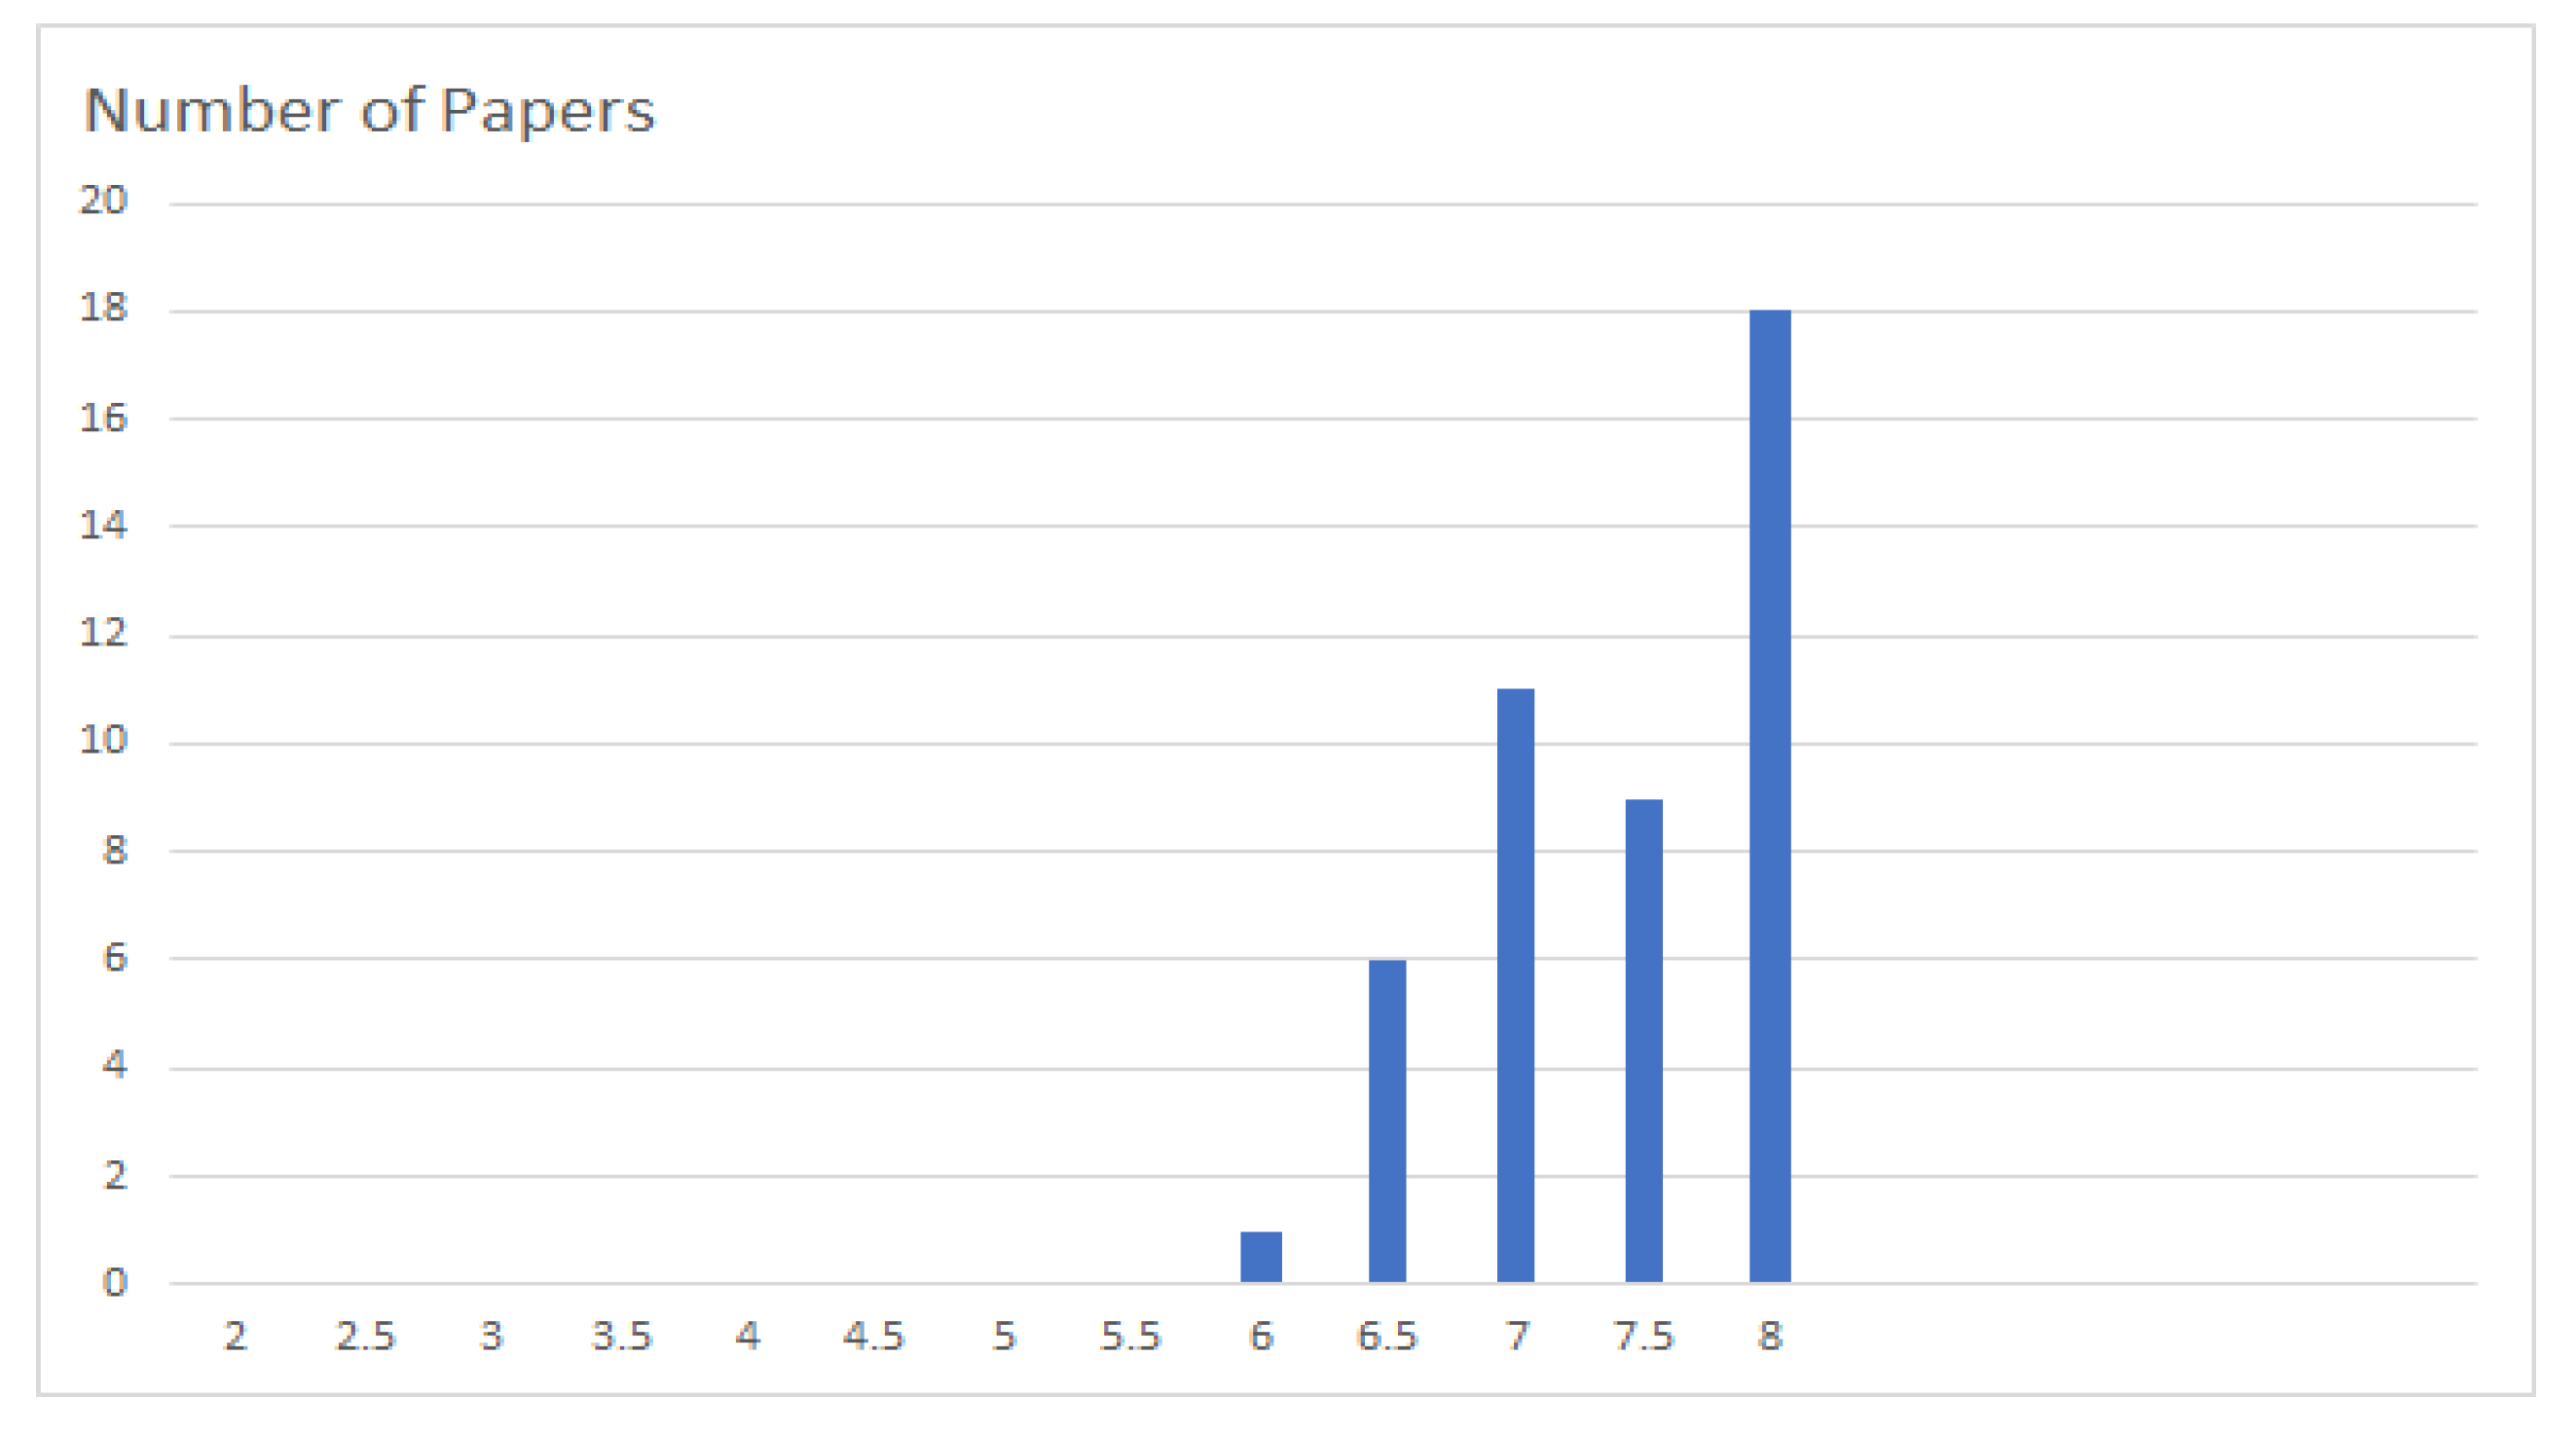
3.7. Quality Assessment

After primary papers were selected based on the study selection criteria, we performed a quality assessment for the selected studies. We used eight quality criteria derived from Kitchenham et al. [6] and another SLR study [32]. Each quality assessment question was answered based on the following options: yes = 1, no = 0, somewhat = 0.5. If the total score of the paper received was less than or equal to 4, it was excluded from the list because the quality threshold was set to a value of 4. All authors were involved in the quality assessment. When there was a conflict about the scoring per paper, an additional meeting was held. Figure 4 shows the quality distribution of selected papers. Details of the quality assessment are provided in Table A2 in Appendix B.
The quality criteria are listed as follows:
  • Q1: Are the aims of the study clearly stated?
  • Q2: Are the scope and experimental design of the study defined clearly?
  • Q3: Are the variables in the study likely to be valid and reliable?
  • Q4: Is the research process documented adequately?
  • Q5: Are all the study questions answered?
  • Q6: Are the negative findings presented?
  • Q7: Are the main findings regarding creditability, validity, and reliability stated?
  • Q8: Do the conclusions relate to the aim of the purpose of the study?

4. Systematic Mapping Process

The results are shown in this section, and each research question is answered in each subsection.

4.1. Q1 What Kind of Threshold Calculation Methods Exist in the Literature?

In these studies, a variety of threshold calculation methods have been used. We categorized papers into the following categories: programmer experience, statistical properties, quality-related, and review studies, as shown in Table 5.
Programmer experience: The proposed survivability model by Sodiya et al. [33] is for object-oriented design, which is aimed to fix the problem of software degradation caused by increasing growth in classes and methods. They proposed a model based on the code rejuvenation technique triggered by a threshold value. Li and Shatnawi [34] found a positive correlation between source code and bad smells that were identified using programmers’ thresholds. Bad smells are considered patterns associated with bad programming practices and bad design decisions. Alan and Catal [35] presented an outlier detection algorithm using object-oriented metrics thresholds. In another paper by Suresh et al. [36], the numerical thresholds have been specified for every metric, as given by Rosenberg and Stapko [37]. Catal et al. [13] applied clustering algorithms and metrics threshold values for the software fault prediction problem.
Statistical properties: Vale et al. [38] compared three methods from Alves et al. [7], Ferreira et al. [2], and Oliveria et al. [39] to calculate thresholds for software product lines. Paper [25] aimed to provide a technique to calculate thresholds in the SPL (software product line). The proposed method relies on data analysis and considers the statistical properties of the metrics. Herbold et al. [11] defined a data-driven methodology to calculate thresholds. They calculated thresholds using machine learning by dividing the dataset into training set (50%), selection set (25%), and evaluation set (25%). They proposed an algorithm called rectangle learning for calculating the thresholds. Alves et al. [7] designed a method that defines the thresholds of metrics from measurement data with respect to the statistical properties of the metric. Shatnawi [25] used log transformation for metrics thresholds calculation. In this study, all metric data are transformed into a natural log. After that, they are used to calculate the mean and standard deviation to derive thresholds. A statistical model derived from logistic regression (LR) was used in the paper [40] to calculate the OO threshold values. Ferreira et al. [2] derived the thresholds based on a statistical analysis of the data and commonly used values of thresholds in practice. In their paper of Singh and Kahlon [41], the logistic regression model was used to derive the metrics threshold value for the identification of bad smells. Benlarbi et al. [42] presented a statistical technique for calculating and evaluating thresholds of object-oriented metrics. In the paper of Lavazza and Morasca [43], the authors used three distribution-based statistical methods, namely adapted distribution-based (ADB), Alves et al. [7], and Vale et al. [38]. Shatnawi et al.’s [17] method selects the threshold value, which has the maximum value for sensitivity and specificity as the threshold value. However, Catal et al. [44] chose the threshold value, which maximizes the area under the ROC curve, and passes from the following three points, namely (0, 0), (1, 1), and (PD, PF). The reason is that there might not always exist a threshold value that maximizes sensitivity and specificity. The other researchers, in their work (Bansiya and Davis, [45]; Martin, [46]; Tang et al., [47]; Henderson-Sellers, [48]), used the statistical properties of metrics to derive thresholds from a large corpus of systems. Lochmann [49] applied the benchmarking approach of Lanza and Marinescu [9] to determine thresholds. Veado et al. [50] implemented a threshold calculation tool based on the Alves et al.’s approach [7], Ferreira et al. [2], Olivria et al. [22,39], and Vale et al. [38] method. In Oliveira et al.’s [22] paper, the authors suggested the concept of the relative threshold to evaluate metrics that follow heavy-tailed distributions.
Quality related: The survivability approach was proposed in [26] for object-oriented systems for solving the problem of software degradation commonly caused by increasing growth in classes and methods. In [17], the threshold values of the metrics were used to detect code bad smells. These thresholds were presented in Gronback [51]. Al Dallal applied a significance threshold (a = 0.05) for four studies of object-oriented metrics, namely [24,52,53]. This threshold is used to understand if a metric is a significant fault predictor. The data-driven method was suggested by Fontana et al. [14], which is repeatable and transparent, and enables the extraction of thresholds. This method is also based on the metric’s statistical distribution. Threshold values are derived for five different bad smells; for example, WMC has separate thresholds for the God class and data class. Moreover, the receiver operating characteristic (ROC) curve is a technique that has been used for the first time to identify object-oriented metric threshold values in work [17]. Oliveira et al. [39] presented a tool to calculate relative thresholds using measurement data. Arar and Ayan [1] proposed a hybrid model that uses Shatnawi et al. [17] and Bender’s [54] approach. Hussain et al. [55] used Bender’s [54] approach to detect object-oriented threshold values. Catal et al. [44] proposed a new threshold calculation by modifying Shatnawi’s threshold method [25]. Shatnawi and Althebyan [56] proposed a statistical power-law distribution to calculate threshold values. In work by Singh and Kahlon [41], Shatnawi et al.’s [17] method, which is based on ROC analysis, was applied to calculate matrix threshold values. Bender [54] derived thresholds for change-proneness using the ROC technique. In the paper of Malhotra et al. [15], threshold values obtained by Shatnawi et al. [17] were used as-is.
Review study: Beranic and Hericko [3] performed a review study and showed the importance of software metrics in software engineering. Ronchieri and Canapro [27] provided a preliminary mapping study of software metric thresholds calculation papers based on the Scopus database.
The review of the selected papers has found a taxonomy of three types of research in threshold calculation as shown in Table 5. The taxonomy is based on the evolution of threshold studies. In early works, researchers considered metrics as simple measures of quality and therefore, researchers proposed thresholds based on their experience. However, thresholds were not proved to have any link with quality. A set of studies started to link thresholds to quality attributes such as fault-proneness and change-proneness. These studies although found the link could not report consistent thresholds among different systems. The researchers have proposed to find thresholds from a large corpus of systems. The linkage of thresholds with a quality attribute is limited by the number of systems that report bug data. The use of prediction models was deemed complex and time-consuming on a large corpus of systems. To resolve such complexity, statistical properties of metrics were proposed to find thresholds from the corpus of systems. Therefore, finding thresholds from a corpus depends on statistical properties.

4.2. Q2 What Are the Quality Attributes for Threshold Calculation Methods?

There are different quality attributes of threshold calculation methods that have been addressed in the research studies. As shown in Table 6, we divided them into five categories: fault detection, bad smells detection, reuse-proneness, other design problems, and none when no quality attribute was targeted.
The method suggested by Vale et al. [38] has various applications, including fault prediction and bad smell detection. Software system design, maintenance, and testing are the quality attributes for the object-oriented metrics that appeared in the paper of Shatnawi [62], which proposes a method based on the regression models. Li and Shatnawi [17] studied the evolutionary design process. Furthermore, they investigated the relationships between bad smells and class-error probability. Alan and Catal [35] provided an outlier detection algorithm used to improve the performance of fault predictors in the software engineering domain. The application domains for the threshold calculation method in the paper by Fontana et al. [14] are software quality and maintainability assessments, and they are especially useful for code smell detection rules. The scope of the paper by Herbold et al. [11] can determine the source of code discrepancies.
Al Dallal et al. (2010) introduced a new cohesion metric (SCC) for software. These metrics let early design artifacts be evaluated at early phases. Moreover, in another research article, [52], Al Dallal proposed a model to predict classes that require the Extract Subclass Refactoring (ESR) and presents these classes for improvement. In 2011, this author published two papers [24,53]. In the first one, he defined the values of cohesion metrics, which considerably improved the detection of fault-prone classes. Furthermore, in the second paper, he extended the definition of the lack of cohesion (LCOM) metric as transitive LCOM (TLCOM), which improves its quality in predicting faulty class and in indicating class cohesion. As industrial applications, the thresholds derived with the method in the paper by Alves et al. [7], have been successfully utilized for software analysis, benchmarking, and certification.
Shatnawi [25] proposed an approach using log transformation to reduce data skewness. Log transformation has affected how metrics are used in reviewing software quality, such as threshold derivation and fault prediction. In another research, Shatnawi et al. [17] identified threshold values of CK metrics, which classify classes into several risk levels. Suresh et al. [36] analyzed a subset of object-oriented metrics as well as traditional metrics to compute system reliability and complexity for real-life applications. Prediction of fault-prone classes based on object-oriented metrics threshold values in earlier phases of the software development life cycle was the subject of study by Malhotra and Bansal [26]. This early prediction helps developers to allocate necessary resources accordingly.
Ferreira et al. [2] suggested some threshold values that determine the problematic classes with respect to design flaws. The work in [41] derives a threshold metrics value against the bad smell using risk analysis at five different levels. The authors in [39] and their tool (RTOOL) presented a way to calculate the metrics thresholds. Benlarbi et al. [42] specify that the test theory is useful to predict fault and the effect of OO measures and show the principles in dealing with metrics.
Lavazza and Morasca [43] showed that thresholds according to distribution-based techniques are not practical in identifying fault-prone components. Vale et al. [38] defined metrics thresholds values to detect God classes in software product lines. Arar and Ayan [1], Hussain et al. [55], and Shatnawi and Althebyan [56] derived metrics thresholds for predicting faults on Eclipse projects. Catal et al. [44] used threshold values to identify noisy modules in software fault prediction datasets. Singh and Kahlon [41] aimed to predict faulty classes. Prioritization of classes for refactoring was targeted in the paper by Malhotra et al. [15]. Lochmann’s [49] research was prioritized on quality assessment. Veado et al. [50] proposed a practical tool to measure threshold values in software projects. Oliveira et al. [22,39] aimed to control and monitor technical depth.
Malhotra and Bansal [40] have replicated the derivation of thresholds using ROC curves on the change-proneness of modules. The derivation and validation of thresholds were confirmed on five versions of the Android operating system. Filo et al. [58] used a cumulative relative frequency graph to identify thresholds. The technique was validated on the detection of large classes (one of the code bad smells). Stojkovski [23] selected the mean as the threshold value if the distribution is normal; otherwise, percentiles (70% and 90%) were used to select thresholds of the large corpus of Android applications. Vale et al. [63] proposed a benchmark-based threshold identification technique from a large corpus of systems. The authors identified thresholds at different risk assessment levels (i.e., very low, low, moderate, high, and very high). Thresholds were used to detect two bad smells (i.e., large classes and lazy classes). Mori et al. [60] have derived thresholds from a large benchmark composed of more than 3000 systems. The study derives thresholds by choosing the top ranks, 90%, and 95 modules as problematic. The problematic modules were considered as bad smells. Boucher and Badri [64] replicated the use of ROC curves, VARL, and Alves rankings. The authors compared the performance of these techniques in detecting faults in twelve open-source systems. The results have shown that the ROC curve outperforms all others in fault detection. Table 6 summarizes the studies into quality attributes. As shown in Table 6, fault detection was the most studied quality attribute.

4.3. Q3 Which Metrics Combinations Have Been Used?

In research papers collected in this study, there are various categories of metrics proposed to evaluate the software systems. Paper [25] uses four different metrics that belong to CK metrics and other traditional metrics. These metrics capture different attributes, i.e., size, coupling, complexity, and refinement. In addition, papers [16,23,24,26,36,49,57,58,60,61,63,65,66] utilized CK metrics for analysis and measures and identified threshold values for these metrics. The McCabe complexity metrics were applied in papers [7,18,26,41,63]. The work in [17] applied six of the bad smells identified by using a metrics model proposed by Gronback [51].
Al Dallal [24,35,53], focuses on cohesion metrics. Moreover, he used more than one category in another study [52]: the existing size, cohesion, and coupling metrics. Paper [14] applied cohesion and complexity metrics, which contain a code smell metrics set.
In [11], metrics for maintainability and classes were identified. CK metrics have been used in paper [25]. In addition, the CK metrics suite has been used to compute system reliability in another research paper [36]. In addition, this paper used Martin’s metrics suite and traditional metrics such as cyclomatic complexity to compute software complexity. Because CK metrics address several aspects of software design, Malhotra et al. [26] used them as independent variables. Apart from the CK metrics suite, “lines of code” (LOC) is used to measure size because that is the most common metric for this purpose. Shatnawi et al. [17] used 12 metrics from different categories, including CK metrics, Li’s metrics [20], and Lorenz and Kidd’s [4] metrics. These metrics are categorized as inheritance, coupling, cohesion, polymorphism, class-size metrics, and class complexity. Six of the object-oriented software metrics have been studied in their research paper [2]. Paper [41] selected a set of metrics, characterized as Inheritance, Coupling, Class Complexity, Cohesion, Class Size, Information hiding, and Encapsulation. Heavy-tailed distribution metrics were used in [39], which illustrated a specific tool called RTTOOL for relative thresholds.
References [1,43] used additional metrics from QMOOD [58], Tang [63] metrics, Stojkovski [23] metrics, and McCabe metric suits. Arar et al. also investigated Henderson-Sellers metrics. Hussain et al. [55] used metrics QMOOD metrics [15] and Stojkovski [23] metrics. Catal et al. [44] used additional metrics from the Halstead [44] approach. In the paper of Singh and Kahlon [41], coupling and cohesion metrics [61], and Li and Henry [21] metrics were applied. Lochmann [49] used static code checkers’ rules as metrics.
Research studies in threshold opt to find a link between metrics and software quality attributes. Researchers validate metrics to find this link in two scenarios, individually and in combination. However, the combination of metrics has always been found to be better in predicting quality and therefore, the researchers have validated the use of many combinations to find the least number of metrics that provide the best prediction performance. The CK metrics are one of the best combinations of metrics to predict quality. The research on thresholds is a replication of studies on fault prediction and therefore, researchers select a combination of metrics to validate their methodology of threshold calculation. The CK metrics were the most metrics reported in the quality prediction fields and therefore, this should reflect on threshold studies. This question reports the most reported combination of metrics. The number of metrics used in research is very large and therefore, it is difficult to report each metric individually, considering that some metrics have variations. Therefore, we have reported in Table 7 a summary of metrics combinations based on the use of CK metrics.

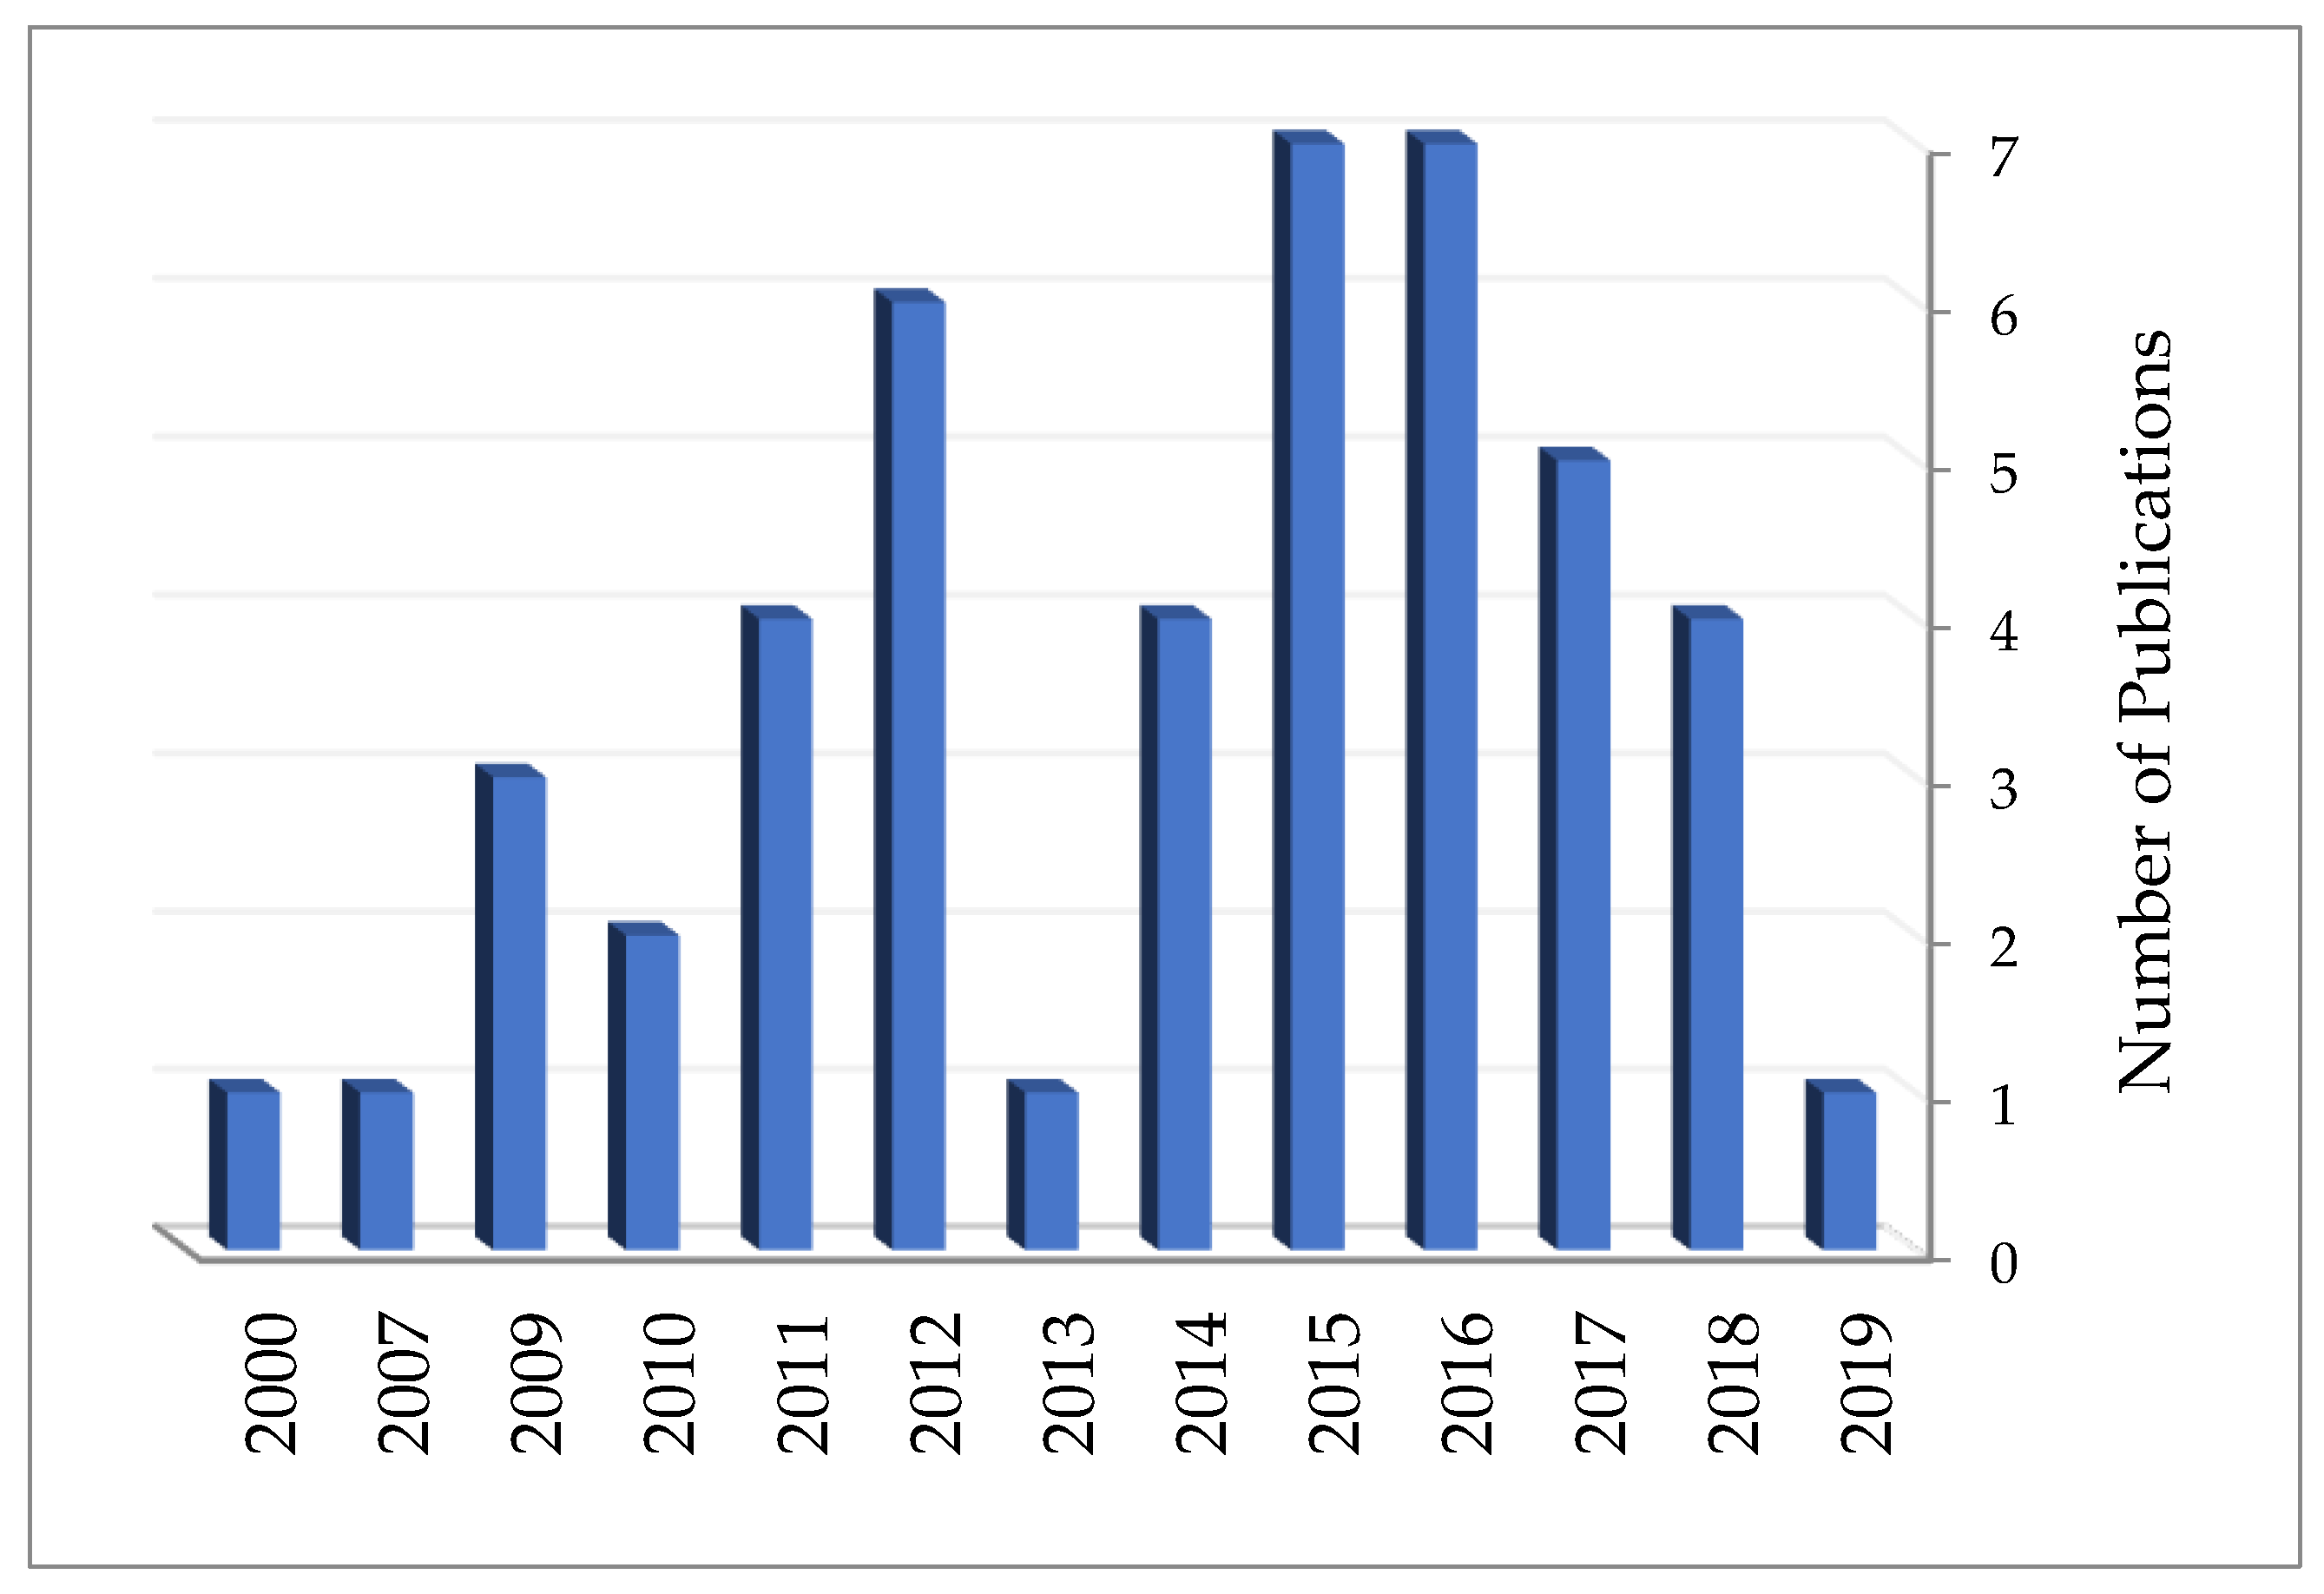
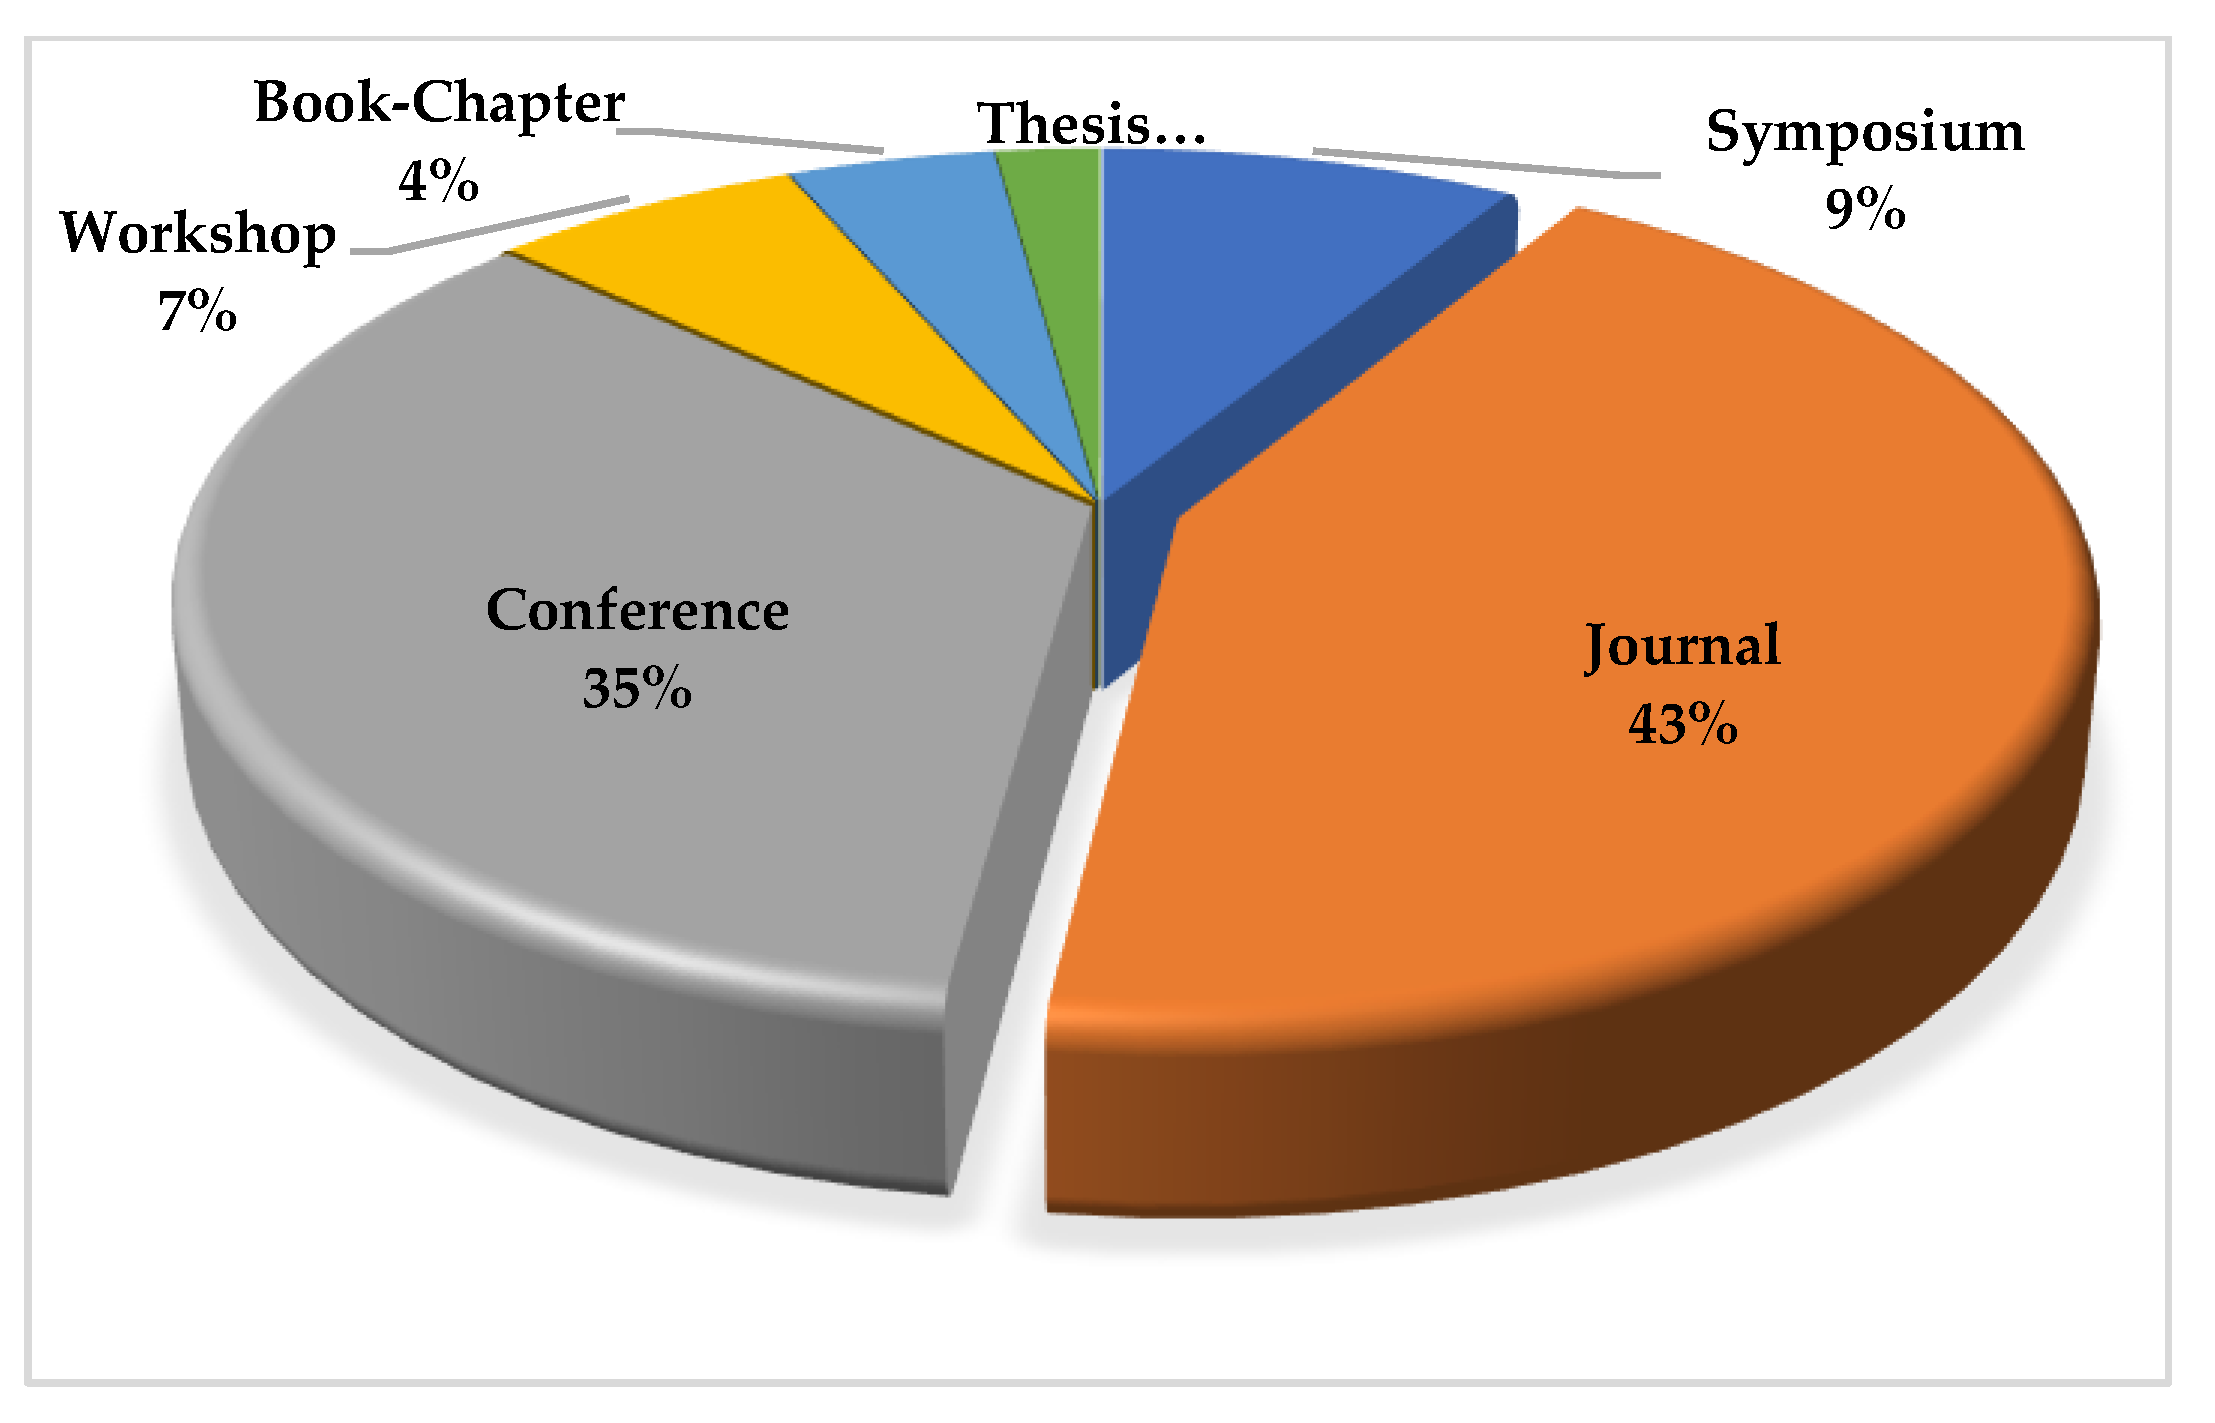
4.4. Q4 What Are the Types of Studies?

We observed that not all studies are empirical. Some researchers identified thresholds based on experience. For example, McCabe has identified thresholds based on experience. Empirical studies evaluate existing thresholds or methods for its calculation, while theoretical studies explain and review issues related to software engineering and any form of software metrics thresholds. There are other researchers such as Malhotra and Bansal [40] who studied thresholds of CK and other metrics in predicting the change-proneness of code. Filó et al. [58] studied the use of the CK and size metrics thresholds in code bad smell detection. Stojkovski [23] derived thresholds for only five metrics (NOM, RFC, CBO, NOC, DIT), four of which are from the CK suite. Vale et al. [63] derived and validated the metrics (i.e., LOC, CBO, WMC, NCR) on the detection of bad smells. In the work of [18,60], thresholds of the CK and LOC metrics were also derived and validated for bad smell and fault detection.
According to the nature of object-oriented metrics and depending on measures and practical methods, major papers in this study are empirical studies. There are also papers that are theoretical and reviews in nature, while others include both empirical and theoretical content. Table 8 shows a categorization of the paper types into empirical, both empirical and theoretical, and theoretical and review. Due to the space limitation, we did not present all the papers based on these categories and aimed to show the available categories.

4.5. Q5 What Are the Correlated Metrics with Tested Quality, and Which of Them Are Uncorrelated?

This question is answered for the most closely connected or appropriate metrics to each model or algorithm provided in the papers. The metrics are correlated if questions are answered based on these metrics. The relevant and irrelevant metrics are illustrated in Table A3 in Appendix C. All studies included one or more of the many software metrics that were proposed and validated in the literature. For example, the CK metrics have been studied in many research papers.

5. Discussion

  • Q1 (Type of threshold calculation methods):
Studies of thresholds were categorized into four groups: programmer experience, statistical properties, quality-related, and review study. Considering the result of this question implies that the most common approach applied to identify the threshold values for object-oriented metrics is statistical analysis [7,43,59]. Additionally, log transformation and receiver operating characteristic (ROC) curves are two other methods used in some other studies [17,44]. The number of studies that use pure statistical techniques to derive threshold is the largest among all studies (i.e., 22 studies). In addition, quality-related studies were conducted in many papers [2,17,26]. The utilization of programmer experience for threshold identification was considered but limited to some studies [33,34,35]. There were some review studies on threshold derivation. However, these studies were not as comprehensive as in our study and did not answer these research questions.
Statistical methods are the most used among other techniques. The reason is that it depends on data that can be collected easily using static analysis tools that are available abundantly. However, most researchers do not compare many techniques except a few such as [50]. Therefore, there is a need for research that puts all previous techniques in one study on the same datasets to get a fair comparison among different techniques.
Quality-related techniques require collecting extra data such as faults, changes, and code refactoring in the lifetime of software. This extra information is not always available and ready to use for most software systems. Quality information requires extra effort and costs and developers may not have time to add them to the code repository. Such data are mostly available for the open-source field, which also suffers from problems like the correctness of recording the data or missing information. Therefore, statistical techniques are more common than quality-related techniques. We notice that there are no mixed techniques on both large corpora of data as in statistical techniques and quality data because collecting quality data for a large corpus of systems is time-consuming. Future works can focus on building tools that combine collecting quality data and at the same time static metrics for a large corpus of systems.
  • Q2 (The quality attributes for threshold calculation methods):
The papers in this study were categorized based on quality attributes as follows: fault detection, bad smells detection, design problems, reuse-proneness, and no application. According to Seliya et al. [73], fault detection is important to assure desired software reliability and is vital in bringing anticipated allocated cost and time. Reviews on software fault-proneness have shown the significance of this quality attribute on software quality (Kitchenham [28]; Hall et al. [74]; Rathore and Kumar [75]; Radjenovic et al. [76]).
Smell detection and refactoring also have an important effect on software quality, and many research papers discussed their effect on software quality (Fernandes et al. [77]; Zhang et al. [78]; Rasool and Arshad [79]). These two quality attributes are the most reported ones in our mapping study.
Predicting faulty classes based on threshold values received attention in these research papers to improve the quality of the class design (i.e., 16 studies). Additionally, threshold values have been used to isolate non-faulty classes from other classes that have risky classes. Some papers focused on detecting bad smells to be used as a methodical approach to classifying problematic classes (i.e., 9 studies). There are a considerable number of studies that have not validated thresholds on quality attributes (i.e., 12 studies) [3,7,13,22,23,27,36,39,49,50,56,57].
Collecting quality data is a time-consuming activity and open-source systems do not provide enough information to find, for example, the fault-prone modules. The refactoring of code is not systematic in most systems and depends greatly on efforts available for refactoring. The developers do not publish enough information on code refactoring and software processes. Therefore, collecting information about faults and code refactoring is not plausible, but the consideration of mixed models that depends on two or more quality attributes is not studied as shown in the selected studies. The results of threshold derivation have shown different metric values for the same techniques and for different systems. These results indicate inconsistencies among techniques and among different software systems. There are factors that affect consistency in threshold derivation. For example, threshold techniques for more than one quality attribute are potential future research that may give accurate or consistent thresholds for software metrics.
  • Q3 (Metrics categories):
Answering Q3 shows that a well-known suite of metrics (CK) has been used in most research papers [25,35,62]. Among 300 metrics found in literature, most studies proposed and validated the CK metrics as opposed to other metrics such as the LOC as a size measure by Nuñez-Varela et al. [80]. The authors in the study by Srinivasan and Devi [81] observed that metrics are an important factor for both currently developed software and also, for the future improvement of the software. To measure different quality factors, these metrics, such as complexity, are applied. Some papers only focused on applying one of these factors, like cohesion. In addition to CK metrics, Martin’s metrics, McCabe’s complexity, Li’s, and Lorenz and Kidd’s metrics also have been used in some studies [2,39,41]. There is a number of studies that have not considered the CK metrics at all [14,24,52]. These studies derived thresholds for non-object-oriented systems. However, Shatnawi et al. [17] used 12 metrics in different categories, including CK metrics, Li’s metrics [20], and Lorenz and Kidd’s [4] metrics.
There are inconsistencies in threshold values identified for the same metric for different software systems and using different metrics analysis tools. The definition of some metrics is not used consistently in different tools. The researchers considered different tools, which affect the consistency of derived thresholds for the same system. There is a need to compare metric thresholds using the same analyzer for several systems to know whether the inconsistencies come from the metric definition and collection or the technique itself. In addition, a large number of metrics exist in research and are not considered for threshold derivation, which is also potential future research. Threshold derivation techniques should be compared and validated on the same software and using the same tool.
  • Q4 (The types of studies):
The result of this question was as expected because the object-oriented metrics thresholds are practical areas, which are based on calculations and experimentation. Consequently, most of the papers included in this research have empirical nature [7]. However, the type of study also includes empirical and theoretical studies, supported by Ronchieri and Canaparo [27]. The review papers, such as Beranic and Hericko’s study [3], have been further added in this direction to show that it is an active area of interest among researchers.
Thresholds were proposed early with metric proposal and definition. For example, some researchers have used percentiles to identify God classes because they were selecting a portion of the system for investigation. However, the connection between metrics and many quality attributes has appeared and the need for advanced threshold techniques became a requirement. Thresholds need to be validated and empirical studies are the most suitable setting. There is a need for comprehensive research on threshold identification by considering all possible techniques and metrics analysis tools to reach valid and more accurate threshold values. Threshold values should be validated theoretically and empirically. In addition, empirical works should include other important quality attributes such as reusability, maintainability, security, and performance. Furthermore, a few research studies have considered multi-value attributes such as bug severity and priority and how they affect threshold identification, and whether the binary classification is better than multivariate classification.
  • Q5 (Relevant metrics):
We observed that many of the papers did not report the relevant metrics. However, there are also some studies that clearly explain whether the metrics threshold values were calculated properly or not. Table A3 in the Appendix C shows these metrics per paper.
There are plenty of metrics for measuring internal code properties such as size, inheritance, cohesion, and coupling. Coupling metrics were the most correlated with quality attributes. However, how these metrics interact and how they affect threshold derivation was not studied in previous works. There is a need to understand the profound relationship between metrics. Although some studies have considered the profound effect of size, there is a need for more studies on studying, for example, the interaction between coupling and other metrics. For example, it is well-known that low coupling and high cohesion are preferred in systems’ quality; however, how each metric affects the thresholds of the other is not considered in the literature.

6. Threat to Validity and Limitations

Five well-known electronic databases have been investigated to reach papers that focus on threshold-related studies. These libraries are IEEE Explore, Science direct, ACM Digital Library, Springer, and Wiley. There are variations of systematic mapping and experimental studies that can have limitations on our study.
The papers searched in this work are limited to well-known digital libraries. Therefore, there is a possibility of missing relevant papers. The authors have focused on well-known databases. The authors used synonyms related to threshold values of object-oriented metrics. Threshold calculation papers are usually related to fault prediction papers, and there is no complete separation between threshold papers from quality-related papers.
Bias over publications: It is a human tendency to report more favorable outcomes over adverse outcomes in every publication. If any work is reported, negative results have low chances of getting accepted and vice versa.
We have not limited to search analysis and selection techniques. We have searched all types of work related to this review, irrespective of their specific data or method. The selected studies for the review process from different periods when various institutions/practitioners utilized such methods. The broad acceptance of such methods leads to influence the researchers to use such methods.
Searching and selecting of studies: Our strategy was designed to find as many articles as possible. We built a wide range of search strings over digital databases. Although the search outcomes included many irrelevant articles, we decided to keep the search string fixed, as such, we do not miss any relevant papers. We considered regulating the search string to diverse our search results. We applied the inclusion and exclusion principle to choose relevant papers. Three researchers examined the principle of selection and discarded criteria. Therefore, the possibility to exclude the paper incorrectly was minimized.
Quality assessment: Usually, quality assessment is conducted by one researcher and validated by another researcher. However, in our review, the second researcher performed data extraction and quality assessment. Most biases were expected in quality assessment because research questions may be hard to justify. The score of articles may vary from one researcher to another.

7. Implications for Researchers and Practitioners

Researchers and practitioners can focus on building tools that combine collecting quality data and at the same time static metrics for a large corpus of systems.
Threshold techniques for more than one quality attribute are potential future research that may give accurate or consistent thresholds for software metrics.
A large number of metrics exist in research and are not considered for threshold derivation; researchers can focus on this direction. Threshold derivation techniques should be compared and validated on the same software and using the same tool.
There is a need for more studies on threshold values evaluation in context to the interaction between coupling and other metrics.
There is a need for industrial studies and cases to know practitioners’ perspectives on threshold calculation techniques.

8. Conclusions and Future Work

In this paper, we performed a systematic mapping study on software metrics threshold calculation techniques and presented our results. The result of this study showed that most of the papers were published in recent years, which means that the field of identifying the object-oriented metrics threshold values has received more attention recently, and this is a very active research area among software engineering researchers. In addition, results demonstrated that most of the methods proposed to calculate the thresholds are based on statistical analysis techniques. Another result from this paper is the wide use of the CK metrics in different projects. The use of object-oriented metrics threshold values was investigated in a variety of quality attributes such as software design, software maintenance, industrial and medical applications. The study has found that threshold derivation was not comprehensive in most studies and further studies are needed to fill the gaps. The threshold derivation research has not covered many quality attributes and has not covered a large number of metrics. Furthermore, thresholds for severity and priority are not investigated.
For future work, we recommend extending this study to include papers published after our screening period and the other search engines and electronic databases. In addition, a systematic literature review of this field based on specific research questions can be conducted on the limitations of software metrics.

Author Contributions

Conceptualization, A.M. and C.C.; data curation, A.M. and C.C.; formal analysis, A.M., R.S. and C.C. funding acquisition, A.M. investigation, A.M., R.S. and C.C. methodology, A.M., R.S. and C.C. resources, A.M. supervision, A.M. and R.S. validation, A.M., R.S. and A.A. visualization, A.M., R.S., C.C. and A.A. writing—original draft, A.M. and C.C. writing—review and editing, A.M., R.S., C.C. and A.A. All authors have read and agreed to the published version of the manuscript.

Funding

Authors thanks to the Molde University College-Specialized Univ. in Logistics, Norway for the support of Open access fund.

Institutional Review Board Statement

Not applicable.

Informed Consent Statement

Not applicable.

Data Availability Statement

Not applicable.

Conflicts of Interest

The authors declare no conflict of interest.

Appendix A

Table A1. Identified Papers in this Systematic Mapping Study.
[S1] Vale, G., Figueiredo, E. (2015). A Method to Derive Metric Thresholds for software product line. 29th Brazilian Symposium on Software Engineering.
[S2] Shatnawi, R. (2010). A Quantitative Investigation of the Acceptable Risk Levels of Object-Oriented Metrics in Open-Source Systems. IEEE Journal of Transactions on Software Engineering. Volume: 36, issue: 2.
[S3] Sodiya, Adesina S., Aborisade, Dada O., Ikuomola, Aderonke J. (2012). A Survivability Model for Object-Oriented Software Systems. Fourth International Conference on Computational Aspects of Social Networks (CASoN), pp 283–290.
[S4] Li, W. and Shatnawi, R. (2007) An empirical study of the bad smells and class error probability in the post-release object-oriented system evolution. Journal of Systems and Software, volume 80, issue 7, pp 1120–1128.
[S5] Al Dallal, J. and Briand, L. C. (2010) An object-oriented high-level design-based class cohesion metric. Inf. Softw. Technol. 52, 12 (December 2010), 1346-1361.
[S6] Alan, O., Catal, C. (2009). An Outlier Detection Algorithm Based on Object-Oriented. 24th International Symposium on Computer and Information Sciences, pp 567-570.
[S7] Fontana, F. A., Ferme, V., Zanoni, M., Yamashit, A. (2015). Automatic metric thresholds derivation for code smell detection. 6th International Workshop on Emerging Trends in Software Metrics.
[S8] Herbold, S. Grabowski, J. Waack, S. (2011). Calculation and optimization of thresholds for sets of software metrics. An International Journal of Empirical Software Engineering, volume 16, issue 6, pp 812–841.
[S9] Al Dallal, J. (2012). Constructing models for predicting extract subclass refactoring opportunities using object-oriented quality metrics. Journal of Information and Software Technology, volume 54, issue 10, pp 1125–1141.
[S10] Alves Tiago L., Christiaan Ypma, Joost Visser. (2010). Deriving Metric Thresholds from Benchmark data. IEEE International Conference on Software Maintenance (ICSM), pp 1-10.
[S11] Shatnawi, R. (2015), Deriving metrics thresholds using log transformation. Journal of Software Evolution and Process, volume 27, issue 2, pp 95–113.
[S12] Suresh, Y., Pati, J., and Rath, S. K. (2012). Effectiveness of software metrics for object-oriented system. 2nd International Conference on Communication, Computing & Security. Volume 6, pp 420-427.
[S13] Malhotra, R. and Jain Bansal, A. (2014). Fault prediction considering threshold effects of object oriented metrics. Journal of Expert System. Volume 32, issue 2, pp 203-219.
[S14] Shatnawi, R., Li, W., Swain, J. and Newma, T. (2009). Finding software metrics threshold values using ROC curves. Journal of Software Maintenance and Evolution: Research and Practice, Volume 22, issue 1, pp 1–16.
[S15] Ferreira, K. A. M., Bigonha, M. A. S., Bigonha, R. S., Mendes, L. F. O., and Almeida, H. C. (2012). Identifying thresholds for object-oriented software metrics. Journal of Systems and Software, volume 85, issue 2, February 2012, pp 244–257.
[S16] Al Dallal, J. (2011) Improving the applicability of object-oriented class cohesion metrics. Inf. Softw. Technol. 53, 9 (September 2011), 914-928.
[S17] Singh, S. and Kahlon, K.S. (2014). Object oriented software metrics threshold values at quantitative acceptable risk level. Journal of CSI Transactions on ICT, volume 2, issue 3, pp 191-205.
[S18] Oliveira, P., Lima, F. P., Valente, M. T., Serebrenik, A. (2014). RTTOOL: A Tool for Extracting Relative Thresholds for Source Code Metrics. IEEE International Conference on Software Maintenance and Evolution (ICSME), pp 629-632.
[S19] Benlarbi, S., El Emam, K., Goel, N., Rai, S. (2000). Thresholds for Object-Oriented Measures. 11th International Symposium on Software Reliability Engineering, pp 24–38.
[S20] Al Dallal, J. (2011) Transitive-based object-oriented lack-of-cohesion metric, Procedia Computer Science 3 (2011) 1581–1587
[S21] Lavazza, L. and Morasca, S. (2016, September). An empirical evaluation of distribution-based thresholds for internal software measures. In Proceedings of the The 12th International Conference on Predictive Models and Data Analytics in Software Engineering (p. 6). ACM
[S22] Vale, G., Albuquerque, D., Figueiredo, E., and Garcia, A. (2015, July). Defining metric thresholds for software product lines: a comparative study. In Proceedings of the 19th International Conference on Software Product Line (pp. 176-185). ACM.
[S23] Arar, Ö. F. and Ayan, K. (2016). Deriving thresholds of software metrics to predict faults on open source software: Replicated case studies. Expert Systems with Applications, 61, 106-121.
[S24] Hussain, S., Keung, J., Khan, A. A., and Bennin, K. E. (2016, August). Detection of fault-prone classes using logistic regression based object-oriented metrics thresholds. In Software Quality, Reliability and Security Companion (QRS-C), 2016 IEEE International Conference on (pp. 93-100). IEEE.
[S25] Catal, C., Alan, O., and Balkan, K. (2011). Class noise detection based on software metrics and ROC curves. Information Sciences, 181(21), 4867-4877.
[S26] Shatnawi, R., and Althebyan, Q. (2013). An empirical study of the effect of power law distribution on the interpretation of OO metrics. ISRN Software Engineering, 2013.
[S27] Malhotra, R., Chug, A., and Khosla, P. (2015, August). Prioritization of classes for refactoring: A step towards improvement in software quality. In Proceedings of the Third International Symposium on Women in Computing and Informatics (pp. 228-234). ACM
[S28] Lochmann, K. (2012). A benchmarking-inspired approach to determine threshold values for metrics. ACM SIGSOFT Software Engineering Notes, 37(6), 1-8.
[S29] Veado, L., Vale, G., Fernandes, E., and Figueiredo, E. (2016, June). TDTool: threshold derivation tool. In Proceedings of the 20th International Conference on Evaluation and Assessment in Software Engineering (p. 24). ACM.
[S30] Oliveira, P., Valente, M. T., and Lima, F. P. (2014, February). Extracting relative thresholds for source code metrics. In Software Maintenance, Reengineering and Reverse Engineering (CSMR-WCRE), 2014 Software Evolution Week-IEEE Conference on (pp. 254-263). IEEE.
[S31] Malhotra R. and Bansal A. (2017) Identifying threshold values of an open source software using Receiver Operating Characteristics curve (ROC), Journal of Information and Optimization Sciences, 38:1, 39-69, DOI: 10.1080/02522667.2015.1135592.
[S32] Filó, T. G., Bigonha, M., and Ferreira, K. (2015) A catalogue of thresholds for object-oriented software metrics. Proc. of the 1st SOFTENG, 48–55.
[S33] Stojkovski M. (2017) Thresholds for Software Quality Metrics in Open Source Android Projects, Department of Computer Science, Norwegian University of Science and Technology, December 2017.
[S34] Vale, G., Fernandes, E., and Figueiredo, E. (2018) On the proposal and evaluation of a benchmark-based threshold derivation method. Software Quality Journal, 27(1), 1-32.
[S35] Mori, A., Vale, G., Viggiato, M., Oliveira, J., Figueiredo, E., Cirilo, E., Jamshidi, P. and Kastner, C., (2018) Evaluating domain-specific metric thresholds: an empirical study. In International Conference on Technical Debt (TechDebt).
[S36] Boucher A., Badri M. (2018) Software metrics thresholds calculation techniques to predict fault-proneness: An empirical comparison, Information and Software Technology, 96, 2018, pp. 38-67.
[S37] Padhy N., Panigrahi R. and Neeraja, K. (2019) Threshold estimation from software metrics by using evolutionary techniques and its proposed algorithms, models, Evolutionary Intelligence, 1–15.
[S38] Mohovic M., Mausa G. and Grbac T. (2018) Using Threshold Derivation of Software Metrics for Building Classifiers in Defect Prediction, Proceedings of the Seventh Workshop on Software Quality Analysis, Monitoring, Improvement, and Applications.
[S39] Shatnawi, R. (2017) The application of ROC analysis in threshold identification, data imbalance and metrics selection for software fault prediction, Innovations Syst Softw Eng, 13: 201
[S40] Boucher A. and Badri M. (2016) Using Software Metrics Thresholds to Predict Fault-Prone Classes in Object-Oriented Software, 2016 4th Intl Conf on Applied Computing and Information Technology/3rd Intl Conf on Computational Science/Intelligence and Applied Informatics/1st Intl Conf on Big Data, Cloud Computing, Data Science & Engineering (ACIT-CSII-BCD), Las Vegas, NV, 2016, pp. 169-176.
[S41] Mauša G. and Grbac T.G. (2017) The Stability of Threshold Values for Software Metrics in Software Defect Prediction. Lecture Notes in Computer Science, vol 10563. Springer, Cham
[S42] Aniche M., Treude C., Zaidman A., v. Deursen A. and Gerosa M. A. (2016) SATT: Tailoring Code Metric Thresholds for Different Software Architectures, 2016 IEEE 16th International Working Conference on Source Code Analysis and Manipulation (SCAM), Raleigh, NC, 2016, pp. 41-50.
[S43] Catal, C., Sevim, U., and Diri, B. (2009) Clustering and metrics thresholds based software fault prediction of unlabeled program modules, ITNG 2009—6th International Conference on Information Technology: New Generations.
[S44] Beranic T. and Hericko M. (2017) Approaches for Software Metrics Threshold Derivation: A Preliminary Review, Proceedings of the Sixth Workshop on Software Quality Analysis, Monitoring, Improvement, and Applications.
[S45] Ronchieri E., and Canaparo M. (2016) A preliminary mapping study of software metrics thresholds, Italy conference ICSOFT 2016—Proceedings of the 11th International Joint Conference on Software Technologies.

Appendix B

Table A2. Details of the Quality Assessment.
IDQ1Q2Q3Q4Q5Q6Q7Q8Total
S1111111118
S2111111107
S3111111017
S4111111118
S5111111118
S6111110.50.517
S7111111118
S8111111118
S9111111118
S10111111017
S11111111118
S12111111017
S13111111118
S14111111118
S15111111118
S16111111118
S17111111118
S18111111017
S19111111017
S201110.511016.5
S21111111118
S22111111118
S23111111118
S24111110.50.517
S25111110.5117.5
S261111110.517.5
S271110.510.50.516.5
S28111110.5117.5
S291110.510.50.516.5
S30111110.5117.5
S311110.510.50.516.5
S32111110.50.517
S33111110.5117.5
S34111111118
S35111110.5117.5
S36111110.5117.5
S37111110016
S381111100.516.5
S39111111118
S401111110.517.5
S41111111017
S42111111118
S43111110.5117.5
S44111110.50.517
S45111110.5016.5

Appendix C

Table A3. Relevant and Irrelevant Metrics.
ReferencesRelevant MetricsIrrelevant Metrics
[S1]LOC (Lines of Code), CBO (Coupling between Objects), WMC (Weighted Methods for Class), and NCR (Number of Class Reused)Not mentioned
[S2]CBO, RFC (Response for a Class), and WMCDIT (Depth of inheritance tree) and NOC (Number of Children) metrics
[S3]WMCNot mentioned
[S4]NAM (Number of Accessor Methods), WOC (Weight Of Class), NOPA (Number of Public Attributes), TCC (Tight Class Cohesion), WMC, LOC, NOLV (Number of Local Variables), NOP (Number of Parameters), MNOB (Maximum Number of Branches), AIUR (Average Inheritance Usage Ratio), DIT, CM (Changing Methods), ChC (Changing Classes), ALD (Access of Local Data), NIC (Number of Import Classes), AID (Access of Import Data), and AOFD (Access of Foreign Data)Not mentioned
[S5]SCC (Similarity-based Class Cohesion), CAMC (Cohesion Among Methods in a Class), NHD (Normalized Hamming Distance), SNHD (Scaled NHD), Lack of Cohesion in Methods metrics (LCOM1, LCOM2, LCOM3, Coh, TCC, and LCC)Not mentioned
[S6]WMC, DIT, NOC, CBO, RFC, LCOM.Two metrics of CK
[S7]ATFD (Access to Foreign Data), WMC, NOPA, NAM, LOC, CYCLO/CC (Cyclomatic Complexity), MAXNESTING (Maximum Nesting Level), NOAV (Number of Accessed Variables), CINT (Coupling Intensity), CM, ChCTCC, DIT
[S8]Metrics for methods: VG/CC (Cyclomatic Number), NBD (Nested Block Depth), NFC (Number of Function Calls), NST (Number of Statements) Metrics for classes: WMC, CBO, RFC, NORM (Number of Overridden Methods), LOC, NOM (Number of Methods), NSM (Number of Static Methods)LCOM, DIT and NOC
[S9]LOC, NOM, NOA, RFC, MPC (Message Passing Coupling), DAC1 (Data Abstraction Coupling), DAC2, OCMEC (Number of distinct classes used as types of the parameters of the methods in the class), LCOM1, LCOM2, LCOM3, LCOM4, LCOM5, Coh, TCC, LCC, DCD, DCI, CC, SCOM, LSCC, CBMC (Cohesion Based on Member Connectivity), ICBMC, OLn, and PCCC (Path Connectivity Class Cohesion)Nonlocal coupling measures (e.g., CBO)
[S10]LOCNot mentioned
[S11]RFC, CBO, LCOM, NOC, DIT, and WMCNot mentioned
[S12]McCabe’s Complexity: MLOC (Method Lines of Code), TLOC and Nested Block DepthCK Metrics: WMC, LCOM, DIT AND NOCR.C.Martin’s: Ca (Afferent Coupling), Ce (Efferent Coupling), I (Instability), A (Abstractness), and Dn (Normalized Distance from Main Sequence)Not mentioned
[S13]WMC, CBO, RFC, LCOM, and LOCNOC and DIT
[S14]CBO, RFC, WMC, CTM, and NOOLCOM, DIT, NOC, CTA, NOAM, NOOM, and NOA
[S15]LCOM, DIT, couplingNot mentioned
[S16]LSCC, LCOM3, LCOM4, Coh, TCC, LCC, DCD, DCI, LCOM1, LCOM2, LCOM5, CC, SCOM, CAMC, and NHD.Not mentioned
[S17]DIT, NOC, RFC, WMC, LCOM, Co, CBO, NOA, NOOM, NOAM, PuF, EncF, WMCDIT, NOC, LCOM, Co, NOOM, NOAM and PuF
[S18]NOA, NOM, FAN-OUT, RFC and WMCDIT and Dn
[S19]WMC, DIT, NOC, CBO, RFCLCOM
[S20]LCOMNot mentioned
[S21]Not mentionedNot mentioned
[S22]Not mentionedNot mentioned
[S23]AVG_CC (Average CC), MAX_CC (Maximum CC), LOC, WMC, CBO, CE, NPM, RFC, LCOM, AMCNot mentioned
[S24]Not mentionedNot mentioned
[S25]Not mentionedNot mentioned
[S26]NOC, WMC, NOM, NOV, SLOCCBO, RFC
[S27]WMC, RFC, CBO, LCOM, DIT, NOCNone
[S28]Not mentionedNot mentioned
[S29]LOC, CBO, WMC, NCRNot mentioned
[S30]NOM, LOC, FAN-OUT, RFC, WMC, PUBA/NOA, LCOMNot mentioned
[S31]CBO, NOA, NIV (Number of Instance Method), NLM (Number of Local Methods), NPRM (Number of Private Methods), LOC, LCOM, WMCNOC
[S32]NOC, NOM, NOF (Number of Fields), NORM, PAR (Number of parameters), NSM, NSF, MLOC, SIX (specialization index), VG, NBD, MC), DIT, NSC (Number of Children), LCOM), Ca/CeNot mentioned
[S33]NOM, RFC, CBO, NOC, DITNot mentioned
[S34]LOC, CBO, WMC, NCRNot mentioned
[S35]CBO, WMC, LCOM, DIT, LOCNone
[S36]CBO, RFC, WMC, LOCLCOM, DIT, NOC
[S37]CK Metrics, MOOD MetricsNot mentioned
[S38]LOC, CC, number of comment lines, CBO, cohesion, DIT, number of external method calls, fan-in, fan-out, RFC, LCOM, Halstead volume, Halstead length, number of interfaces, number of attributes, number of local method calls, Message Passing CouplingNot mentioned
[S39]WMC, CBO, RFC, LCOMNOC, DIT
[S40]CK Metrics, SLOC (Source Lines of Code)Not mentioned
[S41]LOC, physical executable source lines of code, logical source lines of code, blank lines of code, the total number of Java statements in class, maximum cyclomatic complexity of any method in the class, total cyclomatic complexity of all the methods in the class, cumulative Halstead length of all the components in the classDIT
[S42]NOM, WMC, CBO, RFC, LCOMNot mentioned
[S43]LOC, WMC, NCR (Number of Constant Refinements)Coupling between Objects classes (CBO),
[S44]LOC, CC, Unique Operator (UOp), Unique Operand (UOpnd), Total Operator (TOp), Total Operand (TOpnd)Not mentioned
[S45]CK object-oriented metricsNot mentioned

References

  1. Arar, Ö.F.; Ayan, K. Deriving thresholds of software metrics to predict faults on open source software: Replicated case studies. Expert Syst. Appl. 2016, 61, 106–121. [Google Scholar] [CrossRef]
  2. Ferreira, K.A.M.; Mariza, A.S.; Bigonha, R.S.; Bigonha, L.F.O.M.; Heitor, C.A. Identifying thresholds for object-oriented software metrics. J. Syst. Softw. 2012, 85, 244–257. [Google Scholar] [CrossRef]
  3. Beranic, T.; Hericko, M. Approaches for Software Metrics Threshold Derivation: A Preliminary Review. In Proceedings of the Sixth Workshop on Software Quality Analysis, Monitoring, Improvement, and Applications, Belgrade, Serbia, 11–13 September 2017; pp. 1–8. [Google Scholar]
  4. Lorenz, M.; Kidd, J. Object-Oriented Software Metrics; Prentice-Hall: Englewood Cliffs, NJ, USA, 1994. [Google Scholar]
  5. Nagappan, N.; Ball, T.; Zeller, A. Mining metrics to predict component failures. In Proceedings of the 28th International Conference on Software Engineering (ICSE’06), Shanghai, China, 20–28 May 2006; pp. 452–461. [Google Scholar]
  6. Kitchenham, B.; Brereton, O.P.; Budgen, D.; Turner, M.; Bailey, J.; Linkman, S. Systematic literature reviews in software engineering–a systematic literature review. Inf. Softw. Technol. 2009, 51, 7–15. [Google Scholar] [CrossRef]
  7. Alves, T.L.; Christiaan, Y.; Joost, V. Deriving Metric Thresholds from Benchmark data. In Proceedings of the IEEE International Conference on Software Maintenance (ICSM), Timisoara, Romania, 12–18 September 2010; pp. 1–10. [Google Scholar]
  8. Sanchez-Gonzalez, G.F.; Ruiz, F.; Mendling, J. A study of the effectiveness of two threshold definition techniques. In Proceedings of the 16th International Conference on Evaluation Assessment in Software Engineering (EASE 2012), Ciudad Real, Spain, 14–15 May 2012; pp. 197–205. [Google Scholar]
  9. Lanza, M.; Marinescu, R. Object-Oriented Metrics in Practice: Using Software Metrics to Characterize, Evaluate, and Improve the Design of Object-Oriented Systems; Springer Science & Business Media: Berlin/Heidelberg, Germany, 2007. [Google Scholar]
  10. Chidamber, S.R.; Kemerer, C.F. A metrics suite for object oriented design. IEEE Trans. Softw. Eng. 1994, 20, 476–493. [Google Scholar] [CrossRef] [Green Version]
  11. Herbold, S.; Jens Grabowski, S.W. Calculation and optimization of thresholds for sets of software metrics. Int. J. Empir. Softw. Eng. 2011, 16, 812–841. [Google Scholar] [CrossRef] [Green Version]
  12. Keele, S. Guidelines for Performing Systematic Literature Reviews in Software Engineering; Version 2.3 EBSE Technical Report EBSE-2007-01; Keele University: Keele, UK, 2007. [Google Scholar]
  13. Catal, C.; Sevim, U.; Diri, B. Clustering and metrics thresholds based software fault prediction of unlabeled program modules. In Proceedings of the ITNG 2009—6th International Conference on Information Technology: New Generations, Las Vegas, NV, USA, 27–29 April 2009; pp. 199–204. [Google Scholar]
  14. Fontana, F.A.V.F.; Marco, Z.; Aiko, Y. Automatic metric thresholds derivation for code smell detection. In Proceedings of the 6th International Workshop on Emerging Trends in Software Metrics, Florence, Italy, 17 May 2015. [Google Scholar]
  15. Malhotra, R.; Chug, A.; Khosla, P. Prioritization of classes for refactoring: A step towards improvement in software quality. In Proceedings of the Third International Symposium on Women in Computing and Informatics, Kochi, India, 10–13 August 2015; pp. 228–234. [Google Scholar]
  16. Marino, M.; Goran, M.; Tihana, G.G. Using Threshold Derivation of Software Metrics for Building Classifiers in Defect Prediction. In Proceedings of the Seventh Workshop on Software Quality Analysis, Monitoring, Improvement, and Applications, SQAMIA, Novi Sad, Serbia, 27–30 August 2018. [Google Scholar]
  17. Shatnawi, R.; Wei, L.; James, S.; Tim, N. Finding software metrics threshold values using ROC curves. J. Softw. Maint. Evol. Res. Pract. 2009, 22, 1–16. [Google Scholar] [CrossRef]
  18. Boucher, A.; Badri, M. Software metrics thresholds calculation techniques to predict fault-proneness: An empirical comparison. Inf. Softw. Technol. 2018, 96, 38–67. [Google Scholar] [CrossRef]
  19. Fenton, N.; Neil, M. Software metrics: Successes, failures, and new directions. J. Syst. Softw. 1999, 47, 149–157. [Google Scholar] [CrossRef] [Green Version]
  20. Li, W. Another Metric Suite for Object Oriented Programming. J. Syst. Softw. 1998, 44, 155–162. [Google Scholar] [CrossRef]
  21. Li, W.; Henry, S. Object-oriented metrics that predict maintainability. J. Syst. Softw. 1993, 23, 111–122. [Google Scholar] [CrossRef]
  22. Oliveira, P.; Valente, M.T.; Lima, F.P. Extracting relative thresholds for source code metrics. In Proceedings of the Software Maintenance, Reengineering and Reverse Engineering (CSMR-WCRE), Antwerp, Belgium, 3–6 February 2014; pp. 254–263. [Google Scholar]
  23. Stojkovski, M. Thresholds for Software Quality Metrics in Open Source Android Projects. Master’s Thesis, Department of Computer Science, Norwegian University of Science and Technology, Trondheim, Norway, December 2017. [Google Scholar]
  24. Al Dallal, J.; Briand, L.C. An object-oriented high-level design-based class cohesion metric. Inf. Softw. Technol. 2010, 52, 1346–1361. [Google Scholar] [CrossRef]
  25. Shatnawi, R. Deriving metrics thresholds using log transformation. J. Softw. Evol. Process. 2015, 27, 95–113. [Google Scholar] [CrossRef]
  26. Malhotra, R.; Jain Bansal, A. Fault prediction considering threshold effects of object oriented metrics. J. Expert Syst. 2014, 32, 203–219. [Google Scholar] [CrossRef]
  27. Ronchieri, E.; Canaparo, M. A preliminary mapping study of software metrics thresholds. In Proceedings of the 11th International Joint Conference on Software Technologies, ICSOFT-EA, Bologna, Italy, 24–26 July 2016; pp. 232–240. [Google Scholar]
  28. Kitchenham, B. What’s up with software metrics?—A preliminary mapping study. J. Syst. Softw. 2010, 83, 37–51. [Google Scholar] [CrossRef]
  29. Tahir, A.; MacDonell, S.G. A systematic mapping study on dynamic metrics and software quality. In Proceedings of the 2012 28th IEEE International Conference on Software Maintenance (ICSM), Trento, Italy, 23–28 September 2012; pp. 326–335. [Google Scholar]
  30. Vanitha, N.; Thirumalaiselvi, R. A Report on the Analysis of Metrics and Measures on Software Quality Factors—A Literature Study. Int. J. Comput. Sci. Inf. Technol. 2014, 5. [Google Scholar]
  31. Petersen, K.; Vakkalanka, S.; Kuzniarz, L. Guidelines for conducting systematic mapping studies in software engineering: An update. Inf. Softw. Technol. 2015, 64, 1–18. [Google Scholar] [CrossRef]
  32. Tummers, J.; Kassahun, A.; Tekinerdogan, B. Obstacles and features of Farm Management Information Systems: A systematic literature review. Comput. Electron. Agric. 2019, 157, 189–204. [Google Scholar] [CrossRef]
  33. Sodiya, A.S.; Aborisade, D.O.; Ikuomola, A.J. A Survivability Model for Object-Oriented Software Systems. In Proceedings of the Fourth International Conference on Computational Aspects of Social Networks (CASoN), Sao Carlos, Brazil, 21–23 November 2012; pp. 283–290. [Google Scholar]
  34. Li, W.; Shatnawi, R. An empirical study of the bad smells and class error probability in the post-release object-oriented system evolution. J. Syst. Softw. 2007, 80, 1120–1128. [Google Scholar] [CrossRef]
  35. Alan, O.; Catal, C. An Outlier Detection Algorithm Based on Object-Oriented. In Proceedings of the 24th International Symposium on Computer and Information Sciences, Guzelyurt, Northern Cyprus, 14–16 September 2009; pp. 567–570. [Google Scholar]
  36. Suresh, Y.J.P.; Santanu, K.R. Effectiveness of software metrics for object-oriented system. In Proceedings of the 2nd International Conference on Communication, Computing & Security, Rourkela, India, 6–8 October 2012; Volume 6, pp. 420–427. [Google Scholar]
  37. Rosenberg, L.H.; Stapko, R. Applying Object Oriented Metrics. In Proceedings of the Sixth International Symposium on Software Metrics-Measurement for Object-Oriented Software Projects Workshop, Boca Raton, FL, USA, 4–6 November 1999. [Google Scholar]
  38. Vale, G.; Albuquerque, D.; Figueiredo, E.; Garcia, A. Defining metric thresholds for software product lines: A comparative study. In Proceedings of the 19th International Conference on Software Product Line, New York, NY, USA, 20–24 July 2015; pp. 176–185. [Google Scholar]
  39. Oliveira, P.F.P.; Lima, M.T.V.; Alexander, S. RTTOOL: A Tool for Extracting Relative Thresholds for Source Code Metrics. In Proceedings of the IEEE International Conference on Software Maintenance and Evolution (ICSME), Victoria, BC, Canada, 29 September–3 October 2014; pp. 629–632. [Google Scholar]
  40. Malhotra, R.; Bansal, A. Identifying threshold values of an open source software using Receiver Operating Characteristics curve (ROC). J. Inf. Optim. Sci. 2017, 38, 39–69. [Google Scholar] [CrossRef]
  41. Singh, S.; Kahlon, K.S. Object oriented software metrics threshold values at quantitative acceptable risk level. J. CSI Trans. ICT 2014, 2, 191–205. [Google Scholar] [CrossRef] [Green Version]
  42. Benlarbi, S.; Khaled, E.E.; Nishith, G.; Shesh, R. Thresholds for Object-Oriented Measures. In Proceedings of the 11th International Symposium on Software Reliability Engineering, San Jose, CA, USA, 8–11 October 2000; pp. 24–38. [Google Scholar]
  43. Lavazza, L.; Morasca, S. An empirical evaluation of distribution-based thresholds for internal software measures. In Proceedings of the 12th International Conference on Predictive Models and Data Analytics in Software Engineering, Ciudad Real, Spain, 9 September 2016; p. 6. [Google Scholar]
  44. Catal, C.; Alan, O.; Balkan, K. Class noise detection based on software metrics and ROC curves. Inf. Sci. 2011, 181, 4867–4877. [Google Scholar] [CrossRef]
  45. Bansiya, J.; Davis, C.G. A hierarchical model for object-oriented design quality assessment. IEEE Trans. Softw. Eng. 2002, 28, 4–17. [Google Scholar] [CrossRef]
  46. Martin, R. OO design quality metrics. Anal. Depend. 1994, 12, 151–170. [Google Scholar]
  47. Tang, M.H.; Kao, M.H.; Chen, M.H. An empirical study on object-oriented metrics. In Proceedings of the Sixth International Software Metrics Symposium (Cat. No.PR00403), Boca Raton, FL, USA, 4–6 November 1999; pp. 242–249. [Google Scholar]
  48. Henderson-Sellers, B. Object-Oriented Metrics: Measures of Complexity; Prentice-Hall, Inc.: Hoboken, NJ, USA, 1996. [Google Scholar]
  49. Lochmann, K. A benchmarking-inspired approach to determine threshold values for metrics. ACM SIGSOFT Softw. Eng. Notes 2012, 37, 1–8. [Google Scholar] [CrossRef]
  50. Veado, L.; Vale, G.; Fernandes, E.; Figueiredo, E. TDTool: Threshold derivation tool. In Proceedings of the 20th International Conference on Evaluation and Assessment in Software Engineering, Limerick, Ireland, 1–3 June 2016; p. 24. [Google Scholar]
  51. Gronback, R.C. Software Remodeling: Improving Design and Implementation Quality, Using Audits, Metrics and Refactoring in Borland Together Control Center, A Borland White Paper, January. 2003. Available online: http://citeseerx.ist.psu.edu/viewdoc/download?doi=10.1.1.87.9155&rep=rep1&type=pdf (accessed on 15 July 2020).
  52. Al Dallal, J. Constructing models for predicting extract subclass refactoring opportunities using object-oriented quality metrics. J. Inf. Softw. Technol. 2012, 54, 1125–1141. [Google Scholar] [CrossRef]
  53. Al Dallal, J. Improving the applicability of object-oriented class cohesion metrics. Inf. Softw. Technol. 2011, 53, 914–928. [Google Scholar] [CrossRef]
  54. Bender, R. Quantitative risk assessment in epidemiological studies investigating threshold effects. Biom. J. 1999, 41, 305–319. [Google Scholar] [CrossRef]
  55. Hussain, S.; Keung, J.; Khan, A.A.; Bennin, K.E. Detection of fault-prone classes using logistic regression based object-oriented metrics thresholds. In Proceedings of the 2016 IEEE International Conference on Software Quality, Reliability and Security Companion (QRS-C), Vienna, Austria, 1–3 August 2016; pp. 93–100. [Google Scholar]
  56. Shatnawi, R.; Althebyan, Q. An empirical study of the effect of power law distribution on the interpretation of OO metrics. ISRN Softw. Eng. 2013, 2013, 198937. [Google Scholar] [CrossRef] [Green Version]
  57. Aniche, M.; Treude, C.; Zaidman, A.; van Deursen, A.; Gerosa, M.A. SATT: Tailoring Code Metric Thresholds for Different Software Architectures. In Proceedings of the 2016 IEEE 16th International Working Conference on Source Code Analysis and Manipulation (SCAM), Raleigh, NC, USA, 2–3 October 2016; pp. 41–50. [Google Scholar]
  58. Filó, T.G.; Bigonha, M.; Ferreira, K. A catalogue of thresholds for object-oriented software metrics. In Proceedings of the SOFTENG 2015: The First International Conference on Advances and Trends in Software Engineering, Barcelona, Spain, 19–24 April 2015; pp. 48–55. [Google Scholar]
  59. Gustavo, V.; Eduardo, F.A. Method to Derive Metric Thresholds for software product line. In Proceedings of the 29th Brazilian Symposium on Software Engineering, Belo Horizonte, Brazil, 21–26 September 2015. [Google Scholar]
  60. Mori, A.; Vale, G.; Viggiato, M.; Oliveira, J.; Figueiredo, E.; Cirilo, E.; Jamshidi, P.; Kastner, C. Evaluating domain-specific metric thresholds: An empirical study. In Proceedings of the International Conference on Technical Debt (TechDebt), Gothenburg, Sweden, 27 March–3 June 2018. [Google Scholar]
  61. Padhy, N.; Panigrahi, R.; Neeraja, K. Threshold estimation from software metrics by using evolutionary techniques and its proposed algorithms, models. Evol. Intell. 2019, 14, 315–329. [Google Scholar] [CrossRef]
  62. Shatnawi, R. A Quantitative Investigation of the Acceptable Risk Levels of Object-Oriented Metrics in Open-Source Systems. IEEE J. Trans. Softw. Eng. 2010, 36, 216–225. [Google Scholar] [CrossRef]
  63. Vale, G.; Fernandes, E.; Figueiredo, E. On the proposal and evaluation of a benchmark-based threshold derivation method. Softw. Qual. J. 2018, 27, 1–32. [Google Scholar] [CrossRef]
  64. Boucher, A.; Badri, M. Using Software Metrics Thresholds to Predict Fault-Prone Classes in Object-Oriented Software. In Proceedings of the 2016 4th International Conference on Applied Computing and Information Technology/3rd International Conference on Computational Science/Intelligence and Applied Informatics/1st International Conference on Big Data, Cloud Computing, Data Science & Engineering (ACIT-CSII-BCD), Las Vegas, NV, USA, 12–14 December 2016; pp. 169–176. [Google Scholar]
  65. Mauša, G.; Grbac, T.G. The stability of threshold values for software metrics in software defect prediction. In Proceedings of the International Conference on Model and Data Engineering, Barcelona, Spain, 4–6 October 2017; Springer: Cham, Switzerland, 2017; pp. 81–95. [Google Scholar]
  66. Shatnawi, R. The application of ROC analysis in threshold identification, data imbalance and metrics selection for software fault prediction. Innov. Syst. Softw. Eng. 2017, 13, 201. [Google Scholar] [CrossRef]
  67. Aman, H.; Mochiduki, N.; Yamada, H.; Noda, M.-T. A simple predictive method for discriminating costly classes using class size metric. IEICE Trans. Inf. Syst. 2005, E88-D, 1284–1288. [Google Scholar] [CrossRef]
  68. Barkmann, H.; Lincke, R.; Love, W. Quantitative evaluation of software quality metrics in open source projects. In Proceedings of the International Conference on Advanced Information Networking and Applications Workshops, Bradford, UK, 26–29 May 2009; pp. 1067–1072. [Google Scholar]
  69. Mihancea, P.; Marinescu, R. Towards the optimization of automatic detection of design flaws in A Preliminary Mapping Study of Software Metrics Thresholds object-oriented software systems. In Proceedings of the Ninth European Conference on Software Maintenance and Reengineering, Manchester, UK, 21–23 March 2005; pp. 92–101. [Google Scholar]
  70. Rodriguez, D.; Ruiz, R.; Riquelme, J.; Harrison, R. A study of subgroup discovery approach for defect prediction. Inf. Softw. Technol. 2013, 55, 1810–1822. [Google Scholar] [CrossRef] [Green Version]
  71. Ampatzoglou, A.; Frantzeskou, G.; Stamelos, I. A methodology to assess the impact of design patterns on software quality. Inf. Softw. Technol. 2011, 54, 331–346. [Google Scholar] [CrossRef]
  72. El Emam, K.; Benlarbi, S.; Goel, N.; Melo, W.; Lounis, H.; Rai, S. The optimal class size for object oriented software. IEEE Trans. Softw. Eng. 2002, 28, 494–509. [Google Scholar] [CrossRef]
  73. Seliya, N.; Khoshgoftaar, T.M.; Zhong, S. Analyzing software quality with limited fault-proneness defect data. In Proceedings of the Ninth IEEE International Symposium on High-Assurance Systems Engineering (HASE’05), Heidelberg, Germany, 12–14 October 2005; pp. 89–98. [Google Scholar]
  74. Hall, T.; Beecham, S.; Bowes, D.; Gray, D.; Counsell, S. A systematic review of fault prediction performance in software engineering. IEEE Trans. Softw. Eng. 2012, 38, 1276–1304. [Google Scholar] [CrossRef]
  75. Rathore, S.; Kumar, S. A study on software fault prediction techniques. Artif. Intell. Rev. 2019, 51, 255–327. [Google Scholar] [CrossRef]
  76. Radjenovic, D.; Hericko, M.; Torkar, R.; Zivkovic, A. Software fault prediction metrics: A systematic literature review. Inf. Softw. Technol. 2013, 55, 1397–1418. [Google Scholar] [CrossRef]
  77. Fernandes, E.; Oliveira, J.; Vale, G.; Paiva, T.; Figueiredo, E. A review-based comparative study of bad smell detection tools. In Proceedings of the 20th International Conference on Evaluation and Assessment in Software Engineering, EASE’16, ACM, New York, NY, USA, 1–3 June 2016; pp. 18:1–18:12. [Google Scholar]
  78. Zhang, M.; Hall, T.; Baddoo, N. Code bad smells: A review of current knowledge. J. Softw. Maint. Evol. 2011, 23, 179–202. [Google Scholar] [CrossRef]
  79. Rasool, G.; Arshad, Z. A review of code smell mining techniques. J. Softw. Evol. Process. 2015, 27, 867–895. [Google Scholar] [CrossRef]
  80. Nuñez-Varela, A.; Pérez-Gonzalez, H.; Martínez-Perez, F.; Soubervielle-Montalvo, C. Source code metrics: A systematic mapping study. J. Syst. Softw. 2017, 128, 164–197. [Google Scholar] [CrossRef]
  81. Srinivasan, K.; Devi, T. A comprehensive review and analysis on object-oriented software metrics in software measurement. Int. J. Comput. Sci. Eng. 2014, 6, 247–261. [Google Scholar]
Figure 1. Systematic mapping process.
Applsci 11 11377 g001
Figure 2. Annual trend of publications included in this study.
Applsci 11 11377 g002
Figure 3. Number of studies based on publication types.
Applsci 11 11377 g003
Figure 4. Quality distribution of the selected papers.
Applsci 11 11377 g004
Table 1. Research questions and main motivations.
Research QuestionsMain Motivation
Q1. What kinds of threshold calculation methods exist in the literature?Analyze directions and a good fit for threshold calculation methods.
Q2. What are the quality attributes of the derived thresholds?Identify which quality attributes exist in threshold calculation methods.
Q3. What are the combinations of metrics found in literature?Support metrics threshold calculation studies.
Q4. What are the methodologies used in studies to derive thresholds?Understand the different research methodologies of threshold calculation methods and their implications.
Q5. Which metrics thresholds are found correlated with software quality attributes?Identify relevant and irrelevant metrics for threshold calculation methods.
Table 2. Selection of articles from the different databases at various phases.
DatabaseTotal ResultsInitial ResultsFinal Selection
IEEE Xplore522416
Science Direct642811
Springer46167
Wiley39182
ACM26107
Others1172
Total23810345
Table 3. Inclusion and exclusion criteria.
SourcesCriteriaCategory
Source 1Articles that have been registered are database indexed.Relevant
Source 2Articles that are selected are relevant to Software Engineering.Relevant
Source 3Articles that describe various thresholds in software quality.Relevant
Source 4Articles that discuss different case studies about various metric thresholds.Relevant
Source 5Articles that do not focus on quality issues of software systems.Irrelevant
Source 6Articles that are not related to various metrics values and calculation strategies.Irrelevant
Source 7Articles that are written in languages other than English.Irrelevant
Table 4. Phase, scope, and criteria for selection.
PhasesScopeCriteria for Selection
First PhaseTitle1, 2, 3, 4, 5, 6, and 7
Second PhaseAbstract and Conclusion1, 2, 4, 5, and 6
Third PhaseEntire article3, 4, 5, 6, and 7
Table 5. Summary of thresholds kinds.
TechniquePapers#
Programmer experience[3,33,34,35,36]5
Statistical properties from a corpus[2,7,11,13,15,22,23,25,38,41,42,44,49,50,56,57,58,59,60,61,62,63]23
Quality related[1,14,16,17,18,24,26,38,39,40,52,53,55,64,65,66]16
Review study[27]1
Table 6. Summary of quality attributes under investigation.
Quality AttributesPapers#
Fault detection[1,16,17,18,25,26,35,38,39,43,55,60,62,64,65,66]16
Bad Smells detection[14,34,52,58,59,63]6
Design problems[2,11,15,24,33,40,42,53,56]10
Reuse-proneness[61]1
Table 7. A summary of CK metrics suites.
Metric SuitsPapers
CK only[15,25,35,42,57,61,62,66]
CK combined with size metrics only[18,23,26,50,59,60,63,64]
CK and other metrics[1,2,11,13,17,22,33,34,38,39,40,41,43,55,56,58,65]
No CK metrics[3,7,14,24,44,52,53]
Table 8. Types of studies.
CategoryStudies/Papers
EmpiricalAlves et al. [7], Aman et al. [67], Arar and Ayan [1], Boucher and Badri [18], Barkmann et al. [68], Ferreira et al. [2], Malhotra and Bansal [40], Mihancea and Marinescu [69], Rodriguez et al. [70], Shatnawi et al. [17]
Empirical and TheoreticalAmpatzoglu et al. [71], Al Dallal [52], El Emam et al. [72], Sodiya et al. [33], Shatnawi [62]
Theoretical and ReviewBeranic and Hericko [3], Ronchieri and Canaparo [27]
Publisher’s Note: MDPI stays neutral with regard to jurisdictional claims in published maps and institutional affiliations.

