Article

Development of a Novel Adsorbent Prepared from Dredging Sediment for Effective Removal of Dye in Aqueous Solutions

by
Abdelkader Ouakouak
1,2,*,
Messameh Abdelhamid
1,
Barhoumi Thouraya
3,
Hadj-Otmane Chahinez
1,
Grabi Hocine
4,
Noureddine Hamdi
3,5,
Achmad Syafiuddin
6,* and
Raj Boopathy
7
1
Research Laboratory in Subterranean and Surface Hydraulics, University of Biskra, P.O. Box 145, Biskra 07000, Algeria
2
Hydraulic and Civil Engineering Department, University of El Oued, P.O. Box 789, El Oued 39000, Algeria
3
Laboratory of Composite Materials and Clay Minerals, CNRSM, Technopole Borj Cedria, P.O. Box 73, Soliman 8027, Tunisia
4
Laboratory of Applied Chemistry & Chemical Engineering, Faculty of Science, UMMTO BP17, Tizi-Ouzou 15000, Algeria
5
Higher Institute of Water Sciences and Techniques, University of Gabès, Zrig 6072, Tunisia
6
Department of Public Health, Universitas Nahdlatul Ulama Surabaya, Surabaya 60237, Indonesia
7
Department of Biological Sciences, Nicholls State University, Thibodaux, LA 70310, USA
*
Authors to whom correspondence should be addressed.
Appl. Sci. 2021, 11(22), 10722; https://doi.org/10.3390/app112210722
Submission received: 25 October 2021 / Revised: 9 November 2021 / Accepted: 11 November 2021 / Published: 13 November 2021
(This article belongs to the Special Issue Water-Energy-Environment Nexus (WEEN-2021))

Abstract

:
This study proposed a novel and low-cost adsorbent prepared from dredging sediment (DSD) for effective removal of dye in aqueous solutions. The adsorption efficiency and behavior of the DSD adsorbent toward the crystal violet (CV), a cationic dye, were investigated via batch experiments. The results showed that DSD samples contain mainly clay minerals (illite and kaolinite) and other mineral phases. In addition, DSD is a mesoporous material (Vmesopore = 94.4%), and it exhibits a relatively high surface area (~39.1 m2/g). Adsorption experiments showed that the solution’s pH slightly affects the adsorption process, and a pH of 11 gave a maximum capacity of 27.2 mg/g. The kinetic data of CV dye adsorption is well described by the pseudo–second-order and the Avrami models. The Langmuir and Liu isotherm models provide the best fit for the adsorption equilibrium data. The monolayer adsorption capacity of Langmuir reached 183.6, 198.0, and 243.6 mg/g at 293, 308, and 323 K, respectively. It was also found that the adsorption process was spontaneous (−ΔG°), exothermic (−∆H°), and increased the randomness (+∆S°) during the adsorption operation. The primary mechanisms in CV dye adsorption were ion exchange and pore filling, whereas electrostatic attraction was a minor contribution. In addition, three steps involving intraparticle diffusion occur at the same time to control the adsorption process. The results of this study highlight the excellent efficiency of DSD material as an ecofriendly sorbent for toxic dyes from water media.

1. Introduction

Dyes, colored compounds, present a serious environmental problem due to the difficulty of treating the contaminated wastewaters by conventional methods. Synthetic dyes have largely supplanted natural dyes, as they offer a wider range of colors and are less expensive to produce [1]. The textile industry discharges wastewater containing toxic dyes, and around 2–20% are directly rejected as liquid effluents into the environment [2]. Most of these dyes are of synthetic origin and toxic in nature, with suspected genotoxic and carcinogenic effects as well as low biodegradability [3,4]. Crystal violet (CV)—a cationic dye—has been shown to limit photosynthesis in aquatic plants [5]. Removal of CV dye from water by adsorption technique has been widely studied in several previous studies [6,7]. For example, natural clays collected from different locations in the Albaha region, Saudi Arabia, was proven to have the capability to remove CV via exothermic processes [8]. In addition, the use of a natural clay mineral with illite and kaolinite functioned as the major component for the removal of methylene blue and CV [6]. The study found that the adsorption of methylene blue and CV to the illitic–kaolinite natural clay can be described by endothermic and exothermic processes, respectively. Therefore, adsorption has been regarded as one of the most efficient treatment methods due to its simplicity, availability, and high efficiency of pollutant separation.
Today, soils (clays, sands, sediments, etc.) have found widespread utilization as alternative adsorbents in wastewater treatment due to their advantages such as low toxicity, abundant availability, good cation exchange capacity, and important textural proprieties. Dredging operations are defined as the excavation of sediment deposits from the seabed, lake, river, or dams [9]. Currently, a hundred million of these sediments are dredged from underwater each year over the world [10]. Countries in North Africa are very affected by the siltation of dams, which is a complex phenomenon. In Algeria, the average mud deposits volume in reservoir dams is estimated at 20 million m3 per year [11]. This situation causes a reduction of 0.3% per year in the storage capacity of water [12].
There are 1150 million m3 volumes of sediment in the Algerian watersheds, and some dredging operations are thus performed periodically [13]. In recent years, large amounts of sediment have been produced from the dredging activities of Algerian dams. Therefore, it became necessary to search for a strategy for valuing these soils. Dredged sediment from dams (DSD) has complex compositions and is often rich in organic matter, clay minerals, water, and microorganisms, and it frequently contains various organic and inorganic pollutants [14].
In previous studies, the use of dredged materials from rivers, lakes, and reservoir sediments to construct building materials has been well studied [9,15,16,17]. However, little research has focused on using DSD as an alternative material for the adsorption of pollutants from water media. Therefore, this work’s objectives are (1) to investigate the physicochemical, textural and mineralogical characteristics of DSD material from Foum El Gherza dam (Algeria) and (2) to study its application in removing crystal violet (CV) dye from aqueous solutions. Several characteristics of DSD samples have been outlined by using XRD, XRF, FTIR, BET-N2, and point of zero charge (pHPZC) analysis to learn more about the properties of DSD powder properties. Batch adsorption tests of CV dye were studied by varying pH value (3–11), stirring time (0–300 min), adsorbate concentration (4–250 mg/L), and temperature (20–50 °C) to explore the sorption behavior (capacity and mechanisms) of CV dye onto DSD adsorbent. The application of different mathematical models to analyze the kinetics and isotherm data was also investigated herein.

2. Materials and Methods

2.1. Materials and Reagents

In this study, dredged sediment from dam was acquired from Foum El Gherza dam in the Biskra region (Algeria). All organic impurities of grass were removed from the starting material. Then, the selected mud was washed with deionized water, dried at 75 °C, and then crushed. A total of 10 g of purified powder were sieved to obtain particles smaller than 80 m, labeled as dam dredging sediment, and used for further examinations. The CV dye (generic name: basic violet 3, color index number: 42555) was acquired from Aldrich (St Louis, MO, USA) and was of analytical reagent grade. Further specifications of CV dye are shown in Table 1. All solutions were prepared with deionized water. Other chemical additives such as HCl or NaOH were used to adjust the pH of the solutions.

2.2. Properties of DSD Material

The chemical composition of the studied sediment was studied by X-ray fluorescence (XRF) spectroscopy. The structural characteristics of the DSD adsorbent were determined by X-ray diffraction (XRD) using a “Bruker D4 ENDEAVOR” diffractometer operating with monochromated CuKα radiation (at 30 mA and 40 kV). The radial scans were acquired over the (2θ) range of 4–60° with a scanning rate of 2°. min−1.
FTIR Affinity-1 Shimadzu apparatus was used for the Fourier Transformed Infrared (FTIR) analysis. Measurements were collected in the scan range of 400–4000 cm−1 using the KBr disc method (1/100 wt %). The porous properties of adsorbent were obtained by N2 adsorption–desorption technique using a Quadrasorb apparatus (Quantachrome, Boynton Beach, FL, USA) at 77.35 K. The specific surface area (SBET) and volume of pore (VTotal) were calculated according to the Brunauer–Emmett–Teller method [18], and the pore size distribution was calculated by fitting the Barrett–Joyner–Hallender (BJH) model. The acidic–basic surface characteristics of the DSD adsorbent were studied according to the solid addition method as described by Rouahna et al. (2020) [19]. A total of 50 mL of 0.01 M NaCl solution was kept in series of flasks (100 mL); the initial pH (pH0) of each sample was adjusted to a pH range of 3–11. Then, 50 mg of DSD material were added to each flask and the mixtures were stirred for 24 h. Finally, the final pH (pHF) was measured for all solutions and the pHPZC value was determined graphically.

2.3. Adsorption Experiments

The influence of several operating parameters on the adsorption of CV dye onto DSD powder was investigated by performing several batch experiments. Tests were executed by varying the solution’s pH (3–11), contact time (0–300 min), and temperature (20–50 °C) with a dye initial concentration of 30 mg/L and at a fixed adsorbent dosage of 30 mg/30 mL (at a temperature of 20 °C ± 1). The adsorption isotherm was studied with adsorbate concentrations ranging from 4 to 250 mg/L at neutral pH (~7.0).
The mixtures (DSD-dye solution) were stirred at speed of 150 rpm for the desired time, and then filtered using a 0.45 μm membrane filter. The residual dye content in solution was determined using ultraviolet visible spectrophotometry at λmax: 590 nm. Each experiment was carried out in triplicate and the average value was reported.

2.4. Calculation and Analysis of Data

The quantity of dye that was eliminated from water at equilibrium (qe; mg/g), and time t (qt; mg/g) was estimated using equations (Equations (1) and (2)) of the mass balance as follows:
q e = ( C o C e ) m V
q t = ( C o C t ) m V
where Co (mg/L), Ct (mg/L), and Ce (mg/L) are the CV dye concentration at beginning, at time t, and at equilibrium; V (L) is the volume of solution, whereas m (g) represents the mass of DSD used.
The kinetic data were described mathematically using three reaction kinetic models and the diffusion model. The general forms of the pseudo–first-order, pseudo–second-order [20], and Avrami fractional-order [21] models are given by Equations (3)–(5), respectively. The linear form of intraparticle diffusion model was expressed in Equation (6) [22]. Moreover, the adsorption isotherms were investigated to gain insights on the distribution of adsorbate at the adsorbent-solution interface. The experimental data of CV adsorption isotherm at different temperatures were fitted to the Langmuir [20], Freundlich [23], Redlich Peterson [24], and Liu [25] isotherm models (Equations (7)–(10)). All equations and relevant parameters of the aforementioned models (for kinetic and isotherm) have been listed in Table 2.
The best model representing the sorption mechanism can be selected by calculating the difference between the qe in mg/g (or qt) values of the experiment (qe,exp or qt,exp) and values of the model (qe,cal or qt,cal), which are reflected through the coefficient of correlation (R2), standard deviation (SD), and chi-squared test (χ2) [7,26]:
R 2 = 1 ( q e , exp q e , cal ) 2 ( q e , exp q e , m e a n ) 2
S D = ( 1 n p ) × [ i = 1 n ( q e , exp q e , cal ) 2 ]
χ 2 = ( q e , exp q e , cal ) 2 q e , cal
where qe, mean (mg/g) is the mean of qe experimental values; n is the number of observations; p is the number of parameters in the selected equation. The best suitable model gives the largest value of (R2), but the lowest SD and χ2 values.
The standard Gibbs free energy change of CV dye adsorption onto DSD can be computed by the following equations:
Δ G 0 = R T . ln ( K C )
The relationship of Δ to Δ and Δ is given by:
Δ G 0 = Δ H 0 T Δ S 0
In this study, the KC derived from Langmuir equilibrium constant (KL, L/mg) was used to calculating the thermodynamic parameters. According to Zhou and Zhou, (2014) [27], KC should be a dimensionless parameter with the following definition:
K C K L ( L / m g ) × M W × 55.5 × 10 3
where R is the universal gas constant (0.00831 KJ/mol × K), T is the temperature (T, Kelvin), and MW is the molecular weight of adsorbate (g/mol).
The Van’t Hoff equation (Equation (17)) [7], given by substituting Equation (14) into Equation (15), was used to calculate the enthalpy change (Δ) and entropy change (Δ).
ln K C = Δ H ° R × 1 T + Δ S ° R

3. Results

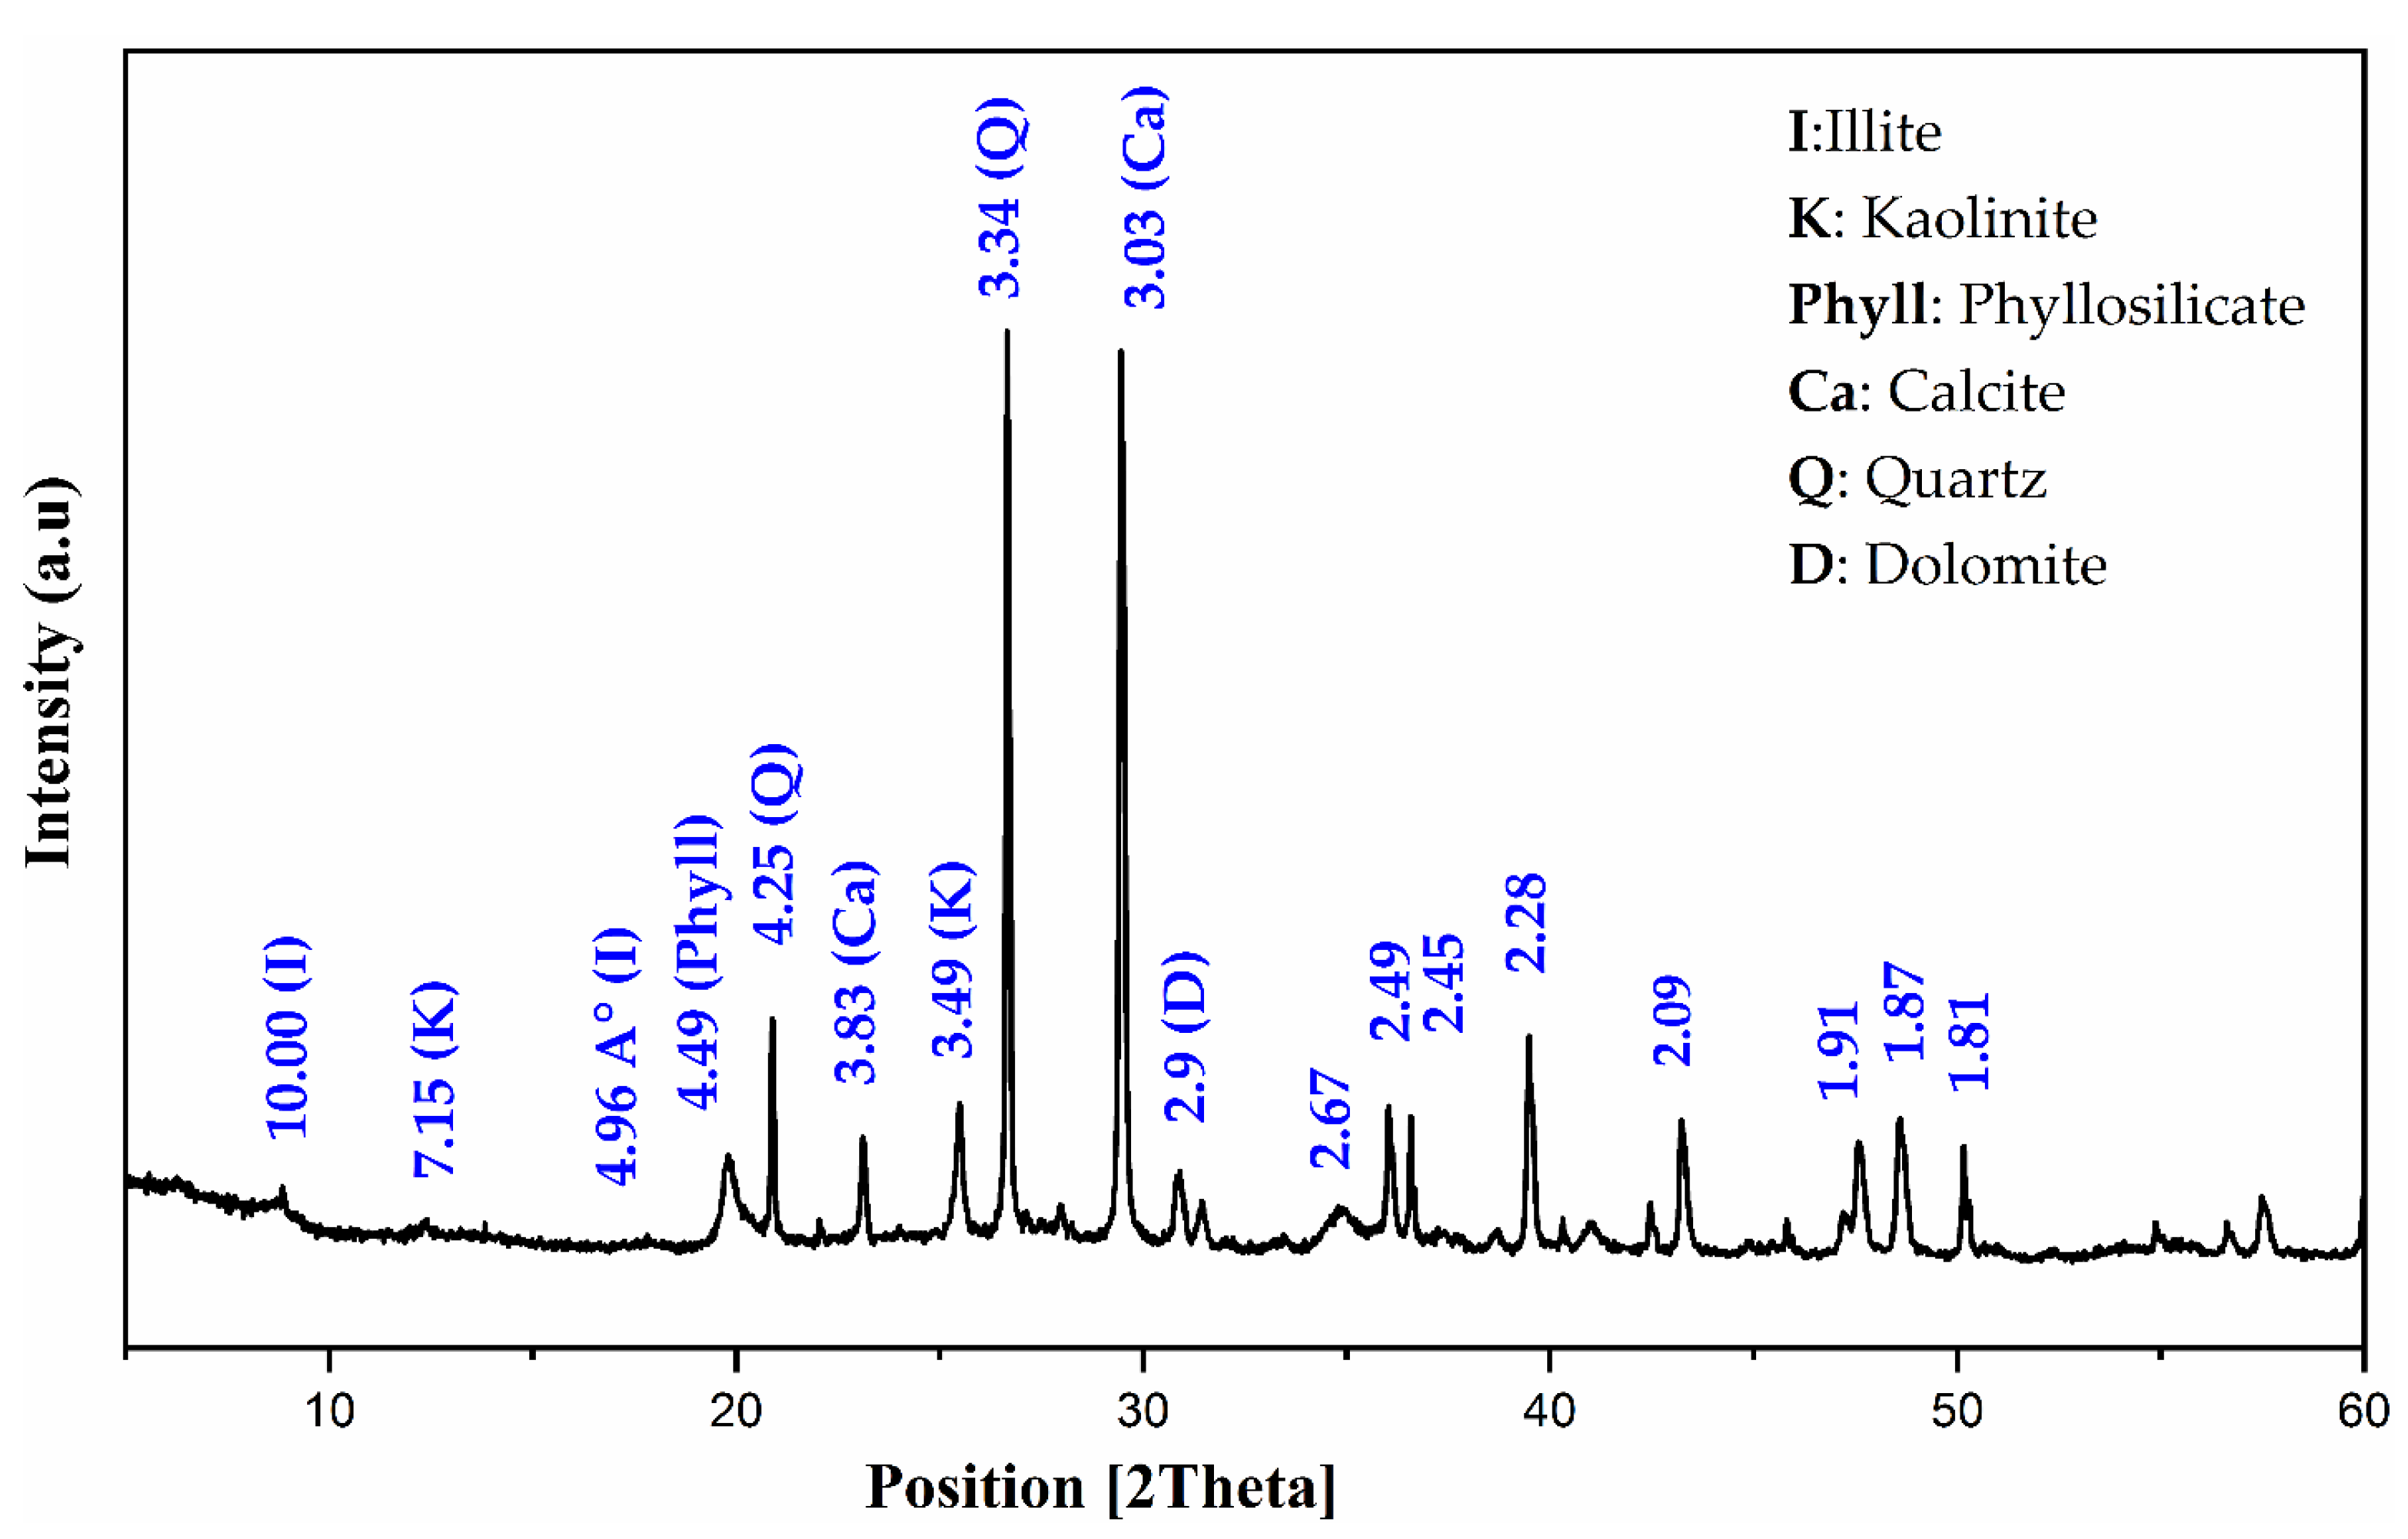
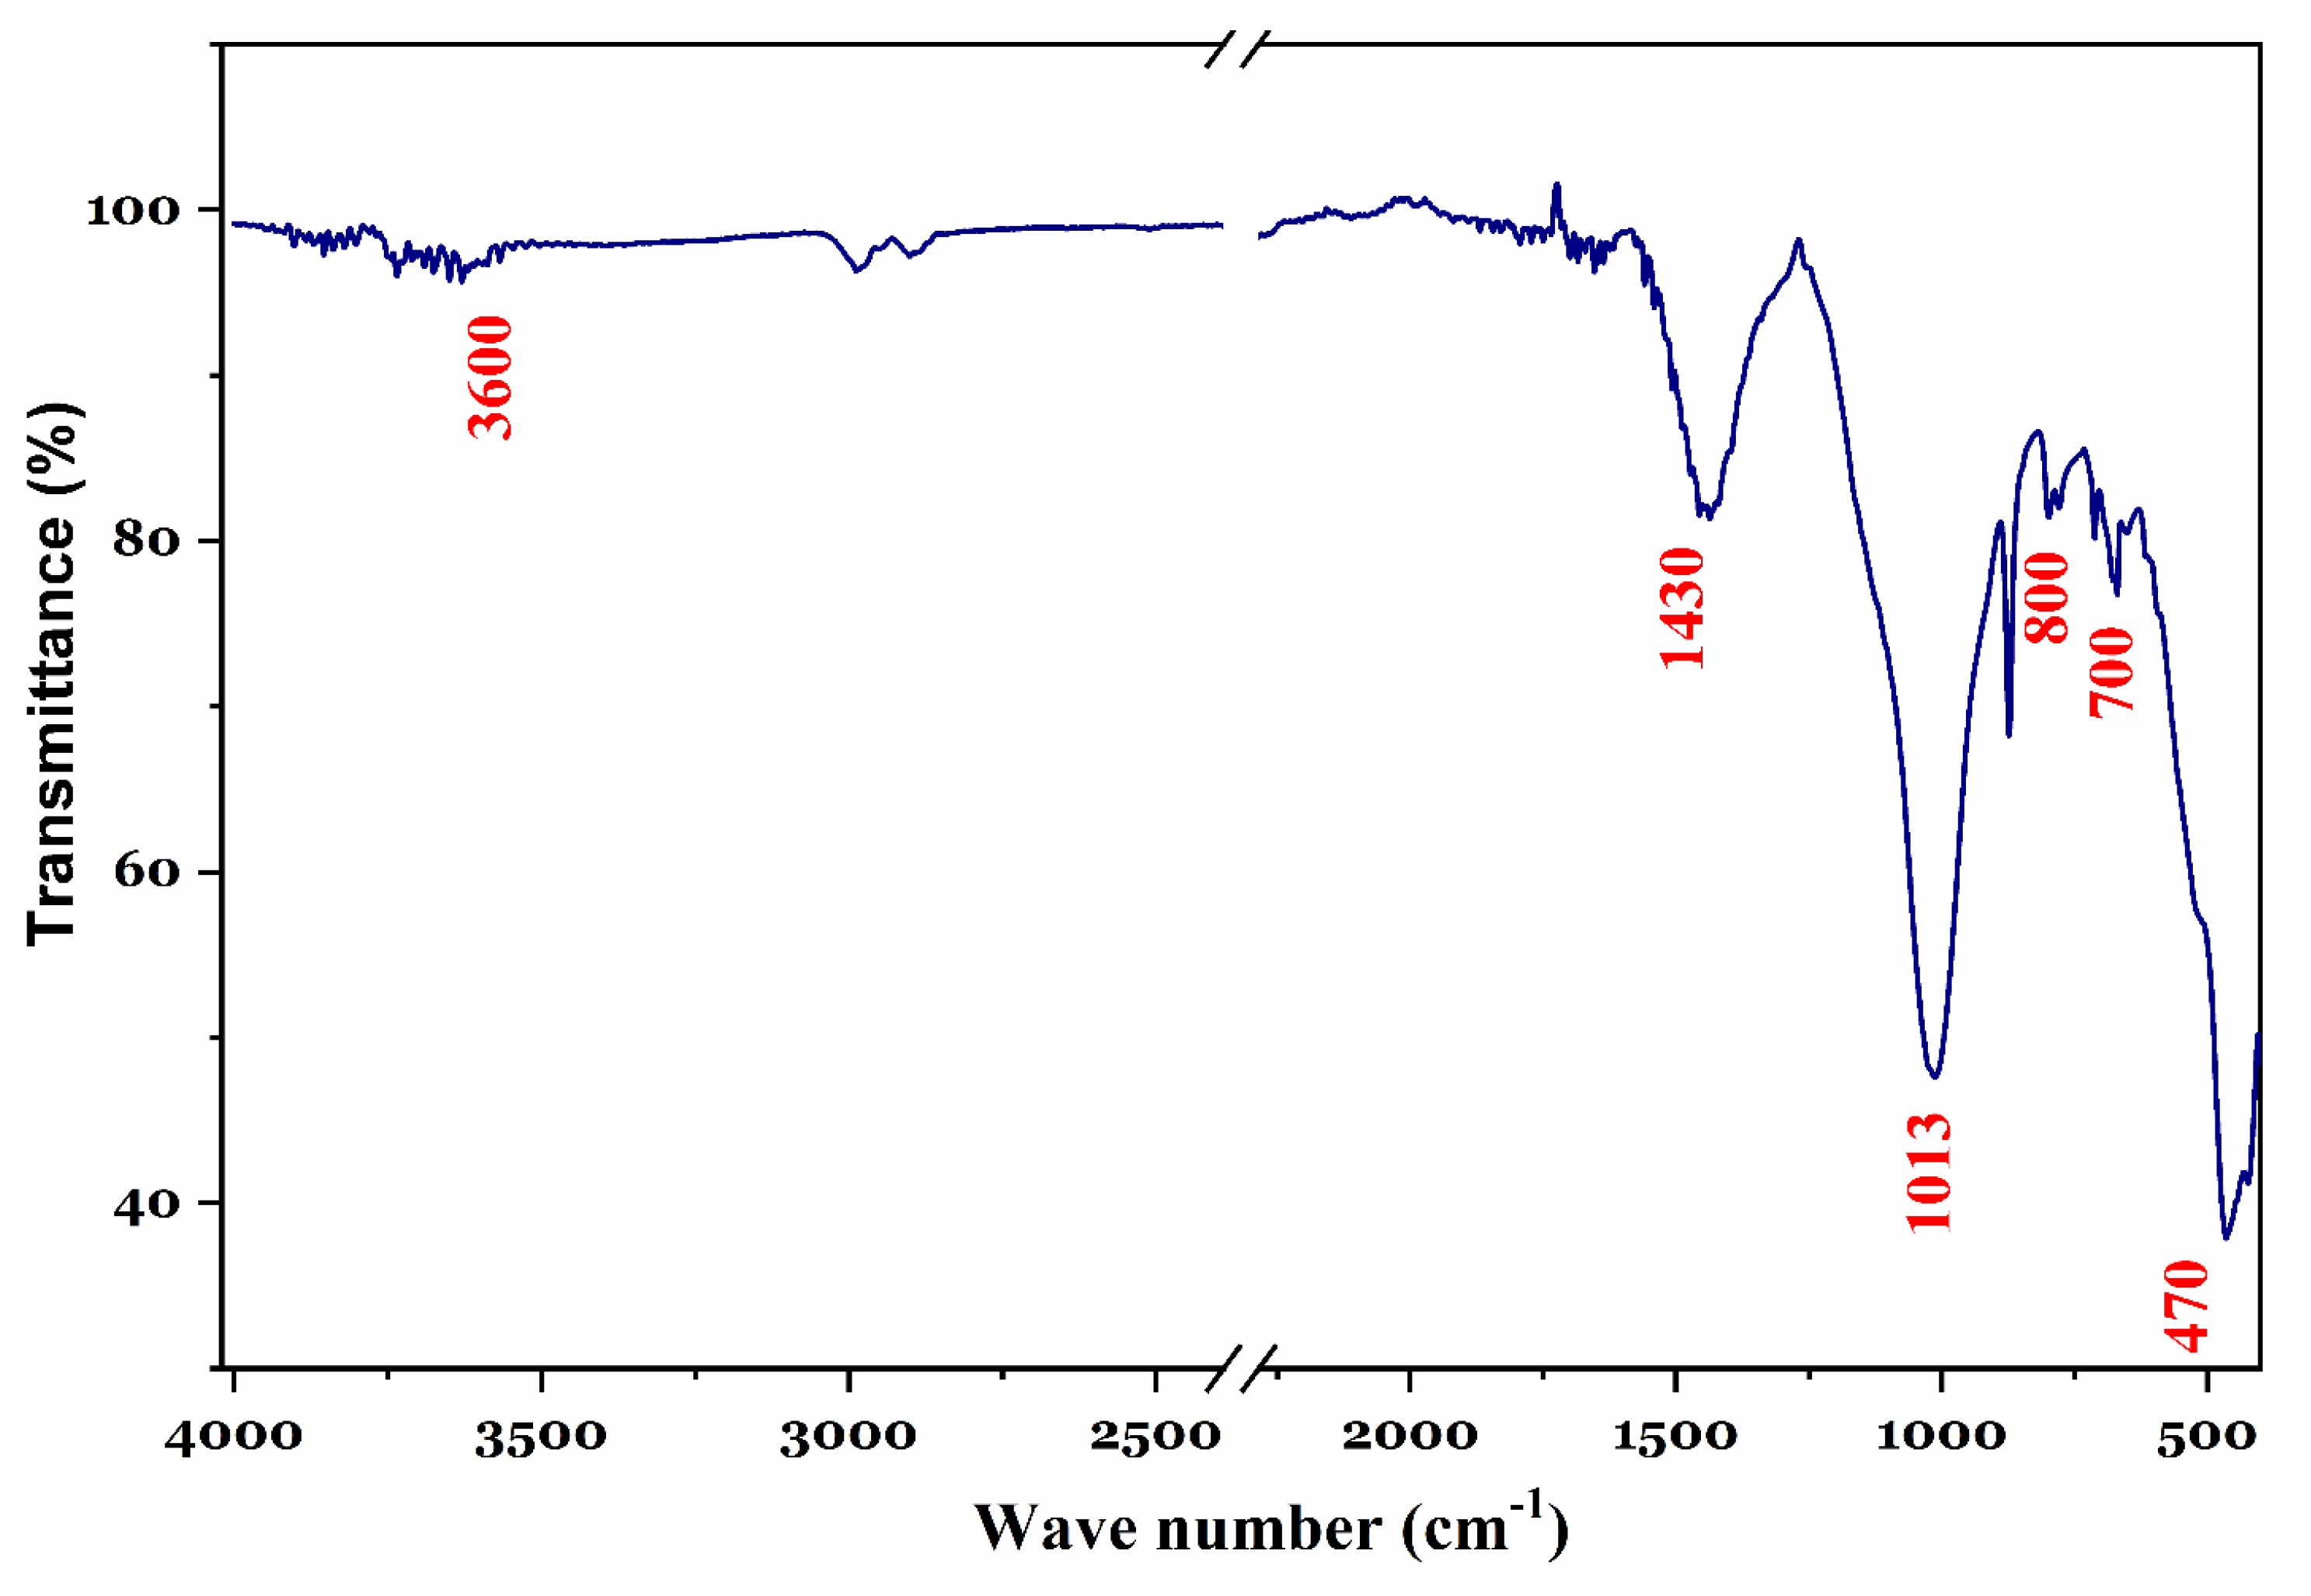
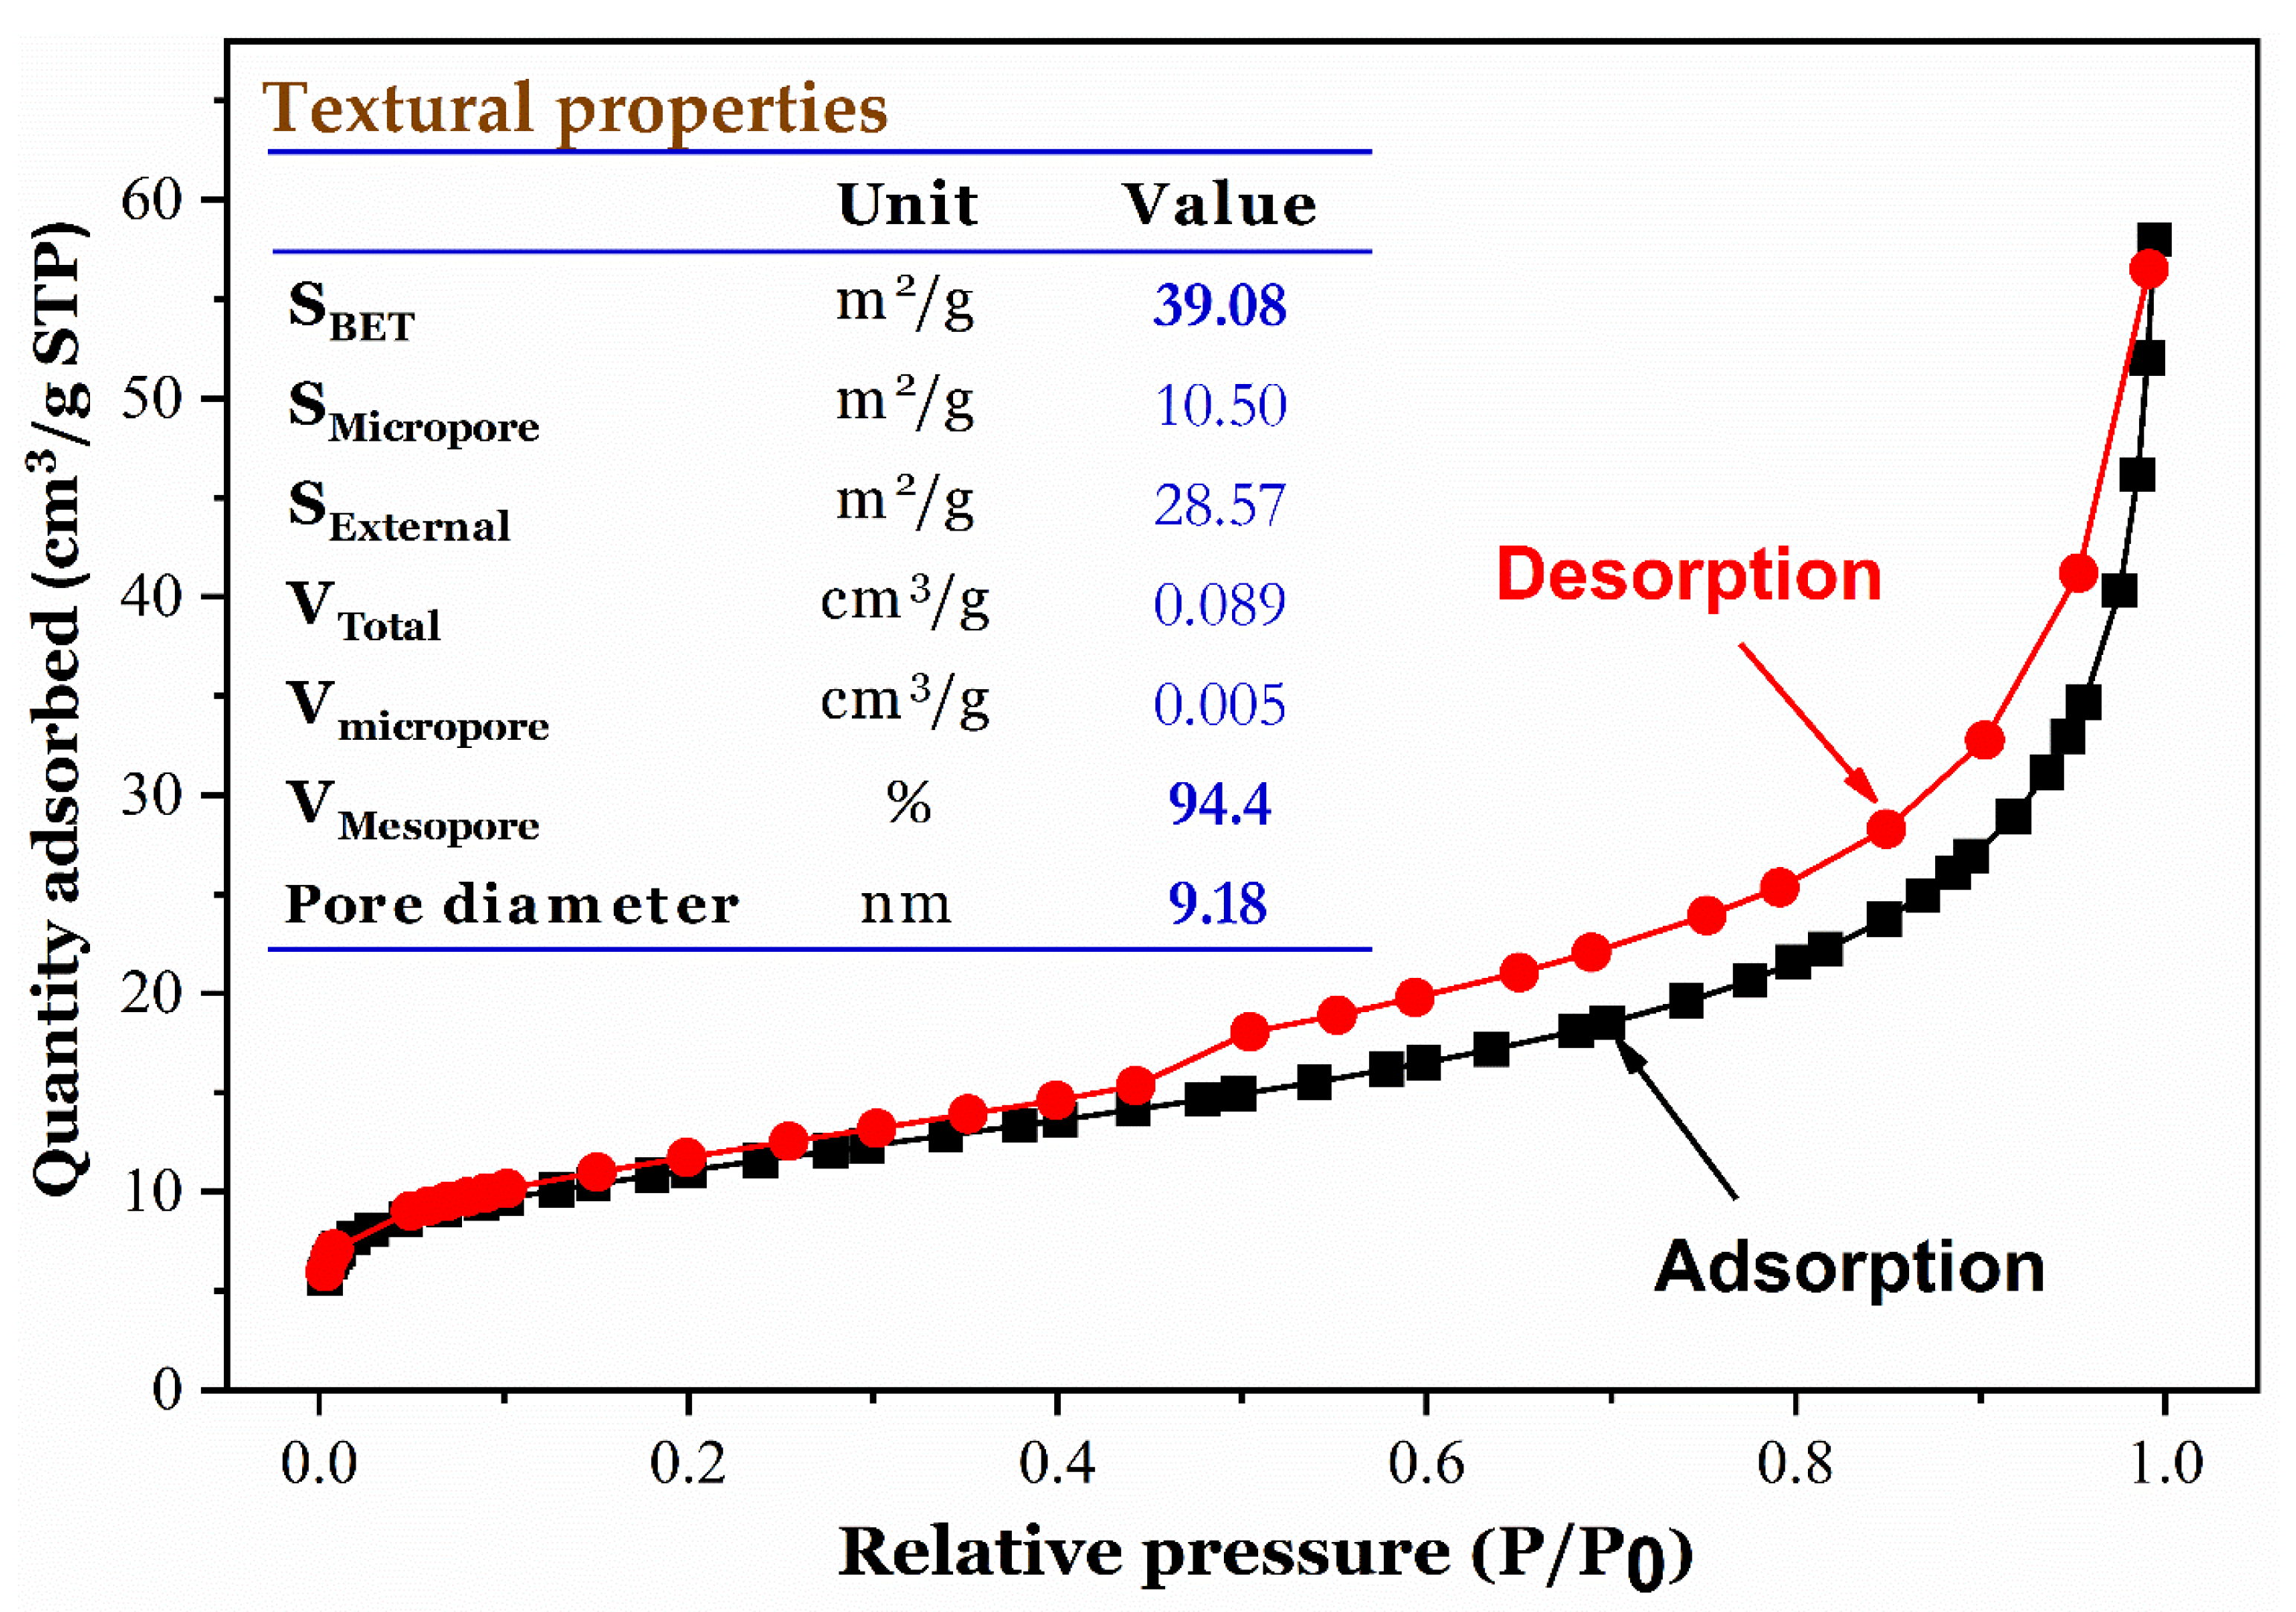
3.1. Characterization of DSD Samples

Results of X-ray powder diffraction of DSD sample are presented in Figure 1. XRD pattern shows a diffractometric reflects of clay minerals (illite and kaolinite) and others mineral phases. Illite phase displays peaks at 10.0 and 4.96 Å. Two peaks are appeared at 7.15 and 3.49 Å which corresponds to kaolinitic clay. This finding is in a good agreement with the study of Barhoumi et al. (2019) [28]. The XRD spectrum also confirms that DSD material contains quartz (Q), calcite (Ca), and dolomite (D) as non-clay minerals.
The chemical analysis values for the sample are represented in Table 3 and show that the main oxides detected in DSD are SiO2, CaO, Al2O3, Fe2O3, and MgO. Composition of the studied sediment shows the predominance of silica (SiO2) and alumina (Al2O3) mineral of the illite and kaolinite clays. CaO and MgO content indicate the presence of calcite (CaCO3) and dolomite (Ca Mg (CO3)2) [16]. The content of Fe2O3 and K2O confirms the presence of illite phase [29]. As can also be observed, the percentage of iron oxide is important, which gives the sediment its red color.
The infrared spectrum (IR) of the DSD sample is shown in Figure 2, which revealed important information. The presence of quartz in the powder is indicated by the two bands near 700 cm−1 and 800 cm−1, which confirm the XRD results. The vibration bands appearing at 1430 cm−1 are attributed to the carbonate in the form of calcite or dolomite [30]. The band detected near 3620 cm−1 corresponds to the stretching vibrations of coordinated water [31]. The (Si-O) of the silicate structure corresponds to the very strong absorption band at 1013 cm−1.
Figure 3 shows the physisorption isotherm of the N2 gas adsorption–desorption of the DSD sample. All the textural characteristics (i.e., properties of specific surface and pores) are calculated from data of this analysis. According to the IUPAC nomenclature, the N2 plot belongs of type IV with a H3 hysteresis loop which appeared at pressure (P/P0) higher than 0.3. This result suggested that the SDS material has a predominantly mesoporous structure (Vmesopore = 94.4%) with average pores diameter centered at 9.18 nm [32]. Data in Figure 3 show also that the DSD material exhibited a good surface area (SBET = 39.08 m2/g) but relatively low total pore volume (VTotal = 0.089 cm3/g).
The zero-point charge pH (pHPZC) of the DSD adsorbent was found at 7.81 (Figure 4a), which indicates the basic nature of its surface. At this point of pH, the overall surface charge of the material is zero [33]. When the pH of the solution is higher than pHPZC, the DSD surface will be negatively charged, and vice versa [34]. This can also provide insight into the role of electrostatic interactions in the adsorption mechanism [35]. In this study, the adsorption experiments of isotherm were performed at pH = 7.0, implying that the DSD’s surface was mostly positively charged and the ion exchange can occur.

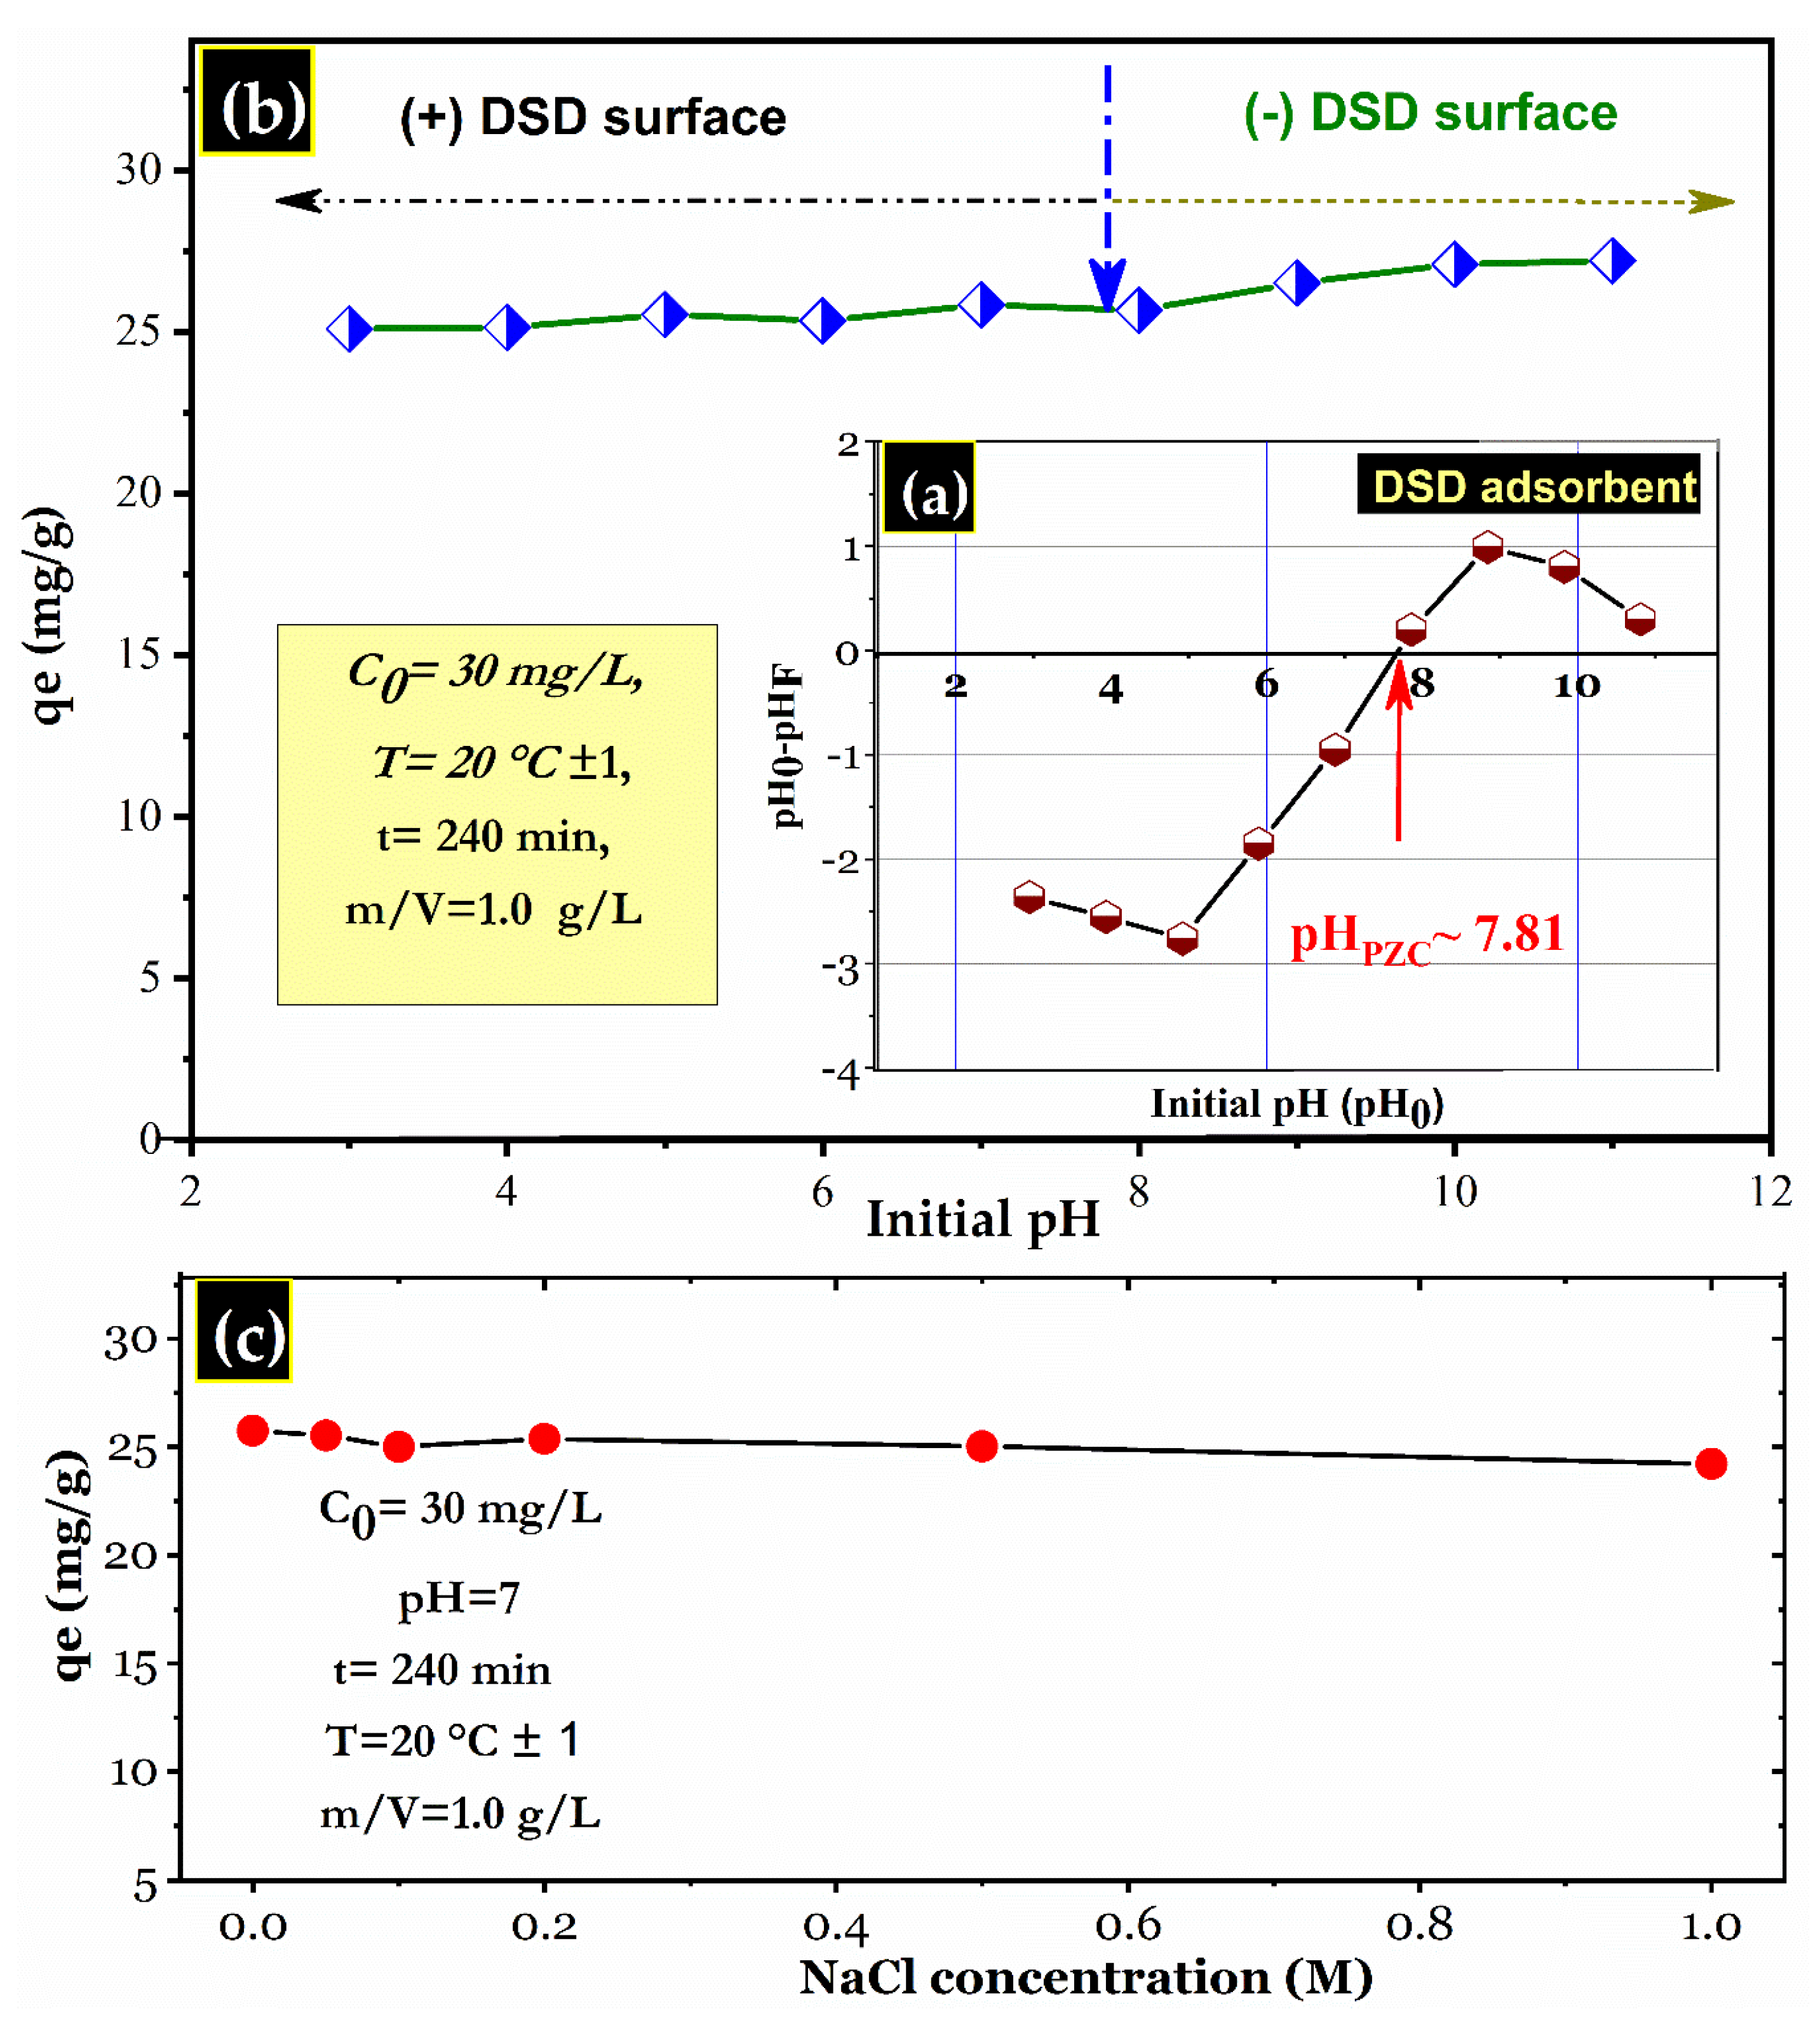
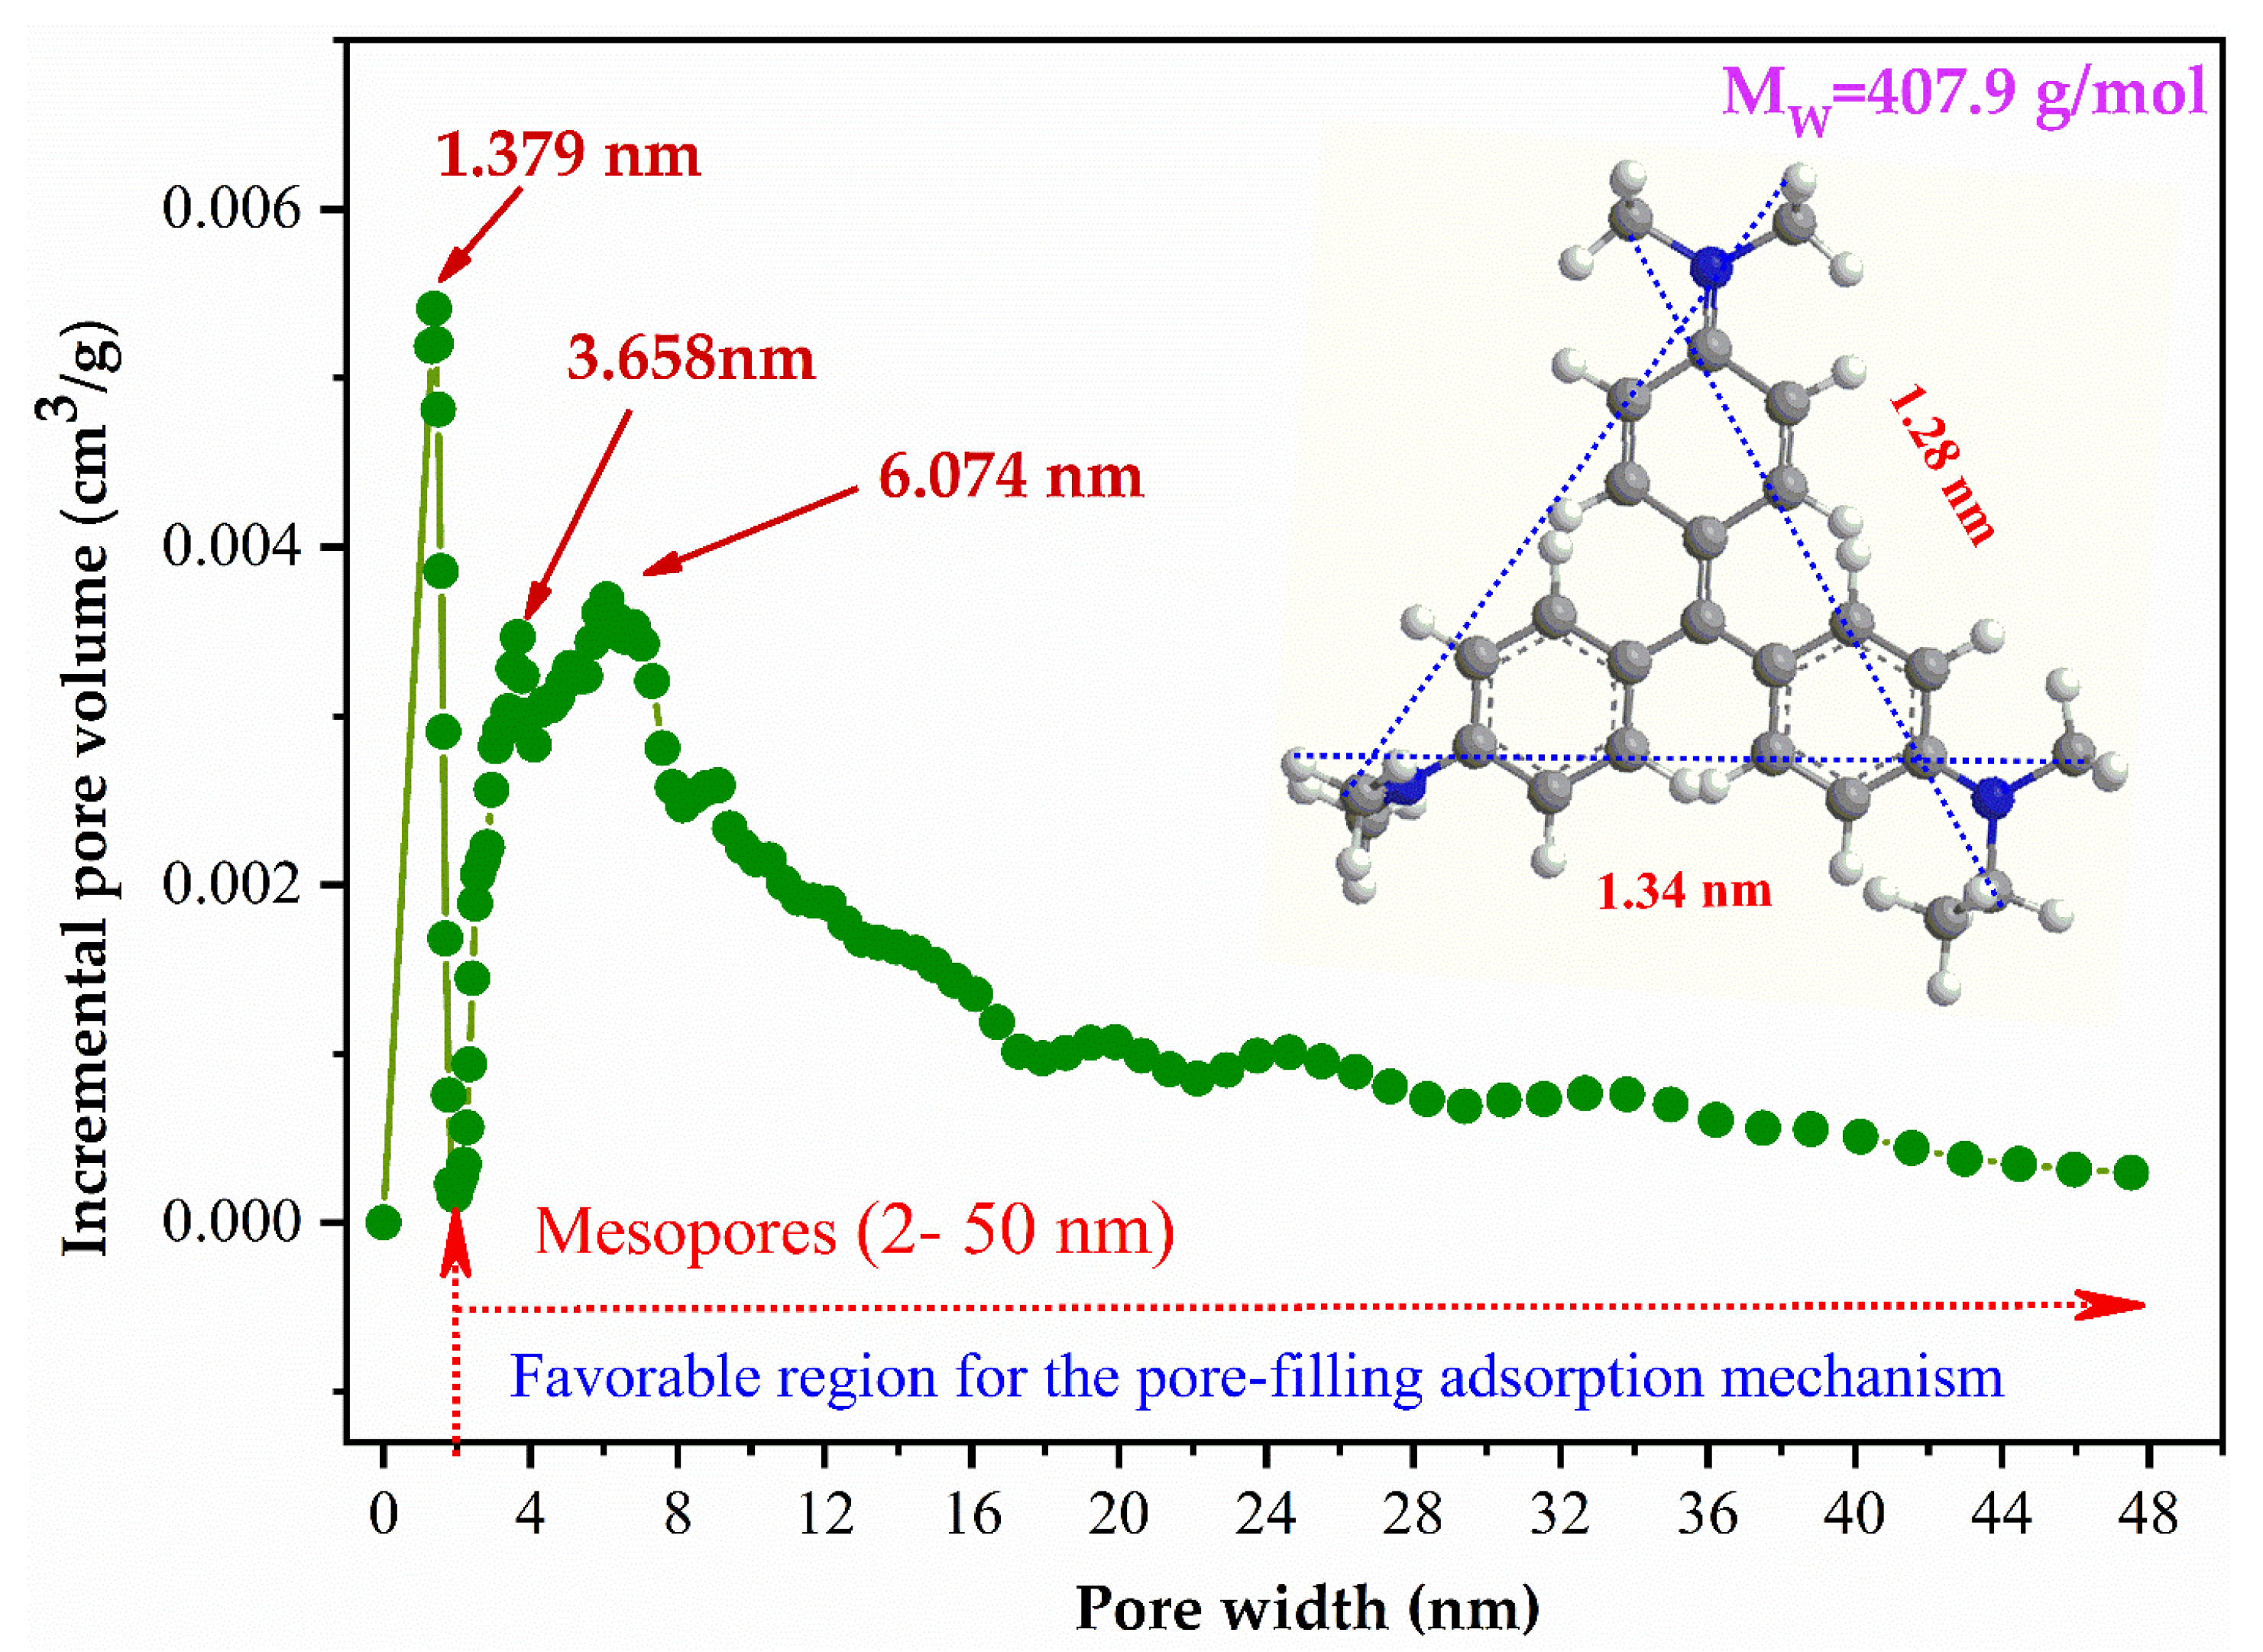
3.2. Adsorption Mechanism

The solution pH is an important element in the mechanism investigations since it influences the dominant adsorbate species and the surface charge of the solid. In this study, the influence of pH on adsorption efficiency of CV dye was studied by fixing stirring time at 240 min and an initial dye concentration of 30 mg/L by using 1 g/L DSD. Results show that pH was found to have little effect on the CV dye removal by DSD adsorbent, which is illustrated in Figure 4b. This observation is consistent with findings of other researchers for the removal of cationic dyes using different kinds of soils [36,37].
At pH ranging from 3 to 11, the adsorption capacity increases slightly with increasing pH values. The basic condition (pH = 11) was more favorable for the CV dye adsorption with a maximum uptake of 27.19 mg/g. The slight improvement of adsorption efficiency can be explained by the weak role of electrostatic attraction between the negative surface charges of DSD material and the positive charge of CV+ dye at pH above pHPZC. The hydroxyl groups on the solid surface are ionized (such as Al-OH and Si-OH) at high pH values and give it a negative charge [31,38].
In contrast, the DSD adsorbent reacts as a positive surface at pH levels lower than pHPZC and does not favor the attraction forces with CV+ adsorbate. Additionally, the competition between the H+ protons and the C25H30N3+ dye can occurred at acid pH, which slightly decreases the CV removal efficiency [39].
The effect of ionic strength on the adsorption capacity (qe, mg/g) was investigated further to better understand the role of electrostatic attraction in the dye removal process. As shown in Figure 4c, the adsorption efficiency was not significantly influenced by the variation of ionic strength in the range 0 M to 1.0 M. This finding suggests that electrostatic attraction forces play a minor part in the adsorption process, which was confirmed previously in the pH effect study presented in Figure 4b. Hence, the electrostatic attraction is a secondary mechanism in removing CV dye by DSD adsorbent.
The cationic dye removal onto clay is mostly occurred through cation exchange between, i.e., CV+ and the clay’s exchangeable cations (sodium, calcium, potassium, etc.) [40]. The cations released leave the clay surface with negative charge. Hence, the cationic dye molecules are attracted by the negatively charged surface of clay [41]. Other adsorption mechanisms can take place, such as pore filling or simply adsorption [38,42].
This study found that the mesopore volume of DSD powder was dominant, and it was found to be about 94.4% of the total pore volume. Therefore, the adsorption of dye molecules onto the meso-pores network through pore-filling process is very expected. In addition, the distribution of pore size was predominantly located at around 1.278, 3.658, and 6.074 nm (Figure 5). Thus, the pore filling of CV dye molecules with a molecular size of 1.28 nm and 1.34 nm can be an adequate mechanism during the adsorption process onto the DSD adsorbent. The existence of the intraparticle diffusion mechanism and their steps will be further discussed in the next section (stirring time and kinetic study).

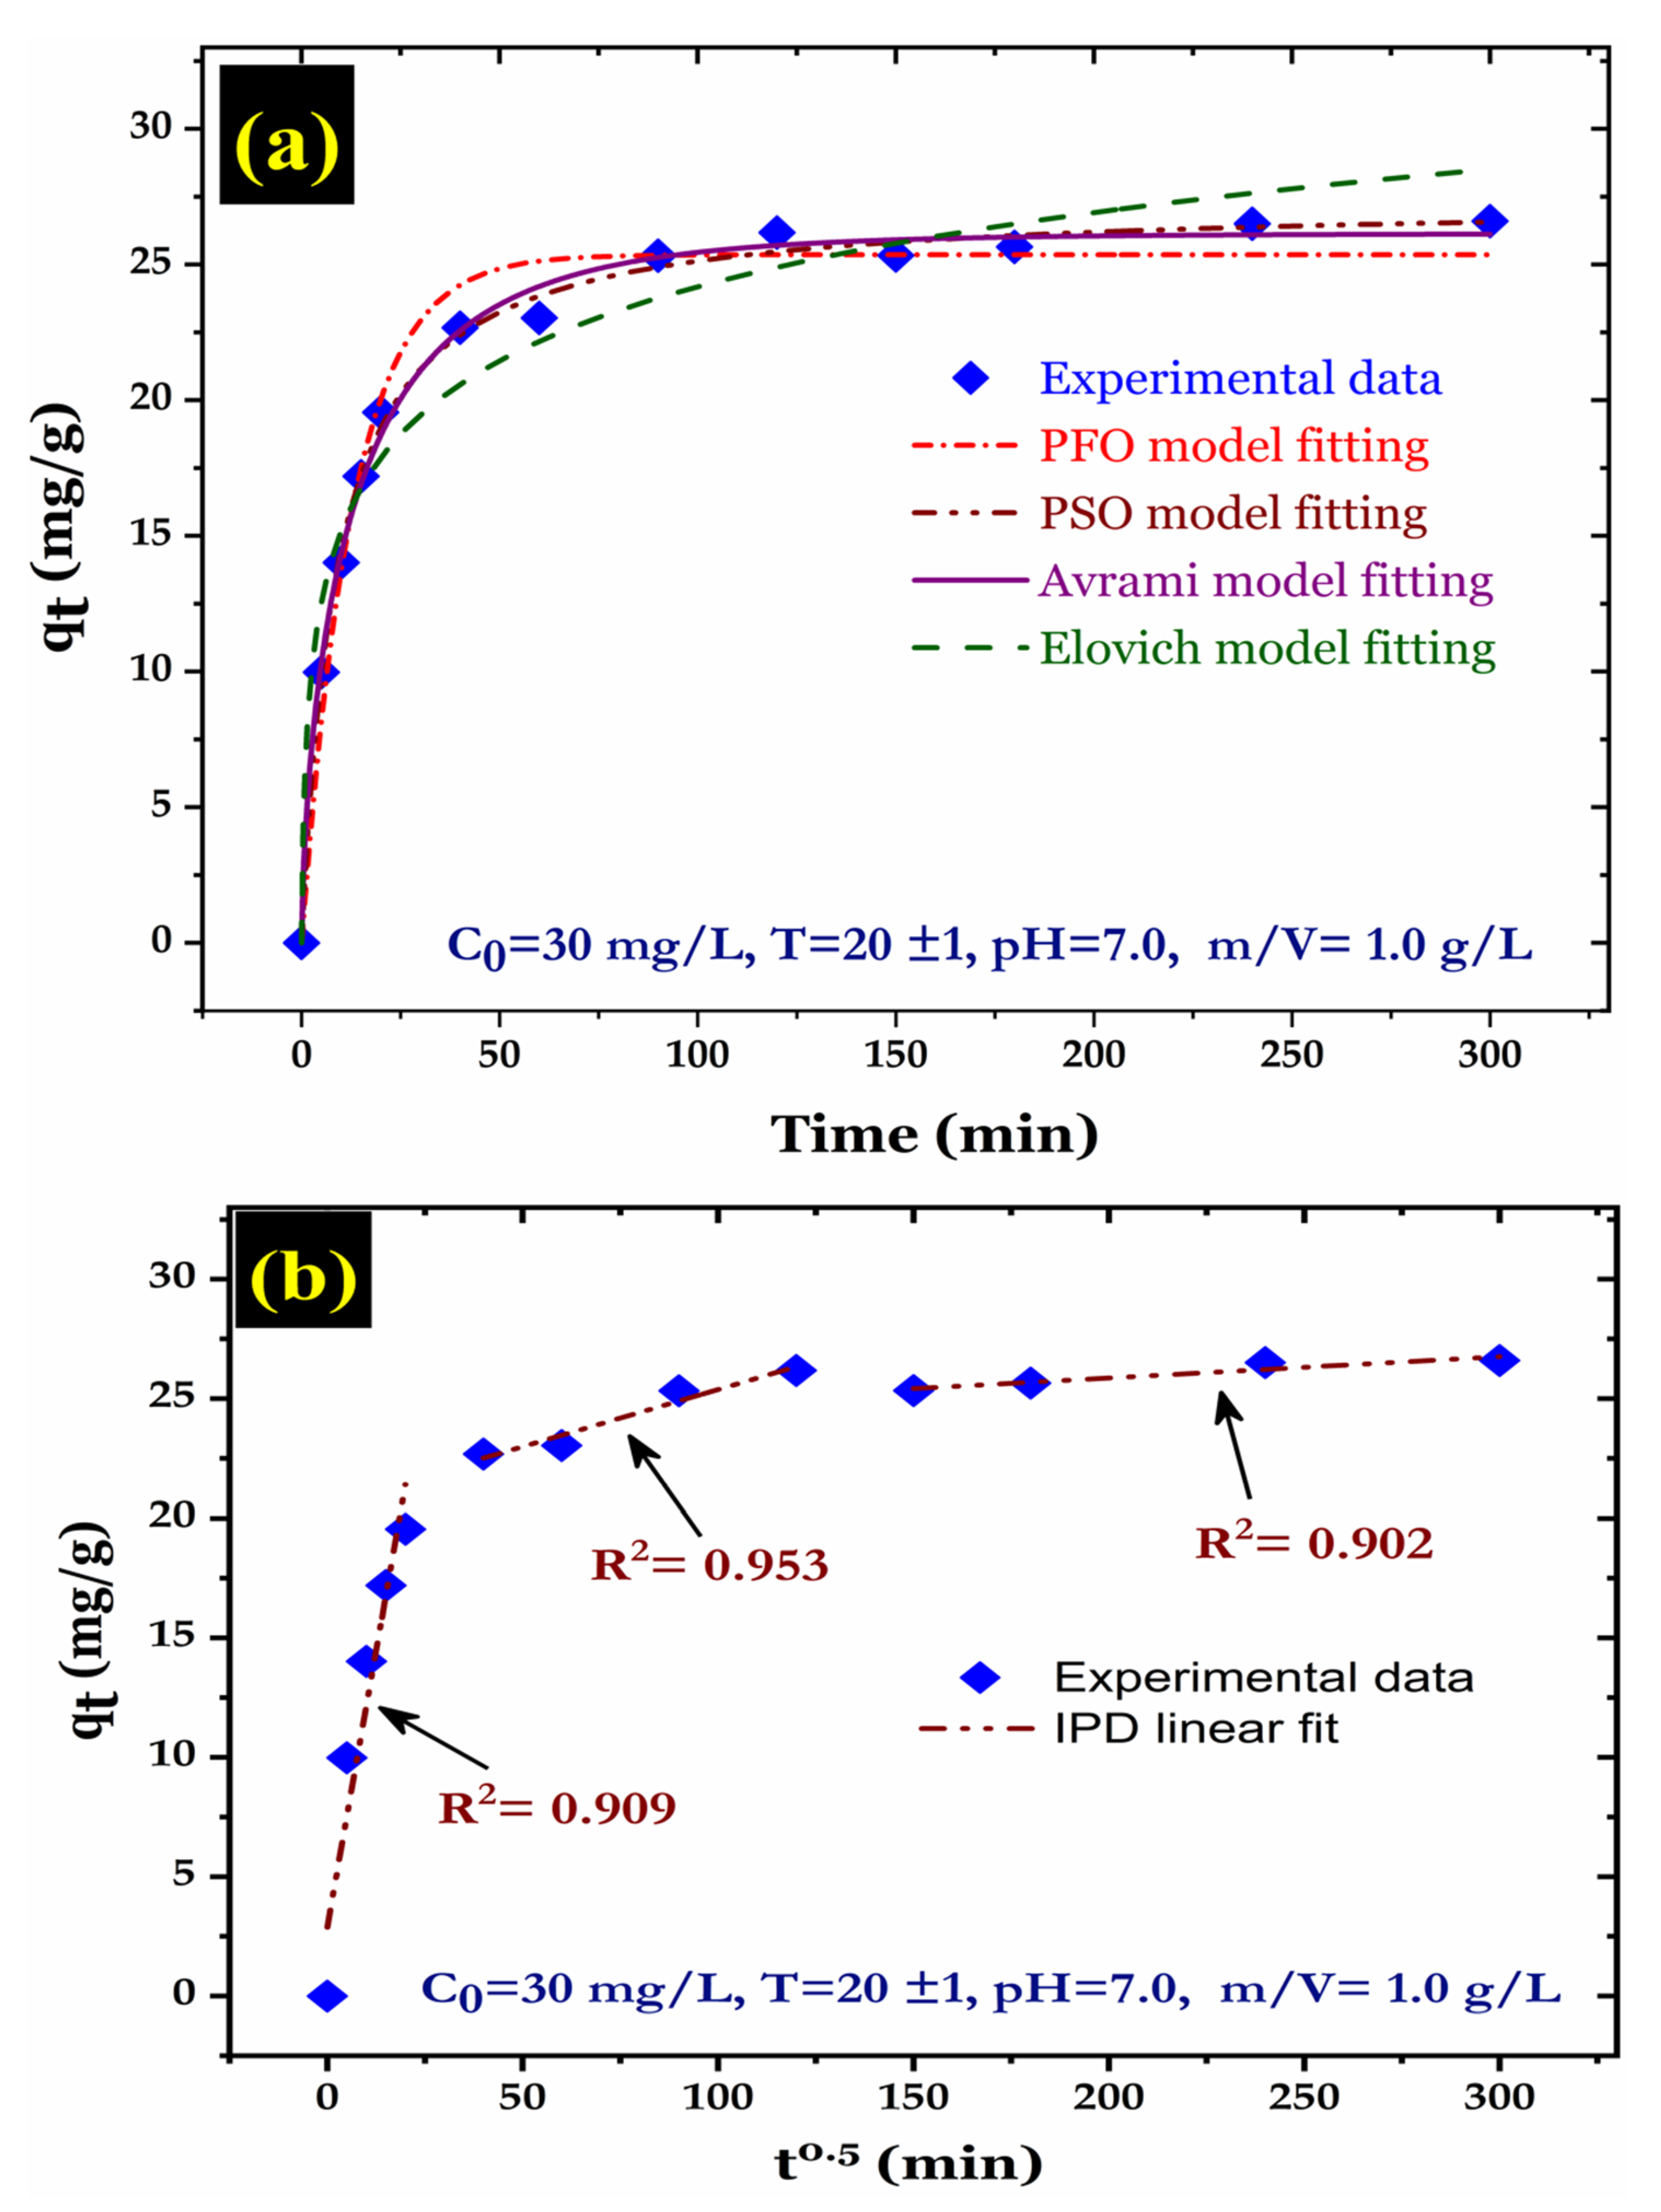
3.3. Kinetic Behaviors

The influence of stirring time on the adsorption efficiency of CV dye onto DSD adsorbent is presented in Figure 6. As expected, the uptake process occurred rapidly in the first few minutes, with approximately 74% dye removal attained during 20 min (Figure 6a). This is because of the availability of vacant adsorption sites at the beginning and the high affinity of DSD adsorbent towards CV molecules in solution. The adsorptive removal efficiency of CV dye reached plateau values of adsorbed amounts after nearly 120 min. Further tests were carried out at 240 min to ensure that the adsorption process had reached real equilibrium.
The kinetics play an important part in the adsorption process, allowing it to be scaled up to small reactor capacity while maintaining efficiency and economics. Data of time-dependence tests were analyzed using four selective kinetic models. These models have been widely used in the literature to model the adsorption of various pollutants (Section 2.4). Table 4 summarizes the computed parameters of such models by using the origin software.
According to the modeling results, the PSO (R2 = 0.997, χ2 = 0.221) and the Avrami (R2 = 0.996, χ2 = 0.347) models fit the experimental data better than the other models. The adsorbed amount of dye calculated by PSO and Avrami model was 27.4 and 26.1 mg/g, respectively, which is very close to value of qe (26.6 mg/g) obtained from the experiment. The PSO model suggests that chemical adsorption is involved in the adsorption process, whereas the Avrami model assumes that different adsorption mechanisms exist and the process subject to the change in mechanisms. According to the Avrami model, the half-life of the CV dye adsorption process was 8.1 min.
To check the existence of the intraparticle diffusion mechanism during adsorption and determine the controlling steps in the whole process, the model of Weber and Morris was used to fit the data of time-dependence. The intraparticle diffusion model curve is given by plotting qt vs. t0.5 (as shown in Figure 6b). It can be observed that the straight-line plot shows a multilinear type with difference in slope and intercept (Table 4). This shows that intraparticle diffusion is involved in the adsorption process, but that it is not the only rate-limiting phase for the entire reaction [26]. The CV dye adsorption onto DSD powder is controlled by three steps occurring at the same time. The first straight portion depicts the film diffusion mechanism that the dye molecules immediately enter the solid surface. The second and third portion represent the intraparticle diffusion mechanism and equilibrium condition, respectively [43,44]. Similar researches reported that the adsorption of dyes onto mineral clays involves the intraparticle diffusion mechanism [1,45].

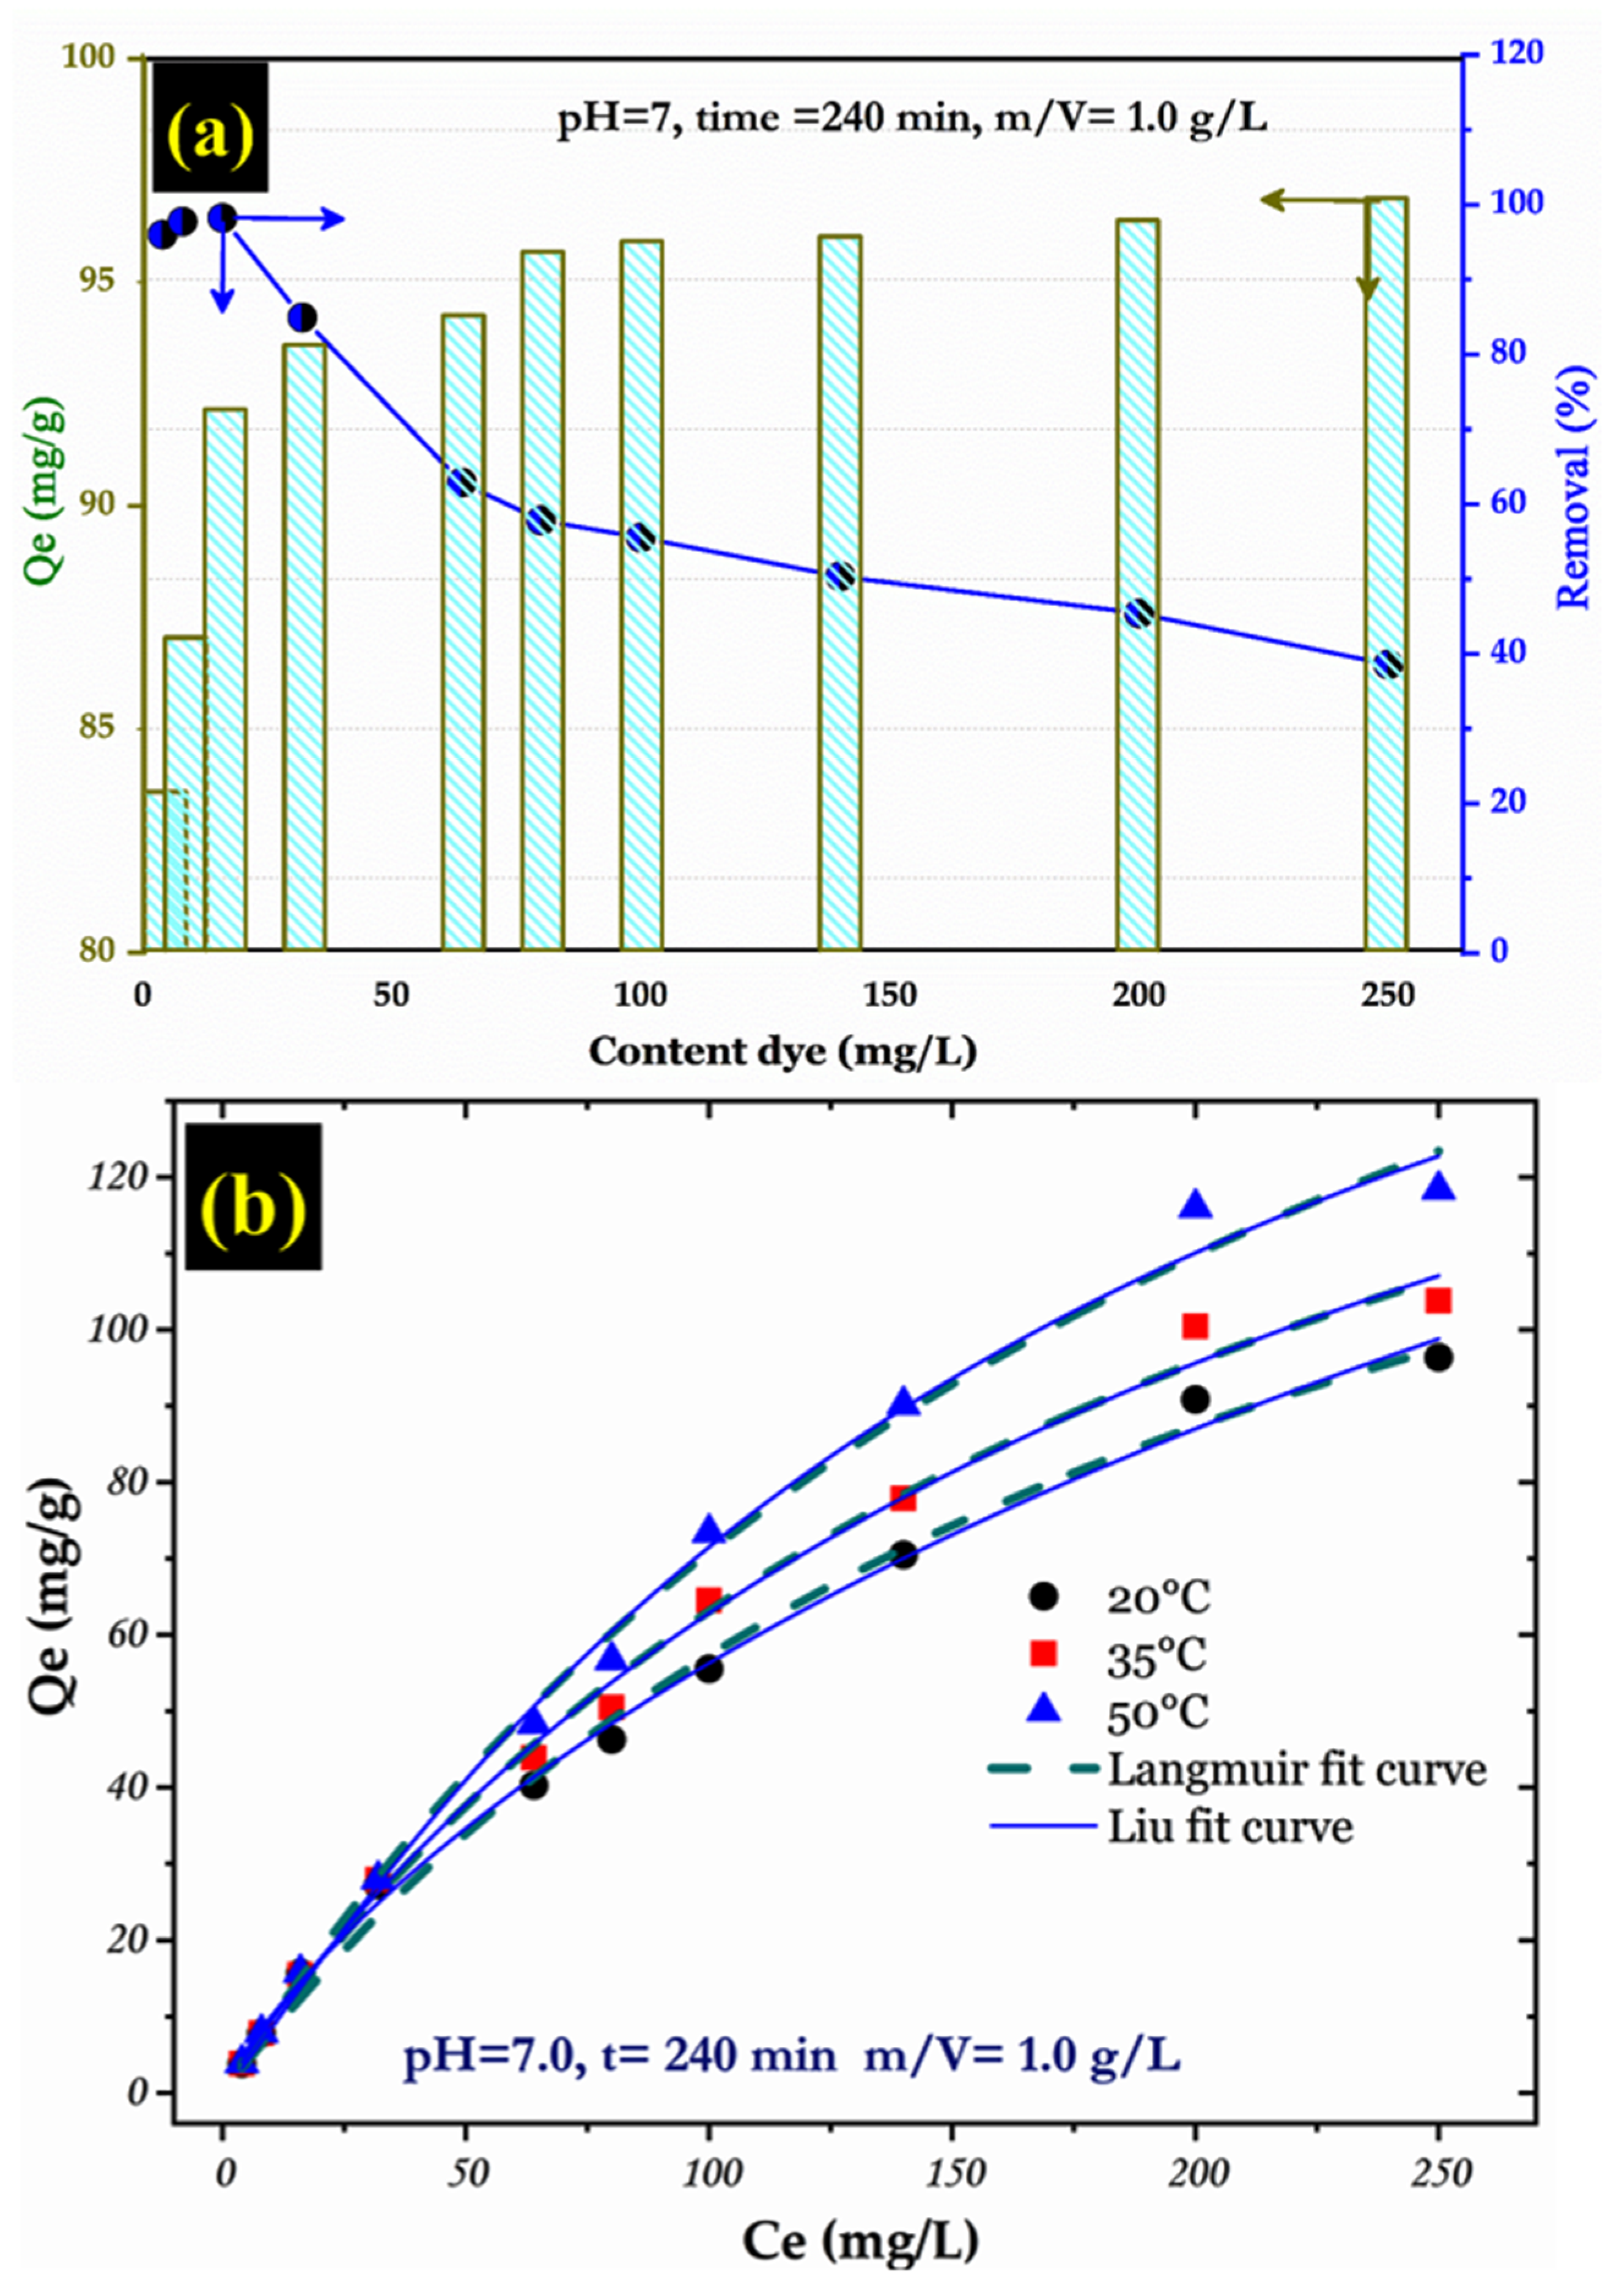
3.4. Isotherm Behaviors

The initial content of dye can have a significant impact on the adsorption efficiency because it affects the mass transfer of solute between the aqueous phase and the solid phase [44]. The influence of CV dye concentration on the elimination percentage and the adsorbed quantity of dye was investigated in the range of 4–250 mg/L (Figure 7a). It can be observed that the removal rate of the CV dye has decreased, but the adsorbed quantity has increased with increases in the initial content of dye. The enhanced driving force of mass transfer from solution to the DSD solid surface could explain the improved adsorption capacity. This causes CV dye molecules to diffuse into the internal porosity of the adsorbent and reach the active sites [46].
Study of the adsorption isotherm provides information about the equilibrium behavior (mechanism and maximum adsorption capacity), affinity, binding energy between adsorbate/biosorbent, and mode of adsorption (monolayer or multilayer). In this work, Langmuir, Freundlich, Redlich–Peterson, and Liu isotherm models were employed to investigate the adsorption behavior of CV dye onto DSD adsorbent. The adsorption isotherms at three temperature values (20, 35, and 50 °C) are presented in Figure 7b. As observed, the temperature remarkably influenced the dye-binding capacity, and the adsorption is favored at high values of temperature. This could be due to the increase in active sites for CV dye uptake as the temperature rises. The relevant parameters of the studied isotherm models were calculated and summarized in Table 5. According to the R2 and χ2 values, the equilibrium data were best fitted by the Langmuir and Liu model compared with the other models (as shown in Figure 7b). The Langmuir equation suggests the saturation of the adsorbent surface at high concentrations, whereas the Liu model suggests that the adsorbent sites cannot have the same energy [26,47]. Based on Langmuir isotherm, the monolayer adsorption capacity (Q0max) was found to be 183.6, 198.0, and 243.6 mg/g at 293, 308, and 323 K, respectively. The gain in adsorption efficiency at higher temperatures was linked to a rise in adsorption energy. Generally, the appropriate isotherm models are classified in the following order: Langmuir > Liu > Freundlich > Redlich–Peterson.
As DSD is a natural material, its adsorption capacity was compared with other natural adsorbents such as clay, zeolite, biochar, etc. Table 6 summarizes the maximum adsorption capacity which is calculated from Langmuir from for some adsorbent materials. The results show the DSD powder has an excellent ability to remove CV dye from water media compared with many natural and synthetic materials and can be applied as a low-cost and eco-friendly adsorbent to remove dye colors from wastewaters.

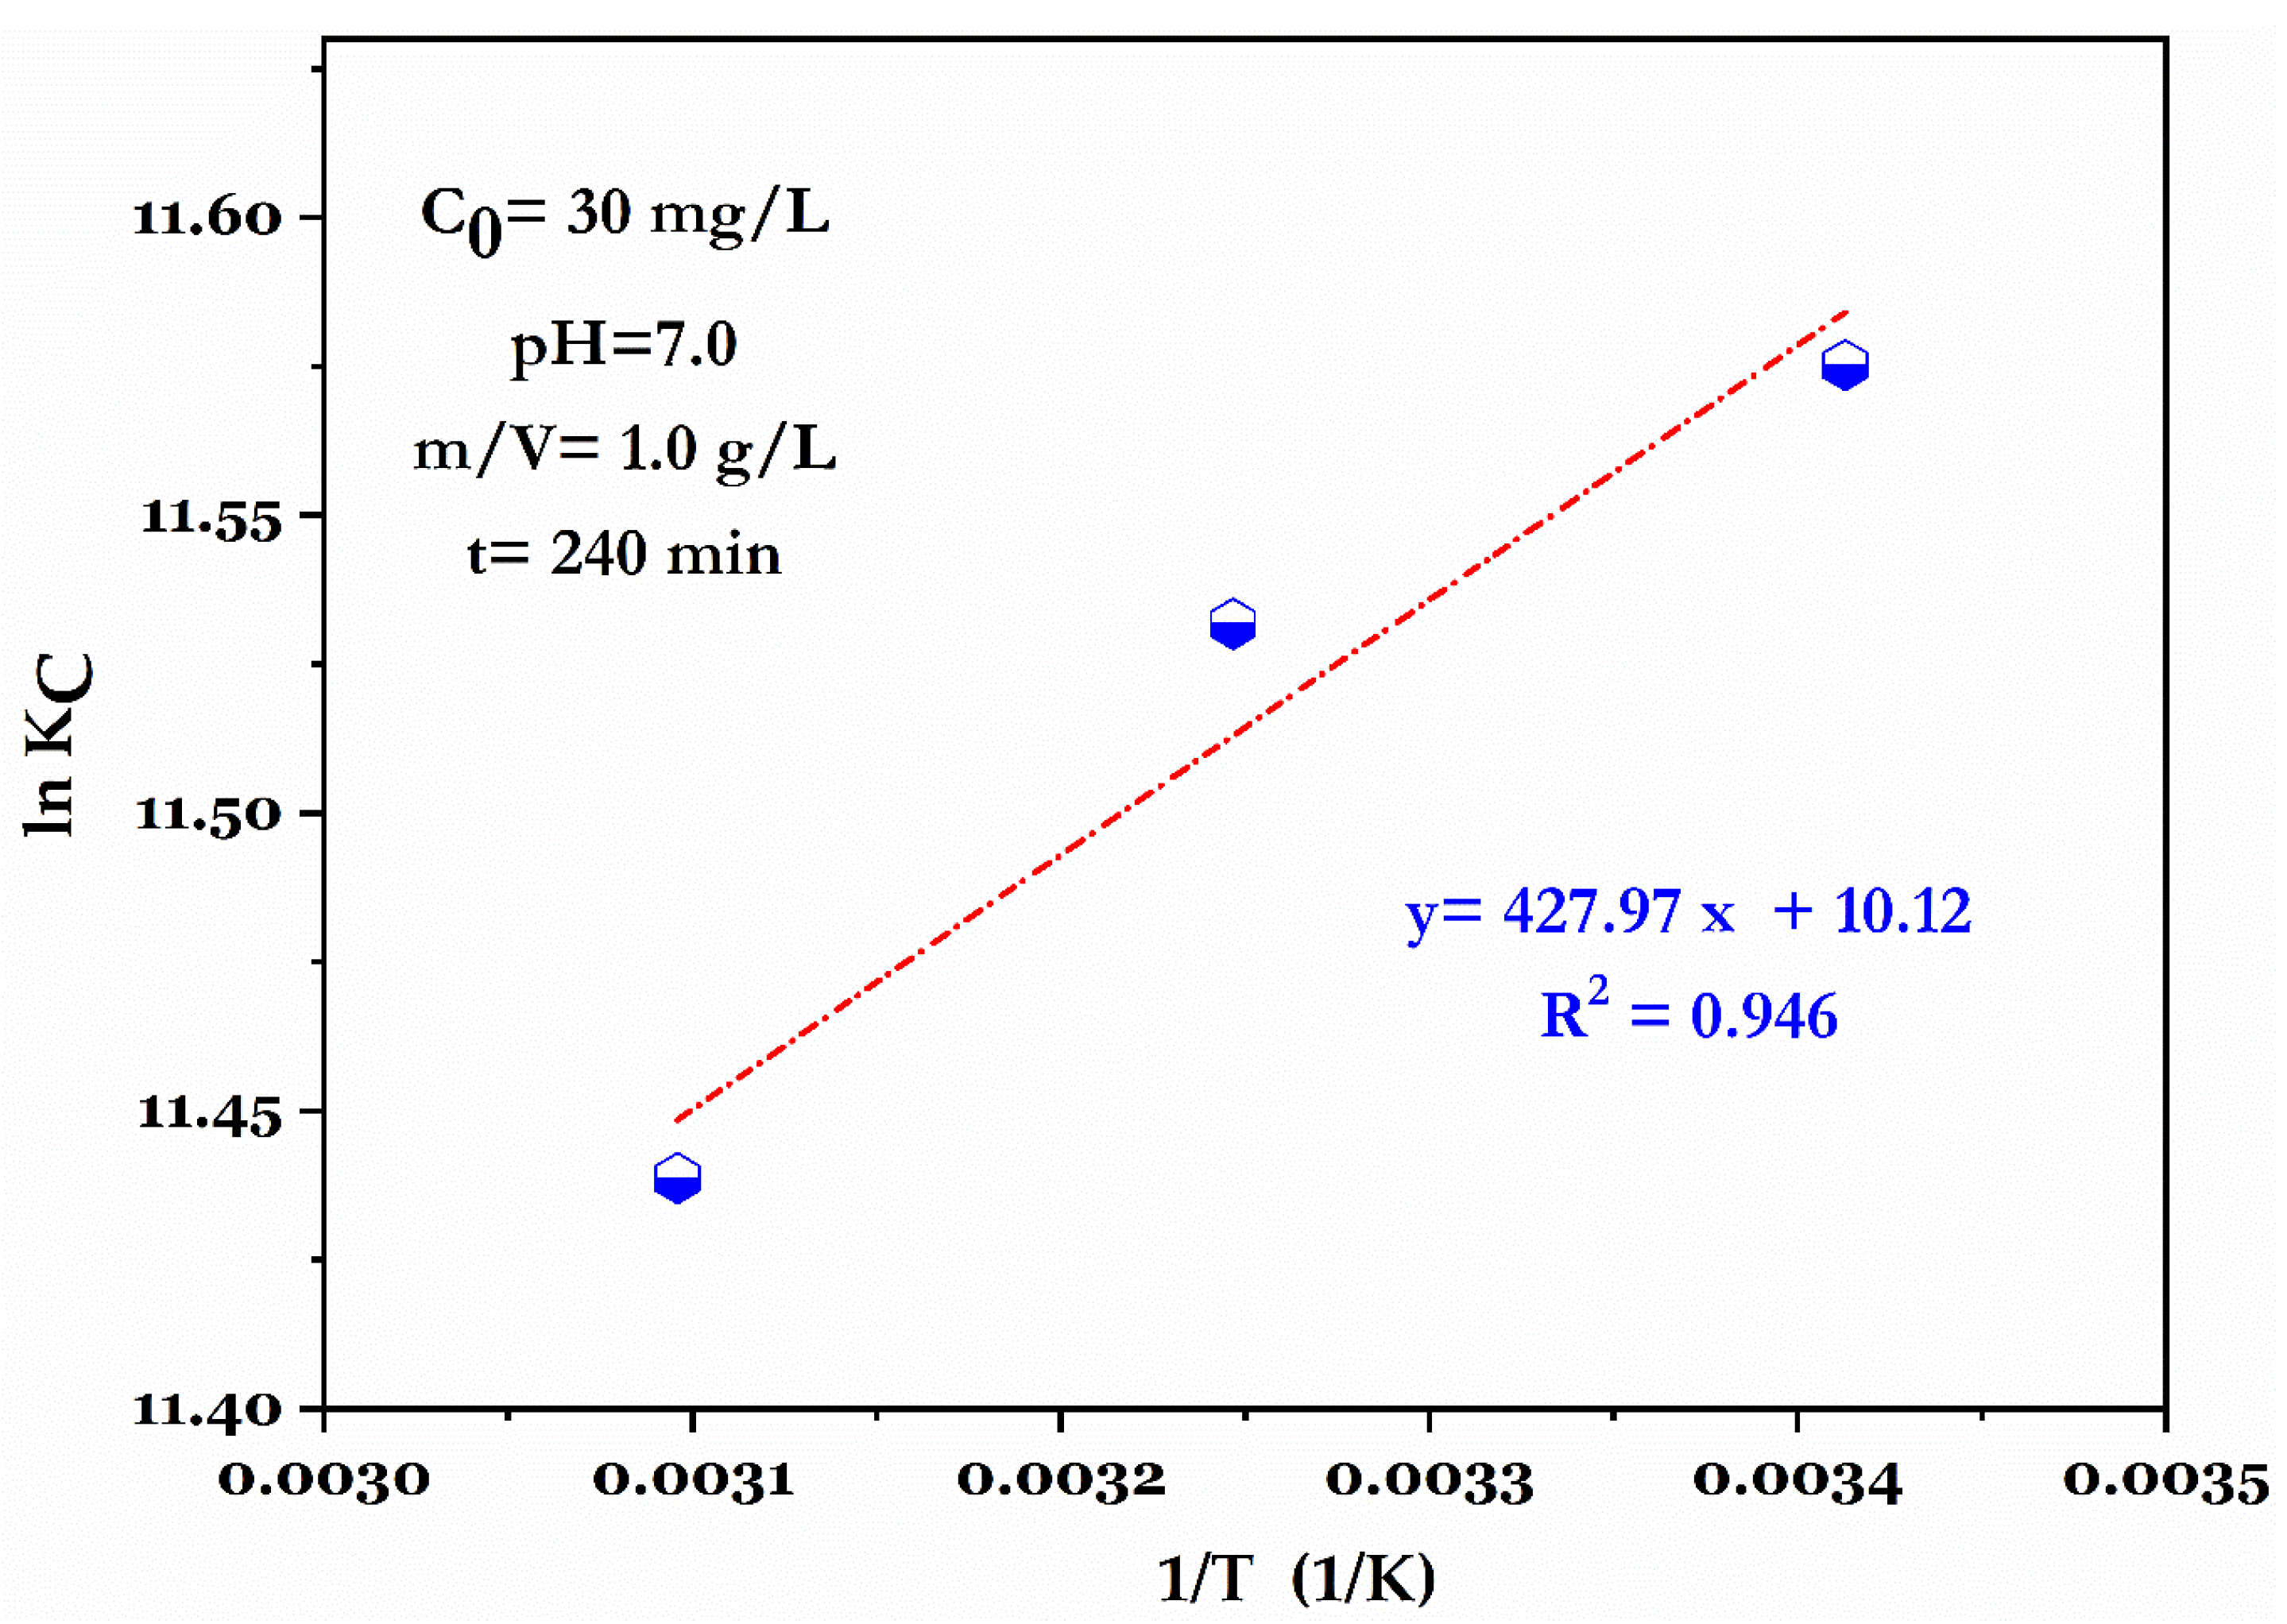
3.5. Thermodynamics Behaviors

The calculation of thermodynamic parameters is indispensable component to determine the adsorption mechanisms (e.g., chemical or physical). The enthalpy change (Δ) and entropy change (Δ) were calculated from the slope and intercept of lnKC versus 1/T (Figure 8). Results demonstrate that the Gibbs free energy is negative (−Δ), showing that the adsorption process is spontaneous and favorable at the tested temperatures without any additional prerequisites (i.e., heating).
In general, ΔG° value for a process dominated by physisorption is in the range of −20 to 0 KJ/mol, whereas it is between −400 and −80 KJ/mol for chemical adsorption [52]. Therefore, Δ values are between 28.2 and 30.7 kJ/mol for the range studied of temperatures (from 293 K to 323 K), indicating that the adsorption process was controlled by both ion exchange and physical interactions (i.e., pore filling) in our case. Cantu et al. (2014) [53] reported that the ion exchange is the predominate mechanism for Δ, ranging from −34 to −40 kJ/mol.
On the other hand, the value of the standard change in enthalpy is negative (−∆), indicating an exothermic process (Table 7). Several scholars have found a similar trend in the exothermic nature of the adsorption of cationic dyes onto various materials, such as natural clay [6], illite/kaolinite [45], and Montmorillonite [36]. Furthermore, the positive value of ∆ reflected that the organization of the CV dye molecules at the solid/liquid interface becomes more random during the sorption operation [7], and the reaction is a thermodynamically favorable [53]. In general, findings from this study contribute significantly on the development of new natural adsorbents for remediation of polluted water [54,55]. Although various natural adsorbents have been used for removal of pollutions [56,57,58,59,60], the use of dredging sediment employed in this study suggested that natural clays that are freely available have the potential not only for dye removal but also for other pollution removal.

4. Conclusions

This work evaluated the potential of dredged sediment from dam (DSD) for the elimination of the cationic dye crystal violet (CV) in a batch mode. The elimination of CV dye by DSD powder is slightly influenced by the solution pH (3.0–11.0) and ionic strength (0–1.0 M NaCl). The kinetic study showed that approximately 74% (from 30 mg/L) of the total CV dye content could be eliminated from the solution within the first 20 min of stirring. Kinetic data follows the pseudo–second-order and the Avrami models. The adsorption process of CV dye was attributed to ion exchange and pore filling mechanisms, with little contribution from electrostatic attraction forces. The adsorption process of CV dye takes place in three stages: (i) film diffusion mechanism, (ii) intraparticle diffusion, (iii) and equilibrium condition, respectively. The CV dye adsorption process was spontaneous (−Δ), endothermic in nature (−∆), and increased the randomness at the adsorbent/liquid interface (+∆). The adsorption efficiency increased with the temperature, and isotherm data was better described by the Langmuir and Liu equations. The adsorption capacity of Langmuir model reached 243.6 mg/g (at 323 K). These results show that the studied sediment of the dam can become an alternative adsorbent because of its near-zero production cost coupled with excellent capacity and rapidity of dye removal.

Author Contributions

A.O.: Investigation, Data curation, Formal analysis, Writing—original draft. M.A.: Formal analysis, Methodology, Writing—review and editing. B.T.: Formal analysis, Methodology, Writing—review and editing. H.-O.C.: Formal analysis, Methodology, Writing—review and editing. G.H.: Formal analysis, Methodology, Writing—review and editing. N.H.: Formal analysis, Methodology, Writing—review and editing. A.S.: Conceptualization, Writing—review and editing. R.B.: Writing—review and editing. All authors have read and agreed to the published version of the manuscript.

Funding

This research received no external funding.

Institutional Review Board Statement

Not applicable.

Informed Consent Statement

Not applicable.

Data Availability Statement

Not applicable.

Acknowledgments

This work was supported by Research Laboratory in Subterranean and Surface Hydraulics, Civil Engineering and Hydraulic Department, University of Biskra-Algeria, and the General Direction of Scientific Research and Technological Development of the Ministry of Higher Education and Scientific Research-Algeria.

Conflicts of Interest

The authors declare that they have no known competing financial interests or personal relationships that could have appeared to influence the work reported in this paper.

References

  1. Adeyemo, A.A.; Adeoye, I.O.; Bello, O.S. Adsorption of dyes using different types of clay: A review. Appl. Water Sci. 2017, 7, 543–568. [Google Scholar] [CrossRef] [Green Version]
  2. Yaseen, D.A.; Scholz, M. Textile dye wastewater characteristics and constituents of synthetic effluents: A critical review. Int. J. Environ. Sci. Technol. 2018, 16, 1193–1226. [Google Scholar] [CrossRef] [Green Version]
  3. Cao, D.-J.; Wang, J.-J.; Zhang, Q.; Wen, Y.-Z.; Dong, B.; Liu, R.-J.; Yang, X.; Geng, G. Biodegradation of triphenylmethane dye crystal violet by Cedecea davisae. Spectrochim. Acta Part A Mol. Biomol. Spectrosc. 2018, 210, 9–13. [Google Scholar] [CrossRef] [PubMed]
  4. De Benedetto, C.; Macario, A.; Siciliano, C.; Nagy, J.B.; De Luca, P. Adsorption of Reactive Blue 116 Dye and Reactive Yellow 81 Dye from Aqueous Solutions by Multi-Walled Carbon Nanotubes. Materials 2020, 13, 2757. [Google Scholar] [CrossRef] [PubMed]
  5. Abu Elella, M.H.; Sabaa, M.W.; ElHafeez, E.A.; Mohamed, R.R. Crystal violet dye removal using crosslinked grafted xanthan gum. Int. J. Biol. Macromol. 2019, 137, 1086–1101. [Google Scholar] [CrossRef]
  6. Omer, O.S.; Hussein, M.A.; Hussein, B.; Mgaidi, A. Adsorption thermodynamics of cationic dyes (methylene blue and crystal violet) to a natural clay mineral from aqueous solution between 293.15 and 323.15 K. Arab. J. Chem. 2018, 11, 615–623. [Google Scholar] [CrossRef]
  7. Chahinez, H.-O.; Abdelkader, O.; Leila, Y.; Tran, H.N. One-stage preparation of palm petiole-derived biochar: Characterization and application for adsorption of crystal violet dye in water. Environ. Technol. Innov. 2020, 19, 100872. [Google Scholar] [CrossRef]
  8. Alorabi, A.Q.; Hassan, M.S.; Alam, M.M.; Zabin, S.A.; Alsenani, N.I.; Baghdadi, N.E. Natural Clay as a Low-Cost Adsorbent for Crystal Violet Dye Removal and Antimicrobial Activity. Nanomaterials 2021, 11, 2789. [Google Scholar] [CrossRef]
  9. Slimanou, H.; Eliche-Quesada, D.; Kherbache, S.; Bouzidi, N.; Tahakourt, A. Harbor Dredged Sediment as raw material in fired clay brick production: Characterization and properties. J. Build. Eng. 2020, 28, 101085. [Google Scholar] [CrossRef]
  10. Yang, X.; Zhao, L.; Haque, M.A.; Chen, B.; Ren, Z.; Cao, X.; Shen, Z. Sustainable conversion of contaminated dredged river sediment into eco-friendly foamed concrete. J. Clean. Prod. 2020, 252, 119799. [Google Scholar] [CrossRef]
  11. Khanchoul, K.; Boukhrissa, Z.E.A.; Acidi, A.; Altschul, R. Estimation of suspended sediment transport in the Kebir drainage basin, Algeria. Quat. Int. 2012, 262, 25–31. [Google Scholar] [CrossRef]
  12. Hammadi, L.; Ponton, A. Rheological investigation of vase of dam: Effects of aging time, shear rate, and temperature. Appl. Rheol. 2017, 27, 1–9. [Google Scholar] [CrossRef]
  13. Bounouara, Z.; Malab, S.; Mekerta, B.; Benaissa, A.; Bourokba, S.A. Treatment of Dredged Sediments of Bouhanifia Dam for Their Valorization in Passive Barrier of Landfill. Geotech. Geol. Eng. 2020, 38, 3997–4011. [Google Scholar] [CrossRef]
  14. Song, Z.; Zhang, W.; Gao, H.; Wang, D. Comprehensive assessment of flocculation conditioning of dredged sediment using organic polymers: Dredged sediment dewaterability and release of pollutants. Sci. Total. Environ. 2020, 739, 139884. [Google Scholar] [CrossRef]
  15. Laoufi, L.; Senhadji, Y.; Benazzouk, A. Valorization of mud from Fergoug dam in manufacturing mortars. Case Stud. Constr. Mater. 2016, 5, 26–38. [Google Scholar] [CrossRef] [Green Version]
  16. Kreirzti, L.K.; Benamara, L.; Boudjenane, N.-E. Valorization of dredging sediments of dam BOUHNIFIA in ceramic. J. Aust. Ceram. Soc. 2019, 55, 1081–1089. [Google Scholar] [CrossRef]
  17. Lim, Y.C.; Shih, Y.-J.; Tsai, K.-C.; Yang, W.-D.; Chen, C.-W.; Dong, C.-D. Recycling dredged harbor sediment to construction materials by sintering with steel slag and waste glass: Characteristics, alkali-silica reactivity and metals stability. J. Environ. Manag. 2020, 270, 110869. [Google Scholar] [CrossRef]
  18. Brunauer, S. The Adsorption of Gases and Vapors (Physical Adsorption). J. Chem. Educ. 1944, 21, 52. [Google Scholar] [CrossRef] [Green Version]
  19. Rouahna, N.; Ouakouak, A.; Barkat, D.; Srasra, E. Zn-Al layered double hydroxide: Synthesis, characterization and application for orthophosphates ions adsorption in aqueous medium. Mater. Res. Express 2020, 7, 045502–045511. [Google Scholar] [CrossRef]
  20. Tran, H.N.; You, S.-J.; Hosseini-Bandegharaei, A.; Chao, H.-P. Mistakes and inconsistencies regarding adsorption of contaminants from aqueous solutions: A critical review. Water Res. 2017, 120, 88–116. [Google Scholar] [CrossRef] [PubMed]
  21. Lopes, E.C.; dos Anjos, F.S.; Vieira, E.F.; Cestari, A.R. An alternative Avrami equation to evaluate kinetic parameters of the interaction of Hg(II) with thin chitosan membranes. J. Colloid Interface Sci. 2003, 263, 542–547. [Google Scholar] [CrossRef]
  22. Weber, W.J., Jr.; Morris, J.C. Kinetics of adsorption on carbon from solution. J. Sanit. Eng. Div. Am. Soc. Civ. Eng. 1963, 89, 31–60. [Google Scholar] [CrossRef]
  23. Freundlich, H. Uber die adsorption in losungen. Z. Phys. Chem. 1906, 57, 385–470. [Google Scholar] [CrossRef]
  24. Redlich, 0; Peterson, D.L. A Useful Adsorption Isotherm. J. Phys. Chem. 1959, 63, 1024–1030. [Google Scholar] [CrossRef]
  25. Liu, Y.; Xu, H.; Yang, S.-F.; Tay, J.-H. A general model for biosorption of Cd2+, Cu2+ and Zn2+ by aerobic granules. J. Biotechnol. 2003, 102, 233–239. [Google Scholar] [CrossRef]
  26. Tran, H.N.; Wang, Y.-F.; You, S.-J.; Chao, H.-P. Insights into the mechanism of cationic dye adsorption on activated charcoal: The importance of π–π interactions. Process. Saf. Environ. Prot. 2017, 107, 168–180. [Google Scholar] [CrossRef]
  27. Zhou, X.; Zhou, X. The Unit Problem in the Thermodynamic Calculation of Adsorption Using the Langmuir Equation. Chem. Eng. Commun. 2014, 201, 1459–1467. [Google Scholar] [CrossRef]
  28. Barhoumi, T.; Bekri-Abbes, I.; Srasra, E. Physicochemical characteristics and suitability of curative pastes made of Tunisian clay minerals and thermal waters for use in pelotherapy. Comptes Rendus Chim. 2019, 22, 126–131. [Google Scholar] [CrossRef]
  29. Safhi, A.E.M.; Rivard, P.; Yahia, A.; Benzerzour, M.; Khayat, K.H. Valorization of dredged sediments in self-consolidating concrete: Fresh, hardened, and microstructural properties. J. Clean. Prod. 2020, 263, 121472. [Google Scholar] [CrossRef]
  30. Allouche, F.; Eloussaief, M.; Ghrab, S.; Kallel, N. Clay Material of an Eocene Deposit (Khanguet Rheouis, Tunisia): Identification Using Geochemical and Mineralogical Characterization. Clays Clay Miner. 2020, 68, 262–272. [Google Scholar] [CrossRef]
  31. Chaari, I.; Medhioub, M.; Jamoussi, F.; Hamzaoui, A.H. Acid-treated clay materials (Southwestern Tunisia) for removing sodium leuco-vat dye: Characterization, adsorption study and activation mechanism. J. Mol. Struct. 2020, 1223, 128944. [Google Scholar] [CrossRef]
  32. Sing, K.S.; Williams, R.T. Physisorption Hysteresis Loops and the Characterization of Nanoporous Materials. Adsorpt. Sci. Technol. 2004, 22, 773–782. [Google Scholar] [CrossRef]
  33. Amano, Y.; Misugi, Y.; Machida, M. Adsorptive Behavior of Phosphate onto Activated Carbons Varying Surface Physicochemical Properties. Sep. Sci. Technol. 2012, 47, 2348–2357. [Google Scholar] [CrossRef]
  34. Wong, S.; Lee, Y.; Ngadi, N.; Inuwa, I.M.; Mohamed, N.B. Synthesis of activated carbon from spent tea leaves for aspirin removal. Chin. J. Chem. Eng. 2018, 26, 1003–1011. [Google Scholar] [CrossRef]
  35. Hashem, A.; Aniagor, C.; Taha, G.M.; Fikry, M. Utilization of low-cost sugarcane waste for the adsorption of aqueous Pb(II): Kinetics and isotherm studies. Curr. Res. Green Sustain. Chem. 2021, 4, 100056. [Google Scholar] [CrossRef]
  36. Sarma, G.K.; Gupta, S.S.; Bhattacharyya, K.G. Retracted: Adsorption of Crystal violet on raw and acid-treated montmorillonite, K10, in aqueous suspension. J. Environ. Manag. 2016, 171, 1–10. [Google Scholar] [CrossRef] [PubMed]
  37. Hamza, W.; Dammak, N.; Hadjltaief, H.B.; Eloussaief, M.; Benzina, M. Sono-assisted adsorption of Cristal Violet dye onto Tunisian Smectite Clay: Characterization, kinetics and adsorption isotherms. Ecotoxicol. Environ. Saf. 2018, 163, 365–371. [Google Scholar] [CrossRef]
  38. Tahir, S.; Rauf, N. Removal of a cationic dye from aqueous solutions by adsorption onto bentonite clay. Chemosphere 2006, 63, 1842–1848. [Google Scholar] [CrossRef] [PubMed]
  39. Bentahar, S.; Dbik, A.; el Khomri, M.; El Messaoudi, N.; Lacherai, A. Adsorption of methylene blue, crystal violet and congo red from binary and ternary systems with natural clay: Kinetic, isotherm, and thermodynamic. J. Environ. Chem. Eng. 2017, 5, 5921–5932. [Google Scholar] [CrossRef]
  40. Aref, L.; Navarchian, A.H.; Dadkhah, D. Adsorption of Crystal Violet Dye from Aqueous Solution by Poly(Acrylamide-co-Maleic Acid)/Montmorillonite Nanocomposite. J. Polym. Environ. 2017, 25, 628–639. [Google Scholar] [CrossRef]
  41. Abd El-Latif, M.M.; El-Kady, M.F.; Ibrahim, A.M.; Ossman, M. Alginate/ Polyvinyl Alcohol-Kaolin Composite for Removal of Methylene Blue from Aqueous Solution in a Batch Stirred Tank Reactor. J. Am. Sci. 2010, 6, 280–292. [Google Scholar]
  42. Momina, M.; Shahadat, M.; Isamil, S. Regeneration performance of clay-based adsorbents for the removal of industrial dyes: A review. RSC Adv. 2018, 8, 24571–24587. [Google Scholar] [CrossRef]
  43. Rouahna, N.; Barkat, D.; Ouakouak, A.; Srasra, E. Synthesis and characterization of Mg-Al layered double hydroxide intercalated with D2EHPA: Application for copper ions removal from aqueous solution. J. Environ. Chem. Eng. 2018, 6, 1226–1232. [Google Scholar] [CrossRef]
  44. Foroutan, R.; Peighambardoust, S.; Peighambardoust, S.; Pateiro, M.; Lorenzo, J. Adsorption of Crystal Violet Dye Using Activated Carbon of Lemon Wood and Activated Carbon/Fe3O4 Magnetic Nanocomposite from Aqueous Solutions: A Kinetic, Equilibrium and Thermodynamic Study. Molecules 2021, 26, 2241. [Google Scholar] [CrossRef] [PubMed]
  45. Elmoubarki, R.; Mahjoubi, F.; Tounsadi, H.; Moustadraf, J.; Abdennouri, M.; Zouhri, A.; El Albani, A.; Barka, N. Adsorption of textile dyes on raw and decanted Moroccan clays: Kinetics, equilibrium and thermodynamics. Water Resour. Ind. 2015, 9, 16–29. [Google Scholar] [CrossRef]
  46. Jawad, A.H.; Abdulhameed, A.S.; Reghioua, A.; Yaseen, Z.M. Zwitterion composite chitosan-epichlorohydrin/zeolite for adsorption of methylene blue and reactive red 120 dyes. Int. J. Biol. Macromol. 2020, 163, 756–765. [Google Scholar] [CrossRef]
  47. Lima, C.; Adebayo, M.A.; Machado, F.M. Kinetic and Equilibrium Models of Adsorption. In Carbon Nanomaterials as Adsorbents for Environmental and Biological Applications; Springer: Berlin/Heidelberg, Germany, 2015; pp. 33–69. [Google Scholar] [CrossRef]
  48. Anirudhan, T.S.; Ramachandran, M. Adsorptive removal of basic dyes from aqueous solutions by surfactant modified bentonite clay (organoclay): Kinetic and competitive adsorption isotherm. Process Saf. Environ. Prot. 2015, 95, 215–225. [Google Scholar] [CrossRef]
  49. Sarabadan, M.; Sarabadan, H.M.; Bashiri, H.; Mousavi, S.M. Adsorption of crystal violet dye by a zeolite-montmorillonite nano-adsorbent: Modelling, kinetic and equilibrium studies. Clay Miner. 2019, 54, 357–368. [Google Scholar] [CrossRef]
  50. Wang, X.S.; Zhang, W. Removal of basic dye crystal violet from aqueous solution by Cu(II)-loaded montmorillonite. Sep. Sci. Technol. 2011, 46, 656–663. [Google Scholar] [CrossRef]
  51. Wathukarage, A.; Herath, I.; Iqbal, M.C.M.; Vithanage, M. Mechanistic understanding of crystal violet dye sorption by woody biochar: Implications for wastewater treatment. In Environmental Geochemistry and Health; Springer: Netherlands, 2017; pp. 1–15. [Google Scholar]
  52. Shikuku, V.O.; Zanella, R.; Kowenje, C.O.; Donato, F.F.; Bandeira, N.M.G.; Prestes, O.D. Single and binary adsorption of sulfonamide antibiotics onto iron-modified clay: Linear and nonlinear isotherms, kinetics, thermodynamics, and mechanistic studies. Appl. Water Sci. 2018, 8, 2–12. [Google Scholar] [CrossRef] [Green Version]
  53. Cantu, Y.; Remes, A.; Reyna, A.; Martinez, D.; Villarreal, J.; Ramos, H.; Trevino, S.; Tamez, C.; Martinez, A.; Eubanks, T.; et al. Thermodynamics, kinetics, and activation energy studies of the sorption of chromium(III) and chromium(VI) to a Mn3O4 nanomaterial. Chem. Eng. J. 2014, 254, 374–383. [Google Scholar] [CrossRef] [Green Version]
  54. Syafiuddin, A.; Salmiati, S.; Jonbi, J.; Fulazzaky, M.A. Application of the kinetic and isotherm models for better understanding of the behaviors of silver nanoparticles adsorption onto different adsorbents. J. Environ. Manag. 2018, 218, 59–70. [Google Scholar] [CrossRef]
  55. Syafiuddin, A.; Fulazzaky, M.A.; Salmiati, S.; Kueh, A.B.H.; Fulazzaky, M.; Salim, M.R. Silver nanoparticles adsorption by the synthetic and natural adsorbent materials: An exclusive review. Nanotechnol. Environ. Eng. 2020, 5, 1–18. [Google Scholar] [CrossRef]
  56. Fulazzaky, M.A.; Salim, N.A.A.; Khamidun, M.H.; Puteh, M.H.; Yusoff, A.R.M.; Abdullah, N.H.; Syafiuddin, A.; Zaini, M.A.A. The mechanisms and kinetics of phosphate adsorption onto iron-coated waste mussel shell observed from hydrodynamic column. Int. J. Environ. Sci. Technol. 2021, 1–14. [Google Scholar] [CrossRef]
  57. Syafiuddin, A.; Salmiati, S.; Hadibarata, T.; Salim, M.R.; Kueh, A.B.H.; Suhartono, S. Removal of Silver Nanoparticles from Water Environment: Experimental, Mathematical Formulation, and Cost Analysis. Water Air Soil Pollut. 2019, 230, 102–117. [Google Scholar] [CrossRef]
  58. Syafiuddin, A.; Boopathy, R. Effect of Algal Cells on Water Pollution Control. Curr. Pollut. Rep. 2021, 7, 213–226. [Google Scholar] [CrossRef]
  59. Syafiuddin, A.; Boopathy, R. A review of polycyclic aromatic hydrocarbons and their substitutions in full-scale wastewater treatment plants. Environ. Qual. Manag. 2020, 31, 21–37. [Google Scholar] [CrossRef]
  60. Ratnasari, A.; Syafiuddin, A.; Boopathy, R.; Malik, S.; Mehmood, M.A.; Amalia, R.; Prastyo, D.D.; Zaidi, N.S. Advances in pretreatment technology for handling the palm oil mill effluent: Challenges and prospects. Bioresour. Technol. 2021, 344, 126239. [Google Scholar] [CrossRef]
Figure 1. X-ray diffraction pattern of DSD sample.
Applsci 11 10722 g001
Figure 2. FTIR spectrum of DSD sample.
Applsci 11 10722 g002
Figure 3. N2 adsorption/desorption isotherm of DSD material at 77 K and its textural characteristics.
Applsci 11 10722 g003
Figure 4. (a) pHPZC of DSD sample; effect of (b) initial pH value and (c) ionic strength on the adsorption capacity of DSD adsorbent to crystal violet dye.
Applsci 11 10722 g004
Figure 5. Pore size distribution of DSD sample and possibility of the pore filling diffusion of CV dye.
Applsci 11 10722 g005
Figure 6. (a) Contact time effect, and nonlinear relationship of PFO, PSO, Avrami, and Elovich kinetic models, (b) linear relationship of intraparticle diffusion model.
Applsci 11 10722 g006
Figure 7. (a) Effect of initial CV dye concentration on percentage of elimination and adsorption capacity, and (b) and nonlinear relationship of Langmuir and Liu isotherm models.
Applsci 11 10722 g007
Figure 8. Thermodynamic plot for the adsorption of CV dye onto DSD adsorbent.
Applsci 11 10722 g008
Table 1. Chemicals characteristics of crystal violet dye.
C.I. NameChemical StructureMolecular FormulaMW (g/mol)Density
(g/cm3)
Solubility
Crystal violet Applsci 11 10722 i001C25H30N3Cl407.981.1916 g/L at 25° C
Table 2. Equations, relevant parameters, and references of the applied kinetic and isotherm models.
ModelEquationDescription of Parameters
Pseudo–first-order q t = q e ( 1 e K 1 t ) Equation (3)qe and qt (in mg/g) are the adsorbed quantity of CV dye at equilibrium and at time t, respectively.
K1 (L/min) and K2 (g/mg.min): rates constants.
kAV (1/min): is the Avrami kinetic constant.
nAV: is a fractional adsorption order corresponding to adsorption mechanism.
Kip (mg/g/min1/2): intraparticle diffusion rate constant.
C (mg/g): constant related to the thickness of the boundary layer.
Pseudo–second-order q t = q e 2 . k 2 . t 1 + q e . k 2 . t Equation (4)
Avrami q t = q e × ( 1 e ( K A V × t ) n A V ) Equation (5)
Intraparticle diffusion q t = k i p t + C Equation (6)
Langmuir q e = Q max 0 . K L . C e 1 + K L . C e Equation (7)Ce: concentration of adsorbate at equilibrium.
Q0max (mg/g): maximum monolayer adsorption capacity of Langmuir.
KL (L/mg): Langmuir constant.
KF [(mg/g)/(mg/L)n]: Freundlich constant.
nF: dimensionless Freundlich intensity parameter.
KRP (L/g) and a RP (mg/L) –g are the Redlich–Peterson constants.
gRP: dimensionless Redlich–Peterson exponent, g should be ≤ 1.
Q0max (mg/g): the Liu maximum adsorption capacity.
Kg (L/g): is the Liu equilibrium constant.
nL: is dimensionless exponent of the Liu equation.
Freundlich q e = K F . C e 1 / n F Equation (8)
Redlich–Peterson q e = K R P . C e 1 + a R P . C e g Equation (9)
Liu q e = Q max 0 . ( K g . C e ) n L 1 + ( K g . C e ) n L Equation (10)
Table 3. Chemical composition (wt %) of the DSD material.
ParametersSiO2CaOAl2O3Fe2O3MgOSO3K2ONa2OP2O5TiO2SrO
Percentage38.0318.9911.834.933.702.191.640.180.180.650.11
Table 4. Kinetic parameters of CV dye adsorption onto DSD material at C0 = 30 mg/L.
Model ParameterUnitValueStandard Error
PFO k1L/min0.0780.006
qemg/g25.40.416
R20.982
χ21.270
PSO k2g/mg×min0.0042.2 × 10−4
qemg/g27.40.228
R20.997
χ20.221
Elovich αmg/g × min18.17.954
βg/mg0.2530.024
R20.966
χ22.356
Avrami KAVmin−10.0710.004
nAV0.6610.045
qmg/g26.10.306
t1/2min8.1
R20.996
χ20.347
Intraparticle-diffusionFirst
step
KIPmg/g/min1/20.9260.169
Cmg/g2.882.07
R20.908
Χ20.162
Second
step
KIPmg/g/min1/20.0480.008
Cmg/g20.590.628
R20.953
Χ20.121
Third
step
KIPmg/g/min1/20.0080.004
Cmg/g24.350.905
R20.902
Χ20.213
Table 5. Parameters of adsorption isotherms of CV dye onto DSD adsorbent.
ModelUnitTemperature
20 °C35 °C50 °C
Langmuir
Qomaxmg/g183.6198.0243.6
KLL/mg0.00470.00450.0041
R20.9940.9950.995
χ26.737.0211.23
Freundlich
KF(mg/g)/(mg/L)−1/n2.582.802.77
nF1.5071.5021.441
R20.9920.9890.986
χ27.9316.0229.20
Redlich–Peterson
KRPL/g1.370.991.00
aRP(mg/L)−g0.0981.0060.004
g0.5830.001.00
R20.9910.9010.994
χ28.23169.6212.84
Liu
Qmaxmg/g299.9215.4211.6
KgL/mg0.0020.0040.005
nL0.8230.9551.088
R20.9960.9950.995
χ24.967.8412.05
Table 6. Comparison of the monolayer adsorption capacity (Qomax) of CV Dye onto DSD material to different adsorbents reported in the literature.
Textural PropertiesConditions of Adsorption IsothermQomax
(mg/g)
Reference
SBET (m2g)Vtoal (cm3/g)m/V (g/L)pHt (h)Co Range (mg/L)T (°C)
Raw smectite clay74.00.190.5-2412.5–100-86.5[37]
Surfactant modified bentonite27.90.240.29.0481.6–40830149[48]
Zéolite–Montmrillonite adsorbent19.270.1219.02420–1502568.7[49]
Cu(II)-loaded Montmorillonite83.0-1.08.2510-10025114.3[50]
Natural clay128.00.320.57.5390–30030330.0[6]
Palm Petioles biochar640.00.4031.07.0245–25020196.5[7]
Woody biochar (at 700 °C)808.00.892.08.045–20030125.5[51]
DSD39.080.0891.07.044–25020183.6This study
DSD39.080.0891.07.044–25035198.0This study
DSD39.080.0891.07.044–25050243.6This study
Table 7. Thermodynamic parameters for CV dye adsorption process onto DSD adsorbent.
T (K)KCVan ’t Hoff EquationΔ (kJ/mol)Δ (kJ/mol)Δ (J/mol K)
293106426.8y = 427.8 x + 10.12−28.18-3.5684.14
308101898.0R2 = 0.946−29.51
32392840.4 −30.70
Publisher’s Note: MDPI stays neutral with regard to jurisdictional claims in published maps and institutional affiliations.

