Article

Spatial-Temporal Variability of Future Rainfall Erosivity and Its Impact on Soil Loss Risk in Kenya

1
Aerospace Information Research Institute, Chinese Academy of Sciences, Beijing 100101, China
2
University of Chinese Academy of Sciences, Beijing 100049, China
3
Department of Geomatic Engineering and Geospatial Information Systems, Jomo Kenyatta University of Agriculture and Technology, P.O. Box 62000, Nairobi 00200, Kenya
4
Sino-Africa Joint Research Centre, P.O. Box 62000, Nairobi 00200, Kenya
5
International Water Research Institute, Mohammed VI Polytechnic University, Lot 660, Hay Moulay Rachid, Ben Guerir 43150, Morocco
6
Collaborative Innovation Center on Forecast and Evaluation of Meteorological Disasters, Key Laboratory of Meteorological Disaster, Ministry of Education, Nanjing University of Information Science and Technology, Nanjing 210044, China
*
Author to whom correspondence should be addressed.
Appl. Sci. 2021, 11(21), 9903; https://doi.org/10.3390/app11219903
Submission received: 24 September 2021 / Revised: 15 October 2021 / Accepted: 18 October 2021 / Published: 23 October 2021
(This article belongs to the Special Issue Soil Erosion Modelling and Investigations)

Abstract

:
Ongoing climate change poses a major threat to the soil resources of many African countries that mainly rely on an agricultural economy. While arid and semi-arid lands (ASALs) take up most of Kenya’s land mass, approximately 64% of its total croplands lie within mountainous areas with high rainfall, hence, areas highly vulnerable to water erosion. Flooding of the Great Lakes and increasing desertification of the ASALs are illustrative cases of the implications of recent precipitation dynamics in Kenya. This study applied the Revised Universal Soil Loss Equation (RUSLE) to estimate future soil erosion rates at the national level based on four Coupled Model Intercomparison Project v5 (CMIP5) models under two Representative Concentration Pathway (RCP) scenarios. Results showed the current soil loss rate to be at 4.76 t ha−1 yr−1 and projected an increase in average rainfall erosivity under the two scenarios, except for RCP-2.6 (2030s) and (2080s) for the MIROC-5 model. Future projections revealed an incremental change in rainfall erosivity from the baseline climate by a cumulative average of 39.9% and 61.1% for all scenarios by the 2030s and 2080s, respectively, while soil loss is likely to increase concomitantly by 29% and 60%, respectively. The CCCMA_CANESM2 model under the RCP 8.5 (2080s) scenario projected the highest erosion rate of 15 t ha−1 yr−1 over Kenya, which is a maximum increase of above 200%, with the Rift Valley region recording an increase of up to 100% from 7.05 to 14.66 t ha−1 yr−1. As a first countrywide future soil erosion study, this assessment provides a useful reference for preventing water erosion and improving ecosystem service security.

1. Introduction

The global soil erosion rate (36 billion metric tons of soil per annum) is projected to increase by as much as 30–66% over the next half century due to climate change, with the highest rise projected over Sub-Saharan Africa (SSA) [1,2]. Accelerating global warming severity is expected to have adverse effects on crop production, adversely affecting food security, especially in the drought prone SSA countries that mainly rely on rain-fed agriculture [3,4,5,6,7,8]. Future climate variability will most likely intensify rainfall runoff patterns, leading to increased soil water erosion, thus negatively impacting agricultural production in this region [9,10,11,12,13]. This endangers more than half of the human population in SSA countries that are predominantly over-dependent on subsistence farming [14,15]. Within East Africa (EA), both climatic variability (temperature extremes, altered biomass cover and precipitation concentration) and human-related activities (land use and control practices) have been the core drivers of soil loss increments in recent years, currently approximated at 4.0 Bt yr−1 [9,10,11,14,16,17,18,19]. The Intergovernmental Panel on Climate Change (IPCC) 2014 report [20] and recent studies projected a high ‘likelihood of enhanced rainfall’ in EA due to increases in the concentration of atmospheric greenhouse gases (GHG) [12,21,22]. Since almost 75% of soil erosion variation is attributed to rainfall erosivity and the terrain’s slope gradient [23], the projected precipitation over EA heightens the potential level of soil loss in this tropical region [17,24]. It is thus increasingly necessary to quantify climate-driven soil erosion rates in order to formulate appropriate adaptation and conservation measures.
The exacerbation of soil erosion due to climatic changes has profound implications on the natural environment, including reduced soil nutrients and organic matter, land degradation, ecosystems deterioration, polluting water quality and sedimentation [2,25,26,27]. In Kenya, approximately 61.4% of the total land mass is under severe land degradation [28,29,30], while the average annual soil loss rate for all croplands (mostly in highland areas with high annual precipitation) was recently estimated at 26 t ha−1 yr−1 [14]. Thus, cropland areas are incurring agricultural productivity and ecosystem services losses, as they have surpassed the average annual soil loss threshold for tropical areas (11 t ha−1 yr−1), as indicated by references [7,31]. Arid and Semi-Arid Lands (ASALs) that occupy about 84% [29,32] of the total area are highly vulnerable to food insecurity due to high evapotranspiration rates, prolonged droughts and highly erodible soils coupled with torrential rainstorms. These ASALs form a vital ecosystem, as they support over 30% of Kenya’s population, 70% of the total national livestock and over 65% of natural wildlife [6,33,34].
Kenya is highly vulnerable to the effects of climate variability [12,13,27]. In the recent past, the country and the Greater Horn of Africa at large recorded extreme climatic events, including the El-Niño–La-Niña phenomena that exposed it to drought, floods, landslides and habitat destruction [27,35,36]. Recent rainfall pattern changes (reduction in March–May ‘long rains’ and wetter October–December ’short rains’) have partly resulted in flooding of the lakes within the Kenya Great Rift Valley region, causing huge environmental and socio-economic losses [18,37,38,39]. Otieno and Anyah [40] predicted an increase in the March–May long rains over EA, although Rowell et al. [22] noted the ‘East African climate parodox’, given the opposite trends between the observed and projected rainfall. With such high rainfall uncertainty, it is of significance to quantify future trends of rainfall erosivity and determine their implications on future soil erosion rates within the country.
Agriculture contributes the largest share of Kenya’s economy and provides employment to approximately 67% of the population [6,33]. This implies that in order to achieve productivity that matches the demand of an ever-increasing human population (a 60–110% increase in food production [13,41,42,43]), it is imperative to devise eco-sustainable production methods, as well as monitor soil erosion within the country from a climate change perspective. Different studies have applied various approaches to highlight environmental issues related to soil erosion within the country, majorly on short temporal scales [44,45]. Recent works by Kogo et al. [46] and Watene et al. [47] utilized the widely applied Revised Universal Soil Loss Equation (RUSLE) model and noted incremental changes in soil erosion rates by 66% and 14% in the Western and Rift Valley regions, respectively, over the past two decades. Similarly, a study by Angima et al. [48] reported an average annual soil loss rate of up to 549 t ha−1 yr−1 in the central highland areas, while Yves et al. [49] presented a rate of 6–10 t ha−1 yr−1 in the coastal region. There are very limited studies that have been conducted at the national scale while considering the spatial-temporal risk of soil loss under the current climate conditions, as well as in context of climate change [18].
Numerous studies have incorporated projected precipitation data from General Circulation Models (GCMs) to predict rainfall erosivity climatic factor within RUSLE [25,41,50,51,52]. In Africa, Amanambu et al. [53] observed soil loss increases ranging between 12.2–20.6% within the Niger basin, while in Asia, Doulabian et al. [54] reported a maximum erosion increase of >135% over Iran. Closer to Kenya, a recent study by Moges et al. [10] showed an increase of 23% in soil loss vulnerability in Ethiopia by the year 2050. Nevertheless, only a small number of researchers have estimated soil loss risk in SSA countries using future GCMs [55]. The aim of this study has been to (i) assess the current soil erosion rates at the national scale by physiographic regions and topography and (ii) evaluate the spatial and temporal variability of future rainfall erosivity and soil loss based on GCMs of CMIP 5 under RCP 2.6 (optimistic) and 8.5 (pessimistic) scenarios.

2. Materials and Methods

2.1. Description of the Study Area

Kenya is an equatorial country that geographically extends between latitudes 4°63′ N and 4°68′ S and longitudes 33°9′ E and 41°9′ E (Figure 1). The country has a moderate tropical climate with large regional variations influenced by multiple factors [13]. It has a high undulating topography and heterogeneous landscape (Figure 2 and Figure 3) covering an area of approximately 582,646 km2, with a human population of 47.5 million [33,56]. The mountains and plateaus of the inland area (Figure 3b) have a temperate climate, while the north-eastern region that forms part of the eastern-end of the Sahelian zone is mostly hot and dry all year long. Kenya receives an average annual rainfall (bimodal) of about 680 mm (Figure 2d), with the dominant African savannah climate (Figure 2a) having a mean annual precipitation of about 2000 mm. The ‘Very Arid’ zone occupies about 43.5% of the total area (Figure 2c) followed by the ‘Arid’ zone which has 21.6% coverage. The major soil types (Figure 2b) are Luvisoil (19.2%) and Yermosols (18.7%). According to the 2016 Climate Change Initiative Land Cover map of Africa (CCI-LULC) [57]) (Figure 3c), the dominant land classes include grassland (37.2%) and shrubland (30.2%).
Approximately 21.6% of the country experienced a browning trend as per the 2015 land degradation-neutrality (LDN) national baseline [30]) due to climate change and increasing human population pressure. This has endangered sustainable agriculture that forms the country’s mainstay economy. In recent years, rainfall-related risks have plagued the country, including floods, landslides and droughts. Currently, most of the Great Lakes have drastically bulged (Figure 4) flooding large tracts on adjacent farmlands and settlements. This has been attributed to a 50-year period of climatic phenomena [39], as well as the recent enhanced OND East African short rains linked to the Indian Ocean Dipole (IOD) [37]. Rampant deforestation in the country’s water towers and adverse farming practices within highland areas could also have altered surface water runoff patterns into these lakes [58,59,60].

2.2. Observed Precipitation

Observed monthly precipitation data for 29 land-based meteorological stations spanning over a period of 30 years (1970—2000) were sourced from the Kenya Meteorological Department (KMD).The stations covered all the Agroecological Zones and Agroclimatic Zones, as well as low to high altitude regions of the investigated area. Figure 5 gives the mean monthly rainfall (seasonal variability and intensities) over the study area.

2.3. Genereal Circulation Models

Studies by Ongoma et al. [12,61] noted that CCCMA_CANESM2, CESM1-CAM5, CSIRO_MK3.6.0 and MIROC-5 CMPI5 GCMs (Table 1) are among the top eight models that well simulate rainfall patterns for the EA region. The projected precipitation data of these four GCMs were downloaded from the CMPI5 archive of the Climate Change Agriculture and Food Security (CCAFS) database (http://www.ccafs-climate.org/ accessed on 3 January 2021) for the 020–2049 and 2060–2089 periods under two Representative Concentration Pathways: RCP 2.6 (low scenario) and RCP 8.5 (high baseline emission scenario). The RCP 2.6 and 8.5 represent radiactive forcing of 3.0 and 8.5 W/m2, respectively, by 2100. The baseline climatic data, at 1 km2 spatial resouliton, was sourced from the WorldClim database [62]. The WorldClima data form an intergral input in the formulation of future GCMs; thus, they are seen as a good source of baseline climatic data [52]. In this study, future climatic data were statistically bias corrected and downscaled to unify their horizaontal resolution with that of the baseline data using the delta method [63]. Projected rainfall erosivity for the 2030s and 2080s periods were then quantified based on the R factor methods from the RUSLE model (Figure 6).

2.4. Methodological Framework

2.4.1. RUSLE Model Application

Recent advancements in GIS and remote sensing technologies have made it relatively easy to estimate and monitor soil loss, both at local and global scales (with varying climates), using the empirical RUSLE soil erosion model. As an updated version of the Universal Soil Loss Equation (USLE), the RUSLE equation forecasts soil erosion risk using five environmental and anthropogenic variables: rainfall erosivity, topography, vegetation cover and land support practices. The average annual soil loss ( A ) in the RUSLE model is expressed by Equation (2) [64]
A = R K L S C P
where:
A is expressed in MJ mm ha−1 h−1 yr−1, R is the rainfall erosivity factor (MJ mm ha−1 h−1 yr−1), K is the soil erodibility factor (t ha h ha−1 MJ−1 mm−1), LS is the slope length and steepness factor (dimensionless), C is the cover management factor (dimensionless, ranges from zero to one) and P is the conservation practice factor (dimensionless)
The various geospatial datasets, with their respective sources used in this study, are as summarized in Table 2. The RUSLE model was run to estimate the current soil erosion rate based on baseline rainfall erosivity, while future soil losses were forecasted based on respective projected rainfall erosivity scenarios.

2.4.2. Rainfall Erosivity (R) Factor

Rainfall erosivity is the most significant factor in the RUSLE model ([23,67]); it influences approximately 80% of the total soil loss. The rainfall erosivity factor is the product of raindrop kinetic energy (E) and the maximum 30 min rainfall intensity (I30) [64]. Acquiring complete pluviographic data (with a minimum of 20 years in order to capture cyclical rainfall dynamics) is a huge setback in African countries due to insufficient gauged meteorological stations [49]. Different approaches have been used to derive the R factor within Kenya. Maeda et al. [9] and Schürz et al. [44] utilized the Fourier index (Equations (2)–(4)) and Modified Fourier Index (Equations (5) and (6)), respectively, while Yves [49] applied the model suggested by reference [64] (Equation (7)) to compute rainfall erosivity for the entire coast of Kenya. With access to some rainfall intensity data, Angima [48] and Akali [68] used (Equations (8)–(10)) to determine estimates for the western and central regions, respectively. Various regression realizations have also been exploited, including Renard and Freimund (Equations (11) and (12)) [44], Moore (Equations (13) and (14)) [44] and Lo et al. (Equation (15)) [47].
F I   = P 2 i P
r i = 125.92 × F I 0.603 + 111.173 × F I 0.691 + 68.73 × F I 0.841     3
R = i = 1 12 r i
where Pi is the average monthly rainfall (mm) for month i, P is the mean annual precipitation (mm) and ri is the average monthly erosivity (MJ mm ha−1 h−1 month−1).
R a   = α M F I + β
M F I = 1 P i = 1 12 P i 2
where α and β are regression coefficients (taken as 50.7 and −1405, respectively, for the African continent [69]), Pi is the average monthly rainfall (mm) for month i and P is the mean annual precipitation (mm).
R   = i = 1 12 1.735 × 10 ( 1.5   log 10 ( P i 2 P ) 0.08188 )    
where Pi is the average monthly rainfall (mm) for month i, P is the mean annual precipitation (mm) and R is the rainfall erosivity (MJ mm ha−1 h−1 y−1).
R = 1 n ( j = 1 n k = 1 m j ( E I 30 ) k )
E I 30   = I 30 ( i = 1 m e r v r )
e r = 0.29 [ 1 0.072 exp ( 0.05 i r ) ]
where R is the mean annual rainfall erosivity (MJ mm ha−1 h−1 y−1), n is the number of years of data, mj is the number of erosive events in the j year, EI30 is the rainfall erosivity index of a storm k, er is the unit rainfall energy (MJ h−1), vr is the rainfall depth (mm) during a time period r, I30 is the maximum rainfall intensity during a 30 min period of the rainfall event (mm h−1) and ir is the rainfall intensity during the period (mm h−1).
R   = 0.04830 × P 1.61 ,   w h e r e   P 850   mm
R   = 587.8 1.219 P + 0.004105 P 2 ,   w h e r e   P 850   mm
where P is the average mean annual rainfall (mm) and R is the rainfall erosivity (MJ mm ha−1 h−1 y−1).
K E   = 11.46 × P 2226
R   = ( 0.029 × K E 26.0 ) × 17.02
where KE is the kinetic energy, R is the rainfall erosivity (MJ mm ha−1 h−1 y−1) and value 17.02 is a conversion factor from imperial to International (SI) units.
R   = 38.46 + 3.48 × P ,
where P is the average mean annual rainfall (mm) and R is the rainfall erosivity (MJ mm ha−1 h−1 y−1).
In this study, the rainfall erosivity factor was derived using (Equations (11) and (12)), since it has been widely applied in previous similar studies.

2.4.3. Erosivity Density Ratio

The erosivity density (ED) value is the ratio of rainfall runoff erosivity to precipitation and is given by the expression (Equation (16)):
E D = R P
where ED (MJ ha−1 h−1) [52] is the erosivity density, P annual rainfall (mm) and R is the rainfall erosivity.

2.4.4. Rainfall Erosivity (R) Parameter Evaluation

Monthly precipitation data observed from 29 meteorological synoptic stations were used to evaluate the validity of R factor values derived from the baseline data. Three statistical techniques were used to assess the performance of the R factor of the observation data with that of the baseline data: the coefficient of determination (R2), root mean squared error (RMSE) and Nash–Sutcliff Efficiency (NSE) [70], as shown in Equations (17), (18) and (19), respectively;
R 2 = 1 [ i = 1 n   ( Y i m o d e l Y i o b s ) 2 i = 1 n   ( Y i m o d e l Y i o b s ) 2 + i = 1 n   ( Y i m o d e l Y i m e a n ) 2 ]
R M S E = [ i = 1 n   ( Y i o b s Y i m o d e l ) 2 n ]
N S E = 1 [ i = 1 n   ( Y i o b s Y i m o d e l ) 2 i = 1 n   ( Y i o b s Y i m e a n ) 2   ]
where Y i m o d e l is the baseline rainfall erosivity, Y i o b s is the observed rainfall erosivity and Y i m e a n is the mean of observed and baseline rainfall erosivity.

2.4.5. Soil Erodibility Factor

The soil erodibility (K) factor takes into account the inherent soil properties (including soil texture, organic matter content and the permeability) to quantify soil erodibility or susceptibility to disintegration due to surface water runoff action. This present study utilized the EPIC (erosion-productivity impact calculator) model, as contended by Williams [71], to derive the K factor using the sand, organic, silt and sand soil fractions of the area, as compiled by the Africa Soil Information Service (AfSIS) [66].
K = F c s a n d × F s i c l × F o r g c × F h i s a n d × 0.1317
F c s a n d = [ 0.2 + 0.3   e x p ( 0.0256 S A N ( 1 S I L 100 ) ) ]
F s i c l = [ S I L C L A + S I L ] 0.3
F o r g c = [ 1.0 0.0256 C C + e x p ( 3.72 2.95 C ) ]
F h i s a n d = [ 1.0 0.70   S N 1 S N 1 + e x p ( 5.51 + 22.9   S N 1 ) ]
where SAN, SIL and CLA are the percentage of sand, silt and clay content, respectively; C is the organic carbon content and SN1 is the sand content subtracted from 1 and divided by 100. Fcsand (Equation (4)) gives a low soil erodibility factor for soil with coarse sand and a high value for soil with little sand content. Fsi-cl (Equation (5)) gives a low soil erodibility factor with a high clay to silt ratio; Forgc (Equation (6)) is the factor that reduces soil erodibility for soil with high organic contents. Fhisand (Equation (7)) is the factor that reduces soil erodibility for soil with extremely high sand content. Multiplication by the constant value 0.1317 converts the values to International (SI) units.

2.4.6. Slope Length and Slope Steepness (LS) Factor

The dimensionless LS geophysical factor is a product of two terrain derivatives (slope length (L) and slope steepness factor (S)) that expresses the influence of the landscape on soil loss. Kim [72] defined slope length as the distance between the point of origin of overland flow to the point where the surface runoff waters flow into a well defined channel. High slope lengths along steep slopes result in increased surface runoff and, thus, high erosion rates. A 30 m void-filled SRTM DEM was first pre-processed to correct for sink errors before estimating slope length and steepness attributes using the Spatial Analyst extension of ArcMap 10.2 (Environment Systems Research Institute (ESRI) Inc., Redlands, CA, USA). Equation (25) was used to compute the slope length factor, while the S factor was generated using the McCool et al. [73] (1987) method (Equation (28)).
L i . j = ( A i . j i n + D 2 ) m + 1 A i . j i n m + 1 D m + 2 · x i . j m · ( 22.13 ) m
m = β 1 + β
β = s i n θ / 0.0896 3 ( s i n θ ) 0.8 + 0.56
S i . j = { 10.8 s i n   θ i . j + 0.03 ,   t a n θ i . j < 9 % 16.8 s i n   θ i . j 0.50 ,   t a n θ i . j 9 %
where Li.j = slope length factor for the grid cell with coordinates (i.j); D = the grid cell size (m); Xi.j = s i n a i + c o s a i . j ; ai.j = aspect direction for the grid cell with coordinates (i.j); Ai.j-in = flow accumulation or contributing area at the inlet of a grid cell with coordinates (i.j) (m2), β = the ratio of inter-rill erosion and θ = the slope in degrees

2.4.7. Cover Management Factor (C) Factor

The C factor varies from 0 to 1 and models the conservative property of ground vegetation cover against surface water runoff. This implies that holding other parameters constant, thick canopies, e.g., forests, are more likely to prevent soil erosion better than bare or sparse cover; thus, they are assigned a low C factor value [74]. Phinzi et al. [75] evaluated the use of the Durigon algorithm [76] in deriving C factor values based on NDVI for tropical areas, while Watene [47] recommended the use of LULC maps to assign C parameters in Kenya. Similar to other regional studies in other parts of the world focusing on future rainfall erosivity [3,24,50,77], the nationwide 2016 LULC map was used to obtain C coefficients to compute the present soil erosion status, as well as for the 2030s and 2080s periods. Table 3 shows C factor values used in this research, as sourced from past literature within the East Africa region.

2.4.8. Support Practice (P) Factor

The P factor reflects the effects of man-made soil conservation measures with reference to how they impact the intensity and flow of surface runoff. Renard [23] expressed it as a ratio of the amount of soil erosion in a given area with a unique conservation measure to the corresponding erosion following upward and downward tillage. Various approaches have been employed to determine the P factor, e.g., applying DEM, high resolution imagery and using LULC maps in combination with field inspections. However, only a little has been done to determine support practices across the EA region [80]. A P factor value of one (1), indicating no major support practice in place, was thus adopted for the entire study area [14,49].

3. Results

3.1. Estimated Baseline Soil Erosion Rates in Kenya

The baseline and observed precipitation were statistically compared to evaluate the quality of the simulation produced by the WorldClim data (Figure 7). A correlation coefficient of approximately 0.91 was observed, indicating the strong relationship between these two variables. The mean annual R factor generated by observed rainfall data varied from 267–31,667 MJ mm ha−1 h−1 yr−1, with an average of 1714.31 MJ mm ha−1 h−1 yr−1. In comparison, the WorldClim data presented an R factor (baseline) with an average of 1665.9 MJ mm ha−1 h−1 yr−1 (Figure 8a). The observed and baseline R factors showed 0.93, 273 MJ mm ha−1 h−1 yr−1 and 0.74 for R2, RMSE and NSE, respectively, demonstrating a satisfactory model performance. Highland regions with high mean annual rainfall presented R factor values >5000 MJ mm ha−1 h−1 yr−1.
The Soil erodibility Factor (K) had a mean value of 0.019 t ha h ha−1 MJ−1 mm−1 and ranged from 0.014 to 0.028 t ha h ha−1 MJ−1 mm−1 (Figure 8b), while the cover management Factor (C) had a mean value of 0.089 (Figure 8d). The northern parts of Kenya with bare and arid surfaces recorded the highest C values. Almost 78% of the country had an LS factor between 0 and 10, while 4% had values of more than 10 (even though steep gradients may not necessarily show high erosion susceptibility [50]). The mean baseline soil erosion rate was observed to be 4.76 t ha−1 yr−1 which had a spatial distribution that varied equally with that of the annual precipitation of the country (Figure 9). The baseline erosivity density ED had an average value of 2.77 MJ ha−1 h−1 and a standard deviation 1.06 MJ ha−1 h−1 (Figure 9b).

3.2. Classification of Baseline Soil Erosion by Severity

Similar to the study by reference [81], the mean annual soil erosion rate was grouped into six levels of severity: slight, moderate, high, very high, severe and very severe (Table 4) Most of the investigated area had a slight severity erosion rate, while approximately 3.7% of the total area fell within the severe and very severe categories.

3.3. Baseline Soil Erosion by Land Use and Land Cover

From the study, croplands which mostly occupy areas with a high mean annual precipitation (central highlands and Lake Victoria parts of the country), had the highest mean erosion rates of 17.86 t ha−1 yr−1 (Table 5). This was followed by Barelands and sparsely vegetated lands in the northern ASALs, which had mean erosion rates of 3.39 t ha−1 yr−1 and 2.62 t ha−1 yr−1, respectively.

3.4. Baseline Soil Erosion by ACZ and Climate Zones

Humid areas with an average annual rainfall erosivity of 9100.7 MJ mm ha−1 h−1 yr−1 had the highest mean erosion rate, followed by sub-humid and semi-humid areas, as represented in Table 6. Regions under the tropical rainforest climate around Lake Victoria recorded the highest soil erosion rate (27.84 t ha−1 yr−1), while the arid desert climate zones had the lowest mean annual soil loss rate (0.38 t ha−1 yr−1) (Table 7).

3.5. Baseline Soil Erosion by Kenya Regions and Basins

The Coastal and Rift Valley regions had mean annual erosion rates below 10 t ha−1 yr−1 as demonstrated by the recent regional works by Yves et al. [49] and Watene et al. [47] (Table 8). The Lake Victoria region, which is characterized by a high mean annual precipitation (tropical rainforest climate zone) and mostly under croplands, recorded the highest soil loss rate of 25.25 t ha−1 yr−1 (Table 9). Out of the five basins that form the drainage landscape of Kenya, the Lake Victoria basin was shown to have the highest soil erosion rate, followed by the Great Rift Valley and Tana River basins, respectively.

3.6. Baseline Soil Erosion by Slope and Elevation

Lands with slope (>26.8%) had the highest mean erosion rates of about 21.41 t ha−1 yr−1, while flatter regions (0–7%) recorded the lowest rates of 1.88 t ha−1 yr−1 (Table 10). Highland areas, which are the wettest among all the five elevation classes of the country, also represented the highest mean annual erosion rates (Table 11).

3.7. Baseline Soil Erosion by Soil and Landform Types

Soils in areas with a mean annual rainfall erosivity greater than 4500 presented high mean annual soil loss rates above 10 t ha−1 yr−1 (Table 12). Nitosols had the highest erosion rate of 22.69 t ha−1 yr−1, followed by Andosols and Planosols. Yermosols, which are predominant in the north-eastern parts of the country, recorded the lowest mean soil loss rates. The steep escarpment landforms of the Great Rift Valley presented the highest annual erosion rates, followed by mountainous landforms (Table 13).

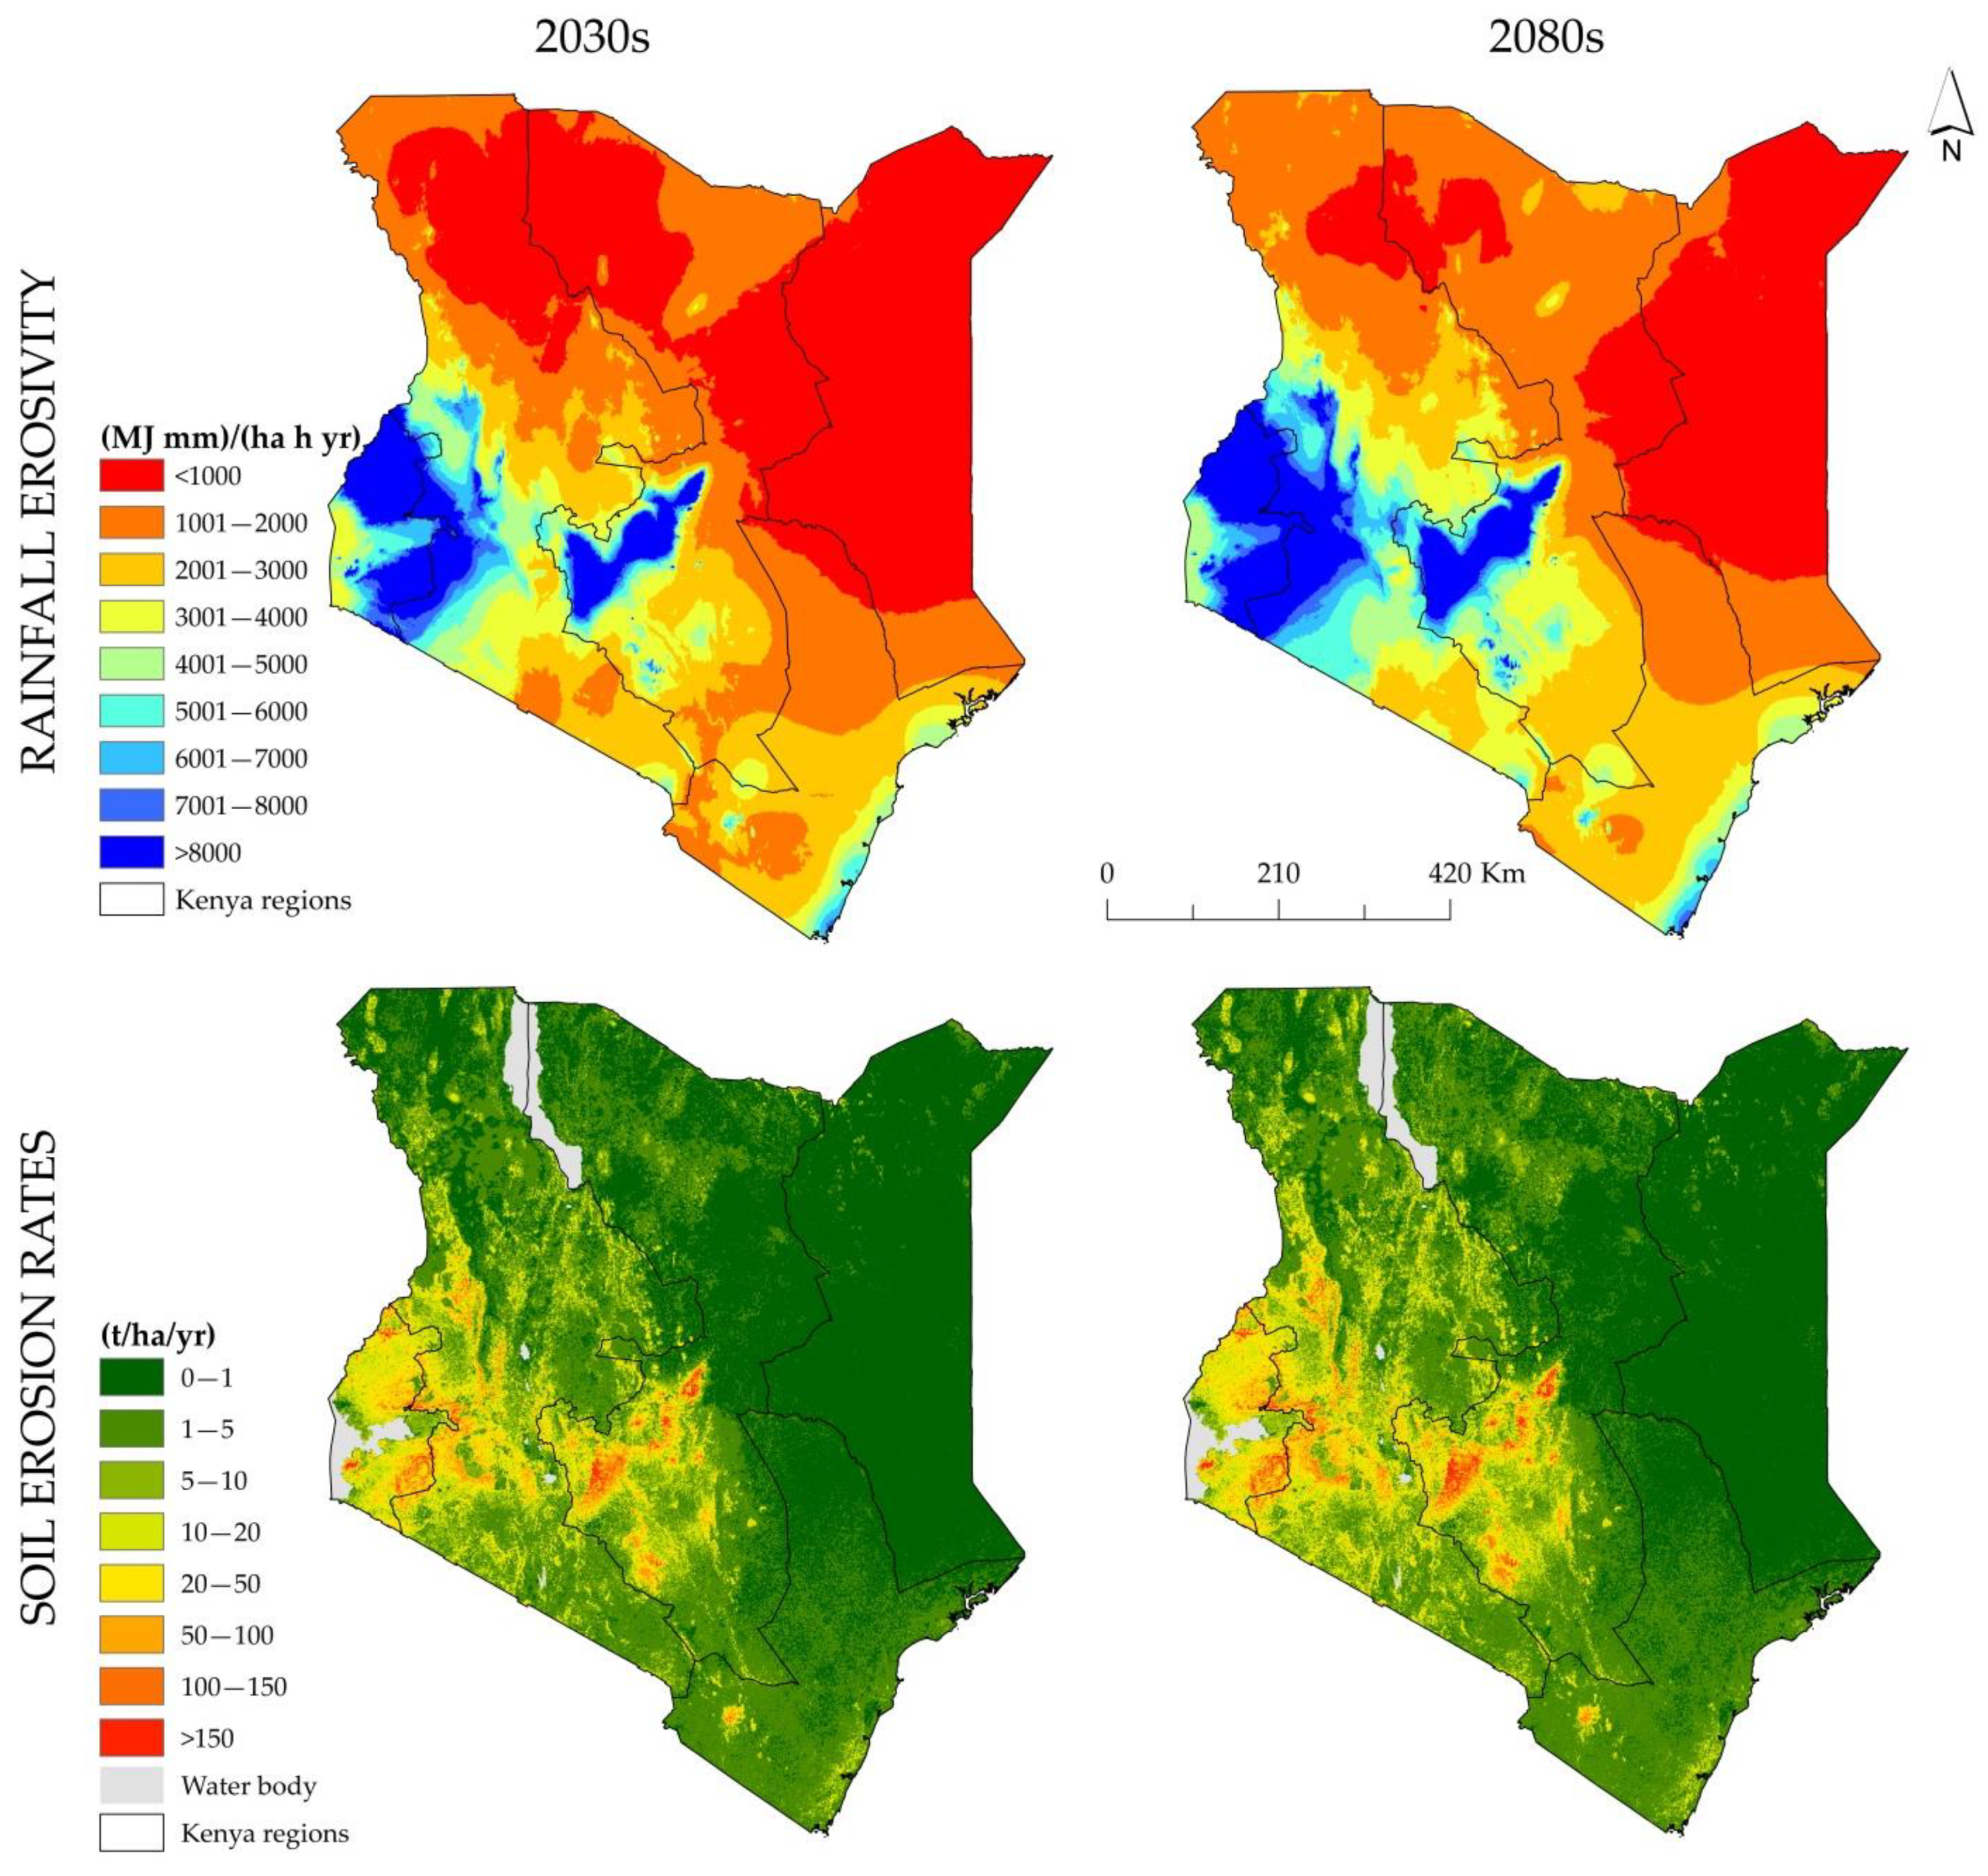
3.8. Projected Rainfall Erosivity and Soil Erosion Rates in Kenya

Table 14 and Table 15 give the statistical details and comparisons of the baseline rainfall erosivity, with projected future values computed from the CMIP5 models under the two RCPs. For the 2080s period, all the GCMs, except MIROC-5 RCP 2.6, revealed an increase in precipitation, with CCCMA_CANESM2 RCP 8.5 recording the highest rise of 85.2% for the entire country. Similarly, only MIROC-5 RCP 2.6, MIROC-5 RCP 8.5 and CSIRO_MK3.6.0 RCP 2.6 GCMs resulted in a precipitation decrease in all of the 2030s projections. Nationwide, there was a general upward trend in rainfall erosivity in all the GCMs in both periods, except for MIROC-5 RCP 2.6 (2030s) and MIROC-5 RCP 8.5 (2080s), which showed −3.9% and −8.2% decreases, respectively (Figure 10 and Figure 11).
CCCMA_CANESM2 RCP 2.6 (2080s) produced the largest percentage change of erosivity density, followed by CCCMA_CANESM2 RCP 8.5 (2030s) (Figure 12). The projected mean annual erosion rates for the CCCMA_CANESM2 GCMs were notably high amongst all the other GCMs under all scenarios, with CCCMA_CANESM2 RCP 2.6 recording an increment of 99.16% in the 2030s and a 217.23% increase in the 2080s under RCP 8.5, respectively (Figure 13). The overall average soil erosion rate of all the GCMs ensembles in the 2030s time-slice demonstrated a 29% increase compared to the baseline period, while for the 2080s period, a +59.87% change was noted (Figure 14). All the GCMs revealed increments in future erosivity values across all Kenyan regions in the years 2030s and 2080s under RCP 8.5, except CSIRO_MK3.6.0 RCP 8.5 (2030s) (−3.9% for the coastal region), MIROC-5 RCP 8.5 (2030s) (–3.2% and –15.7% for the northern and Rift Valley regions, respectively) and MIROC-5 RCP 8.5 (2080s) (–5% for rift valley region) (Table 15). The MIROC-5 GCM produced the most varied changes, including the lowest change of −25.1% for the Rift Valley Region in the 2080s under RCP 2.6. The North Eastern Region (NER) had the lowest rainfall erosivity among all the Kenya regions, with a mean rainfall erosivity of 644.8 MJ mm ha−1 h−1 yr−1 in the baseline period. The CSIRO_MK3.6.0 RCP-2.6 (2030s) forecasted the lowest change of −16.3% in this region, followed by MIROC-5, which predicted a decrease ranging from −3.2% to −11.8% during the two time periods for the two emission scenarios. In contrast, the CESM1-CAM5 RCP-8.5 (2080s) predicted the highest increase in rainfall erosivity of approximately 97.3%. The baseline average rainfall erosivity of the Lake Victoria region that falls within the tropical rainforest climate had the highest rise (98.0%) under the CCCMA_CANESM2 RCP-8.5 (2080s) projection. Most of the GCMs produced positive changes in the mean annual erosion rates, with the rift valley region indicating the highest change (107.94% under the CCCMA_CANESM2 RCP 8.5 (2080s)) (Table 16).
The exception here was the MIROC-5 model, which indicated negative soil erosion rate changes in all the projections under the RCP-2.6 scenario. It was notable that only the MIROC-5 model for the Rift Valley Region gave a reduction in soil erosion rates in all of the future RCP-8.5 (2080s) scenarios (Table 16).

4. Discussion

The current study emphasized the merits of the well-tested RUSLE model for monitoring soil erosion rates, which include fast analyses of the impacts of future climate variability on soil erosion (climatic factor), easy adaptability in many GIS platforms (which allows simple computation, even for nationwide erosion risk assessments) and applicability of easily accessible data (both at global and local scales) [82]. The baseline results of the present study were in agreement with other similar works performed within Kenya and around the EA region. The baseline mean annual soil erosion rate was within the range of erosion rates for the EA region, as assessed by references [14,44,83], as well as for the African continent [84]. The baseline soil erosion rate results concurred with the results reported previously in the multiple regional studies [14,16,44,46,49]. The current soil loss rate estimation also corroborated the range of mean erosion rate values for Kenya (5.67 t ha−1 yr−1) reported in the Global Soil Erosion Modelling (GloSEM) [1] However, our baseline mean rainfall erosivity was lower than the value derived from the Global Rainfall Erosivity Dataset (GloREDa) [85] for Kenya (2588.1 MJ mm ha−1 h−1 yr−1). Schürz et al. [44] also noted such a discrepancy in the RUSLE model ensemble for Kenya and Uganda. Such visible differences were also noted after making comparisons between the high-resolution rainfall erosivity (GloREDa) and other similar studies. For instance, reference [41] computed a mean rainfall erosivity (8470 MJ mm ha−1 h−1 yr−1) that was higher than the GloREDa value for Brazil (7560.8 MJ mm ha−1 h−1 yr−1). Similarly, Duulatov et al. [52] observed an erosivity of 1447.7 MJ mm ha−1 h−1 yr−1 against a GloREDa value of 772.7 MJ mm ha−1 h−1 yr−1 over Tajikistan. Table 17 presents a comparison of rainfall erosivity results of this study with past literature R factor values based on multi-years EI30 calculations. The baseline results of the present study were also compared to previous soil erosion plot studies in Kenya for validation purposes (Table 18). The entire croplands in the country were estimated to have the highest baseline average annual soil loss rate (17.86 t ha−1 yr−1), which is comparable to the results reported by Fenta et al. [14]. Most of the croplands are found within areas of steep terrain and highly erodible soils. Okoba and Sterk [86] further attributed these high rates to poor farming practices, where farmers leave the soil bare for extended periods, thus enhancing soil erosion, especially during extreme weather conditions. The total baseline soil erosion rate estimated in Kenya (4.76 t ha−1 yr−1) was slightly less than in most regions of the globe: 39.2 t ha−1 yr−1 for Rwanda [87], 0.7–17.9 t ha−1 yr−1 for Europe, 10.8–146 t ha−1 yr−1 for Africa [84] and 0–273 t ha−1 yr−1 for Nepal [81]. In addition, Kenya’s erosion rate estimates were below the tolerable limit of 25 t ha−1 yr−1 for environments with young mountains topography, as suggested by Stocking [84]. The spatial pattern of the mean annual rainfall figure had a high degree of similarity with other rainfall distribution maps reported at both the continental and regional scales [88]. Nicholson (2017) [89] largely attributed the aridity of the northeastern parts of Kenya to the divergence of the Somali Jet that drives the Indian Monsoon.
Both global and regional phenomena contribute to the heterogeneous nature of Kenya’s rainfall pattern. These include the seasonal migration of the ITCZ that accounts for the EA’s seasonal rainfall variability [97], solar flux fluctuations and global sea surface temperatures (SST) in the Atlantic Ocean, as well as the Indian and Pacific Ocean anomalies that are linked to the Indian Ocean Dipole (IOD) and the El Niño Southern Oscillation (ENSO), respectively [98]. Other factors, including proximity to large inland lakes and orographic effects, greatly influence moisture exchanges, thus contributing to variable local rainfall patterns [89]. Similar to our results, reference [99] also reported rainfall erosivity values greater than 5000 MJ mm ha−1 h−1 yr−1 in the highland areas of Kenya as well as over the Lake Victoria region [18]. Furthermore, the rainfall erosivity distribution map showed a consistent pattern when compared to previous erosivity maps reported for Kenya.
As presented in other previous regional research [50], this study predicted the soil erosion in Kenya with respect to changes in the climatic factor (rainfall erosivity) within the RUSLE model, while holding the other factors constant. Our results indicate that the overall future soil loss rate is projected to increase significantly for both time slices, due to the increased erosive power of precipitation. There was an overall dramatic positive change in rainfall erosivity in the investigated area across all the models, except for model MIROC-5 under the RCP 2.6 scenario for the 2030s and MIROC-5 under RCP 8.5 for the 2080s. The projected future erosion rates were within the range of estimates given other works in EA [10,24,55], as with the continental predictions [1] (Table 19). For instance, references [25,100,101] observed increases of the mean soil loss rate ranging between +17.8%–28.3% in China, Europe and Uzbekistan (Table 19). Similar to observations made by Panagos et al. [100] across Europe, Kenya having a lower erosion rate than Ethiopia (16.9 t ha−1 yr−1) [14] is expected to record larger increments due climate change. High amounts of rainfall can increase the erosive power of runoff and significantly magnify soil loss rates, especially in steep terrains. It is also possible that increases in precipitation can promote vegetation growth and, in turn, enhance plant canopy protection against soil erosion [99]. The highest change in rainfall erosivity was noted in the rift valley, Lake Victoria and central and eastern regions, which consequently resulted in high soil erosion rates. This may lead to other hazardous off-site effects, including sedimentation in water bodies, landslides and flooding in these regions. For most cases, the highest variations in soil loss occurred in the central highlands and western regions of Kenya, which represent areas of intensive agricultural production including the Kenya’s grain basket region [43]. Agricultural output in these regions will most likely be negatively affected by climate variability, due to possible increases in soil erosion rates and soil degradation.
It is important for the country to adapt to these expected changes and devise soil and water conservation policies that will enhance agricultural resilience (ensure a balance between food security and acceptable soil loss rates). Effective soil conservation methods, as eco-sustainable agricultural technologies, should be continuously implemented in such areas. On the other hand, public policies should encourage more agricultural expansions in regions projected to have reductions in average rainfall erosivity [41] (and consequent low soil loss rates), e.g., the North Eastern region, Coastal region and northern parts of the Rift Valley. The recently launched Galana Kalalu irrigation scheme within the NER and CR can be seen as a profitable shift from the country’s overdependence on rain-fed agriculture aimed at improving food security [6,8]. Nevertheless, caution should be taken when converting such natural landscapes into croplands via irrigation, as increased farming in arid lands with no accompanying conservation practices can greatly enhance soil loss rates.
The inability to reflect major rainfall erosivity variability arising from extreme rainfall phenomena is a major setback of the RUSLE empirical method applied. The monthly precipitation data used in the study would not be sufficient to account for the size of raindrops and rainfall duration, which bear a direct correlation to surface erosion. In addition, uncertainties inherent to GCMs, including bias correction methods (Delta method), spatial resolution (resampling to 1 km resolution) and other model assumptions, also pose a major limitation to the present study [53]. Different researchers across the globe have applied multiple climate models with variable future scenarios with an aim to mitigate such uncertainties. Likewise, four GCMs that address differences or inconsistencies arising from climate change signals, e.g., MIROC-5 and CCCMA_CANESM2, were employed based on previous climatology research in Kenya and other similar tropical regions. Different studies have utilized multiple GCMs in soil erosion predictions in order to reduce the uncertainties inherent to climate models. In this study, we selected four models among the top eight models (out of 22 CMPI5 models), which Ongoma et al. [61] demonstrated to well produce rainfall estimations over East Africa. The present research only focused on the impact of the climatic factor (K) and overlooked both anthropogenic (P) and vegetation factors (C), which have been shown to have great significance on soil erosion rates. Holding such pertinent factors at a constant certainly raises questions about the reliability of the future RUSLE predictions [74]. Colman et al. [31] utilized LULC projections based on the contribution of various land uses to greenhouse gas emissions to study future soil erosion rates within the tropical Brazilian Pantanal region and revealed an increasing trend ranging between 40–100%. It is thus important to integrate projected vegetation cover coefficients (based on projections of LULC) in order to improve on the integrity of the results or simulations. The ESRI very recently released a high-resolution Global Land Cover map (10 m) using state-of-the-art artificial intelligence (https://livingatlas.arcgis.com/landcover/ accessed on 3 August 2021), as part of its contribution to climate change action, and it plans to continue this initiative on a yearly basis. This database will be of great importance to environmental modeling studies, e.g., climate change and food security, that require large-scale vegetation cover information (especially for developing countries). Xiong et al. [80] noted that there is limited knowledge of EA’s current support practices; thus P estimations are often neglected in large-scale research or set to a value of “1”, which represents no soil conservation measures as being the worst case scenario. Moreover, Taye et al. [102] reported that the impact of soil conservation measures rapidly decline over time, especially in EA’s ASAL regions.

5. Conclusions

Soil conservation is an integral environmental goal in Kenya as it embarks on its ambitious Kenya Vision 2030 of attaining food security and increasing agricultural production. Kenya also strives to align itself with the United Nations Sustainable Development Goals (SDGs) by enhancing soil protection in order to attain land degradation neutrality by 2030. Recent IPCC reports projected increases in the frequency and/or the intensity of heavy precipitation and pluvial flooding over EA. This increases the risk of soil loss by water in the next century. The present study examined the magnitude of current soil erosion rates (baseline climate) for Kenya, as well as the potential impacts of climate change on rainfall erosivity using multiple GCMs (CCCMA_CANESM2, CESM1-CAM5, CSIRO_MK3.6.0 & MIROC-5) under two greenhouse emissions (RCP2.6 and RCP8.5) for the 2030s and 2080s periods. The baseline soil loss rate was estimated at 4.76 t ha−1 yr−1, with agricultural land being the most susceptible to erosion. There was a steady increase in mean soil erosion rates across most of the model ensembles from the 2030s to 2080s, with only four of all the 16 future scenarios recording a decline in erosion rates. All of the GCMs showed a positive change in average annual rainfall erosivity under all scenarios, except for MIROC-5-RCP2.6 in both the 2030s and 2080s time slices. The cumulative average of rainfall erosivity and soil erosion rates for all of the GCMs in the 2030s (both RCP2.6 and RCP8.5 combined) showed an increase of 39.9% and 29%, respectively, compared with the baseline climate. Similarly, the aggregate average of rainfall erosivity and the soil loss rate for all the GCMs projected increases of 61.1% and 59.87% respectively, in the 2080s. The highest positive change (217.23%) of the soil loss rate over Kenya belonged to CCCMA_CANESM2 RCP 8.5 in the 2080s, while the minimum (−14.29%) was projected under the MIROC-5 RCP 2.6 in the 2030s period. Future climatic projections indicate that major expected increases in rainfall erosivity and soil loss rates are concentrated in the CER and RVR, which represent the main crop production regions of Kenya. In the Rift Valley Region, the relative variation of the mean soil loss rate rose up to 107.94% (CCCMA_CANESM2 RCP 8.5 (2080s). This study provides a good reference to policy makers to enable them devise adaptive soil erosion conservation measures.

Author Contributions

Conceptualization, G.W. and L.Y.; methodology, G.W., Y.H., V.O; investigation and validation, V.O. and B.A.; writing—original draft preparation, G.W., Y.H., F.M.; writing—review and editing, G.W. and F.M.; visualization, G.W. and Y.H.; supervision, L.Y. and Y.N.; project administration, Y.N.; funding acquisition, Y.N. and Z.Z. All authors have read and agreed to the published version of the manuscript.

Funding

This research was funded by the National Key Research and Development Project of China, through grant agreement No 2020YFC1521900 and 2020YFC1521901. This work has also been supported by the National Key Research and Development Program (No. 2014A8007007020) and China Scholarship Council 2014GXYB33, through the Sino-Africa Joint Research Centre.

Institutional Review Board Statement

Not applicable.

Informed Consent Statement

Not applicable.

Data Availability Statement

Data are available in a publicly accessible repository that that does not issue DOIs.

Acknowledgments

The authors would like to express their heartfelt gratitude to the anonymous reviewers for their valuable insights to improve the quality of this study.

Conflicts of Interest

The authors declare no conflict of interest.

References

  1. Borrelli, P.; Robinson, D.; Fleischer, L.; Lugato, E.; Ballabio, C.; Alewell, C.; Meusburger, K.; Modugno, S.; Schütt, B.; Ferro, V.; et al. An assessment of the global impact of 21st century land use change on soil erosion. Nat. Commun. 2017, 8, 2013. [Google Scholar] [CrossRef] [PubMed] [Green Version]
  2. Gemeda, D.; Sima, A. The impacts of climate change on African continent and the way forward. J. Ecol. Nat. Environ. 2015, 7, 256–262. [Google Scholar] [CrossRef] [Green Version]
  3. Borrelli, P.; Robinson, D.; Panagos, P.; Lugato, E.; Yang, J.; Alewell, C.; Wuepper, D.; Montanarella, L.; Ballabio, C. Land use and climate change impacts on global soil erosion by water (2015-2070). Proc. Natl. Acad. Sci. USA 2020, 117, 4. [Google Scholar] [CrossRef]
  4. WMO. State of the Climate in Africa, 2019; WMO: Geneva, Switzerland, 2019. [Google Scholar]
  5. Gomiero, T. Soil degradation, land scarcity and food security: Reviewing a complex challenge. Sustainability 2016, 8, 281. [Google Scholar] [CrossRef] [Green Version]
  6. Ministry of Agriculture Livestock Fisheries and Irrigation. Towards Sustainable Agricultral Transformation and Food Security in Kenya 2019–2029. 2019. Available online: http://www.kilimo.go.ke/wp-content/uploads/2019/05/ASTGS-Long-version.pdf (accessed on 3 January 2021).
  7. Sartori, M.; Philippidis, G.; Ferrari, E.; Borrelli, P.; Lugato, E.; Montanarella, L.; Panagos, P. A linkage between the biophysical and the economic: Assessing the global market impacts of soil erosion. Land Use Policy 2019, 86, 299–312. [Google Scholar] [CrossRef]
  8. Ahmed, S.M. Impacts of drought, food security policy and climate change on performance of irrigation schemes in Sub-saharan Africa: The case of Sudan. Agric. Water Manag. 2020, 232, 106064. [Google Scholar] [CrossRef]
  9. Maeda, E.E.; Pellikka, P.K.E.; Siljander, M.; Clark, B.J.F. Potential impacts of agricultural expansion and climate change on soil erosion in the Eastern Arc Mountains of Kenya. Geomorphology 2010, 123, 279–289. [Google Scholar] [CrossRef]
  10. Moges, D.M.; Kmoch, A.; Bhat, H.; Uuemaa, E. Future soil loss in highland Ethiopia under changing climate and land use. Reg. Environ. Chang. 2020, 20, 2. [Google Scholar] [CrossRef]
  11. Vrieling, A.; Hoedjes, J.C.B.; van der Velde, M. Towards large-scale monitoring of soil erosion in Africa: Accounting for the dynamics of rainfall erosivity. Glob. Planet. Chang. 2014, 115, 33–43. [Google Scholar] [CrossRef]
  12. Ongoma, V.; Chen, H.; Gao, C. Projected change in mean rainfall and temperature over East Africa based on CMIP5 GCMs. Int. J. Climatol. 2018, 38, 1375–1392. [Google Scholar] [CrossRef]
  13. Kogo, B.; Kumar, L.; Koech, R. Climate change and variability in Kenya: A review of impacts on agriculture and food security. Environ. Dev. Sustain. 2021, 23, 5. [Google Scholar] [CrossRef]
  14. Fenta, A.A.; Tsunekawa, A.; Haregeweyn, N.; Poesen, J.; Tsubo, M.; Borrelli, P.; Panagos, P.; Vanmaercke, M.; Broeckx, J.; Yasuda, H.; et al. Land susceptibility to water and wind erosion risks in the East Africa region. Sci. Total Environ. 2020, 703, 135016. [Google Scholar] [CrossRef] [PubMed]
  15. Ng, C.C. Chapter 3: Climate Change and Land: An IPCC Special Report on Climate Change, Desertification, Land Degradation, Sustainable Land Management, Food Security, and Greenhouse Gas Fluxes in Terrestrial Ecosystems; IPCC: Geneva, Switzerland, 2019; pp. 249–343.
  16. Haregeweyn, N.; Tsunekawa, A.; Poesen, J.; Tsubo, M.; Meshesha, D.T.; Fenta, A.A.; Nyssen, J.; Adgo, E. Comprehensive assessment of soil erosion risk for better land use planning in river basins: Case study of the Upper Blue Nile River. Sci. Total Environ. 2017, 574, 95–108. [Google Scholar] [CrossRef] [Green Version]
  17. Labrière, N.; Locatelli, B.; Laumonier, Y.; Freycon, V.; Bernoux, M. Soil erosion in the humid tropics: A systematic quantitative review. Agric. Ecosyst. Environ. 2015, 203, 134. [Google Scholar] [CrossRef]
  18. Olaka, L.A.; Ogutu, J.O.; Said, M.Y.; Oludhe, C. Projected climatic and hydrologic changes to lake victoria basin rivers under three rcp emission scenarios for 2015–2100 and impacts on the water sector. Water 2019, 11, 1449. [Google Scholar] [CrossRef] [Green Version]
  19. Adem, A.; Tilahun, S.; Ayana, E.; Worqlul, A.; Assefa, T.; Dessu, S.; Melesse, A. Climate Change Impact on Sediment Yield in the Upper Gilgel Abay Catchment, Blue Nile Basin, Ethiopia. In Landscape Dynamics, Soils and Hydrological Processes in Varied Climates; Springer: Berlin/Heidelberg, Germany, 2015; pp. 615–644. [Google Scholar] [CrossRef]
  20. Change, I. Climate Change 2014: Synthesis Report; IPCC: Geneva, Switzerland, 2015. [Google Scholar]
  21. Shongwe, M.; Jan, G.; Van Oldenborgh, G.J.; Hurk, B. Projected changes in mean and extreme precipitation in Africa under global warming. Part II: East Africa. J. Clim. 2009, 24, 3718. [Google Scholar] [CrossRef] [Green Version]
  22. Rowell, D.; Booth, B.; Nicholson, S.; Good, P. Reconciling past and future rainfall trends over East Africa. J. Clim. 2015, 28, 151007153031001. [Google Scholar] [CrossRef]
  23. Renard, K.G.; Foster, G.R.; Weesies, G.; McCool, D.; Yoder, D. Predicting Soil Erosion by Water: A Guide to Conservation Planning with the Revised Universal Soil Loss Equation (Rusle); United States Department of Agriculture: Washington, DC, USA, 1997; Volume 703.
  24. Girmay, G.; Moges, A.; Muluneh, A. Assessment of current and future climate change impact on soil loss rate of Agewmariam Watershed, Northern Ethiopia. Air Soil Water Res. 2021, 14, 117862212199584. [Google Scholar] [CrossRef]
  25. Teng, H.; Liang, Z.; Chen, S.; Liu, Y.; Viscarra Rossel, R.A.; Chappell, A.; Yu, W.; Shi, Z. Current and future assessments of soil erosion by water on the Tibetan Plateau based on RUSLE and CMIP5 climate models. Sci. Total Environ. 2018, 635, 673–686. [Google Scholar] [CrossRef]
  26. Vanmaercke, M.; Poesen, J.; Broeckx, J.; Nyssen, J. Sediment yield in Africa. Earth-Sci. Rev. 2014, 136, 350–368. [Google Scholar] [CrossRef] [Green Version]
  27. Ayugi, B.; Tan, G.; Niu, R.; Dong, Z.; Ojara, M.; Mumo, L.; Babaousmail, H.; Ongoma, V. Evaluation of meteorological drought and flood scenarios over Kenya, East Africa. Atmosphere 2020, 11, 307. [Google Scholar] [CrossRef] [Green Version]
  28. Mulinge, W.; Gicheru, P.; Murithi, F.; Maingi, P.; Kihiu, E.; Kirui, O.K.; Mirzabaev, A. Economics of land degradation and improvement in Kenya. In Economics of Land Degradation and Improvement—A Global Assessment for Sustainable Development; Nkonya, E., Mirzabaev, A., von Braun, J., Eds.; Springer International Publishing: Cham, Switzerland, 2016; pp. 471–498. [Google Scholar] [CrossRef] [Green Version]
  29. Ministry of Environment and Forestry. Land Degradation Assessment in Kenya-March 2016. Available online: http://www.environment.go.ke/wp-content/uploads/2018/08/LADA-Land-Degradation-Assessment-in-Kenya-March-2016.pdf (accessed on 3 January 2021).
  30. Gichenje, H.; Godinho, S. Establishing a land degradation neutrality national baseline through trend analysis of GIMMS NDVI Time-series. Land Degrad. Dev. 2018, 29, 12. [Google Scholar] [CrossRef]
  31. Colman, C.B.; Oliveira, P.T.S.; Almagro, A.; Soares-Filho, B.S.; Rodrigues, D.B.B. Effects of climate and land-cover changes on soil erosion in Brazilian Pantanal. Sustainability 2019, 11, 7053. [Google Scholar] [CrossRef] [Green Version]
  32. Nguru, P.M.; Rono, D.K. Combating desertification in Kenya. In Combating Desertification in Asia, Africa and the Middle East; Heshmati, G.A., Squires, V.R., Eds.; Springer Science & Business: New York, NY, USA, 2013; pp. 139–151. [Google Scholar] [CrossRef]
  33. Government of Kenya. Statistical Abstract 2019. Available online: https://www.knbs.or.ke/?wpdmpro=statistical-abstract-2019 (accessed on 3 January 2021).
  34. Siciliano, G.; Bigi, V.; Vigna, I.; Comino, E.; Rosso, M.; Cristofori, E.; Demarchi, A.; Pezzoli, A. Comparison of multiple maximum and minimum temperature datasets at local level: The case study of North Horr Sub-County, Kenya. Climate 2021, 9, 62. [Google Scholar] [CrossRef]
  35. Haile, G.; Tang, Q.; Leng, G.; Jia, G.; Wang, J.; Cai, D.; Sun, S.; Baniya, B.; Zhang, Q. Long-term spatiotemporal variation of drought patterns over the Greater Horn of Africa. Sci. Total Environ. 2019, 704, 135299. [Google Scholar] [CrossRef]
  36. Zhou, S.; Zhou, S.; Tan, X. Nationwide susceptibility mapping of landslides in Kenya using the fuzzy analytic hierarchy process model. Land 2020, 9, 535. [Google Scholar] [CrossRef]
  37. Linda, H.; Andrew, T. The impact of Indian Ocean mean-state biases in climate models on the representation of the East African short rains. J. Clim. 2018, 31, 6611–6631. [Google Scholar] [CrossRef]
  38. Ogutu-Ohwayo, R.; Natugonza, V.; Musinguzi, L.; Olokotum, M.; Naigaga, S. Implications of climate variability and change for African lake ecosystems, fisheries productivity, and livelihoods. J. Great Lakes Res. 2016, 42, 498–510. [Google Scholar] [CrossRef]
  39. Obando, J.A.; Onywere, S.; Shisanya, C.; Ndubi, A.; Masiga, D.; Irura, Z.; Mariita, M.; Maragia, H. (Eds.) Impact of Short-Term Flooding on Livelihoods in the Kenya Rift Valley Lakes; Springer: Chiyoda, Japan, 2016. [Google Scholar] [CrossRef]
  40. Otieno, V.O.; Anyah, R.O. CMIP5 simulated climate conditions of the Greater Horn of Africa (GHA). Part 1: Contemporary climate. Clim. Dyn. 2013, 41, 2081–2097. [Google Scholar] [CrossRef]
  41. Almagro, A.; Oliveira, P.T.S.; Nearing, M.A.; Hagemann, S. Projected climate change impacts in rainfall erosivity over Brazil. Sci. Rep. 2017, 7, 8130. [Google Scholar] [CrossRef] [Green Version]
  42. Foley, J.; Ramankutty, N.; Brauman, K.; Cassidy, E.; Gerber, J.; Johnston, M.; Mueller, N.; O’Connell, C.; Ray, D.; West, P.; et al. Solutions for a Cultivated Planet. Nature 2011, 478, 337–342. [Google Scholar] [CrossRef] [PubMed] [Green Version]
  43. Kogo, B.K.; Kumar, L.; Koech, R.; Kariyawasam, C.S. Modelling climate suitability for rainfed maize cultivation in Kenya using a Maximum Entropy (MaxENT) approach. Agronomy 2019, 9, 727. [Google Scholar] [CrossRef] [Green Version]
  44. Schürz, C.; Mehdi, B.; Kiesel, J.; Schulz, K.; Herrnegger, M. A systematic assessment of uncertainties in large scale soil loss estimation from different representations of USLE input factors—A case study for Kenya and Uganda. Hydrol. Earth Syst. Sci. Discuss. 2019, 2019, 17. [Google Scholar] [CrossRef]
  45. Mati, B.M.; Morgan, R.P.C.; Gichuki, F.N.; Quinton, J.N.; Brewer, T.R.; Liniger, H.P. Assessment of erosion hazard with the USLE and GIS: A case study of the Upper Ewaso Ng’iro North basin of Kenya. Int. J. Appl. Earth Obs. Geoinf. 2000, 2, 78–86. [Google Scholar] [CrossRef]
  46. Kogo, B.K.; Kumar, L.; Koech, R. Impact of land use/cover changes on soil erosion in Western Kenya. Sustainability 2020, 12, 9740. [Google Scholar] [CrossRef]
  47. Watene, G.; Yu, L.; Nie, Y.; Zhu, J.; Ngigi, T.; Nambajimana, J.D.D.; Kenduiywo, B. Water erosion risk assessment in the Kenya Great Rift Valley Region. Sustainability 2021, 13, 844. [Google Scholar] [CrossRef]
  48. Angima, S.; Stott, D.; O’Neill, M.; Ong, C.K.; Weesies, G.A. Soil Erosion prediction using RUSLE for Central Kenya highland conditions. Agric. Ecosyst. Environ. 2003, 97, 295–308. [Google Scholar] [CrossRef]
  49. Hategekimana, Y.; Allam, M.; Meng, Q.; Nie, Y.; Mohamed, E. Quantification of soil losses along the coastal protected areas in Kenya. Land 2020, 9, 137. [Google Scholar] [CrossRef]
  50. Azari, M.; Oliaye, A.; Nearing, M. Expected climate change impacts on rainfall erosivity over Iran based on CMIP5 climate models. J. Hydrol. 2020, 593, 3. [Google Scholar] [CrossRef]
  51. Stefanidis, S.; Alexandridis, V.; Chatzichristaki, C.; Stefanidis, P. Assessing soil loss by water erosion in a typical mediterranean ecosystem of Northern Greece under current and future rainfall erosivity. Water 2021, 13, 2002. [Google Scholar] [CrossRef]
  52. Duulatov, E.; Chen, X.; Amanambu, A.C.; Ochege, F.U.; Orozbaev, R.; Issanova, G.; Omurakunova, G. Projected rainfall erosivity over central asia based on CMIP5 climate models. Water 2019, 11, 897. [Google Scholar] [CrossRef] [Green Version]
  53. Amanambu, A.; Li, L.; Egbinola, C.; Obarein, O.; Mupenzi, C.; Chen, D. Spatio-temporal variation in rainfall-runoff erosivity due to climate change in the Lower Niger Basin, West Africa. Catena 2019, 172, 334. [Google Scholar] [CrossRef]
  54. Doulabian, S.; Shadmehri Toosi, A.; Humberto Calbimonte, G.; Ghasemi Tousi, E.; Alaghmand, S. Projected climate change impacts on soil erosion over Iran. J. Hydrol. 2021, 598, 126432. [Google Scholar] [CrossRef]
  55. Chapman, S.; Birch, C.E.; Galdos, M.V.; Pope, E.; Davie, J.; Bradshaw, C.; Eze, S.; Marsham, J. Assessing the impact of climate change on soil erosion in East Africa using a convection-permitting climate model. Environ. Res. Lett. 2021, 16, 084006. [Google Scholar] [CrossRef]
  56. Gichaba, C.M. Relief, physiography and drainage. In Kenya: A Natural Outlook, Geo-Environmental Resources and Hazards; Shroder, J.F., Ed.; Elsevier: Oxford, UK, 2013; Volume I. [Google Scholar]
  57. ESA. CCI Sentinel-2 Land Cover 20 m Map of Africa. Available online: http://2016africalandcover20m.esrin.esa.int/ (accessed on 9 March 2020).
  58. Ochuka, M.; Ikporukpo, C.; Mijinyawa, Y.; Ogendi, G. Land use/land cover dynamics and anthropogenic driving factors in lake baringo catchment, Rift Valley, Kenya. Nat. Resour. 2019, 10, 367–389. [Google Scholar] [CrossRef] [Green Version]
  59. GoK. Kenya Wildlife Service. Report of the Prime Minister’s Task Force on the Conservation of the Mau Forest’s Complex. 2009. Available online: http://www.kws.go.ke/file/1448/download?token=rgbKt360 (accessed on 3 January 2021).
  60. van der Plas, G.; De Cort, G.; Petek, N.; Tabitha, W.; Colombaroli, D.; Lane, P.; Verschuren, D. Distinct phases of natural landscape dynamics and intensifying human activity in the central Kenya Rift Valley during the past 1300 years. Quat. Sci. Rev. 2019, 218, 91–106. [Google Scholar] [CrossRef]
  61. Ongoma, V.; Chen, H.; Gao, C. Evaluation of CMIP5 twentieth century rainfall simulation over the equatorial East Africa. Theor. Appl. Climatol. 2019, 135, 893–910. [Google Scholar] [CrossRef]
  62. Navarro-Racines, C.; Tarapues, J.; Thornton, P.; Jarvis, A.; Ramirez-Villegas, J. High-resolution and bias-corrected CMIP5 projections for climate change impact assessments. Sci. Data 2020, 7, 7. [Google Scholar] [CrossRef] [PubMed] [Green Version]
  63. Ramírez Villegas, J.; Jarvis, A. Downscaling Global Circulation Model Outputs: The Delta Method Decision and Policy Analysis Working Paper No. 1.; International Center for Tropical Agriculture (CIAT): Cali, Colombia, 2010. [Google Scholar]
  64. Wischmeier, W.H.; Smith, D.D. Predicting Rainfall Erosion Losses—A Guide to Conservation Planning; US Department of Agriculture Science and Education Administration: Washington, DC, USA, 1978.
  65. United States Geological Survey. U.S. Geological Survey Earth Explorer. Available online: http://earthexplorer.usgs.gov/ (accessed on 3 January 2021).
  66. Hengl, T.; Heuvelink, G.B.M.; Kempen, B.; Leenaars, J.G.B.; Walsh, M.G.; Shepherd, K.D.; Sila, A.; MacMillan, R.A.; Mendes de Jesus, J.; Tamene, L.; et al. Mapping soil properties of africa at 250 m resolution: Random forests significantly improve current predictions. PLoS ONE 2015, 10, e0125814. [Google Scholar] [CrossRef] [PubMed]
  67. Moore, T. Rainfall Erosivity in East Africa. Geogr. Annaler. Ser. A Phys. Geogr. 1979, 61, 147. [Google Scholar] [CrossRef]
  68. Moses, A. Spatial variation of rainfall runoff erosivity (R) factor for river Nzoia basin, western Kenya. Int. J. Civ. Eng. Technol. 2017, 8, 418–422. [Google Scholar]
  69. Rutebuka, J.; De Taeye, S.; Kagabo, D.; Verdoodt, A. Calibration and validation of rainfall erosivity estimators for application in Rwanda. Catena 2020, 190, 104538. [Google Scholar] [CrossRef]
  70. Nash, J.E.; Sutcliffe, J. River flow forecasting through conceptual models: Part 1—A discussion of principles. J. Hydrol. 1970, 10, 282. [Google Scholar] [CrossRef]
  71. Williams, J.R. The EPIC Model; Computer Models of Watershed Hydrology Water Resources Publications: Highlands Ranch, CO, USA, 1995. [Google Scholar]
  72. Kim, H.S. Soil Erosion Modeling Using Rusle and Gis on the Imha Watershed, South Korea; Colorado State University: Fort Collins, CO, USA, 2006. [Google Scholar]
  73. McCool, D.K.; Brown, L.C.; Foster, G.R.; Mutchler, C.K.; Meyer, L.D. Revised slope steepness factor for the universal soil loss equation. Trans. ASAE 1987, 30, 1394. [Google Scholar] [CrossRef]
  74. Almagro, A.; Thomé, T.; Barbosa Colman, C.; Pereira, R.; Junior, J.; Rodrigues, D.; Oliveira, P.T. Improving cover and management factor (C-factor) estimation using remote sensing approaches for tropical regions. Int. Soil Water Conserv. Res. 2019, 7, 13. [Google Scholar] [CrossRef]
  75. Phinzi, K.; Ngetar, N.S. The assessment of water-borne erosion at catchment level using GIS-based RUSLE and remote sensing: A review. Int. Soil Water Conserv. Res. 2019, 7, 27–46. [Google Scholar] [CrossRef]
  76. Durigon, V.L.; Carvalho, D.F.; Antunes, M.A.H.; Oliveira, P.T.S.; Fernandes, M.M. NDVI time series for monitoring RUSLE cover management factor in a tropical watershed. Int. J. Remote. Sens. 2014, 35, 441–453. [Google Scholar] [CrossRef]
  77. Chen, C.-N.; Tfwala, S.; Tsai, C.-H. Climate change impacts on soil erosion and sediment yield in a watershed. Water 2020, 12, 2247. [Google Scholar] [CrossRef]
  78. Hurni, H. Erosion-productivity-conservation systems in Ethiopia. In Proceedings of the IV International Conference on Soil Conservation on Soil Conservation, Maracey, Venezuela, 3–9 November 1985; Volume 11. [Google Scholar]
  79. Bewket, W.; Teferi, E. Assessment of soil erosion hazard and prioritization for treatment at the watershed level: Case study in the chemoga watershed, Blue Nile basin, Ethiopia. Land Degrad. Dev. 2009, 20, 609–622. [Google Scholar] [CrossRef]
  80. Xiong, M.-Q.; Sun, R.; Chen, L.-D. Global analysis of support practices in USLE-based soil erosion modeling. Prog. Phys. Geogr. Earth Environ. 2019, 43, 030913331983201. [Google Scholar] [CrossRef]
  81. Koirala, P.; Thakuri, S.; Joshi, S.; Chauhan, R. Estimation of soil erosion in nepal using a RUSLE modeling and geospatial tool. Geosciences 2019, 9, 147. [Google Scholar] [CrossRef] [Green Version]
  82. Azimi Sardari, M.R.; Bazrafshan, O.; Panagopoulos, T.; Sardooi, E.R. Modeling the impact of climate change and land use change scenarios on soil erosion at the minab dam watershed. Sustainability 2019, 11, 3353. [Google Scholar] [CrossRef] [Green Version]
  83. Claessens, L.; Van Breugel, P.; Notenbaert, A.; Herrero, M.; Van De Steeg, J. Mapping potential soil erosion in east africa using the universal soil loss equation and secondary data. IAHS Publ. 2008, 325, 398–407. [Google Scholar]
  84. Stocking, M. Rates of erosion and sediment yield in the African environment. In Proceedings of the Challenges in African Hydrology and Water Resources, Harare, Zimbabwe, 1 July 1984; pp. 285–295. [Google Scholar]
  85. Panagos, P.; Borrelli, P.; Meusburger, K.; Yu, B.; Klik, A.; Lim, K.; Yang, J.; Ni, J.; Chattopadhyay, N.; Sadeghi, S.H.; et al. Global rainfall erosivity assessment based on high-temporal resolution rainfall records. Sci. Rep. 2017, 7, 10. [Google Scholar] [CrossRef] [PubMed] [Green Version]
  86. Okoba, B.O.; Sterk, G. Catchment-level evaluation of farmers’ estimates of soil erosion and crop yield in the Central Highlands of Kenya. Land Degrad. Dev. 2010, 21, 388–400. [Google Scholar] [CrossRef]
  87. Nambajimana, J.D.D.; He, X.; Zhou, J.; Justine, M.F.; Li, J.; Khurram, D.; Mind’je, R.; Nsabimana, G. Land use change impacts on water erosion in Rwanda. Sustainability 2019, 12, 50. [Google Scholar] [CrossRef] [Green Version]
  88. Karamage, F.; Liu, Y.; Liu, Y. Data construction and spatiotemporal trend attribution of runoff over the African continent (1981–2016). J. Hydrometeorol. 2021, 22. [Google Scholar] [CrossRef]
  89. Nicholson, S. Climate and climatic variability of rainfall over Eastern Africa: Climate over Eastern Africa. Rev. Geophys. 2017, 55. [Google Scholar] [CrossRef] [Green Version]
  90. Sutherland, R.A.; Bryan, K.B. Runoff and erosion from a small semiarid catchment, Baringo district, Kenya. Appl. Geogr. 1990, 102, 91–109. [Google Scholar] [CrossRef]
  91. Kiepe, P. Cover and barrier effect of Cassia siamea hedgerows on soil conservation in semi-arid Kenya. Soil Technol. 1999, 9, 161–171. [Google Scholar] [CrossRef]
  92. Tiffen, M.; Mortimore, M.; Gichuki, F. More People Less Erosion; Environmental Recovery in Kenya; ACTS Press: Nairobi, Kenya, 1994. [Google Scholar]
  93. Angima, S.D.; O’Neill, M.K.; Omwega, A.K.; Stott, D.E. Use of tree/grass hedges for soil erosion control in the Central Kenyan Highlands. J. Soil Water Conserv. 2000, 55, 478–482. [Google Scholar]
  94. Kinama, J.M.; Stigter, C.J.; Ong, C.K.; Ng’ang’a, J.K.; Gichuki, F.N. Contour hedgerows and grass strips in erosion and runoff control on Sloping Land in Semi-Arid Kenya. Arid. Land Res. Manag. 2007, 21, 7. [Google Scholar] [CrossRef]
  95. Wakindiki, I.I.C.; Ben-Hur, M. Indigenous soil and water conservation techniques: Effects on runoff, erosion, and crop yields under semi-arid conditions. Soil Res. 2002, 40, 367–379. [Google Scholar] [CrossRef]
  96. Zöbisch, M.A.; Richter, C.; Heiligtag, B.; Schlott, R. Nutrient losses from cropland in the Central Highlands of Kenya due to surface runoff and soil erosion. Soil Tillage Res. 1995, 33, 109–116. [Google Scholar] [CrossRef]
  97. Nicholson, S. The ITCZ and the seasonal cycle over Equatorial Africa. Bull. Am. Meteorol. Soc. 2018, 99, 337–348. [Google Scholar] [CrossRef]
  98. Cattani, E.; Merino, A.; Guijarro, J.A.; Levizzani, V. East Africa rainfall trends and variability 1983–2015 using three long-term satellite products. Remote. Sens. 2018, 10, 931. [Google Scholar] [CrossRef] [Green Version]
  99. Fenta, A.A.; Yasuda, H.; Shimizu, K.; Haregeweyn, N.; Kawai, T.; Sultan, D.; Ebabu, K.; Belay, A.S. Spatial distribution and temporal trends of rainfall and erosivity in the Eastern Africa region. Hydrol. Process. 2017, 31, 4555–4567. [Google Scholar] [CrossRef]
  100. Panagos, P.; Ballabio, C.; Himics, M.; Scarpa, S.; Matthews, F.; Bogonos, M.; Poesen, J.; Borrelli, P. Projections of soil loss by water erosion in Europe by 2050. Environ. Sci. Policy 2021, 124, 380–392. [Google Scholar] [CrossRef]
  101. Gafforov, K.S.; Bao, A.; Rakhimov, S.; Liu, T.; Abdullaev, F.; Jiang, L.; Durdiev, K.; Duulatov, E.; Rakhimova, M.; Mukanov, Y. The assessment of climate change on rainfall-runoff erosivity in the Chirchik–Akhangaran Basin, Uzbekistan. Sustainability 2020, 12, 3369. [Google Scholar] [CrossRef] [Green Version]
  102. Taye, G.; Poesen, J.; Vanmaercke, M.; Wesemael, B.V.; Martens, L.; Teka, D.; Nyssen, J.; Deckers, J.; Vanacker, V.; Haregeweyn, N.; et al. Evolution of the effectiveness of stone bunds and trenches in reducing runoff and soil loss in the semi-arid Ethiopian highlands. Z. Geomorphol. 2015, 59, 477–493. [Google Scholar] [CrossRef]
Figure 1. Map of the study area: (a) position of Kenya within Africa (b) the regions of Kenya.
Applsci 11 09903 g001
Figure 2. Characteristics maps of the study area: (a) Climate types; (b) Soil types; (c) Agroclimatic Zones; (d) Mean annual rainfall in Kenya.
Applsci 11 09903 g002
Figure 3. Characteristics maps of the study area: (a) Elevation; (b) Landform types; (c) Land use and land cover, 2016; (d) Major river basins in Kenya.
Applsci 11 09903 g003
Figure 4. Submerging of the Lake Nakuru national park’s main entrance (Kenya’s Great Rift Valley lakes): (a) A before-submerging (2013) ground photograph of the gate; (b) An after-submerging (2018) photograph of the gate (Kenya Wildlife Service).
Applsci 11 09903 g004
Figure 5. Observed precipitation data (KMD) in Kenya from 1970–2000.
Applsci 11 09903 g005
Figure 6. Integration of the climate change scenarios with the R factor used in this study.
Applsci 11 09903 g006
Figure 7. Model validation: (a) Taylor diagram for precipitation data; (b) Scatter plot between observed and baseline rainfall erosivity.
Applsci 11 09903 g007
Figure 8. RUSLE parameters applied for soil erosion estimation in Kenya: (a) Rainfall-runoff erosivity; (b) Soil erodibility; (c) Terrain factor; (d) Vegetation cover factor.
Applsci 11 09903 g008
Figure 9. (a) Spatial distribution of the mean baseline annual soil erosion rate; (b) Baseline erosivity density distribution.
Applsci 11 09903 g009
Figure 10. Rainfall erosivity projections in Kenya for the periods of the 2030s and 2080s under the RCP 2.6 and 8.5 scenarios, driven by CCCMA_CANESM2, CESM1-CAM5, CSIRO_MK3.6.0 and MIROC-5 GCMs.
Applsci 11 09903 g010
Figure 11. Absolute differences of rainfall erosivity (MJ mm ha−1 h−1 yr−1) between the 2030 and 2070 projections and baseline data.
Applsci 11 09903 g011
Figure 12. Erosivity density for the periods of the 2030s and 2080s under RCP 2.6 and 8.5 scenarios, driven by CCCMA_CANESM2, CESM1-CAM5, CSIRO_MK3.6.0 and MIROC-5 GCMs.
Applsci 11 09903 g012
Figure 13. Soil erosion rates projections in Kenya for the periods of the 2030s and 2080s under RCP 2.6 and 8.5 scenarios, driven by CCCMA_CANESM2, CESM1-CAM5, CSIRO_MK3.6.0 and MIROC-5 GCMs.
Applsci 11 09903 g013
Figure 14. (Top) Predicted average rainfall erosivity in Kenya under all scenarios for the 2030s and 2080s time periods; (Bottom) predicted average soil erosion rates in Kenya under all scenarios for the 2030s and 2080s time periods.
Applsci 11 09903 g014
Table 1. Details of the four GCMs applied in this study.
ModelInstituteCountryResolution
CCCMA_CANESM2Canadian Centre for Climate Modeling and AnalysisCanada2.8° × 2.8°
CESM1-CAM5Community Earth System Model ContributorsUSA1.25° × 0.9°
CSIRO_MK3.6.0Commonwealth Scientific and Industrial Research OrganizationAustralia1.875° × 1.875°
MIROC-5Model for Interdisciplinary Research On ClimateJapan1.4° × 1.4°
Table 2. Data sources for the different datasets applied in this study.
ParameterVariablesResolutionSources
ElevationDEM30 mShuttle Radar Topography Mission (SRTM) [65]
Slope30 mShuttle Radar Topography Mission (SRTM)
Flow Accumulation30 mShuttle Radar Topography Mission (SRTM)
Aspect30 mShuttle Radar Topography Mission (SRTM)
ClimateBaseline Precipitation1 kmWorldClim
Observed Precipitation Kenya Meteorological Department (KMD)
Predicted Precipitation CCAFS
LandLand use land cover20 mCCI-LULC [57]
SoilSand250 mAfSIS (http://www.isric.org/data/afsoilgrids250m) [66]
Silt250 mAfSIS (http://www.isric.org/data/afsoilgrids250m)
Clay250 mAfSIS (http://www.isric.org/data/afsoilgrids250m)
Organic carbon250 mAfSIS (http://www.isric.org/data/afsoilgrids250m)
Table 3. C factor values for different land uses in Kenya compiled from published literature.
LULCC Factor CoefficientSource
Forest0.01[16,78]
Shrubland0.08[44,79]
Grassland0.05[78]
Cropland0.15[16,78]
Bareland0.50[44]
Aquatic vegetation0.03[44]
Sparse vegetation0.03[44]
Urban areas0.01[16]
Table 4. Baseline soil erosion rates per severity classes in Kenya.
Erosion Class
(t ha−1 yr−1)
Severity ClassArea
(104 ha)
Mean Annual Rainfall Erosivity (MARE) (Baseline)
(MJ mm ha−1 h−1 yr−1)
Mean Annual Soil Loss Rate (MASLR) (Baseline)
(t ha−1 yr−1)
0–5Slight4689.21263.70.98
5–10Moderate431.43427.27.06
10–20High301.94690.914.08
20–40Very High194.66120.127.97
40–80Severe130.17171.955.83
>80Very Severe79.38850.0127.44
Table 5. Baseline soil erosion rates per LULC in Kenya.
LULCArea
(104 ha)
MARE (Baseline)
(MJ mm ha−1 h−1 yr−1)
MASLR (Baseline)
(t ha−1 yr−1)
Forest453.03155.52.41
Shrubland1757.71246.01.84
Grassland2169.71115.31.39
Cropland1045.44069.717.86
Aquatic vegetation5.01660.51.62
Sparse vegetation105.1512.52.62
Bareland156.6450.03.39
Urban areas13.34256.22.24
Table 6. Baseline soil erosion rates in different Agro-Climatic Zones in Kenya.
ACZArea
(104 ha)
MARE (Baseline)
(MJ mm ha−1 h−1 yr−1)
MASLR (Baseline)
(t ha−1 yr−1)
Humid266.59100.736.18
Sub-Humid281.45265.119.25
Semi-Humid271.53829.613.34
Semi-Humid to semi-arid347.82818.77.25
Semi-arid868.41856.93.60
Arid1257.51327.41.50
Very arid2533.3643.50.60
Table 7. The estimated baseline soil erosion rates per the Climatic Zones of Kenya.
Climate ZonesArea
(104 ha)
MARE (Baseline)
(MJ mm ha−1 h−1 yr−1)
MASLR (Baseline)
(t ha−1 yr−1)
Tropical rainforest (Af)218.87620.327.84
Tropical monsoon (Am)121.27085.823.90
Tropical savannah (Aw)2062.42129.75.49
Arid steppe (hot) (Bsh)1919.4880.71.37
Arid desert (hot) (Bwh)1098.9621.80.38
Temperate without dry season (hot summer) (Cfa)4.141329.02.33
Temperate without dry season (warm summer) (Cfb)105.44859.020.10
Temperate with dry summer (warm summer) (Csb)162.52951.510.19
Temperate with dry winter (hot summer) (Cwa)8.81170.82.69
Temperate with dry winter (warm summer) (Cwb)124.61475.83.62
Table 8. Baseline soil erosion rates in Kenya regions.
Kenya RegionsArea
(104 ha)
MARE (Baseline)
(MJ mm ha−1 h−1 yr−1)
MASLR (Baseline)
(t ha−1 yr−1)
Lake Victoria248.57430.025.25
Rift Valley1762.62077.66.86
Central & Eastern1717.51562.34.97
North Eastern1262.7644.80.34
Coastal 838.21983.01.75
Table 9. Baseline soil erosion rates by river basins in Kenya.
Kenya BasinsArea
(104 ha)
MARE (Baseline)
(MJ mm ha−1 h−1 yr−1)
MASLR (Baseline)
(t ha−1 yr−1)
Lake Victoria510.06480.821.90
Great Rift Valley1285.21335.04.80
Ewaso Nyiro2092.9769.81.12
Tana River1265.71955.64.22
Athi River672.72303.24.87
Table 10. Baseline soil erosion rates in different slope zones of Kenya.
Slope (%)Area
(104 ha)
MARE (Baseline)
(MJ mm ha−1 h−1 yr−1)
MASLR (Baseline)
(t ha−1 yr−1)
0–74444.51438.71.88
7–11.3593.72673.87.57
11.3–17.6310.83438.914.36
17.6–26.8205.23670.419.91
>26.8272.33146.521.45
Table 11. Baseline soil erosion rates by elevation in Kenya.
Elevation (m.a.s.l)Area
(104 ha)
MARE (Baseline)
(MJ mm ha−1 h−1 yr−1)
MASLR (Baseline)
(t ha−1 yr−1)
<5002427.41060.50.74
500–10001703.9887.21.49
1000–1500776.63111.08.63
1500–2000580.74268.116.46
>2000337.94987.719.21
Table 12. Baseline soil erosion rates under different soil types in Kenya.
Soil TypeArea
(104 ha)
MARE (Baseline)
(MJ mm ha−1 h−1 yr−1)
MASLR (Baseline)
(t ha−1 yr−1)
Acrisols5.84150.67.84
Andosols108.95363.717.67
Arenosols258.71994.61.63
Cambisols225.72718.99.62
Ferrasols312.74838.612.38
Fluvisols21.5576.01.08
Gleysols68.21487.31.80
Lithosols756.91616.55.44
Luvisols1110.21649.41.73
Nitosols379.45223.622.69
Planosols22.24226.213.14
Regosols620.7957.02.85
Solonchaks371.2604.10.77
Vertisols178.32296.74.43
Xerosols252.6969.91.59
Yermosols1082.8594.60.50
Table 13. Baseline soil erosion rates per landform types in Kenya.
Landform TypeArea
(104 ha)
MARE (Baseline)
(MJ mm ha−1 h−1 yr−1)
MASLR (Baseline)
(t ha−1 yr−1)
Alluvial plain526.9802.30.59
Badland38.9576.80.35
Coastal plain84.13013.81.59
Complex 117.7398.71.63
Depression132.11627.33.42
Escarpments24.24428.526.51
Foot slope211.61611.94.08
Mount. Foot ridges441.73133.317.71
Mountains259.45202.619.01
Plain3010.21315.41.62
Plateaus795.02904.67.61
Valley35.0780.71.94
Volcanic craters98.91911.89.63
Table 14. Percent change in average rainfall erosivity, soil erosion rates and erosion density under climate change across Kenya.
ScenariosGCMsPrecipitation
(mm)
Change (%)Rainfall Erosivity
(MJ mm ha−1 h−1 y−1)
Change (%)Average Erosion
(t ha−1 yr−1)
Change (%)Erosion Density
(MJ ha−1 h−1)
Change (%)
Baseline601.10.001665.90.004.760.002.770.00
RCP-2.6 (2030s)CCCMA_CANESM2-2.6869.744.73486.1109.39.4899.164.0144.77
CESM1-CAM5-2.6665.910.82136.328.25.5115.763.2115.88
CSIRO_MK3.6.0-2.6581.0−3.31733.94.14.63−1.682.987.58
MIROC-5-2.6560.3-6.81600.4−3.94.08−14.292.863.25
RCP-2.6 (2030s) Average669.211.32239.234.45..9324.583.2718.05
RCP-8.5 (2030s)CCCMA_CANESM2-8.5851.141.63344.8100.89.1291.603.9341.88
CESM1-CAM5-8.5735.122.32437.246.36.0126.263.3219.86
CSIRO_MK3.6.0-8.5657.09.32128.127.75.7019.753.2416.97
MIROC-5-8.5588.2-2.11774.86.54.55-4.413.029.03
RCP-8.5 (2030s) Average707.917.82421.244.86.3433.193.3822.02
(2030s) Overall Average688.614.62330.039.96.1429.03.3320.22
RCP-2.6 (2080s)CCCMA_CANESM2-2.6882.046.73632.1118.010.02110.504.1248.74
CESM1-CAM5-2.6730.621.52470.648.36.2631.513.3119.49
CSIRO_MK3.6.0-2.6643.47.02020.121.35.3512.393.1413.36
MIROC-5-2.6546.6−9.11529.6−8.23.95−17.022.801.08
RCP-2.6 (2080s) Average700.716.62413.144.96.4034.453.3420.58
RCP-8.5 (2080s)CCCMA_CANESM2-8.51113.285.23912.6134.915.10217.233.5126.71
CESM1-CAM5-8.5845.140.63118.887.27.7863.453.6933.21
CSIRO_MK3.6.0-8.5768.327.82778.466.87.4356.093.6230.69
MIROC-5-8.5636.96.02001.420.14.984.623.1413.36
RCP-8.5 (2080s) Average840.939.92952.877.28.8285.33.4926.0
(2080s) Overall Average770.828.22683.061.17.6159.873.4223.47
RCP-2.6 (2030s)CCCMA_CANESM2-2.6869.744.73486.1109.39.4899.164.0144.77
CESM1-CAM5-2.6665.910.82136.328.25.5115.763.2115.88
CSIRO_MK3.6.0-2.6581.0−3.31733.94.14.63−1.682.987.58
Table 15. Projected change to mean baseline rainfall erosivity (%) across the regions of Kenya.
LVRCERCRNERRVR
Baseline Rainfall Erosivity (MJ mm ha−1 h−1 yr−1)7430.01562.31983.0644.82077.6
RCP-2.6 (2030s)CCCMA_CANESM211,620.63489.02504.0851.04698.8
Change (%)56.4123.326.332.0126.2
CESM1-CAM57979.02059.82321.5780.52272.0
Change (%)7.431.817.121.09.4
CSIRO_MK3.6.07218.81702.71661.6539.61884.5
Change (%)−2.89.0−16.2−16.3−9.3
MIROC-56836.41478.31777.3610.71607.3
Change (%)−8.0−5.4−10.4−5.3−22.6
RCP-2.6 (2080s)CCCMA_CANESM212,691.53544.92263.0831.95106.3
Change (%)70.8126.914.129.0145.8
CESM1-CAM58888.92333.92698.3982.42658.2
Change (%)19.649.436.152.427.9
CSIRO_MK3.6.07542.92032.61921.7680.42239.5
Change (%)1.530.1−3.15.57.8
MIROC-56216.31492.01613.4568.91555.2
Change (%)−16.3−4.5−18.6−11.8−25.1
RCP-8.5 (2030s)CCCMA_CANESM211,197.63323.92270.9812.44590.6
Change (%)50.7112.814.526.0121.0
CESM1-CAM57730.32447.82846.21081.52458.5
Change (%)4.056.743.567.718.3
CSIRO_MK3.6.08436.72096.41905.2645.02442.8
Change (%)13.634.2−3.90.0317.6
MIROC-58172.11620.71983.0624.11750.4
Change (%)10.03.70.00−3.2−15.7
RCP-8.5 (2080s)CCCMA_CANESM214,714.55759.43040.21168.88376.5
Change (%)98.0268.653.381.3303.2
CESM1-CAM510,581.62932.83292.21272.53491.1
Change (%)42.487.766.097.368.0
CSIRO_MK3.6.010,629.42750.82171.6879.63353.8
Change (%)43.176.19.536.461.4
MIROC-59324.01735.62237.6806.51974.1
Change (%)25.511.112.825.1−5.0
Table 16. Projected change to the mean baseline soil loss rate (%) across the regions of Kenya.
LVRCERCRNERRVR
Baseline Soil Loss rate (t ha−1 yr−1)15.824.822.110.707.05
RCP-2.6 (2030s)CCCMA_CANESM219.607.582.470.8510.97
Change (%)23.8957.2617.0621.4355.60
CESM1-CAM516.495.632.320.797.43
Change (%)4.2416.809.9512.865.39
CSIRO_MK3.6.015.665.071.930.636.71
Change (%)−1.015.19−8.53−10.0−4.82
MIROC-515.334.671.960.686.10
Change (%)−3.10−3.11−7.11−2.86−13.48
RCP-2.6 (2080s)CCCMA_CANESM220.397.652.350.8511.47
Change (%)28.8958.7111.3721.4362.70
CESM1-CAM517.326.012.510.928.12
Change (%)9.4824.6918.9631.4315.18
CSIRO_MK3.6.016.035.602.100.747.41
Change (%)1.3316.18−0.475.715.11
MIROC-514.634.731.870.665.98
Change (%)−7.52−1.87−11.37−5.71−15.18
RCP-8.5 (2030s)CCCMA_CANESM219.287.402.350.8310.91
Change (%)21.8753.5311.3718.5754.75
CESM1-CAM516.256.142.600.977.82
Change (%)2.7227.3923.2238.5710.92
CSIRO_MK3.6.016.875.712.100.717.74
Change (%)6.6415.59−0.471.439.79
MIROC-516.634.902.100.696.33
Change (%)5.121.66−0.47−1.43−10.21
RCP-8.5 (2080s)CCCMA_CANESM221.969.812.741.0414.66
Change (%)38.81103.5329.8648.57107.94
CESM1-CAM518.806.782.821.089.45
Change (%)18.8440.6633.6554.2934.04
CSIRO_MK3.6.018.776.602.280.879.16
Change (%)18.6536.938.0624.2929.93
MIROC-517.645.062.250.816.74
Change (%)11.204.986.63415.71−4.40
Table 17. Past literature R factor values (MJ mm ha−1 h−1 y−1) based on multiple years EI30 calculations in Kenya.
LocationClimateR FactorReferencesThis Study
Kianjuki catchmentAw8527[48]8784.5
KatumaniAw1644[67]1621.1
EldoretAw3795[67]4467.0
Taita Taveta VoiBsh2774[67]2058.2
NarokCsb2621[67]3067.2
Table 18. Mean soil erosion rates (t ha−1 yr−1) from previous plot studies within Kenya.
LocationClimateObserved MASLRReferences
Lake Baringo sub-basinAw16–96[90]
Upper Ewaso Ng’iro sub-basinAw0–51.3[45]
Machakos, KenyaAw16–36[91]
Athi basin areaBsh15[92]
EmbuAm11[93]
MachakosAm2–60[94]
EmbuAm16–118[86]
Tharaka NithiAm1–2[95]
KabeteCfb2–6[96]
Table 19. Predicted mean soil erosion rates (t ha−1 yr−1) and percentage change from the respective baseline soil erosion rates for different countries around the world.
CountriesPredicted MASLR (Aggregate) &
(% Change)
No. of GCMs Used With Predicted C & P factors (LULC)References
2030s2050s2080s
Greece-3.42 (+0.6%)3.7 (+9%)1No[51]
Ethiopia26.13 (+4.5%)26.78 (+7.1%)27.44 (+9.8%)20No[24]
Ethiopia-78 (+23%)-1Yes[10]
Nigeria1428.3 (+12.2%)1517.9 (19.3%)1534.8 (20.6%)4No[53]
Europe-3.61 (+17.8%)-19Yes[100]
Iran12.9 (+21.7%)--1Yes[82]
China-3.54 (+28.3%)-6Yes[25]
Uzbekistan574.6 (+17.1%)608.2 (+20.5%)636.6 (+23.3%)5No[101]
Publisher’s Note: MDPI stays neutral with regard to jurisdictional claims in published maps and institutional affiliations.

