Article

Analysis of Pungency Sensation Effects from an Oral Processing, Sensorial and Emotions Detection Perspective—Case Study with Grilled Pork Meat

1
Faculty of Agriculture, University of Belgrade, Nemanjina 6, 11080 Belgrade, Serbia
2
School of Food Science & Biotechnology, Zhejiang Gongshang University, Hangzhou 310018, China
3
Faculty of Mechanical Engineering, University of Belgrade, Kraljice Marije 16, 11000 Belgrade, Serbia
4
Department of Dairy Technology and Functional Foods, Faculty of Food Sciences and Biotechnology, University of Life Sciences in Lublin, Skromna 8, 20-704 Lublin, Poland
5
Faculty of Technology, University of East Sarajevo, Karakaj 34a, 75400 Zvornik, Bosnia and Herzegovina
*
Author to whom correspondence should be addressed.
Appl. Sci. 2021, 11(21), 10459; https://doi.org/10.3390/app112110459
Submission received: 8 October 2021 / Revised: 25 October 2021 / Accepted: 5 November 2021 / Published: 7 November 2021
(This article belongs to the Special Issue New Challenges in Improving the Quality and Safety of Meat Products)

Abstract

:

Featured Application

The present study analyzes pungency stimuli during mastication and after swallowing through three perspectives: oral processing, sensory perception and emotion detection. Results may be used by food scientists in understanding different effects that occur while consuming pungent food.

Abstract

Pungency is an interesting sensory stimulus analyzed from different perspectives, in particular the underpinning mechanisms of its sensation and perception. In this study, grilled pork meat coated with three types of hot sauces were investigated regarding its main food oral processing characteristics and evaluated using time-intensity and temporal dominance of pungency sensations methods analyzing the pungency descriptors and intensities. Besides these methods, facial expressions obtained from video capturing were subject to emotion detection. Mastication parameters showed a slight, but not statistically significant, trend of an increased number of chews and consumption time associated with pungency intensity, while saliva incorporation indicated an increasing trend depending on the pungency intensity, especially after 25 strokes and before swallowing. Both time intensity and temporal dominance of pungency sensations showed that the complexity of understanding these sensations is in relation to intensity and type. Finally, the use of emotion detection software in analyzing the faces of panelists during mastication confirmed the increase in non-neutral emotions associated with the increase in pungency intensity.

1. Introduction

Pungency is a specific sensation experienced in the nose and/or mouth coming from capsaicin or similar chemical irritants [1]. It is fascinating that this painful sensation is considered positive for many humans, and this type of food is consumed quite often [2]. An interesting survey in the US confirmed that the majority of consumers believe food tastes better with some level of pungency [3]. Additionally, repeated tasting of pungency desensitizes nerve fibers on the tongue, explaining the increase in consumption of this type of food [4]. Capsaicin, as the predominant pungent substance in chili peppers has many benefits as it stimulates digestion, increases the sensation of fullness, energy metabolism and expenditure [5,6,7].
Pungency sensations are usually evaluated through one of the two main perspectives—descriptors and intensity [8]. Zhang et al. [9] assume that fewer studies evaluate the intensity of pungency compared to the majority focusing on detection thresholds with very limited research analyzing direct scaling methods. Different approaches have been used in analyzing the effects of pungency, mostly through a sensorial perspective such as in adding cayenne pepper in meals [10] or soups flavored with chipotle chili [3]. The hedonic perspective was investigated by several authors, such as the works of Ludy and Mattes [11] and Carstens et al. [12]. Consumer acceptability of pungency-related flavor compounds was associated with the likeliness and choice of food pungency performed by Spinelli et al. [13]. The use of the temporal dominance of sensation method for analyzing pungency acquires defining descriptors and training the panel for its adequate use [9]. This method is used for analyzing the dynamic perspective of dominance changes, such as in the case of habanero pepper [14] or baijiu [15]. The time-intensity (TI) approach of the oral burn sensation has been analyzed with chili-spiced pork patties [5,16], trigeminal pungency perception [17] or pungency perception of capsaicin in different food matrices [18]. When it comes to food oral processing, studies mainly analyzed the influence of pungency on aroma release and saliva flow as in the studies of Nasrawi and Pangborn [19] or one of the latest performed by Yang et al. [20].
In the past few years, scientists and IT researchers have been working on developing tools for facial behavior analysis. Such tools have been used for investigating the expression of distaste and/or acceptance/rejection behavior among infants [21,22] towards bitter food associated with facial expressions [23]. Very recently, the technique has been used successfully for the temporal dominance of facial emotions [24,25].
Published papers analyzing the effect of pungency prevail in sensorial studies as opposed to food oral processing studies. However, a more complex overview of oral processing parameters and sensation during and after consumption joint with detection of emotions has not been properly analyzed. As a result, the main conclusions still remain unclear. Additionally, the use of grilled pork meat as a carrier from a perspective of dynamic profiling the pungency sensation has not been explored. The choice of these food matrices was due to the fact that grilling is one of the most common culinary methods, while pork meat (when grilled) has several intertwined sensations, such as flavor, tenderness, and juiciness [26].
This research was conducted for three main objectives. The first was to characterize oral processing characteristics of grilled pork meat after hot sauce coatings. The second aim was to evaluate the effects of pungency sensation during mastication of the samples on the perception of sensory stimuli as well as emotions. The third aim was to analyze pungency stimuli after swallowing. In designing this study, authors recognized the following working hypotheses: (a) oral processing parameters are affected by the intensity of pungency sensation; (b) different pungency sensations are associated with different types of hot sauces; and (c) emotions change during mastication of products coated with different hot sauces.

2. Materials and Methods

2.1. Pork Meat

Pork meat (m. longissimus dorsi) was purchased from a local butcher store in Belgrade, Serbia. The chosen type of meat is characterized as lean meat that does not contain connective tissue. For the experimental purpose, muscles of the approximately same size were confectioned on uniform steaks, vacuumed and stored in the refrigerator at 4 °C after purchasing.

2.2. Grilling

Before grilling, meat pieces rested at room temperature for 30 min. The pork meat was grilled using a Tefal grill (OptiGrill+). To control grilling, temperatures in the samples’ center were measured with a digital thermometer (Trotec GmbH-Model BT20, Heinsberg, Germany) to confirm they were above 72 °C [27]. The steaks were grilled on both sides simultaneously since Tefal OptiGrill provides that opportunity. Grilled samples were packed in vacuum bags, cooled in an ice-water bath, sealed, and placed in the refrigerator at 4 °C. Cubical specimens for analysis were cut from the steaks, excluding the edge parts. In that way, cubical specimens’ homogeneity was achieved.

2.3. Sauces Used for Initiating Pungency Sensations

For achieving the pungency sensation, 20 drops of three Tabasco hot sauces were dropped on the top of one surface of the grilled pork meat cubical samples (20 × 20 × 20 mm). Using the data of the Scoville rating obtained by the producer [28]: Sauce 1—Tabasco Brand Green Jalapeño Sauce Scoville Rating: 600–1200 Scoville heating units (SHU); Sauce 2—Tabasco Brand Original Red Sauce Scoville Rating: 2500–5000 SHU and Sauce 3—Tabasco Brand Habanero Pepper Sauce Scoville Rating: >7000 SHU. The rationale for choosing the Tabasco hot sauces is their worldwide availability, brand reputation, which enables research reproducibility and common use in Serbia.

2.4. Structuring the Panel for Sensory and Oral Processing Evaluation

The panel consisted of 10 panelists (6 female and 4 male) with previous experience in sensory and oral processing evaluations. During the initial meeting, they gave written informed consent and agreed to participate on a voluntary basis without being paid. The panelists have been trained in recognizing tastes/odors, the use of scales/ranks/scores, and the development of different sensory descriptors, as outlined in the standard [29]. They were in good general health condition, with no reported dental problems and with a normal range for BMI of 18–25 kg/m2, as suggested by Forde et al. [30]. For training the panelists, three sessions (duration 2-h each) were organized. The topic of the first training session was all of the oral processing methods. The other two were for sensory evaluation of pungency sensations (defining pungency sensations as descriptors, temporal dominance of sensations, and time-intensity), as suggested by Djekic et al. [31]. The experimental setup of this study is presented in Figure 1. To avoid sensitization and desensitization when using burning irritants, for sessions organized on the same day, in-between interstimulus intervals were minimum of 30 min. Panels were separated by 72 h to avoid desensitization [16].

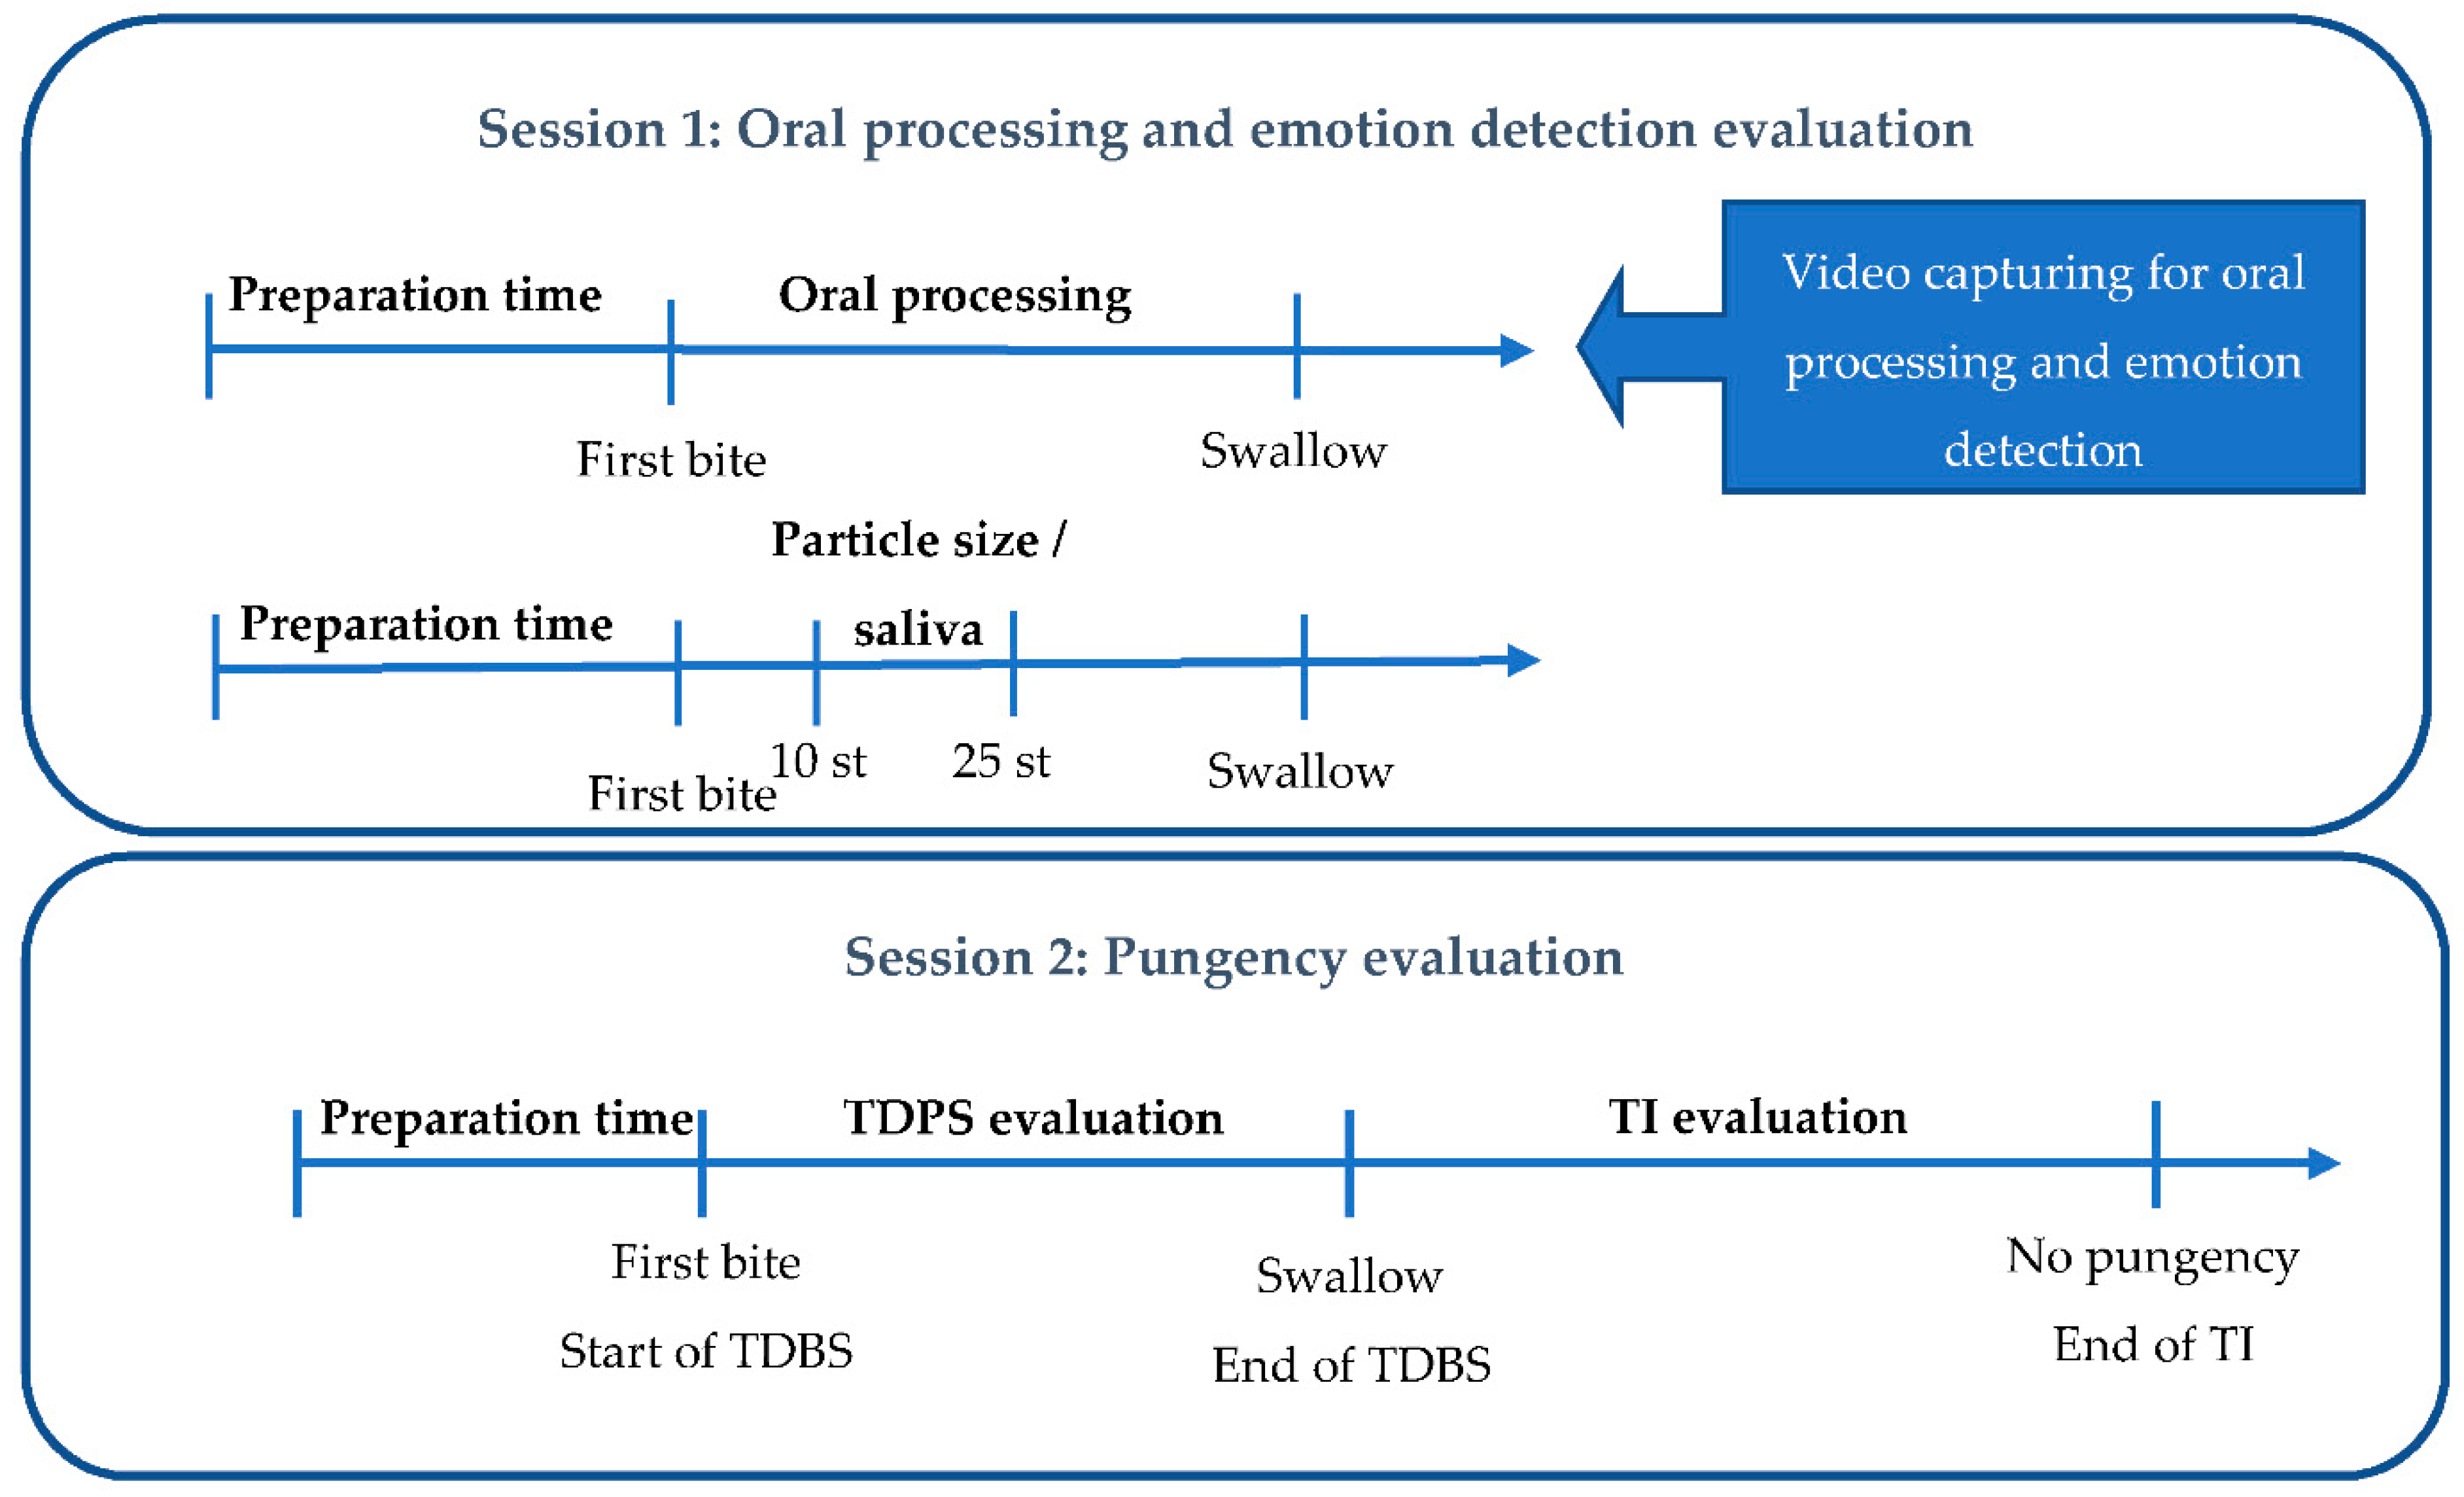
2.5. Oral Processing

2.5.1. Measuring Mastication Parameters

The grilled samples were cut in cubical samples (20 × 20 × 20 mm) and presented to panelists for mastication. The mass of each sample was measured using a technical balance of 0.01 g accuracy. In front of the panelist, a digital video camera was positioned to capture the upper part of the person chewing [30]. Panelists were instructed to look directly into the camera while chewing and to raise their hand when swallow, with the option to swallow more than once. By using a stopwatch option, all captured video clips were analyzed, resulting in the number of chews and total oral exposure time [32,33]. As a result, the number of chews, consumption time, chewing rate, eating rate, and number of swallowing were calculated [30,34]. The control sample (no sauce) and samples with the three types of sauces were presented to the panelists in three replications.

2.5.2. Saliva Incorporation

For each of the four samples and for the pre-determined three mastication times (10 strokes, 25 strokes, and moment before swallowing), the panelists expectorated their boluses in two replications. These numbers have been chosen based on a previous oral processing study with grilled meat, where 10 strokes correspond to the early stage of mastication and 25 chews for half of the mastication [26]. The first step was to determine the moisture content of meat and boluses [35]. All boluses were dried to the constant mass at 103 °C in the oven immediately after expectoration. Based on the meat and boluses moisture content difference, saliva incorporation has been calculated, aligned with works of de Lavergne et al. [36] and Rizo et al. [37].

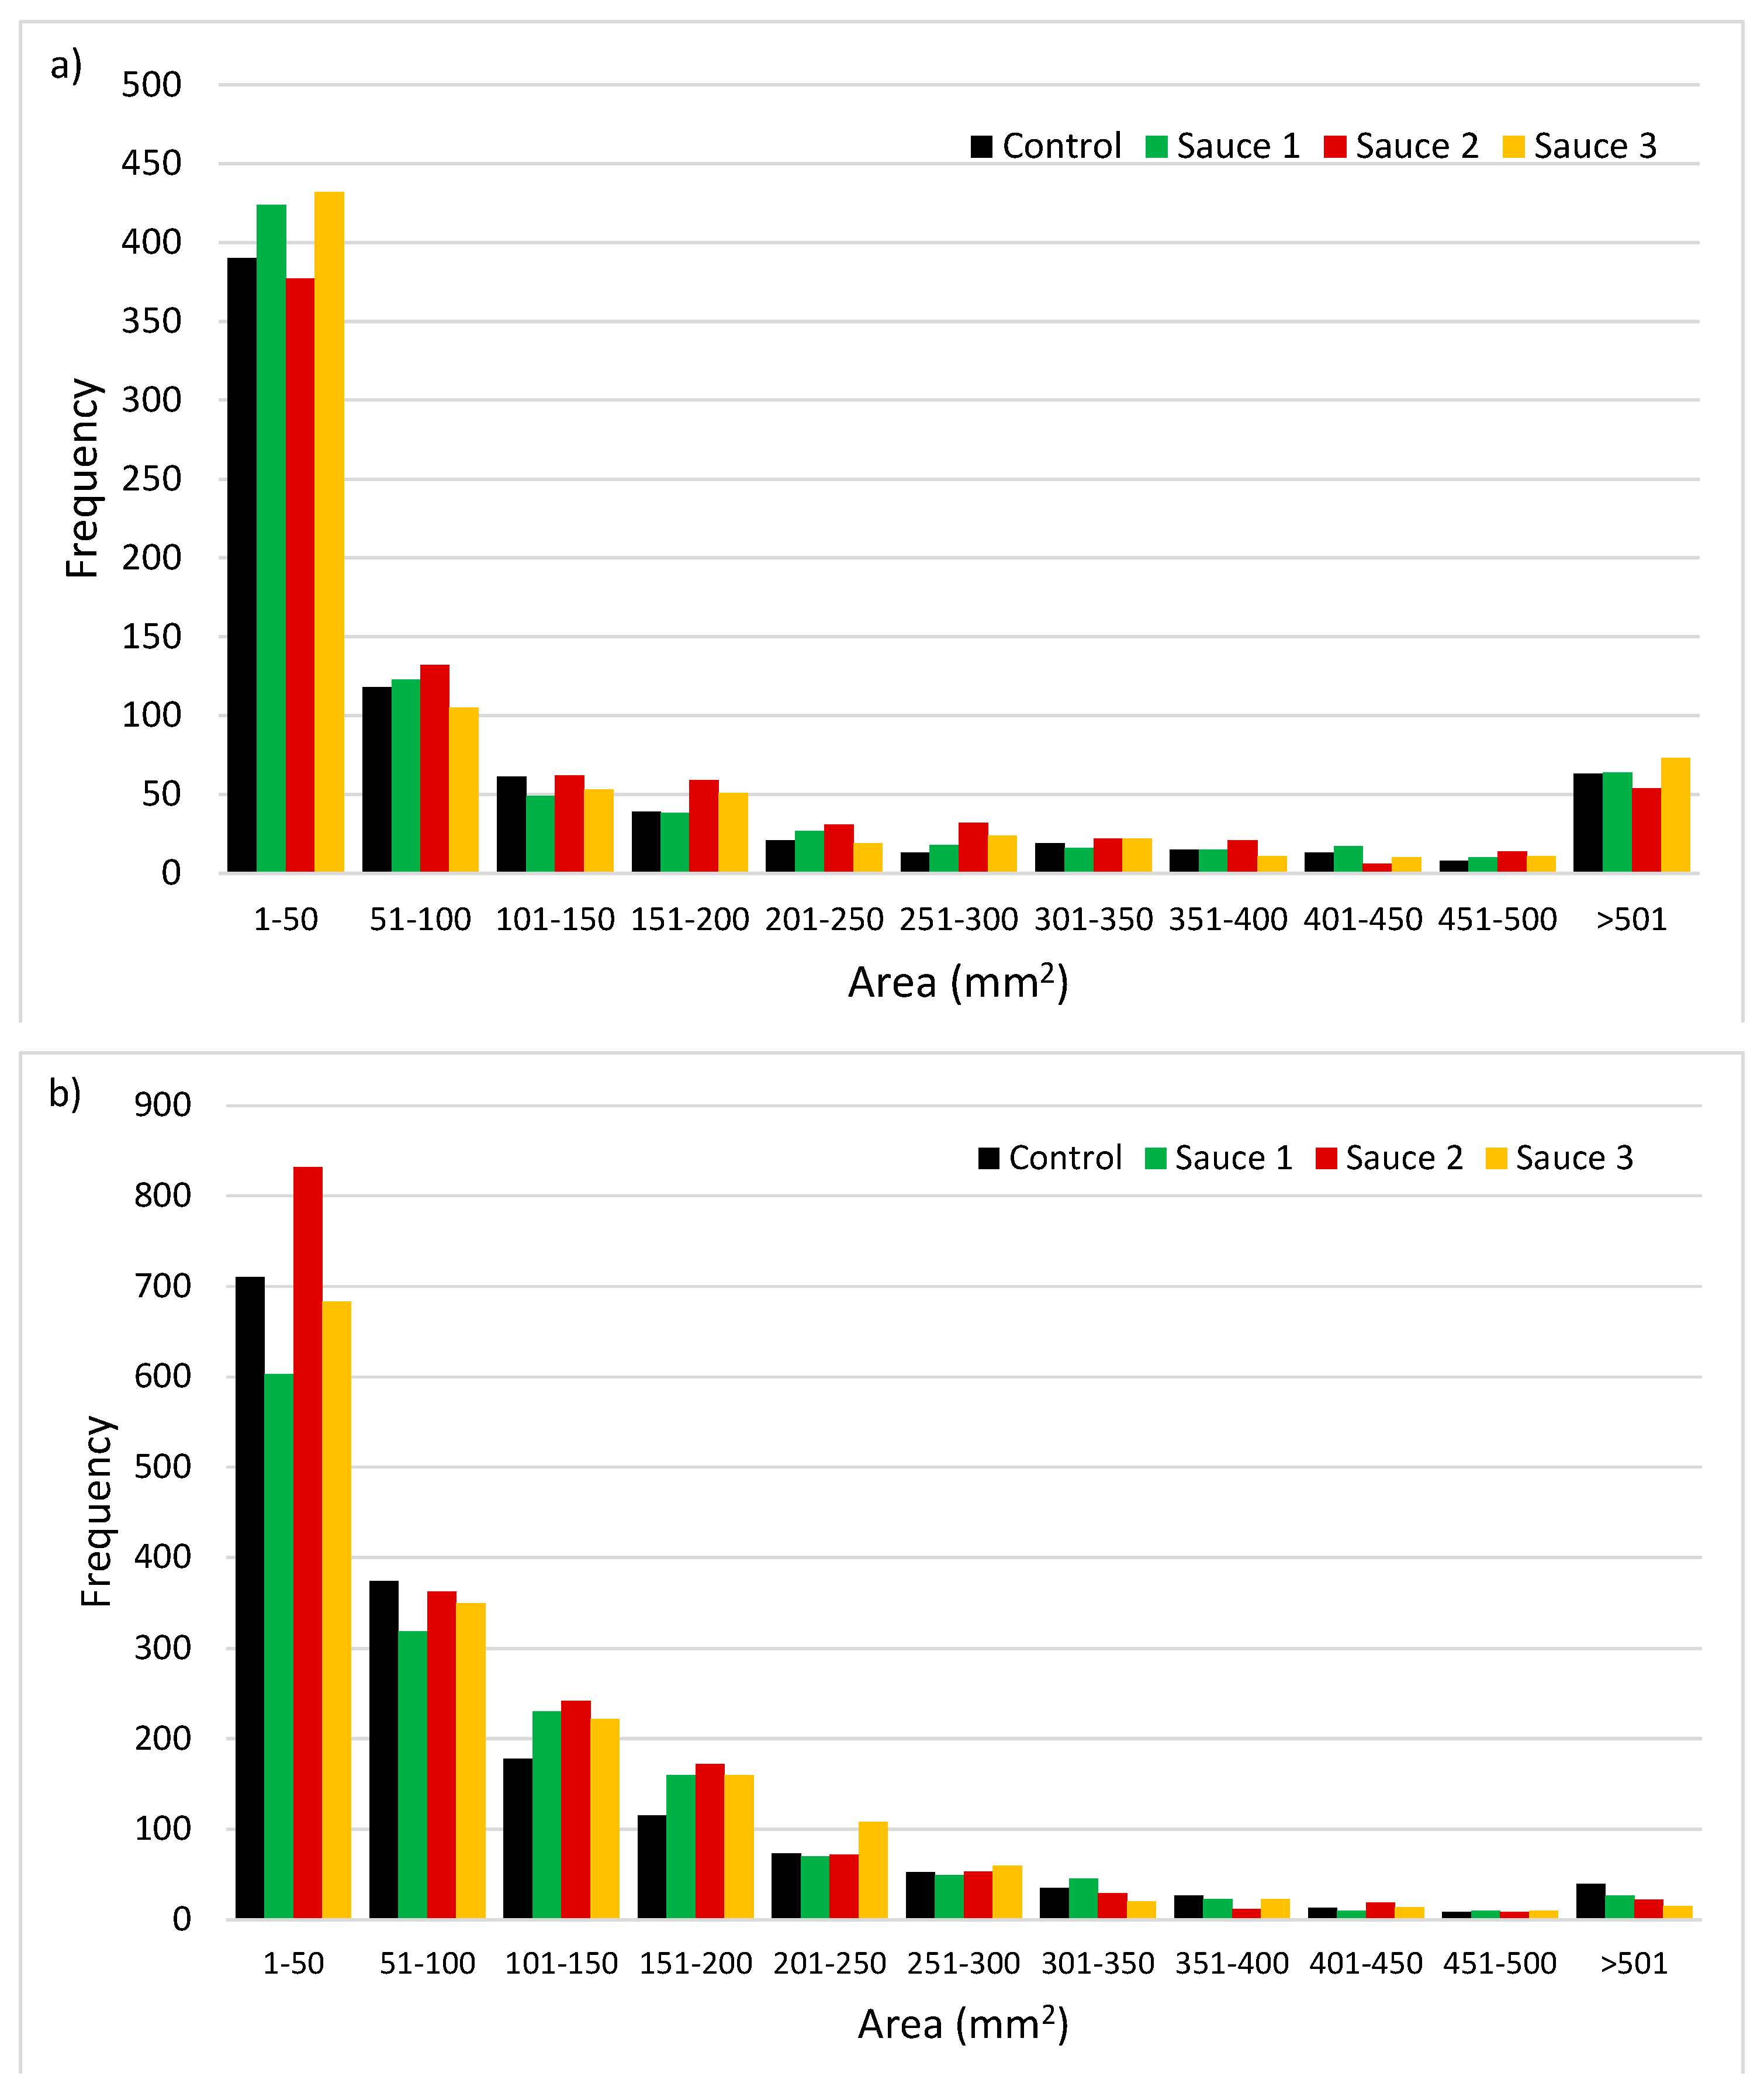
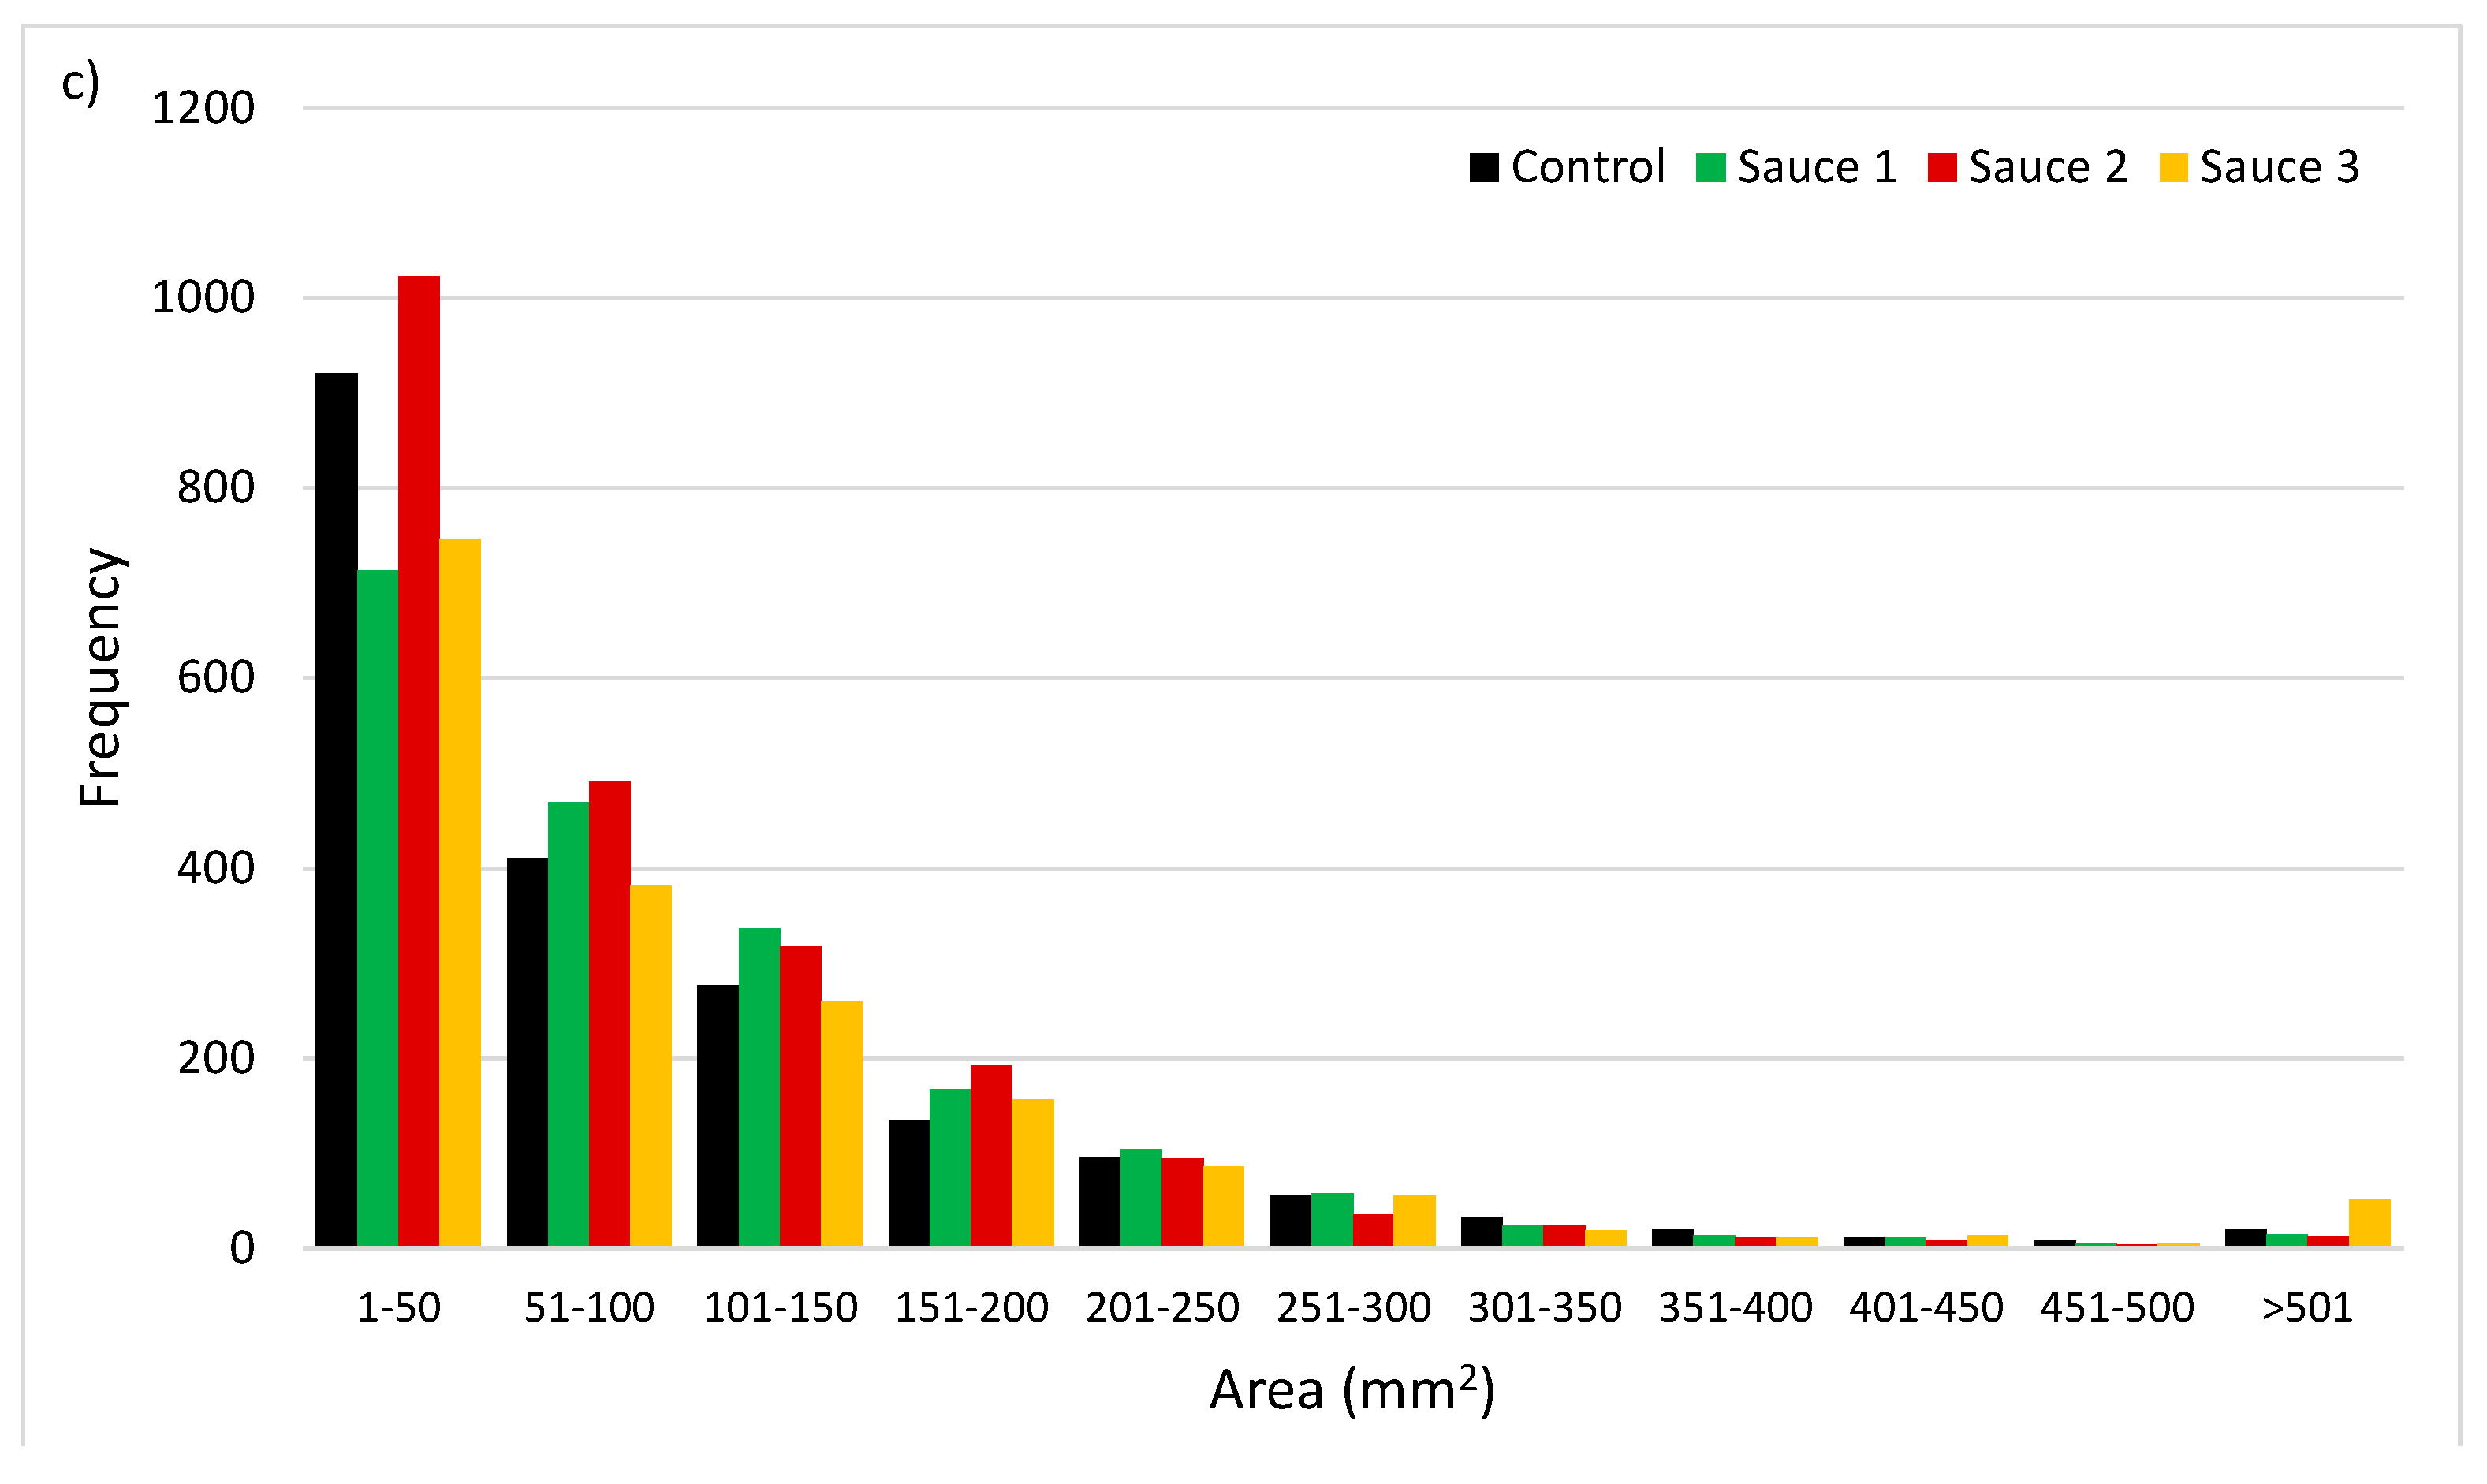
2.5.3. Particle Size Analysis

To analyze the grinding of the samples during mastication, boluses were collected after three mastication times (10 strokes, 25 strokes and moment before swallowing). This analysis was performed in three replicates. The first step was to rinse boluses with distilled water on filter paper and spread them out on white plates. To prevent damaging the size of particles, spreading out of boluses was conducted with special care. The second step was to photograph the particles using a computer vision system [38]. The final step was to analyze the images using ImageJ software, which enabled counting the number of particles and calculating their surface (2D analysis), based on which particle size distribution was calculated [37].

2.6. Oral Processing

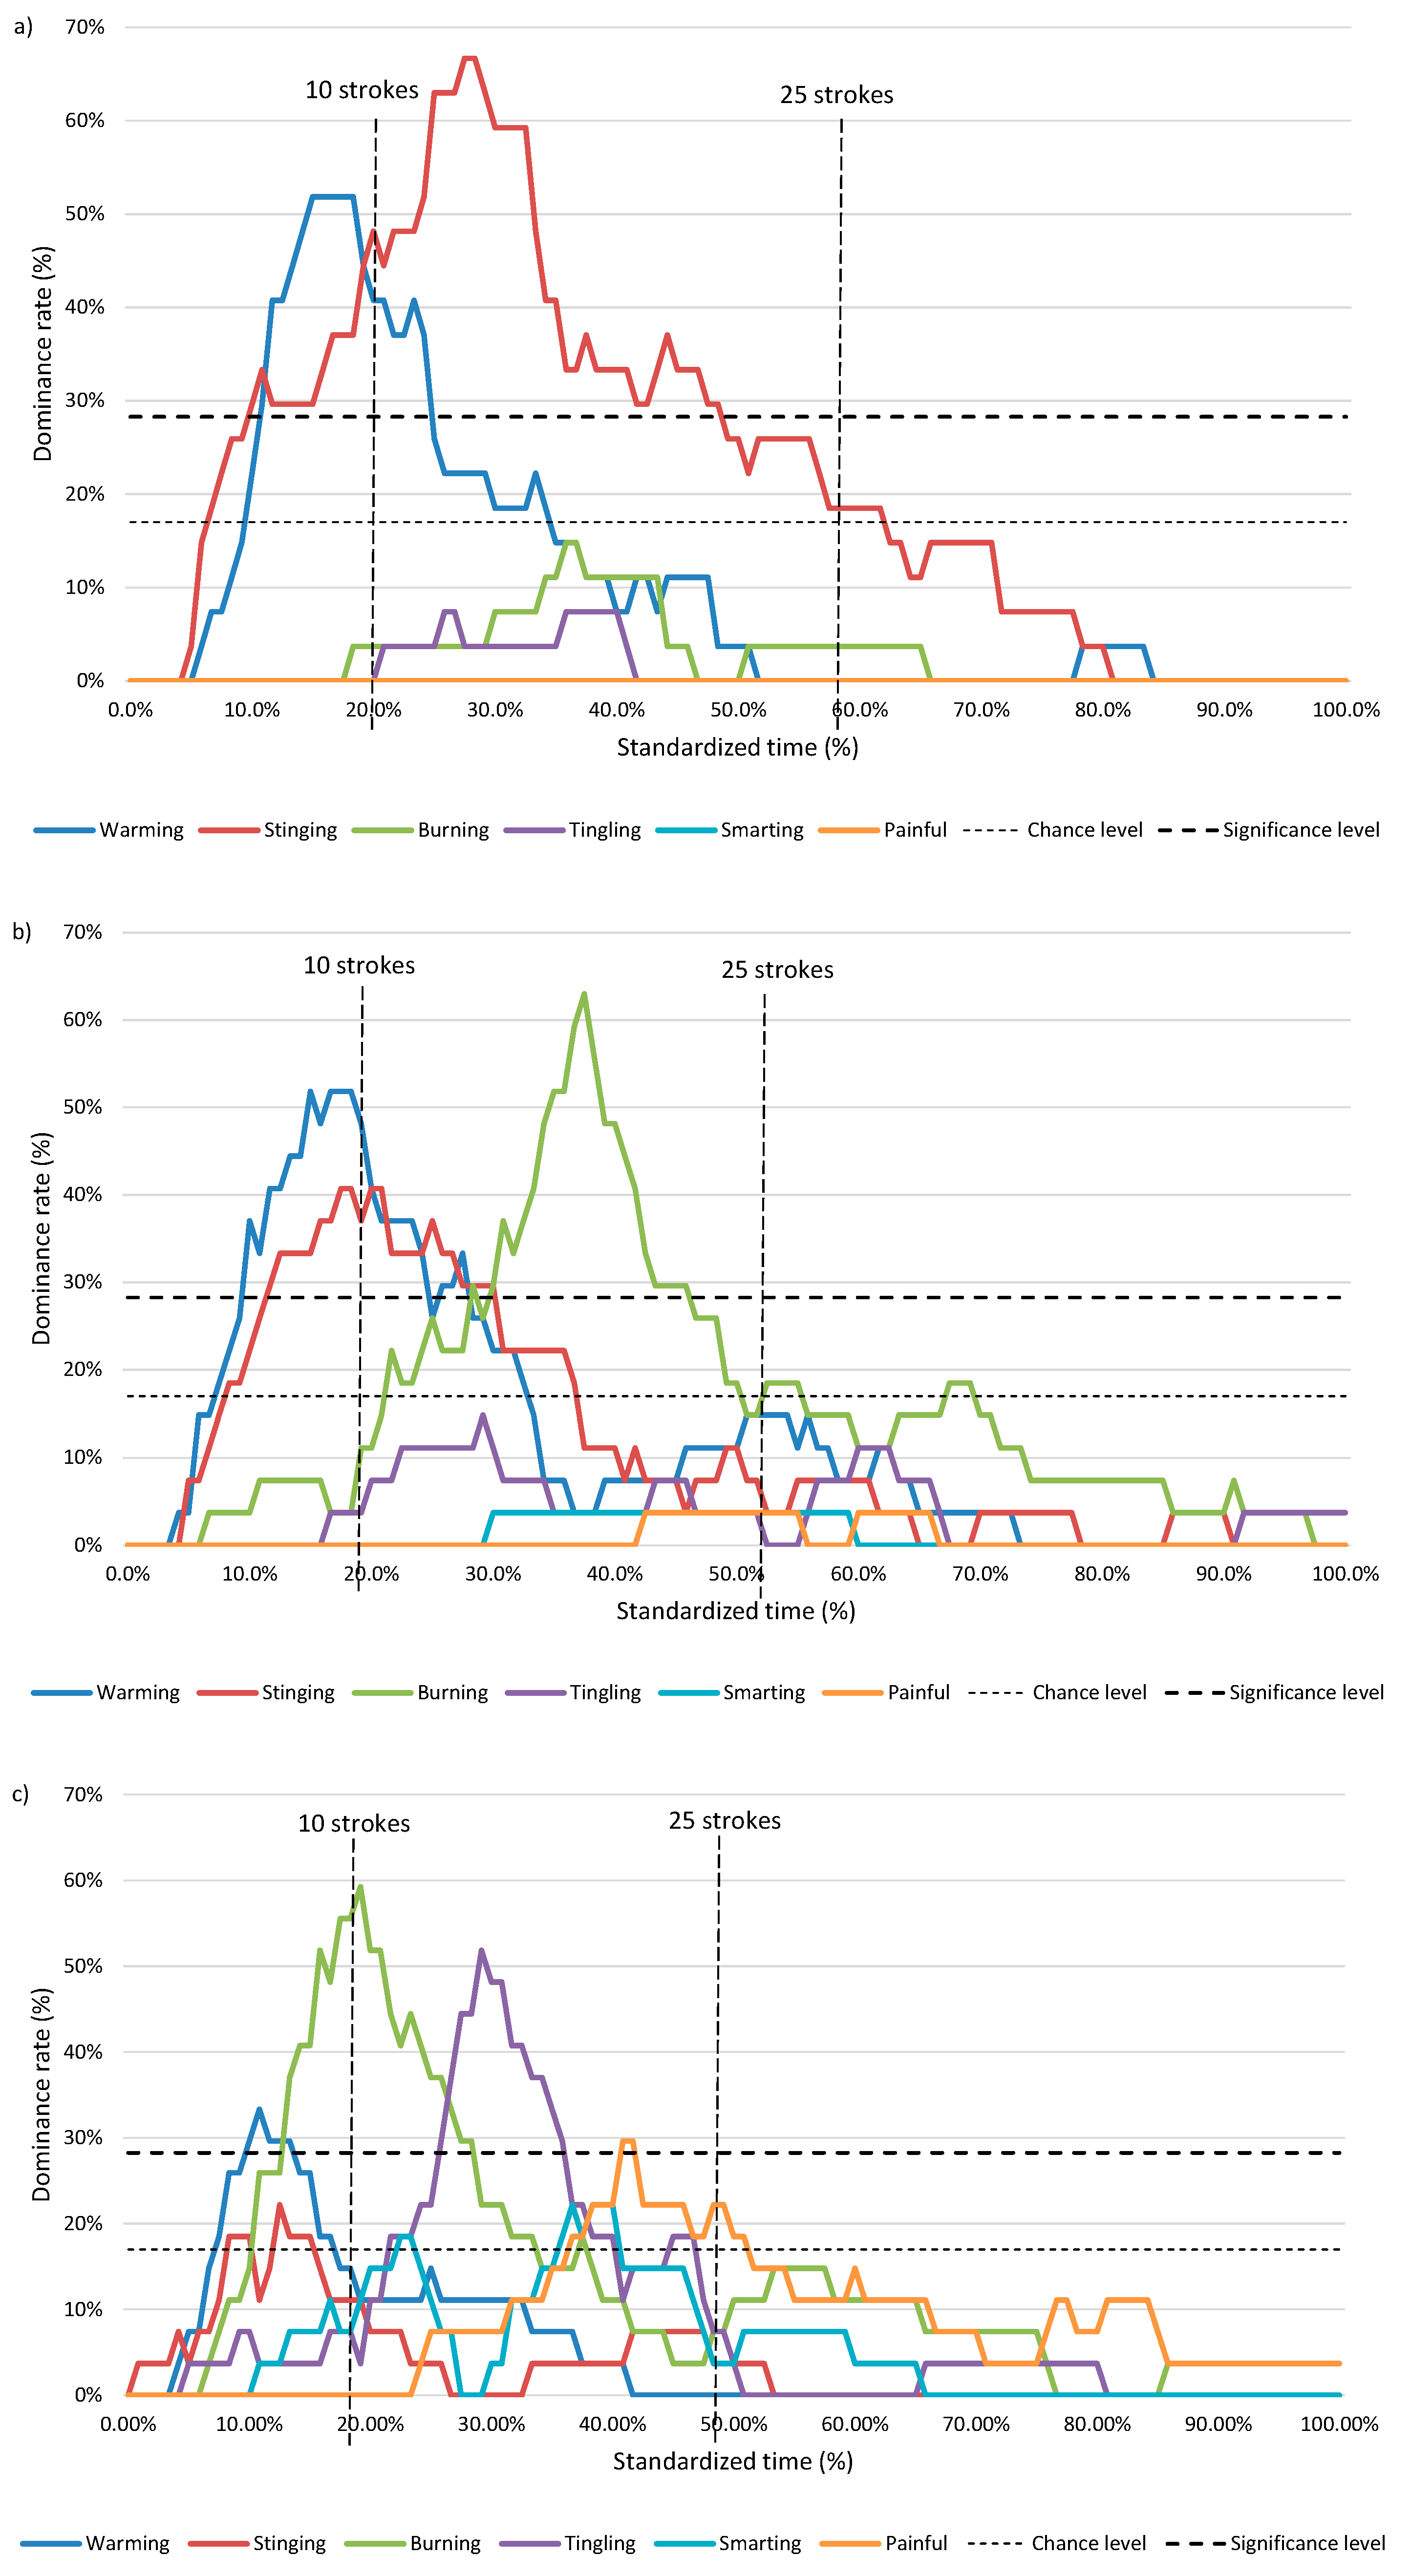
2.6.1. Pungency Sensations Methods

For performing the temporal dominance of pungency sensations (TDPS) evaluation, six sensations have been predefined, as follows: warming, stinging, burning, tingling, smarting, and painful. The meanings of each sensation joint with trial of products enriched with hot sauce were explained to the panelists during the first training session for the pungency sensation evaluation (Table 1). The definition of the pungency sensation was developed based on research from [9,14,16]. Additionally, panelists were instructed to select a dominant pungency sensation only when they perceived one, and they could choose the same attribute more than once.
TDPS was performed using an internally developed application and in line with the method explained in Djekic, Ilic, Lorenzo, and Tomasevic [26]. When the panelists started mastication, they pressed the “start” button, and dominant pungency sensations were recorded. In the moment of swallowing, panelists completed recording by pressing “stop”. All grilled samples were coded with three digits and served to the panelists randomly, one at a time. Between serving each sample, panelist were free to use bread and water as palate cleaners [5]. TDPS was performed in three replicates.
For every point on the time scale (in-oral exposure time), the value of the dominance rate was calculated by dividing the number of mentioning of a sensation by the number of panelists and replications. To interpret the curves, the rule of the thumb was that “the higher the proportion, the higher the level of agreement among panelists related to the dominating pungency sensation”. The plotted results have been standardized from the first bite to the moment of swallowing [26,39]. Besides this, two additional lines were added—chance level and significance level, which were calculated based on the work of Pineau et al. [40].

2.6.2. Pungency Sensations Methods

Video clips collected for measuring mastication parameters were used for analyzing emotions while chewing the grilled samples. They were used as a dataset for analyzing the emotions on the panelists’ faces. Good illumination of the face of the panelists was obtained in the laboratory for sensory analysis of the Faculty of Agriculture based on the recommendation Rocha, Lima, Moura, Costa, and Cunha [25] to ensure reliable results. The defined classes of emotion were “angry”, “happy”, “neutral”, “sad”, and “surprise”. These emotions were used from an internally developed model programmed in Python using DeepFace—face recognition and facial attribute analysis framework retrieved from GitHub [41]. All panelists were video recorded for 10 s, asking them to express a “neutral” face for internal calibration, as suggested by Rocha, Lima, Moura, Costa and Cunha [25].
The model analyzed each frame from the video clips by detecting the face in the frame and its prevailing emotion. To avoid bias in unintended detection of wild facial expression that may occur in different circumstances [42] and in our case recognizing “happy” or “angry” when the mouth is open for inserting the food prior to first bite, emotion detection was performed only for frames from the first bite to swallowing. Additionally, during mastication, panelists were asked to take of glasses (if any) as some types of glasses may mask classification [43].

2.6.3. Time-Intensity Measurement

The time-intensity (TI) measurement was performed using a 100 mm unstructured line scale ranging from “no burn” to “very much” for recording intensity, similar to the work of Reinbach, Toft, and Møller [16]. The intensity recordings of pungency sensations started from the moment of swallowing until the evaluation was stopped automatically after 5 min or when panelists pointed to zero on the intensity scale. The intensity data were recorded every 1 s. Based on the data, the following parameters have been extracted: Tstart—start time, Tend—end time, Imax—maximum observed intensity, and Tmax—time at which maximum intensity was reached for the first time [15,16].
Different concentrations of hot sauces were presented to the panelists during the second training session for pungency sensation evaluation to help the assessors practice rating, similar to the training performed by He, Chen, Tang, Qian, Yu, and Xu [15]. TI was performed in three replicates.

2.7. Statistical Processing

One-way ANOVA and Tukey’s HSD post hoc tests were used to distinguish statistical differences between the samples, using grilled pork meat with no sauce as “control” for oral processing results and saliva incorporation. The chi-square test for association was used in analyzing possible relationships between particle size fragmentation (after 10 strokes, after 25 strokes, and before swallowing) and the type of the food sample. Spearman rank order correlation coefficient (rs) was calculated to measure the strength and direction of association that exists between oral processing parameters and saliva incorporation.
ANOVA was also applied for analyzing significant differences in pungency perception from the TI results, taking into account pungency intensity and panelists, followed by Tukey’s HSD post hoc test. The same approach was used for analyzing TDPS results in relation to the samples. Regarding emotion detection, a chi-square test for association was used in analyzing possible relationships between emotions and the type of the food sample.

3. Results and Discussion

3.1. Oral Processing Characteristics

Regarding the number of chews and consumption time, there is a slight but not statistically significant trend of an increased number of chews and a longer duration of consumption time correlated with pungency intensity (Table 2). Opposed to this, the eating rate has a decreasing trend—the higher intensity in the sauce, the lower the eating rate (from 0.34 g/s to 0.30 g/s). The chewing rate is between 1.16 and 1.23 chews/s. However, oral processing characteristics showed that there was no statistically significant difference between the four types of samples.
Table 2 presents saliva incorporation. The analysis of the samples with hot sauce showed that after 10 strokes, saliva decreases in relation to the pungency intensity in sauces. However, after 25 strokes and before swallowing, the trend switches, showing an increasing trend depending on the type of hot sauce. Saliva plays a vital role in food bolus formation for two reasons: aids cohesiveness between particles [44] and lubricates the bolus, enabling safe swallowing [37]. However, during the mastication of pungent food, salivation is a sensation that may also be observed [15]. These results clearly depict three phases in the mastication of pungent samples: the first phase when the sample is introduced in the oral cavity with limited saliva; the second phase when, due to the dilution with saliva, the sensations in the oral cavity increase, and the third phase ending with swallowing as explained in works of Eib, Schneider, Hensel, and Seuß-Baum [17] and Buettner et al. [45]. Additionally, these findings confirm the assumptions of Yang, Yang, Chen, and Fisk [20] that for a longer oral processing time, saliva will play an important role in hydrating and releasing pungency flavor compounds from food matrices with capsaicin. The inter-variability in salivary composition and saliva flow is mainly associated with flavor perception [46].
Spearman rank correlation was conducted using all mastication results gathered during the study (Table 3). Number of swallows has expressed significant correlation with saliva incorporation after 10 strokes (negative, rs = −0.216, p < 0.05) and before swallowing (positive, rs = 0.224, p < 0.05). The strongest correlation has been observed between chewing rate and saliva incorporation after 25 strokes (rs = 0.376, p < 0.01). From the results presented in Table 3, the correlation between mastication parameters and saliva incorporation after 10 strokes is between |0.154| and |0.216| and may be considered weak as opposed to saliva incorporation after 25 strokes, where the correlation is mostly very weak, except for chewing rate. Before swallowing, correlations are very weak to weak.
Particle size fragmentation that happens during mastication and/or before swallowing is in relation with water content and mechanical properties of food [37]. Therefore, it is not surprising that hot sauce did not significantly affect particle size distribution (Figure 2). However, based on the Figure 2a–c, it is obvious that: (i) the frequency of large particles decreases over time (for all three pre-defined mastication points) and (ii) the frequency of small particles increases with the mastication process. All boluses had between 31.68% and 40.36% of the area occupied by big particles (>100 mm2) regardless of the type of sample and number of strokes. Further analysis showed that small particles (1–10 mm2) occupied between 10.5% and 19.6% of the area, while medium-sized particles (10–100 m2) occupied between 46.6% and 52.8% of the area. Concerning particle size fragmentation, there was a statistically significant association observed between samples after 25 strokes (χ2 = 82.059; p < 0.05) and before swallowing (χ2 = 119.094, p < 0.05). After 10 strokes, the level of statistical significance was not observed (χ2 = 39.579, p > 0.05). This may be caused by the fact that pungency sensation does not start immediately after the first bite, so particle size was more affected by the texture of meat than by the pungency sensation.

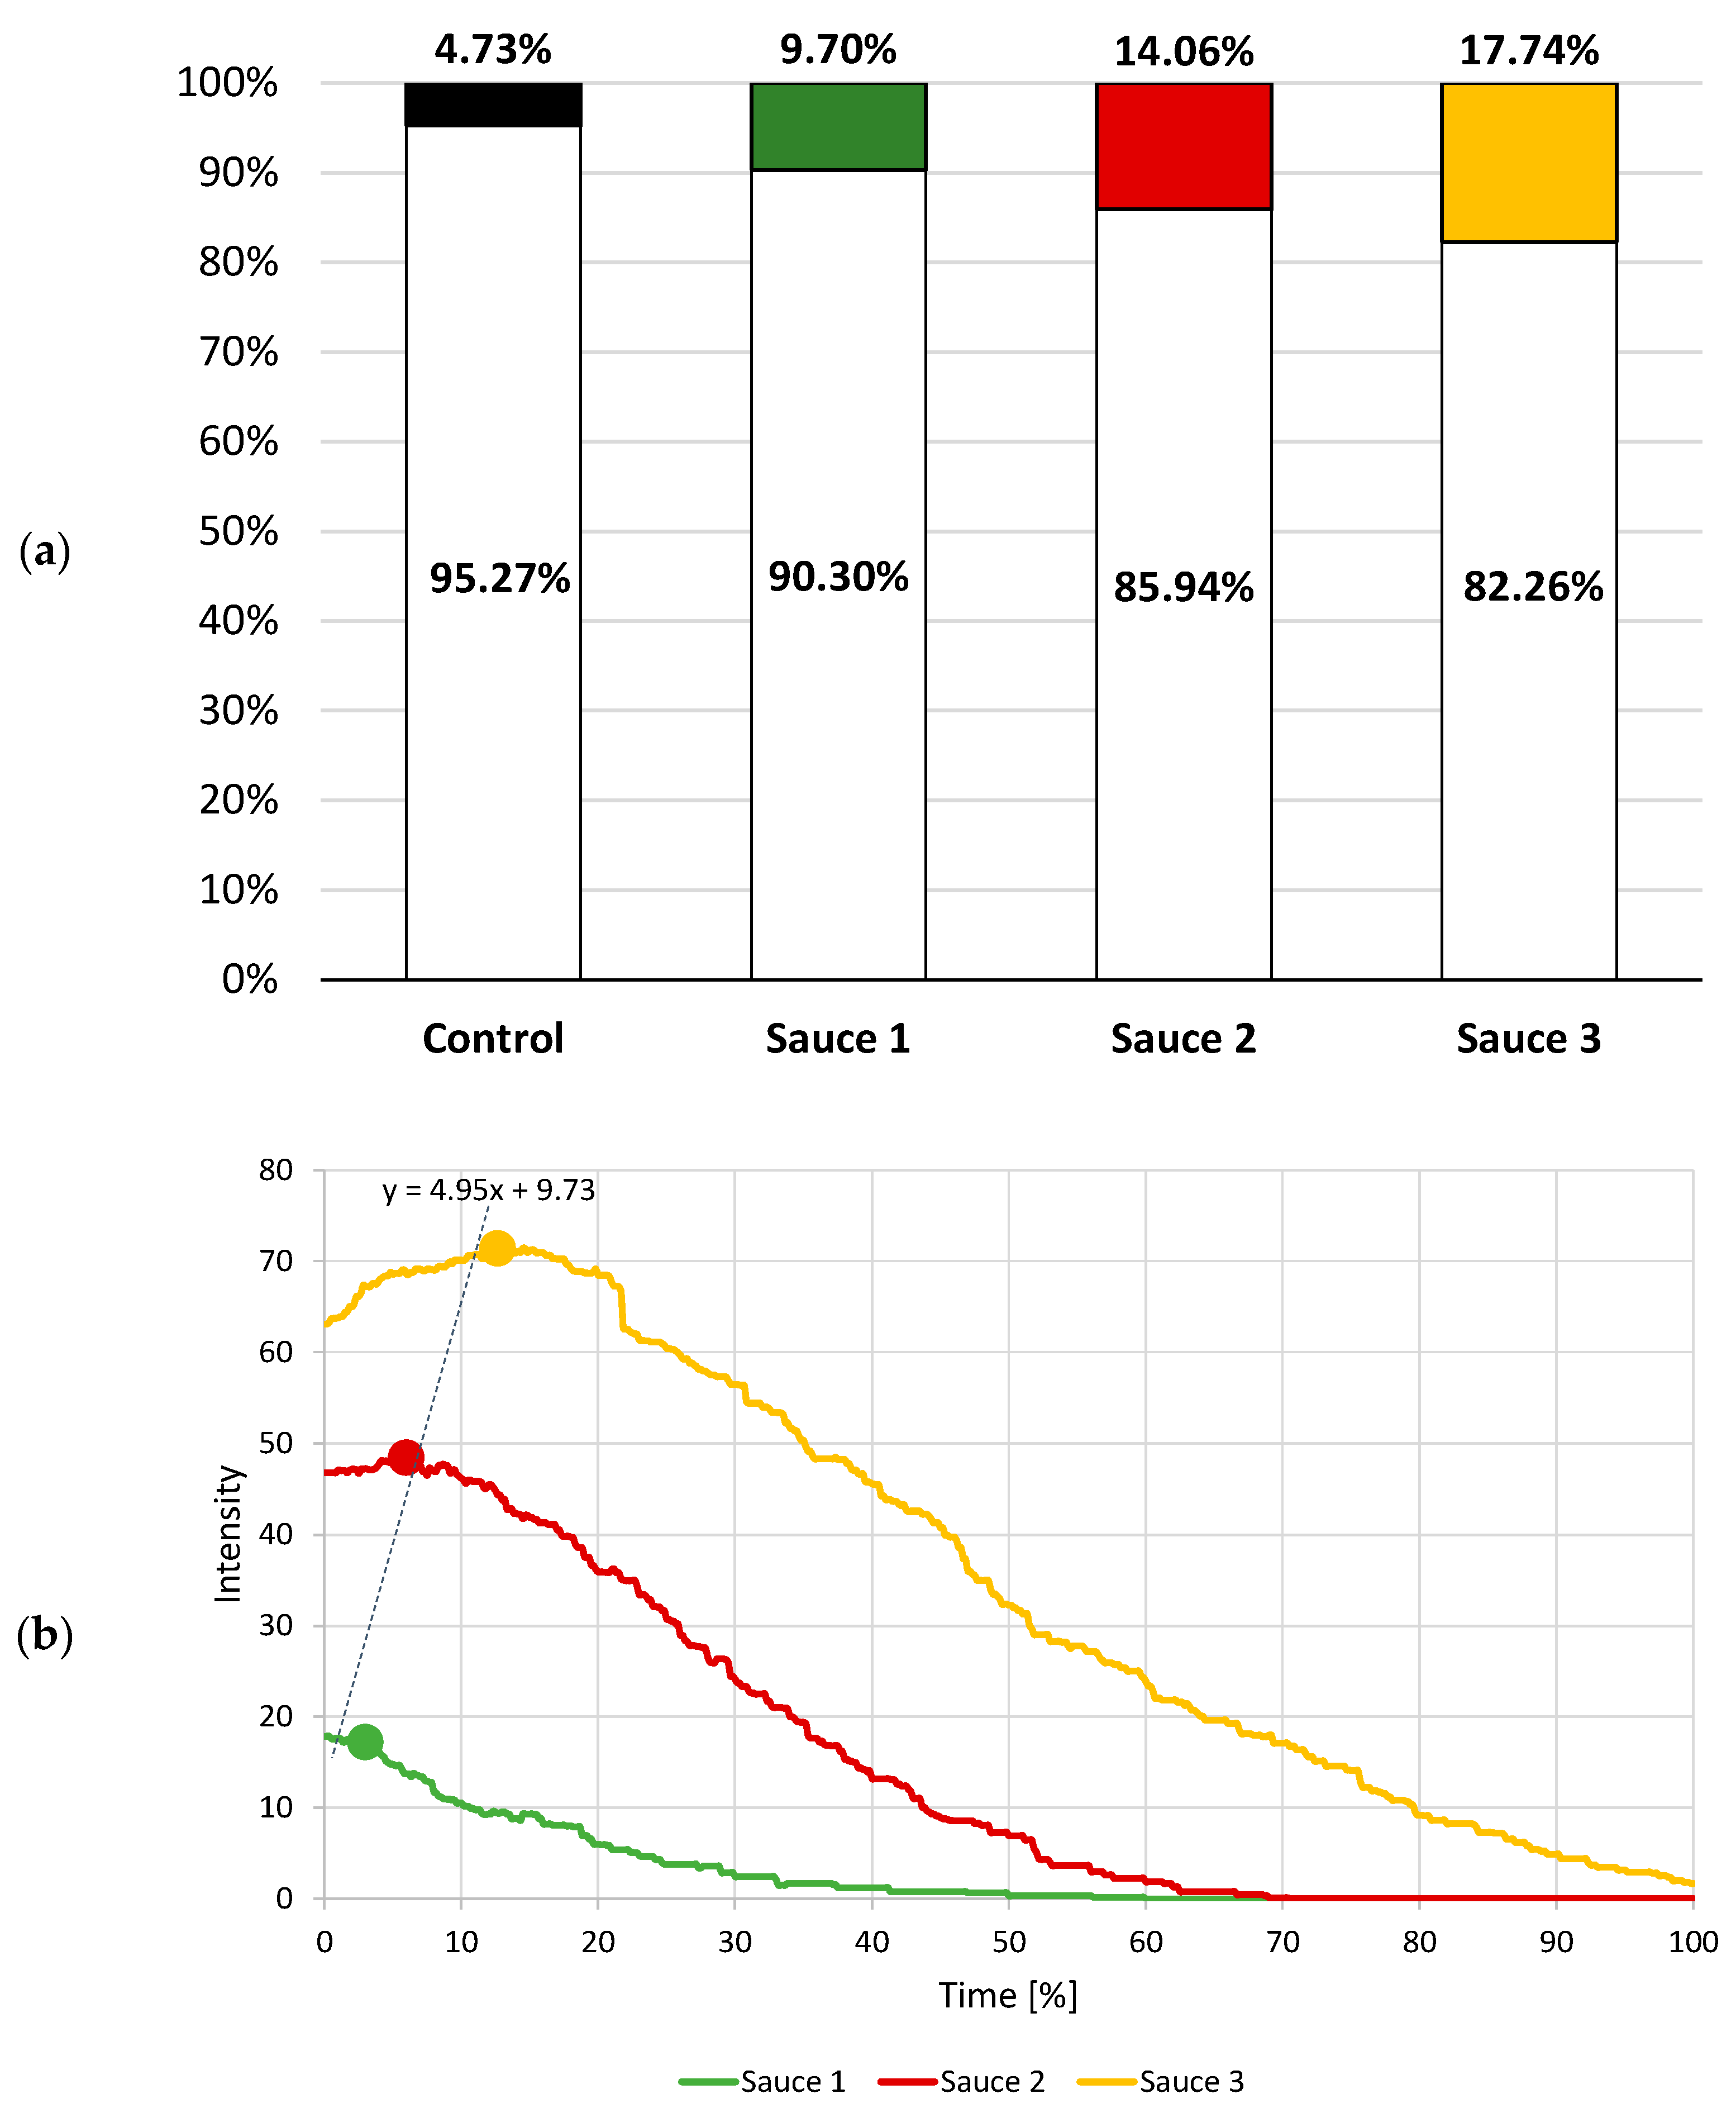
3.2. Pungency Sensations

When analyzing textural and flavor sensations during mastication, temporal dominance of sensations is recognized as the most promising sensory analysis technique in meat science [26,37]. It enables the dynamic evaluation of various attributes at the same time [40]. The application of this sensory tool in analyzing pungency sensations has not been explored so often, with its main challenge in pre-defining pungency sensations, such as in the case of He, Chen, Tang, Qian, Yu, and Xu [15] analyzing the pungency of Baijiu or taste carriers performed by Zhang, Shi, Wang, Zhao, and Chen [9].
Figure 3 presents the results of TDPS applied on evaluating grilled pork meat treated with three types of hot sauces, depicting the proportion of citations for each pungency sensation. The “warming” sensation dominated during the first 20% of consumption time (approximately first 10 strokes) for sauce 1 and 2 and first 10% of consumption time for sauce 3. “Stinging” was dominant between 10 and 25 strokes for sauce 2, while “burning” was identified as the dominant pungency sensation for sauce 2 (between 10 and 25 strokes) and sauce 3 (between 10% and 30% of consumption time). “Tingling” was the pungency sensation that dominated between 10 and 25 strokes for sauce 3. The increase in salivation observed after 25 strokes may be connected with different dominating sensations (“stinging”—sauce 1; “burning”—sauce 2; “tingling”—sauce 3). After 25 strokes for sauces 1 and 2, the same pungency sensation was identified as dominant (“stinging” and “burning”). For sauce 3, during the last period of mastication, the majority of panelists identified “painful”. These results comply with the study of Zhang, Shi, Wang, Zhao, and Chen [9], characterizing pungency through three aspects: time, sensation and dominant rate.
Statistical analysis further showed that samples significantly differed in the maximum of dominance rates (p < 0.05) for all pungency sensations. Also, different perception sequence and duration of dominant sensations during consumption (p < 0.05) was observed for “stinging”, “tingling”, and “smarting” for all three samples, while for “warming”, “burning”, and “painful” sensations, sauce 3 significantly differed from the other two (p < 0.05).
The analysis of the facial attributes recognized during mastication of the four types of samples revealed two main conclusions—the overall dominance of “neutral” emotion during mastication and an increase in non-neutral emotions following the pattern of increased SHU in applied hot sauces. This method has the potential to capture fast-changing emotions and targets the subconscious part of the emotion experience [24].
When only grilled pork meat was masticated, “neutral” emotion was the prevailing emotion for over 92.3% of the mastication time (average 95.27%, Figure 4a). The non-neutral emotions comprising of a combination of “angry”, “sad”, and “surprise” were recognized in 4.73% of observed frames, with “sad” being the most frequently observed emotion (3.93%). When grilled pork meat was enriched with sauce 1, the facial attributes were mostly associated with “neutral” for at least 77.6% of the mastication time (average 90.30%, Figure 4a). The non-neutral emotions comprised of a combination of the remaining four emotions—"angry”, “sad”, “happy”, and “surprise” in 9.70% of observed frames, with “sad” being the most frequently observed emotion (7.55%). Grilled pork meat with sauce 2 revealed a “neutral” emotion for over 70.28% of the mastication time (average 85.94%, Figure 4a). The non-neutral emotions comprising of a combination of the remaining four emotions were recognized in 14.06% of observed frames, with “sad” being the most frequently observed emotion (11.48%). Finally, sauce 3 decreased the overall “neutral” emotion to over two-thirds of the consumption time (average 82.26%, Figure 4a). The non-neutral emotions were recognized in 17.74% of observed frames, with “sad” being the most frequently observed emotion (14.84%). Concerning all detected emotions, there was a statistically significant association observed between samples (χ2 = 993.095; p < 0.05)
The large variation in “non-neutral” emotions may be caused by inter-variability of individuals but also caused by technical failures, such as shadows in the face due to movement during mastication or inappropriate eye contact with the camera, as investigated by van Bommel, Stieger, Visalli, de Wijk, and Jager [24] associated with their FaceReader technology.
The changes in pungency intensity over time from the TI evaluation are shown in Figure 4b. The results indicate that pungency sensation (both its intensity and duration) depends on the SHU of the sauce applied (p < 0.05). The higher values of SHU cause the recognition of higher intensity and longer pungency sensation. These sensations can be persistent and last for several minutes after expectoration or swallowing and are mainly in direct relation with the concentration of capsaicin [47] but also with the food matrix used [48]. The maximal intensity (Imax) of pungency and the time to reach the maximum intensity (Tmax) show that both values depend on type of sauce, as follows: Imax = 17.85; Tmax = 2.7% for sauce 1; Imax = 48.41; Tmax = 6.2% for sauce 2 and Imax = 71.44; Tmax = 13.0%. This trend is in concurrence with the study on pungency performed by He, Chen, Tang, Qian, Yu, and Xu [15]. Additionally, Reinbach, Toft and Møller [16] confirmed in their study that an increase in intensity and timing could show linearity, and this was outlined as the linear equation in Figure 4b.

4. Conclusions

Based on the established working hypotheses, our study confirmed two out of three. Mastication parameters show a slight but not statistically significant trend associated with the pungency intensity of the sauces, so the main conclusion may be that the pungency does not fully affect oral processing parameters. However, a possible explanation may also be the complexity of grilled meat used as a carrier. Saliva incorporation shows an increasing trend depending on the hot sauces, especially at the middle of mastication (25 strokes) and at the end (swallowing), with a correlation with the number of chews. Regarding the second hypothesis, our study employed TI and TDPS, considering both intensity and pungency sensation attributes. TDPS results show that the samples differ in their combination of dominant pungency sensations depending on the SHU values. TI results also clearly show a correlation between time-intensity and SHU values. Both TI and TDPS showed that the complexity of understanding pungency sensations is in relation to both intensity and different sensations, observed through a time dimension. Finally, the use of emotion detection software in analyzing the faces of panelists during mastication confirmed an increase in non-neutral emotions associated with the increase in pungency intensity.
Future investigations should focus on identifying and controlling biases associated with different food matrices and inter-variability of individuals (gender, age, nationality) in analyzing pungency effects on food oral processing parameters and emotions detected during mastication. Additionally, further research should focus on the correlation between TDPS and emotion detection.
This study has several limitations. First is the use of only one culinary method—grilling. The other is the use of meat as an anisotropic material with high complexity. Finally, conclusions, although in a certain way straightforward, require further investigation on other types of food systems to be applied in general.

Author Contributions

Conceptualization, I.D.; methodology, I.D., J.I., and R.D.; software, I.D. and R.D.; validation, J.I. and R.D.; formal analysis, I.D. and J.C.; investigation, J.I.; resources, I.D.; data curation, J.I. and R.D.; writing—original draft preparation, I.D.; writing—review and editing, I.D., J.C., B.G.S., D.V., and I.T.; visualization, J.I.; supervision, J.C. and I.T.; funding acquisition, I.D. All authors have read and agreed to the published version of the manuscript.

Funding

This research was funded by the Innovation Fund from the budget of the Government of the Republic of Serbia, Ministry of Education, Science and Technical Development through the “Competitiveness and Jobs Project”. The results within this research originated from a Proof of Concept project #5229, “Design of artificial masticator for modelling food oral processing”.

Institutional Review Board Statement

Ethical Review—This study was performed according to the Codex of professional ethics of the University of Belgrade (Kodeks profesionalne etike Univerziteta u Beogradu 193/2016).

Informed Consent Statement

All participants involved in the sensory analysis and oral processing study gave written informed consent prior to beginning this study.

Data Availability Statement

The data that support the findings of this study are available from the corresponding author upon reasonable request.

Conflicts of Interest

The authors declare no conflict of interest.

References

  1. Prescott, J.; Swain-Campbell, N. Responses to repeated oral irritation by capsaicin, cinnamaldehyde and ethanol in PROP tasters and non-tasters. Chem. Senses 2000, 25, 239–246. [Google Scholar] [CrossRef] [PubMed]
  2. Rozin, P.; Schiller, D. The nature and acquisition of a preference for chili pepper by humans. Motiv. Emot. 1980, 4, 77–101. [Google Scholar] [CrossRef]
  3. Scott, N.O.; Burgess, B.; Tepper, B.J. Perception and liking of soups flavored with chipotle chili and ginger extracts: Effects of PROP taster status, personality traits and emotions. Food Qual. Prefer. 2019, 73, 192–201. [Google Scholar] [CrossRef]
  4. Fattori, V.; Hohmann, M.S.; Rossaneis, A.C.; Pinho-Ribeiro, F.A.; Verri, W.A. Capsaicin: Current understanding of its mechanisms and therapy of pain and other pre-clinical and clinical uses. Molecules 2016, 21, 844. [Google Scholar] [CrossRef] [Green Version]
  5. Reinbach, H.C.; Meinert, L.; Ballabio, D.; Aaslyng, M.; Bredie, W.; Olsen, K.; Møller, P. Interactions between oral burn, meat flavor and texture in chili spiced pork patties evaluated by time-intensity. Food Qual. Prefer. 2007, 18, 909–919. [Google Scholar] [CrossRef]
  6. Gregersen, N.T.; Belza, A.; Jensen, M.; Ritz, C.; Bitz, C.; Hels, O.; Frandsen, E.; Mela, D.; Astrup, A. Acute effects of mustard, horseradish, black pepper and ginger on energy expenditure, appetite, ad libitum energy intake and energy balance in human subjects. Br. J. Nutr. 2013, 109, 556–563. [Google Scholar] [CrossRef]
  7. Janssens, P.L.; Hursel, R.; Westerterp-Plantenga, M.S. Capsaicin increases sensation of fullness in energy balance, and decreases desire to eat after dinner in negative energy balance. Appetite 2014, 77, 46–51. [Google Scholar] [CrossRef]
  8. Moskowitz, H.R. Ratio scales of sugar sweetness. Percept. Psychophys. 1970, 7, 315–320. [Google Scholar] [CrossRef] [Green Version]
  9. Zhang, L.; Shi, B.; Wang, H.; Zhao, L.; Chen, Z. Pungency evaluation of hydroxyl-sanshool compounds after dissolution in taste carriers per time-related characteristics. Chem. Senses 2017, 42, 575–584. [Google Scholar] [CrossRef] [Green Version]
  10. Andersen, B.V.; Byrne, D.V.; Bredie, W.L.P.; Møller, P. Cayenne pepper in a meal: Effect of oral heat on feelings of appetite, sensory specific desires and well-being. Food Qual. Prefer. 2017, 60, 1–8. [Google Scholar] [CrossRef]
  11. Ludy, M.-J.; Mattes, R.D. The effects of hedonically acceptable red pepper doses on thermogenesis and appetite. Physiol. Behav. 2011, 102, 251–258. [Google Scholar] [CrossRef] [Green Version]
  12. Carstens, E.; Carstens, M.I.; Dessirier, J.-M.; O’Mahony, M.; Simons, C.T.; Sudo, M.; Sudo, S. It hurts so good: Oral irritation by spices and carbonated drinks and the underlying neural mechanisms. Food Qual. Prefer. 2002, 13, 431–443. [Google Scholar] [CrossRef]
  13. Spinelli, S.; De Toffoli, A.; Dinnella, C.; Laureati, M.; Pagliarini, E.; Bendini, A.; Braghieri, A.; Toschi, T.G.; Sinesio, F.; Torri, L. Personality traits and gender influence liking and choice of food pungency. Food Qual. Prefer. 2018, 66, 113–126. [Google Scholar] [CrossRef]
  14. Ramírez-Rivera, E.d.J.; Rodriguez-Buenfil, I.M.; Pérez-Robles, M.; Oney-Montalvo, J.E.; Prinyawiwatkul, W.; Cabal-Prieto, A.; Ramírez-Sucre, M.O.; Herrera-Corredor, J.A. Development and validation of a methodology for the sensometric characterisation of high-pungency peppers: A case study of habanero pepper (Capsicum chinense Jacq.). Int. J. Food Sci. Technol. 2021, 56, 573–586. [Google Scholar] [CrossRef]
  15. He, Y.; Chen, S.; Tang, K.; Qian, M.; Yu, X.; Xu, Y. Sensory characterization of Baijiu pungency by combined time-intensity (TI) and temporal dominance of sensations (TDS). Food Res. Int. 2021, 147, 110493. [Google Scholar] [CrossRef] [PubMed]
  16. Reinbach, H.C.; Toft, M.; Møller, P. Relationship between oral burn and temperature in chili spiced pork patties evaluated by time–intensity. Food Qual. Prefer. 2009, 20, 42–49. [Google Scholar] [CrossRef]
  17. Eib, S.; Schneider, D.J.; Hensel, O.; Seuß-Baum, I. Evaluation of trigeminal pungency perception of allyl isothiocyanate—A time intensity (TI) study. Food Qual. Prefer. 2021, 87, 104039. [Google Scholar] [CrossRef]
  18. Schneider, D.J.; Seuß-Baum, I.; Schlich, E. Relationship between pungency and food components–A comparison of chemical and sensory evaluations. Food Qual. Prefer. 2014, 38, 98–106. [Google Scholar] [CrossRef]
  19. Nasrawi, C.W.; Pangborn, R.M. Temporal gustatory and salivary responses to capsaicin upon repeated stimulation. Physiol. Behav. 1990, 47, 611–615. [Google Scholar] [CrossRef]
  20. Yang, N.; Yang, Q.; Chen, J.; Fisk, I. Impact of capsaicin on aroma release and perception from flavoured solutions. LWT 2021, 138, 110613. [Google Scholar] [CrossRef] [PubMed]
  21. Hetherington, M.M.; Madrelle, J.; Nekitsing, C.; Barends, C.; de Graaf, C.; Morgan, S.; Parrott, H.; Weenen, H. Developing a novel tool to assess liking and wanting in infants at the time of complementary feeding—The Feeding Infants: Behaviour and Facial Expression Coding System (FIBFECS). Food Qual. Prefer. 2016, 48, 238–250. [Google Scholar] [CrossRef] [Green Version]
  22. Nekitsing, C.; Madrelle, J.; Barends, C.; de Graaf, C.; Parrott, H.; Morgan, S.; Weenen, H.; Hetherington, M.M. Application and validation of the Feeding Infants: Behaviour and Facial Expression Coding System (FIBFECS) to assess liking and wanting in infants at the time of complementary feeding. Food Qual. Prefer. 2016, 48, 228–237. [Google Scholar] [CrossRef] [Green Version]
  23. Garcia-Burgos, D.; Zamora, M.C. Exploring the hedonic and incentive properties in preferences for bitter foods via self-reports, facial expressions and instrumental behaviours. Food Qual. Prefer. 2015, 39, 73–81. [Google Scholar] [CrossRef] [Green Version]
  24. van Bommel, R.; Stieger, M.; Visalli, M.; de Wijk, R.; Jager, G. Does the face show what the mind tells? A comparison between dynamic emotions obtained from facial expressions and Temporal Dominance of Emotions (TDE). Food Qual. Prefer. 2020, 85, 103976. [Google Scholar] [CrossRef]
  25. Rocha, C.; Lima, R.C.; Moura, A.P.; Costa, T.; Cunha, L.M. Implicit evaluation of the emotional response to premium organic herbal infusions through a temporal dominance approach: Development of the temporal dominance of facial emotions (TDFE). Food Qual. Prefer. 2019, 76, 71–80. [Google Scholar] [CrossRef]
  26. Djekic, I.; Ilic, J.; Lorenzo, J.M.; Tomasevic, I. How do culinary methods affect quality and oral processing characteristics of pork ham? J. Texture Stud. 2021, 52, 36–44. [Google Scholar] [CrossRef] [PubMed]
  27. Van, D. Cooking Meat? Check the New Recommended Temperatures. Available online: https://www.usda.gov/media/blog/2011/05/25/cooking-meat-check-new-recommended-temperatures (accessed on 15 March 2021).
  28. Tabasco. Tabasco Hot Sauces. Available online: https://www.tabasco.com/hot-sauces/ (accessed on 15 March 2021).
  29. ISO. ISO 8586:2012 Sensory Analysis—General Guidelines for the Selection, Training and Monitoring of Selected Assessors and Expert Sensory Assessors; International Organization for Standardization: Geneva, Switzerland, 2012. [Google Scholar]
  30. Forde, C.; Van Kuijk, N.; Thaler, T.; De Graaf, C.; Martin, N. Oral processing characteristics of solid savoury meal components, and relationship with food composition, sensory attributes and expected satiation. Appetite 2013, 60, 208–219. [Google Scholar] [CrossRef]
  31. Djekic, I.; Lorenzo, J.M.; Munekata, P.E.S.; Gagaoua, M.; Tomasevic, I. Review on characteristics of trained sensory panels in food science. J. Texture Stud. 2021, 52, 501–509. [Google Scholar] [CrossRef]
  32. Hennequin, M.; Allison, P.J.; Veyrune, J.L.; Faye, M.; Peyron, M. Clinical evaluation of mastication: Validation of video versus electromyography. Clin. Nutr. 2005, 24, 314–320. [Google Scholar] [CrossRef] [PubMed]
  33. Nicolas, E.; Veyrune, J.L.; Lassauzay, C.; Peyron, M.A.; Hennequin, M. Validation of video versus electromyography for chewing evaluation of the elderly wearing a complete denture. J. Oral Rehabil. 2007, 34, 566–571. [Google Scholar] [CrossRef] [PubMed]
  34. Aguayo-Mendoza, M.G.; Ketel, E.C.; van der Linden, E.; Forde, C.G.; Piqueras-Fiszman, B.; Stieger, M. Oral processing behavior of drinkable, spoonable and chewable foods is primarily determined by rheological and mechanical food properties. Food Qual. Prefer. 2019, 71, 87–95. [Google Scholar] [CrossRef]
  35. ISO. ISO 1442:1997 Meat and Meat Products—Determination of Moisture Content; International Organization for Standardization: Geneva, Switzerland, 1997. [Google Scholar]
  36. de Lavergne, M.D.; Van De Velde, F.; Van Boekel, M.; Stieger, M. Dynamic texture perception and oral processing of semi-solid food gels: Part 2: Impact of breakdown behaviour on bolus properties and dynamic texture perception. Food Hydrocoll. 2015, 49, 61–72. [Google Scholar] [CrossRef]
  37. Rizo, A.; Peña, E.; Alarcon-Rojo, A.D.; Fiszman, S.; Tárrega, A. Relating texture perception of cooked ham to the bolus evolution in the mouth. Food Res. Int. 2019, 118, 4–12. [Google Scholar] [CrossRef] [Green Version]
  38. Tomasevic, I.; Tomovic, V.; Milovanovic, B.; Lorenzo, J.; Đorđević, V.; Karabasil, N.; Djekic, I. Comparison of a computer vision system vs. traditional colorimeter for color evaluation of meat products with various physical properties. Meat Sci. 2019, 148, 5–12. [Google Scholar] [CrossRef] [PubMed]
  39. Cheong, J.N.; Foster, K.D.; Morgenstern, M.P.; Grigor, J.M.; Bronlund, J.E.; Hutchings, S.C.; Hedderley, D.I. The application of temporal dominance of sensations (TDS) for oral processing studies: An initial investigation. J. Texture Stud. 2014, 45, 409–419. [Google Scholar] [CrossRef]
  40. Pineau, N.; Schlich, P.; Cordelle, S.; Mathonnière, C.; Issanchou, S.; Imbert, A.; Rogeaux, M.; Etiévant, P.; Köster, E. Temporal Dominance of Sensations: Construction of the TDS curves and comparison with time–intensity. Food Qual. Prefer. 2009, 20, 450–455. [Google Scholar] [CrossRef]
  41. Taigman, Y.; Yang, M.; Ranzato, M.A.; Wolf, L. Deepface: Closing the gap to human-level performance in face verification. In Proceedings of the IEEE Conference on Computer Vision and Pattern Recognition, Columbus, OH, USA, 23–28 June 2014; pp. 1701–1708. [Google Scholar]
  42. Ahmed, M.U.; Woo, K.J.; Hyeon, K.Y.; Bashar, M.R.; Rhee, P.K. Wild facial expression recognition based on incremental active learning. Cogn. Syst. Res. 2018, 52, 212–222. [Google Scholar] [CrossRef]
  43. Danner, L.; Sidorkina, L.; Joechl, M.; Duerrschmid, K. Make a face! Implicit and explicit measurement of facial expressions elicited by orange juices using face reading technology. Food Qual. Prefer. 2014, 32, 167–172. [Google Scholar] [CrossRef]
  44. Prinz, J.; Lucas, P. Mastication and swallowing: An optimisation model. Proc. R. Soc. Lond. B 1997, 264, 1715–1721. [Google Scholar] [CrossRef] [PubMed] [Green Version]
  45. Buettner, A.; Beer, A.; Hannig, C.; Settles, M.; Schieberle, P. Physiological and analytical studies on flavor perception dynamics as induced by the eating and swallowing process. Food Qual. Prefer. 2002, 13, 497–504. [Google Scholar] [CrossRef]
  46. Canon, F.; Neiers, F.; Guichard, E. Saliva and flavor perception: Perspectives. J. Agric. Food. Chem. 2018, 66, 7873–7879. [Google Scholar] [CrossRef] [PubMed]
  47. Lawless, H. Oral chemical irritation: Psychophysical properties. Chem. Senses 1984, 9, 143–155. [Google Scholar] [CrossRef]
  48. Baron, R.F.; Penfield, M.P. Capsaicin heat intensity-concentration, carrier, fat level, and serving temperature effects. J. Sens. Stud. 1996, 11, 295–316. [Google Scholar] [CrossRef]
Figure 1. Schematic overview of the research protocol with an indication of specific method employed. Legend: TDPS—temporal dominance pungency sensation; TI—time-intensity measurement; st—stroke.
Applsci 11 10459 g001
Figure 2. Particle size distribution (frequency vs. area): (a) after 10 strokes; (b) after 25 strokes; (c) before swallowing.
Applsci 11 10459 g002aApplsci 11 10459 g002b
Figure 3. Temporal dominance pungency sensations (TDPS) curves for grilled pork meat with three different sauces: (a) Tabasco Brand Green Jalapeño Sauce; (b) Tabasco Brand Original Red Sauce; (c) Tabasco Brand Habanero Pepper Sauce. Defined time axis from t = 0 (first bite—0%) to t = 1 (swallowing—100%). Attributes are shown in different colors.
Applsci 11 10459 g003
Figure 4. (a) Relative contribution of emotions observed during mastication and (b) time-intensity average curves after mastication of grilled meat with three different sauces. ☐ Neutral emotion; ☐ “Control” non-neutral emotion; “Sauce 1” non-neutral emotion; “Sauce 2” non-neutral emotion; “Sauce 3” non-neutral emotion. Legend: Control—no sauce; Sauce 1—Tabasco Brand Green Jalapeño Sauce; Sauce 2—Tabasco Brand Original Red Sauce; Sauce 3—Tabasco Brand Habanero Pepper Sauce.
Applsci 11 10459 g004
Table 1. Pungency descriptors and definitions.
DescriptorDefinition
WarmingIncreasing heat generation in mouth but not causing pain
StingingFeeling a sharp pain like a sting
BurningFeeling of heat causing pain
TinglingPricked by a needle slightly but frequently
SmartingPain similar to wound/burn/sore
PainfulFeeling causing pain
Table 2. Summary of the oral processing behavior parameters for samples prepared using three sauces.
ControlS1S2S3
Number of chews46.00 ± 24.7744.92 ± 16.448.50 ± 19.2152.25 ± 17.38
Consumption time (s)37.50 ± 17.5937.41 ± 12.6541.94 ± 15.7842.89 ± 12.83
Number of swallows2.19 ± 0.712.44 ± 0.812.39 ± 0.772.50 ± 0.81
Chewing rate (chew/s)1.23 ± 0.271.20 ± 0.241.16 ± 0.251.22 ± 0.19
Eating rate (g/s)0.33 ± 0.140.34 ± 0.120.32 ± 0.120.30 ± 0.09
Saliva incorporation—10 strokes (%)3.96 ± 1.634.22 ± 2.213.63 ± 2.193.47 ± 1.71
Saliva incorporation—25 strokes (%)5.11 ± 1.975.23 ± 2.135.35 ± 2.556.32 ± 3.36
Saliva incorporation—Before swallowing (%)6.86 ± 3.896.86 ± 3.417.64 ± 3.457.79 ± 3.26
Legend: S1—Tabasco® Brand Green Jalapeño Sauce; S2—Tabasco® Brand Original Red Sauce; S3—Tabasco® Brand Habanero Pepper Sauce.
Table 3. Spearman’s Rho correlation coefficient between oral processing parameters and saliva incorporation.
Number of ChewsConsumption TimeNumber of SwallowsChewing RateEating Rate
10 strokes−0.197−0.154−0.216 *0.1900.195
25 strokes−0.076−0.045−0.072−0.376 **0.005
Before swallowing0.0630.1210.224 *−0.092−0.076
Legend: * Correlation is significant at the 0.05 level. ** Correlation is significant at the 0.01 level (2-tailed).
Publisher’s Note: MDPI stays neutral with regard to jurisdictional claims in published maps and institutional affiliations.

