Article

The Influence of Heat Input on the Surface Quality of Wire and Arc Additive Manufacturing

School of Mechanical Engineering, Shanghai Institute of Technology, Shanghai 201418, China
*
Author to whom correspondence should be addressed.
Appl. Sci. 2021, 11(21), 10201; https://doi.org/10.3390/app112110201
Submission received: 12 October 2021 / Revised: 23 October 2021 / Accepted: 28 October 2021 / Published: 30 October 2021
(This article belongs to the Topic Additive Manufacturing)

Abstract

:
Wire and arc additive manufacturing has unique process characteristics, which make it have great potential in many fields, but the large amount of heat input brought by this feature limits its practical application. The influence of heat input on the performance of parts has been extensively studied, but the quantitative description of the influence of heat input on the surface quality of parts by wire and arc additive manufacturing has not received enough attention. According to different heat input, select the appropriate process parameters for wire and arc additive manufacturing, reversely shape the profile model, select the appropriate function model to establish the ideal profile model according to the principle of minimum error, and compare the two models to analyze the effect of heat input on the surface quality of the parts manufactured by wire and arc additive manufacturing. The results show that, when the heat input is high or low, the standard deviation value and the root mean square value reach 1.908 and 1.963, respectively. The actual profile is larger than the ideal profile. When the heat input is moderate, the standard deviation value and the root mean square value are only 1.634 and 1.713, respectively, and the actual contour is in good agreement with the ideal contour. Combined with the analysis of the transverse and longitudinal sections, it is shown that the heat input has a high degree of influence on the surface quality of the specimen manufactured by wire and arc additive manufacturing, and higher or lower heat input is disadvantageous to it.

1. Introduction

Wire and arc additive manufacturing (WAAM) is a new manufacturing method that uses electric arc as a heat source and wire as raw materials to form parts in a layered manner [1]. Because aluminum alloy has the characteristics of light weight, high specific strength and good corrosion resistance, it has been widely used in automobiles, ships, aerospace, and other fields [2,3]. Al-Mg alloy has good welding performance, high strength and good thermal conductivity. In recent years, it has attracted more and more attention in the field of additive manufacturing [4]. Compared with the laser-based additive manufacturing process, WAAM has high deposition efficiency and low manufacturing cost [5]. Additive manufacturing is a powerful tool for the aerospace industry [6,7,8,9,10]. In WAAM, the high deposition rate is the main advantage of the process, and the cost of this advantage is a large amount of heat input [11]. Heat input affects the thermal gradient, nucleation rate, and grain growth rate during WAAM, and has a direct impact on the mechanical properties and surface quality of WAAM parts [12]. The heat transfer during WAAM is mainly heat radiation and heat convection in the molten pool, and the cooling process after WAAM is mainly heat conduction to the base material and air [13]. Controlling the transfer and emission of heat has a greater impact on the quality of parts, which illustrates the importance of process temperature monitoring and control.
A mass of heat input will produce extensive residual stress and deformation, and the residual stress and deformation will reduce the mechanical properties and shape accuracy of the parts. How to improve the surface quality of WAAM parts has become a research hotspot [14,15]. Wang observed that, in the WAAM Al-Cu-Sn alloy, as the heat input increases, the size and number of pores also increase, which not only leads to a decrease in its mechanical properties, but also a decrease in the surface quality of the parts [16]. Gudur studied the influence of the preheating and cooling of the substrate on the weld bead profile in WAAM [17]. In order to solve the problem caused by heat input, Honnige used roll pressure to control the residual stress of the manufactured part in the WAAM process, which not only refined the crystal structure, but also reduced the deformation of the part [18]. In addition, Cui proposed a new process planning method, while maintaining high manufacturing efficiency, by applying different heat input at different positions to control the transformation of the crystal structure, so as to minimize defects in the parts [19]. Zhou found through experiments that the surface quality can be improved by optimizing process parameters to reduce heat input [20]. However, the current research focuses on the methods of improving the surface quality of the parts manufactured by WAAM, and the systematic evaluation of the surface quality is less researched. There are large subjective errors in the evaluation of the surface quality, and the surface quality cannot be quantified. The characterization is not conducive to further improving the surface quality of the parts manufactured by WAAM [21].
In this paper, a single-layer single-channel aluminum alloy sample was fabricated by WAAM under different heat inputs by changing process parameters, and temperature changes during the forming process were monitored by thermocouple, and an evaluation method was established based on 3D scanning data. Using this quantitative evaluation method, it is found that heat input has a higher degree of influence on the surface quality of arc additive manufacturing samples, and higher or lower heat input has an adverse effect.

2. Materials and Methods
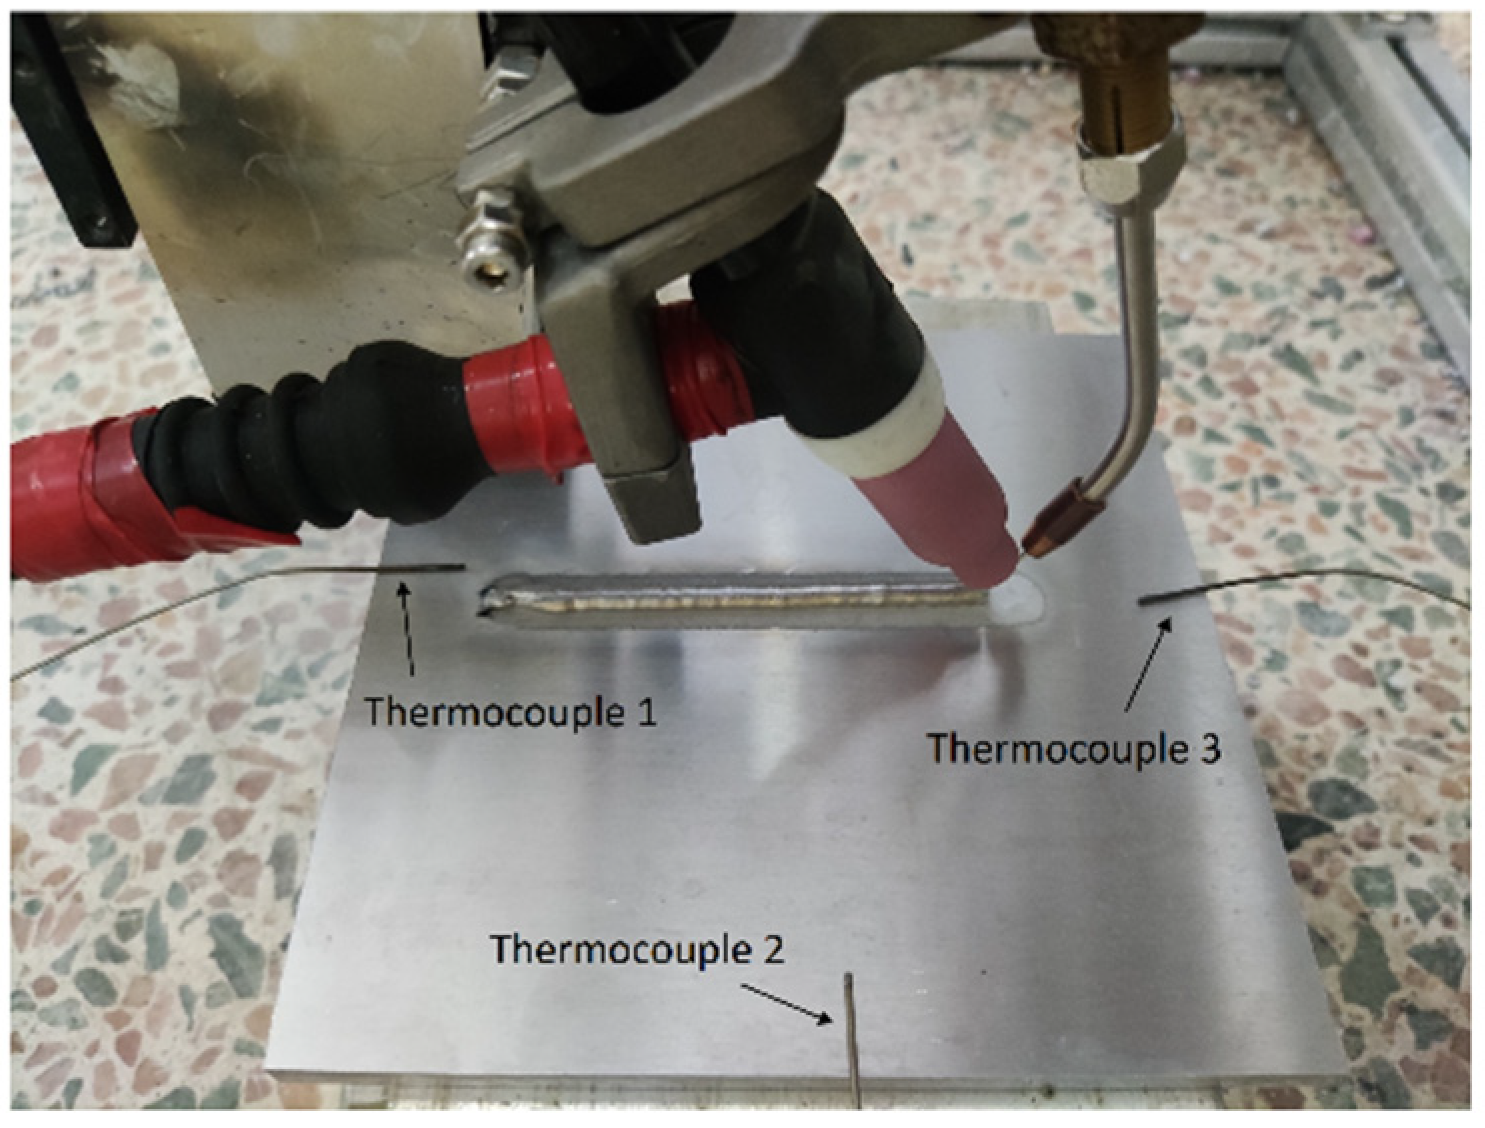
2.1. Experiment

The WAAM system used is composed of a WSE 200G welding machine, an automatic wire feeder, a gas conveying device, and a three-axis motion platform. The ER5356 aluminum alloy wire with a diameter of 2.0 mm is used as the material, and the 6061 aluminum alloy with a size of 150 × 150 × 10 mm is used as the substrate. The main chemical elements of the two materials are shown in Table 1. The protective gas in experiments is argon with a purity of 99.99%, and the gas flow rate is 5 L/min. The LEICA ABSOLUTE TRACKER AT960-MR reverse forming these WAAM specimens with an accuracy of 0.001 mm is used.
In the non-melting electrode arc additive, the heat input can be calculated by the following formula [22]:
H I = η U I v T S
In the formula, HI—heat input, η —arc thermal conductivity coefficient, for TIG technology, taken as 0.7, I ( A ) —the welding current, U ( V ) —the welding voltage, U = 10 + 0.04 I , v T S ( m / min ) —the torch traveling speed. It can be seen from Equation (1) that changing the current, voltage, and travel speed in the WAAM process can change the heat input of the specimen. The influence of heat input on the surface quality of arc additive manufacturing parts was analyzed by changing the current and travel speed. In order to eliminate the influence of unit consumables on the contour of parts, the ratio of wire feed speed to travel speed is kept at 14. Inputs, appropriate process parameters to conduct WAAM experiments to analyze its influence, were selected. The process parameters of each specimen during WAAM are shown in Table 2.
In order to analyze the effect of the difference in heat input on the surface quality of WAAM, thermocouples were placed at three positions to monitor the heat changes at different positions under different heat inputs, as depicted in Figure 1.

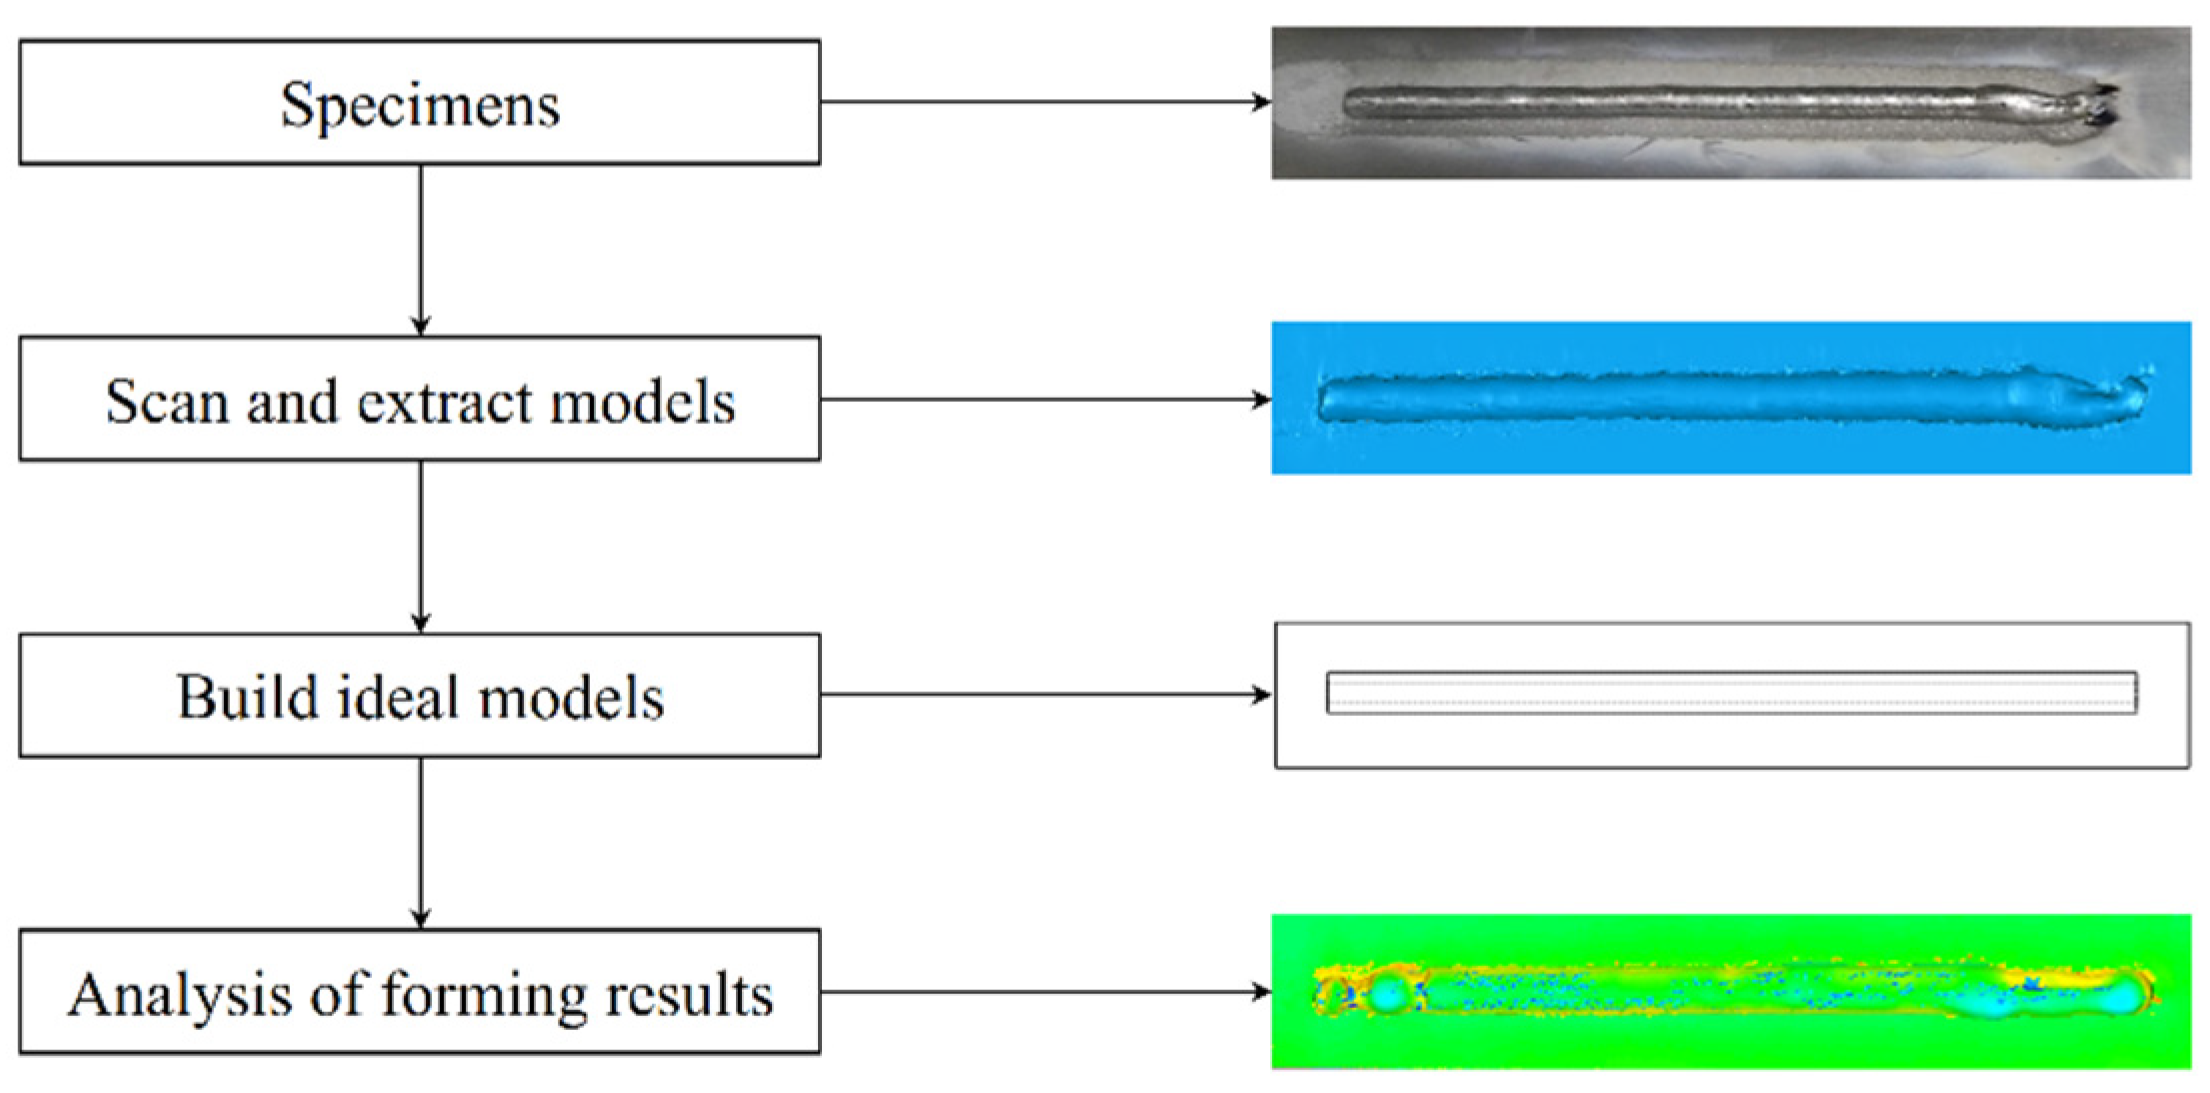
2.2. Surface Evaluation Method of WAAM

In order to quantitatively analyze the surface smoothness and surface profile shape characteristics of the specimen, the optimal function profile is selected according to the actual profile shapes and the principle of minimum error to establish an ideal model, and the actual specimen models are established with a three-dimensional scanning device. The standard deviation Ssd and the root mean square deviation Srms of each specimen to characterize the surface quality were calculated.
Standard deviation Ssd:
S s d = 1 M 1 1 N 1 i = 1 M j = 1 N ( X i j X ¯ ) 2
In the formula, M and N are the number of points in the grid in two directions, X is the actual value of each point, and X ¯ is the average value of each point.
The root mean square deviation Srms:
S r m s = 1 m n i = 1 m j = 1 n η i j 2
In the formula, m and n are the number of points in the calculated area, and η i j is the distance from the actual point to the reference point.
The standard deviation reflects the smoothness of the specimen. It focuses on the surface roughness of the specimen, but it cannot reflect the local shape of the specimen. The root mean square value reflects the deviation between the specimen and the ideal model, and can reflect the degree of deviation of the surface profile from the ideal surface, which can better characterize the surface quality of these specimens. The specific evaluation steps are shown in Figure 2.

3. Results and Discussion

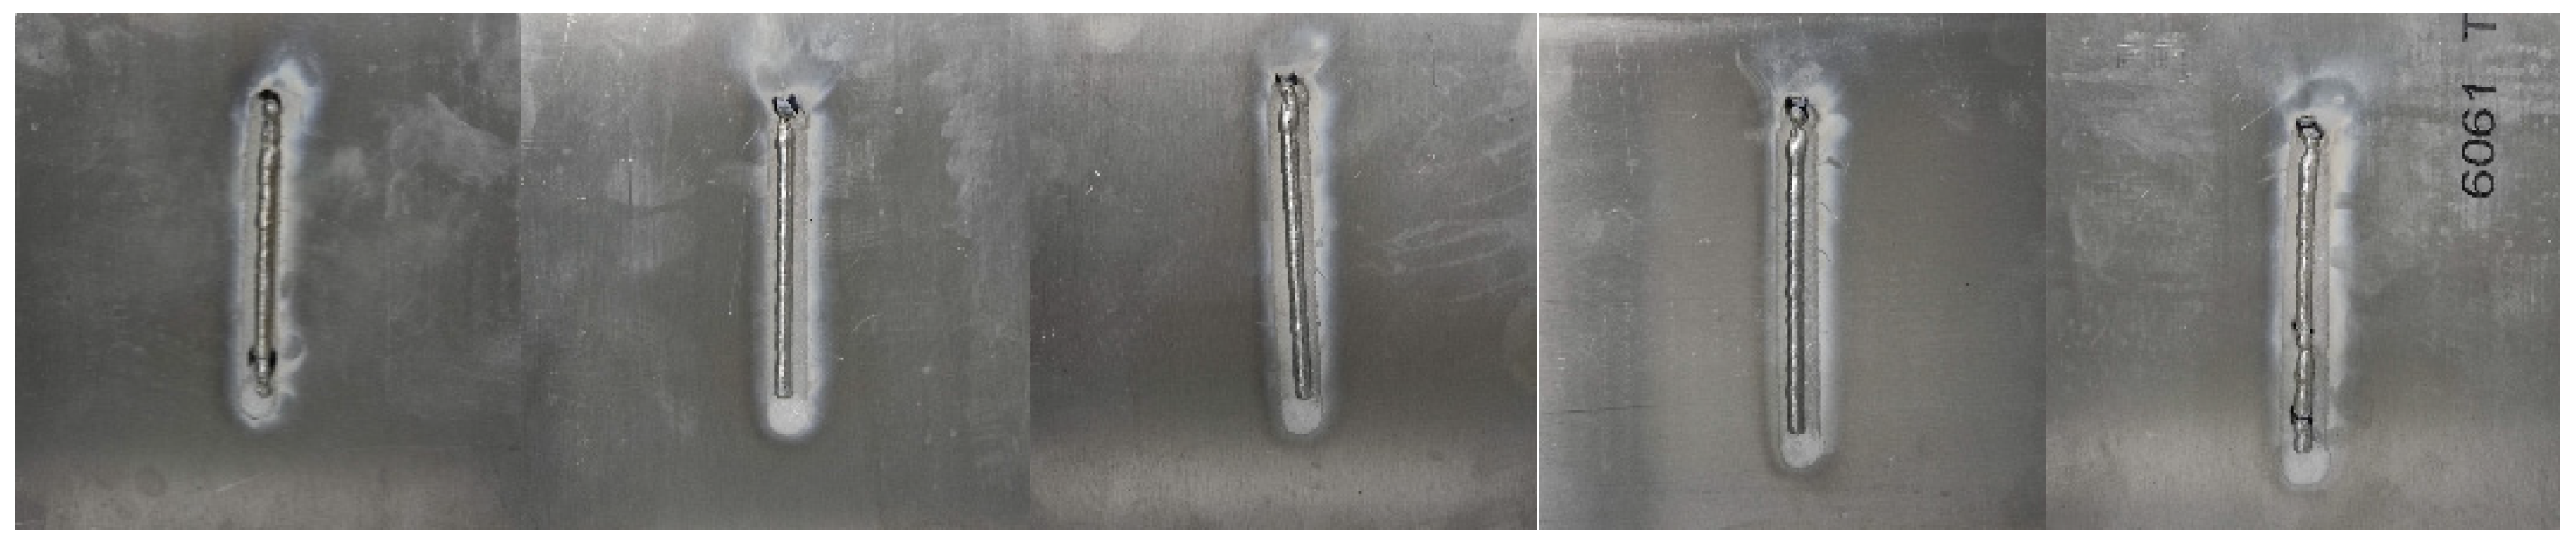
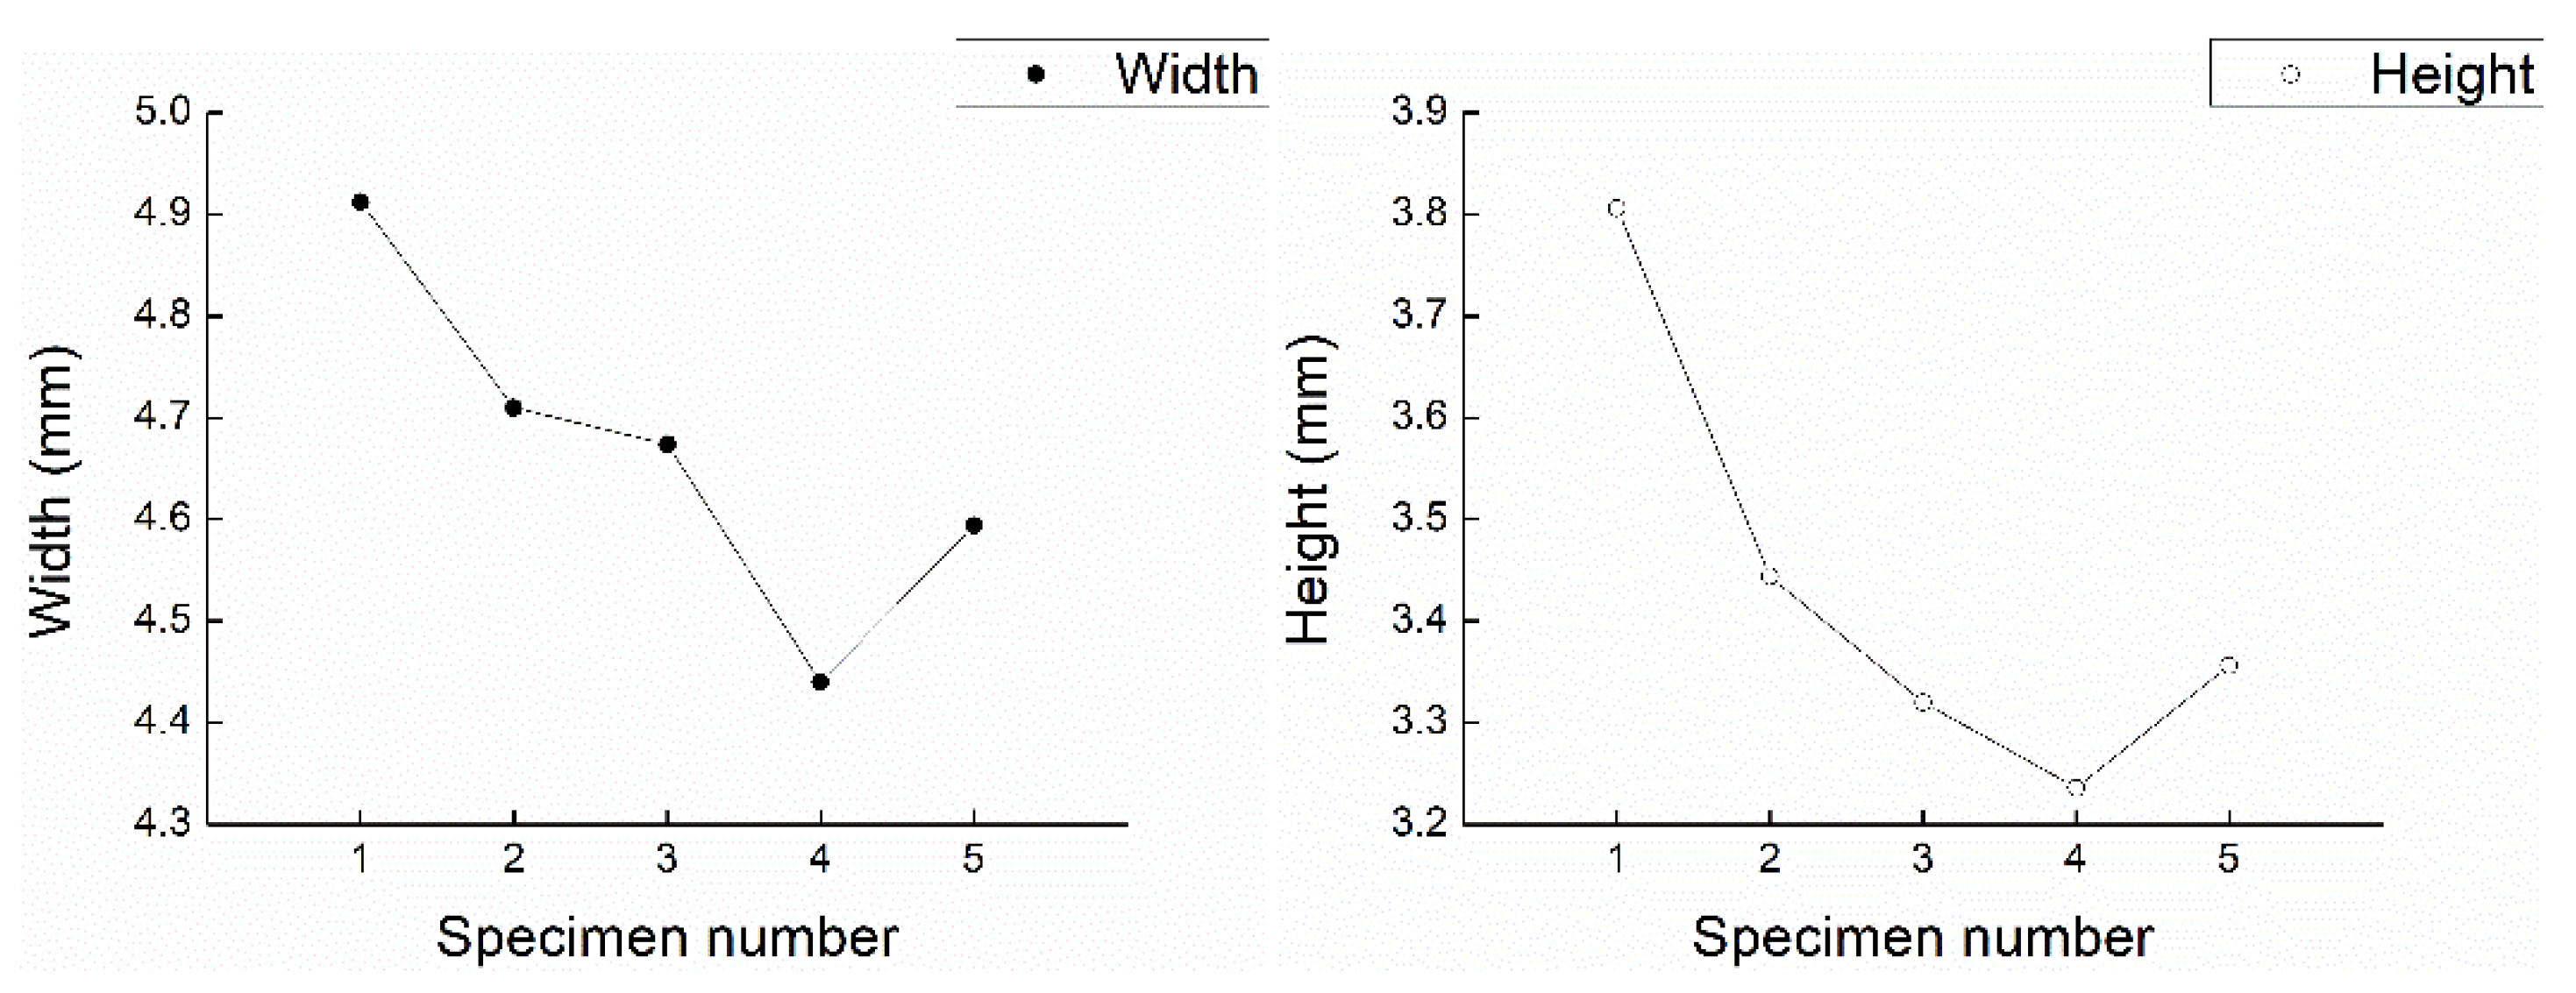
3.1. Different Thermal Input Printing Results

Figure 3 shows the specimens produced by WAAM under different heat input conditions. All five groups of specimens showed black matter. This is because, during the additive process, the airflow did not protect the molten pool sufficiently, causing external impurities to vaporize in the arc and condense into black soot. With proper heat input, the surface quality of these specimens is best, but these specimens formed under higher heat input and lower heat input appear to have defects of varying degrees. For example, when the heat input is 12,250 J·mm−1, the beginning of the specimen has a concave tendency. After a period of time, the surface gradually becomes smooth. When the heat input is 7248 J·mm−1, there are signs of discontinuity at the beginning of the specimen. Continue to reduce the heat input, and specimen 5 shows more signs of discontinuity, and its surface quality gradually decreases.
The average width and average height of the manufactured specimen can also reflect the surface quality of it to a certain extent. Figure 4 shows the average width and average height of the WAAM specimen under different heat input conditions. Higher heat input represents sufficient heat, which cannot only create a better-shaped molten pool on the substrate during wire and additive manufacturing, but also has a better stabilization effect on the molten pool. However, the lower heat input cannot melt the wire in time, and the degree of change in the shape of the molten pool is also relatively severe. Therefore, the average width and average height of specimen 5 are slightly improved compared to specimen 4. In addition, it can be clearly seen that, as the heat input decreases, the average width and average height are gradually decreased.

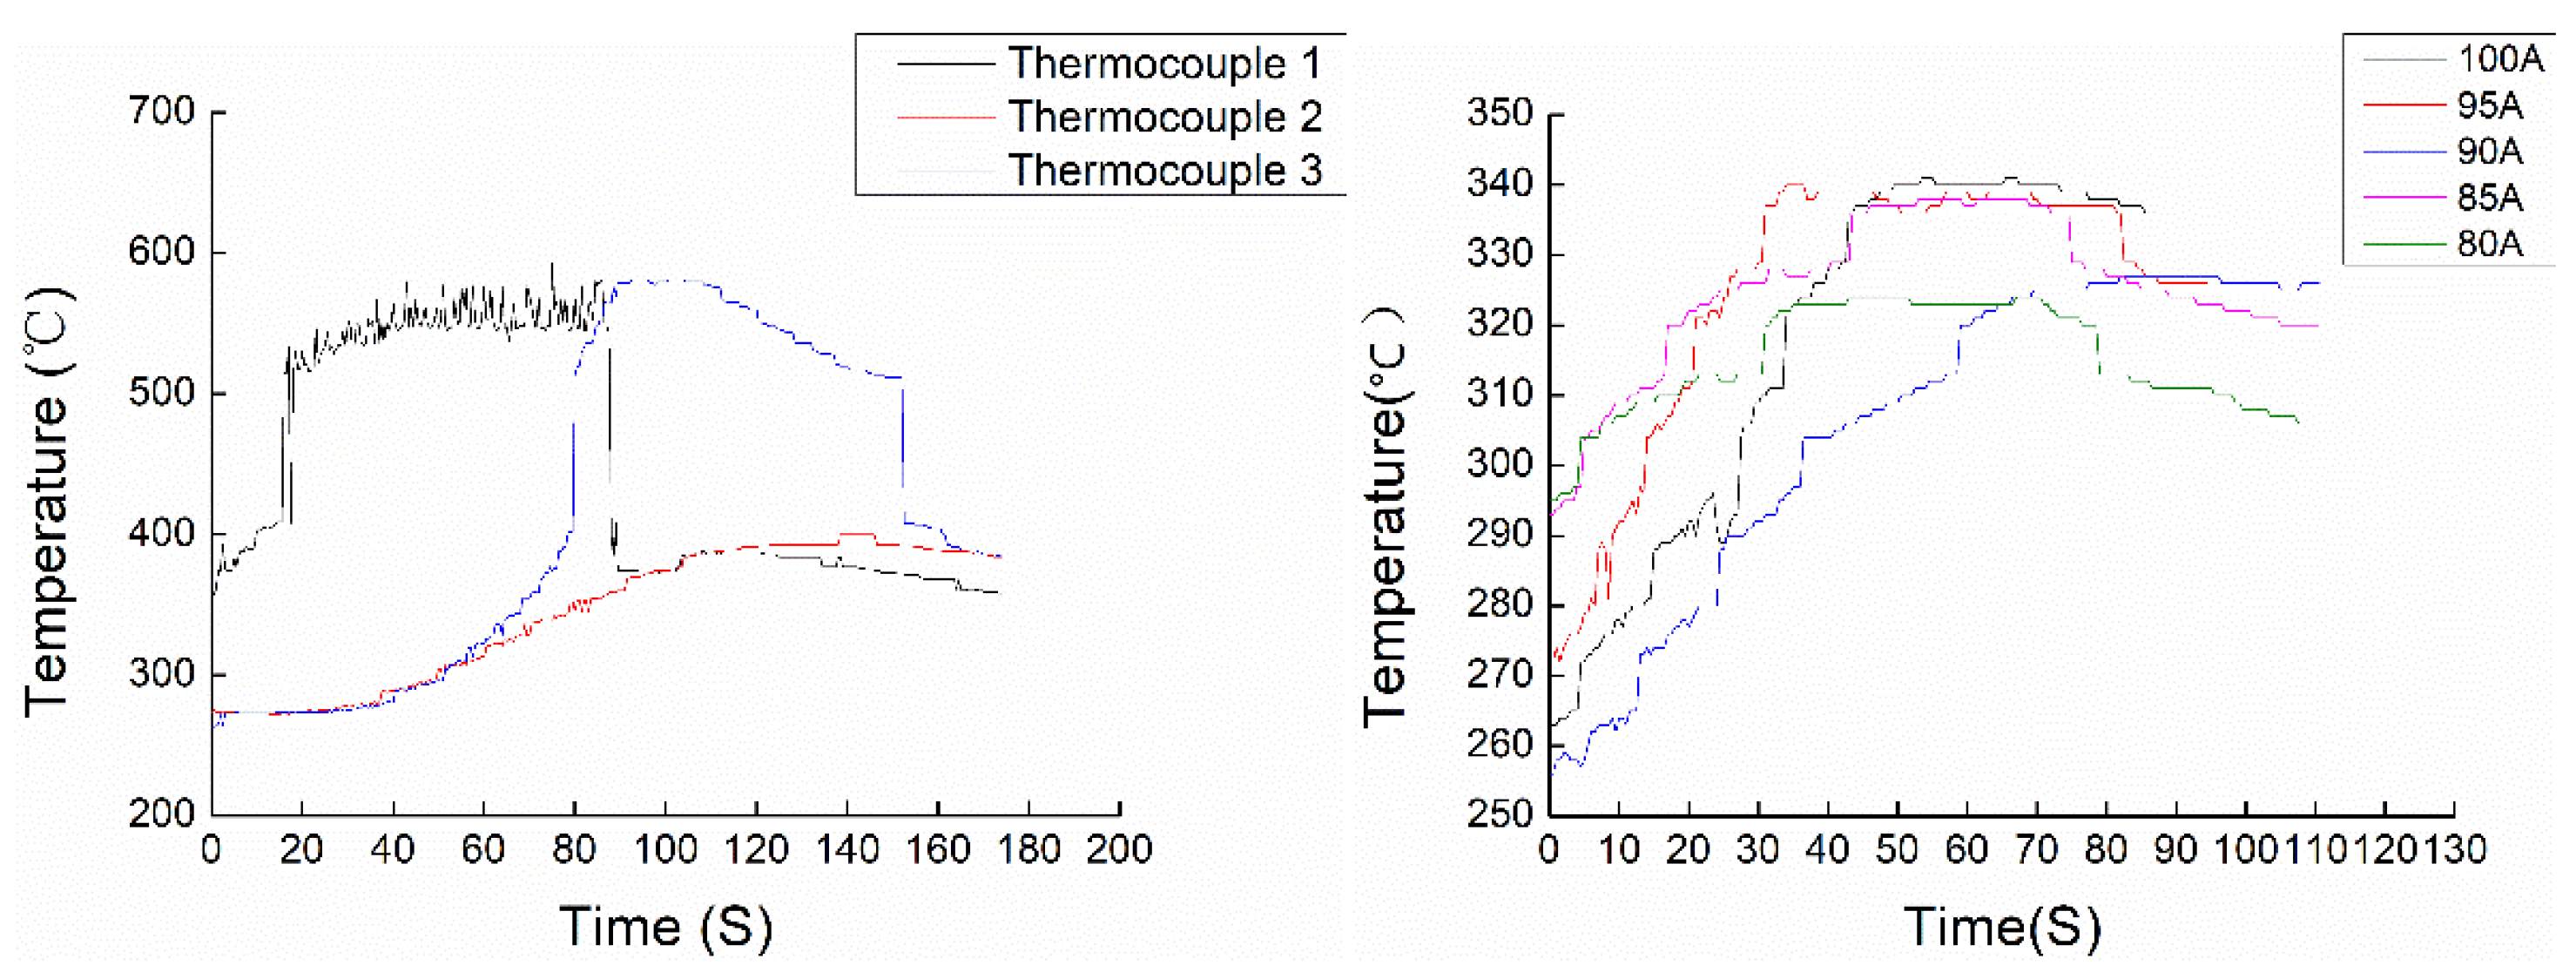
3.2. Results of Measured Temperature

In the WAAM process, monitoring and controlling its heat is of great significance to improve the surface quality. Figure 5 shows the temperature change trend at different positions during the WAAM process. Because thermocouple 1 is close to the arc starting position, heat transfer is faster, so the initial temperature of position 1 is the highest, and the initial temperature of position 2 and position 3 remain at the same level. When the arc approaches the thermocouple, the thermocouple monitors the high temperature of the arc, so it will experience a sharp rise in temperature. As the arc moves on the substrate from thermocouple 1 to thermocouple 3, the temperature at thermocouple 3 rises sharply. Both thermocouple 1 and thermocouple 3 experience a process of sharp rise and fall in temperature. The change trend curve is roughly the same, but there are differences in time. The temperature profiles of thermocouple 2 are relatively flat, and the temperature of the three eventually stays at the same level. The temperature changes detected by thermocouple 1 and thermocouple 3 are more drastic because there will be a close moment between the position of the arc and the two monitoring positions, respectively, and aluminum alloy has good thermal conductivity, resulting in a sharp rise in the temperature at position 1 and position 3. The distance between position 2 and the arc position remains in a stable range, so the temperature at position 2 is a process of uniform rate rise.
Figure 5 also shows the temperature change trend monitored by thermocouple 2 under different heat inputs. With the decrease of current intensity, the intensity of temperature change gradually decreases. Because the monitoring point is in the middle of the specimen and not close to the arc itself, the temperature changes relatively smoothly. As shown in Figure 5, the temperature of the monitoring point has a more obvious difference. It can be clearly seen that the temperature is proportional to the size of the current. That is to say, the change of the process parameters causes the differences in the heat input of each specimen. When different samples were manufactured by an additive, the length of the samples was the same, and the higher the walking speed, the earlier the maximum temperature monitored by thermocouple 2 should appear. However, a slight difference appeared in Figure 5, indicating that the influence of current and walking speed on heat input had a joint effect.

3.3. Established an Ideal Model

Obtaining the cross-sectional profile shape of the specimen cannot only better adjust the process parameters to obtain the ideal cross-sectional profile, but also establish an ideal model for comparison with the actual formed specimen to quantitatively describe the surface quality of the WAAM specimen surface to analyze the defects in actual model.
At present, when establishing the cross-sectional profile model of a single-pass single-layer specimen for WAAM, there are the following three commonly used function profile models [23,24,25]: parabola, half-period cosine curve, and full-period cosine curve, which correspond to model equation prototype and model formula, are shown in Table 3. Among them, a and b are formula coefficients, W are width, H and are height.
As shown in Table 4, after comparing and fitting the above three function contour curves with the actual contour curve, it is found that none of the three function contour curves reach the ideal degree. Therefore, an elliptic contour function curve is proposed. As shown in Table 4, the relative error of the area between the elliptic contour curve and the extracted model is about 0.99, where S is the integral value, δ is the relative error value, and ST is the area. Compared with other function contour curves, the ellipse contour curve is more consistent with the actual contour curve. Therefore, the elliptic contour curve was used to establish the ideal model.

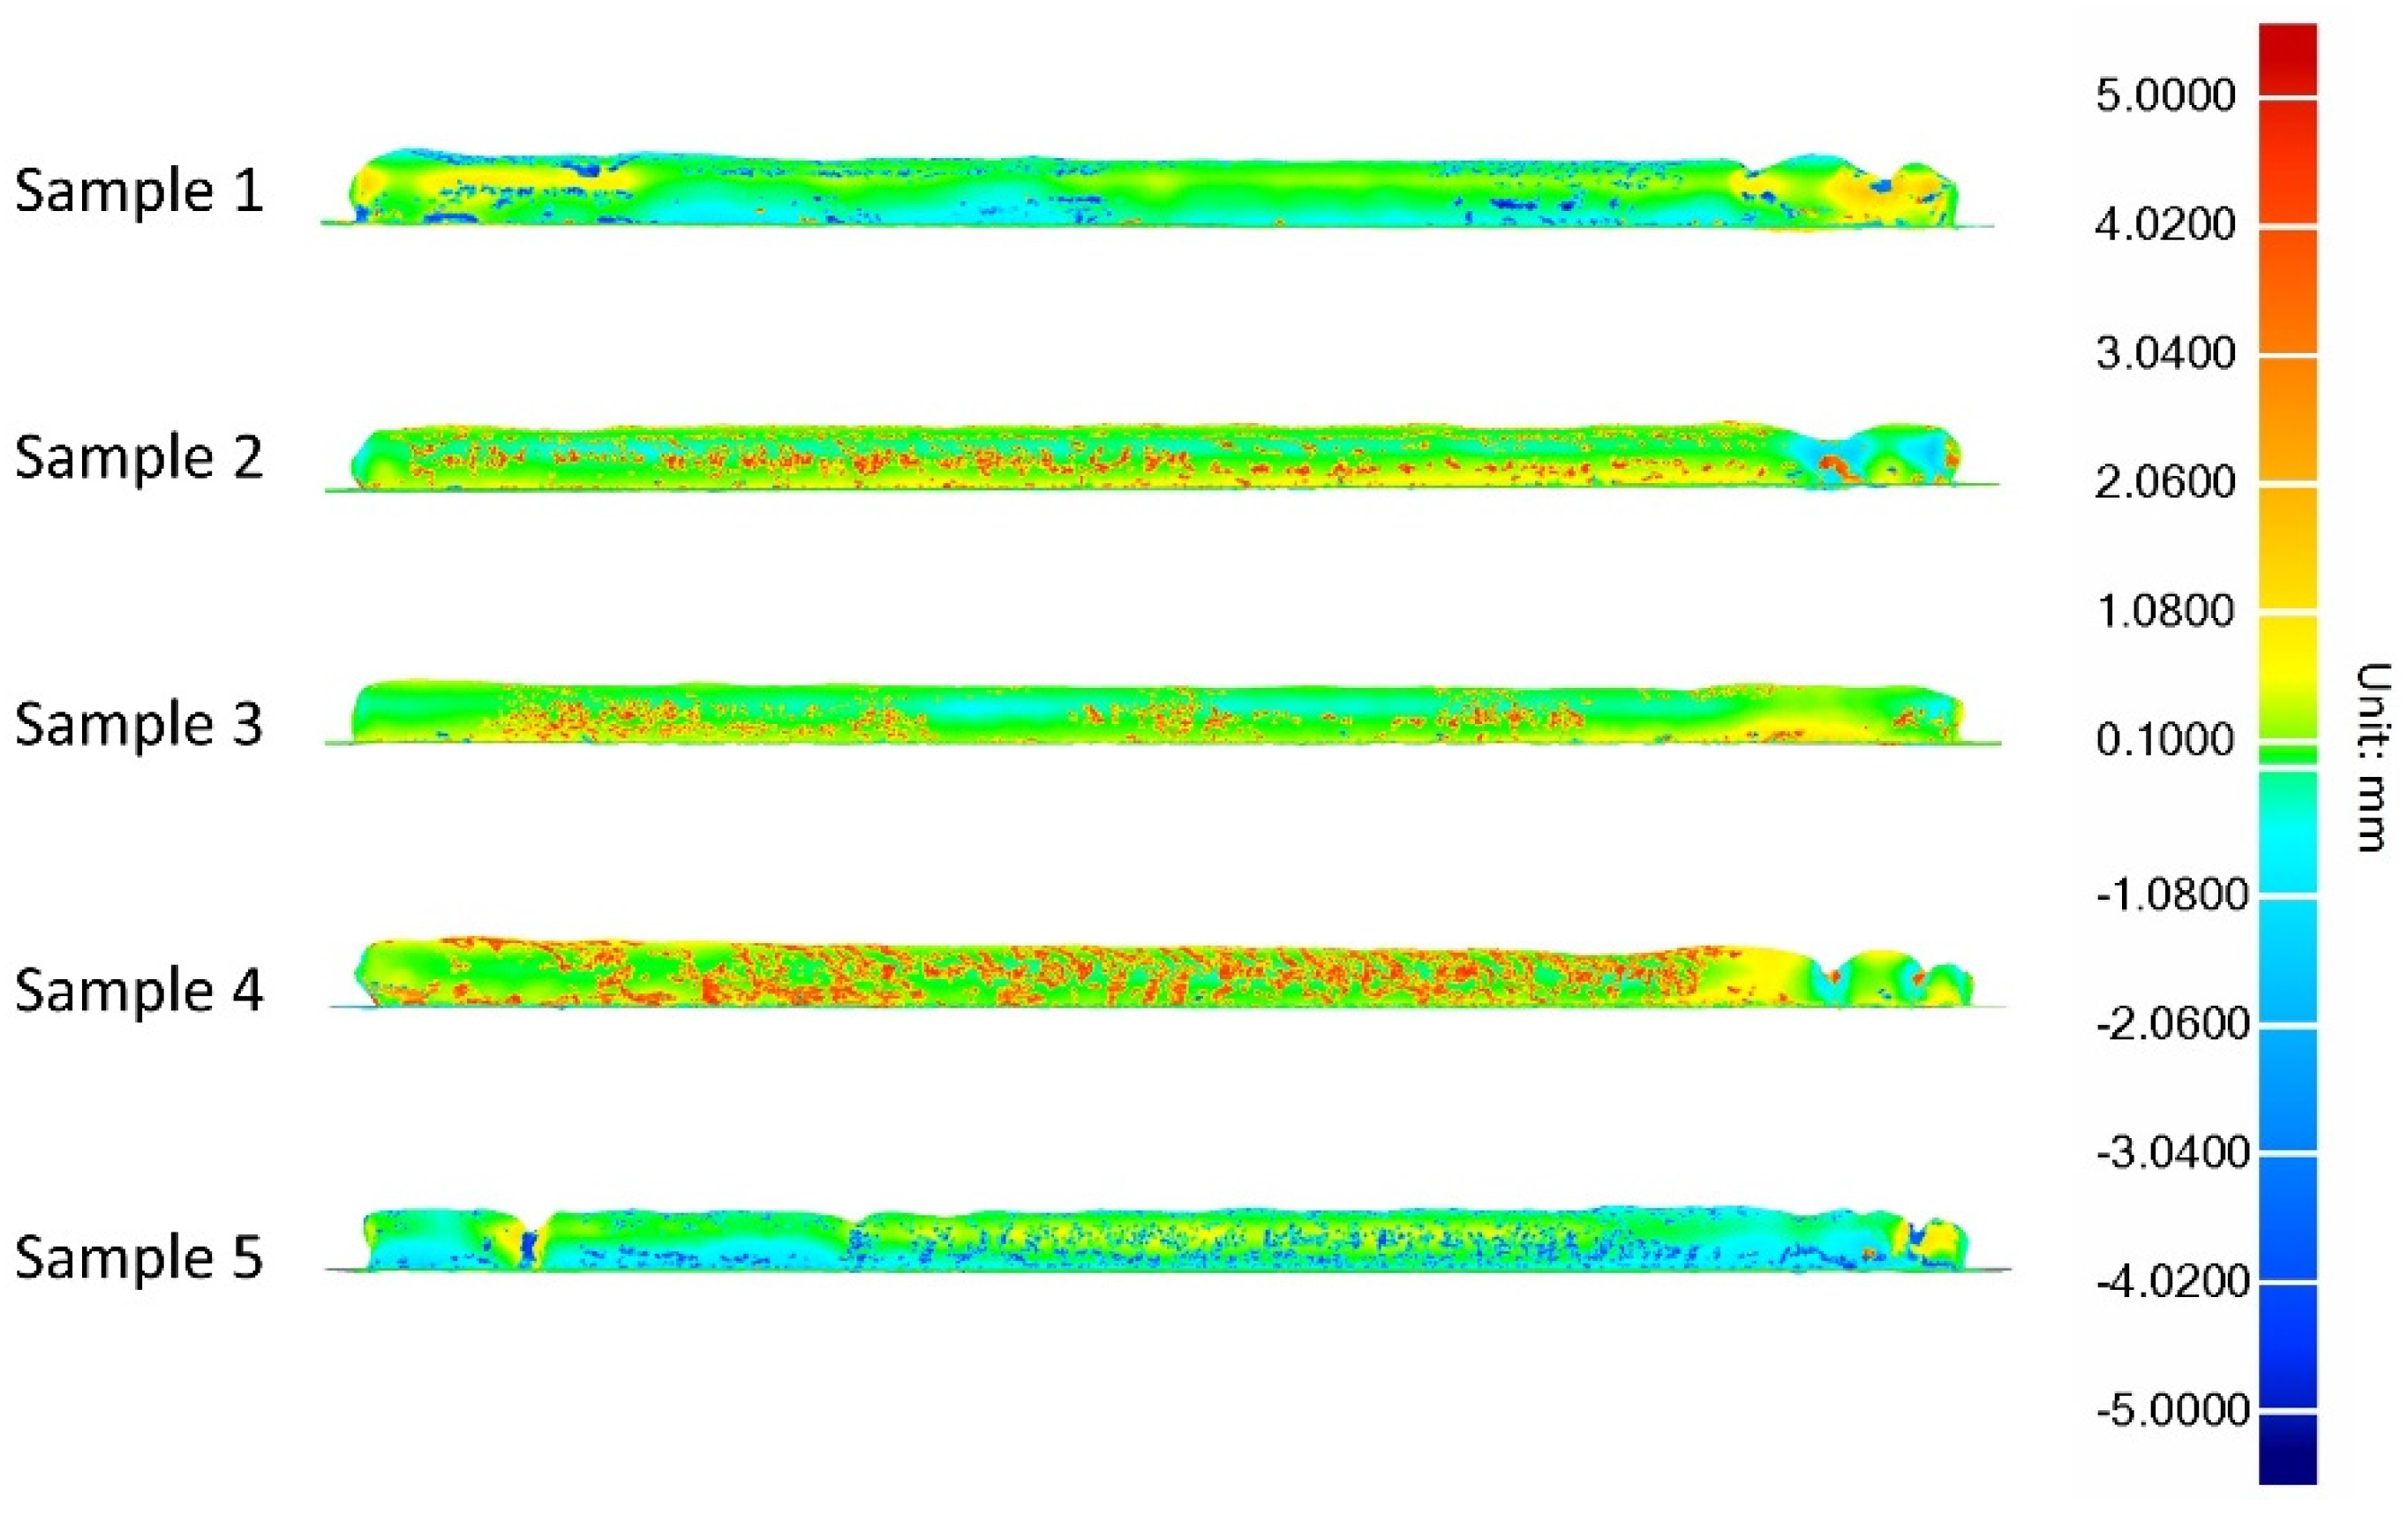
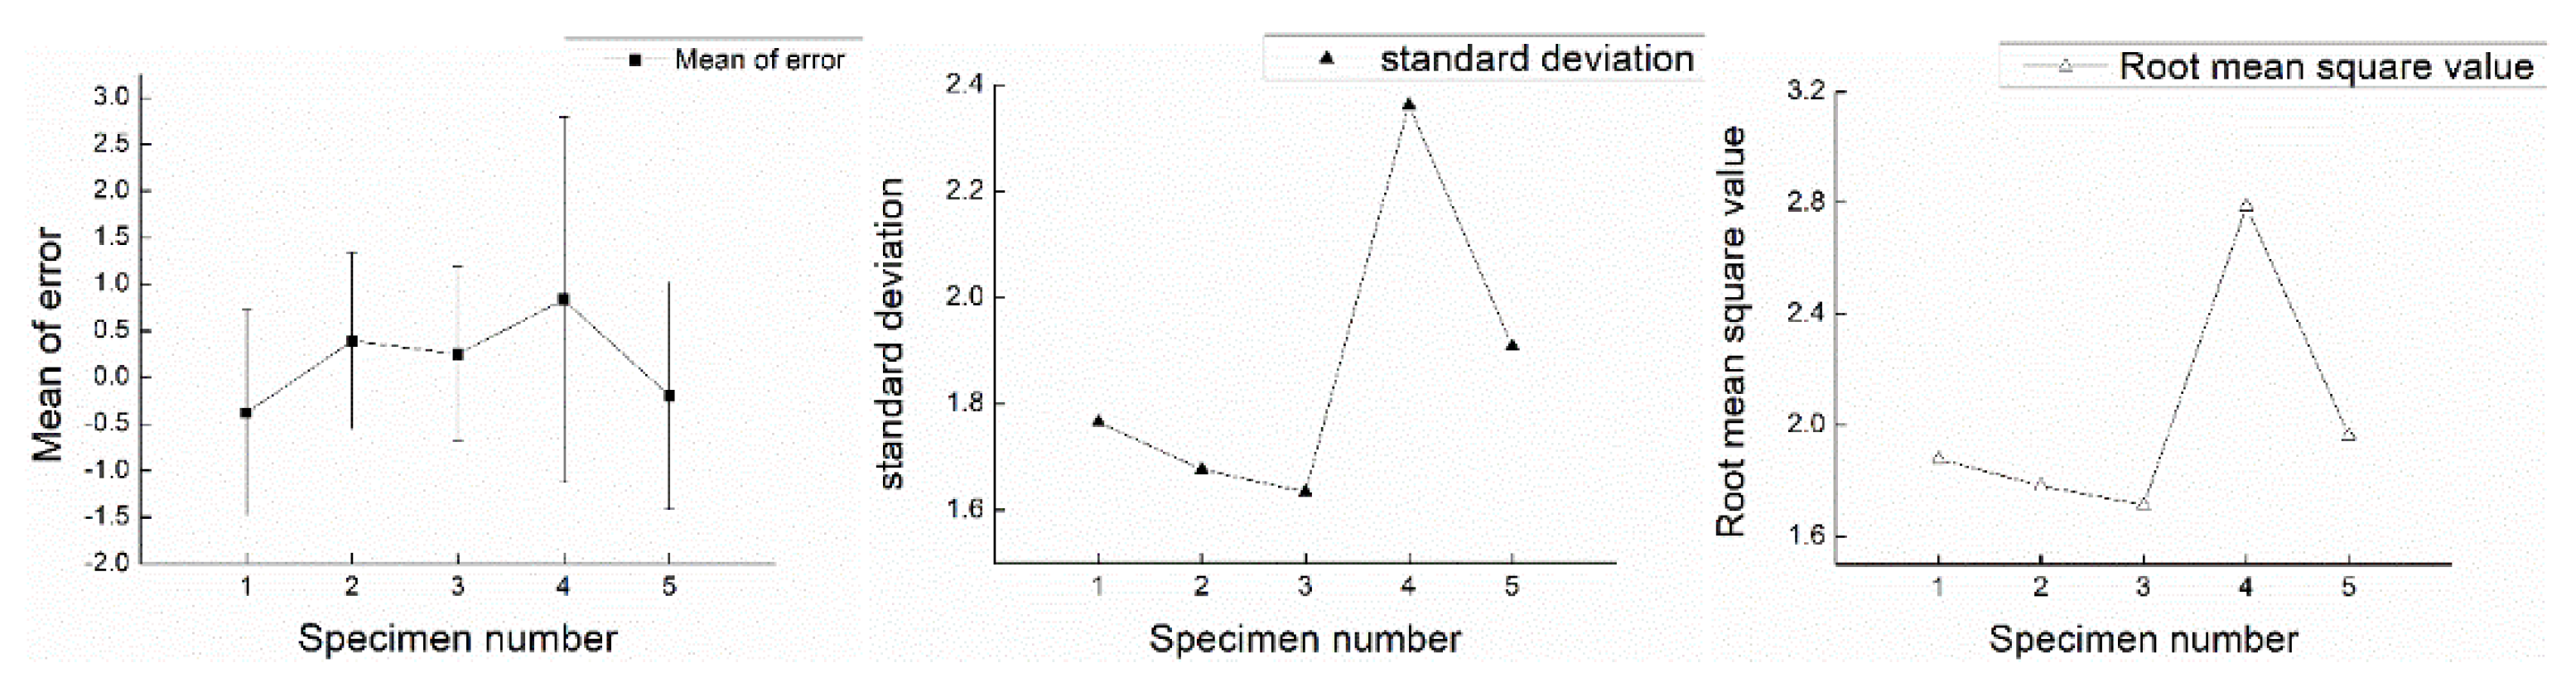
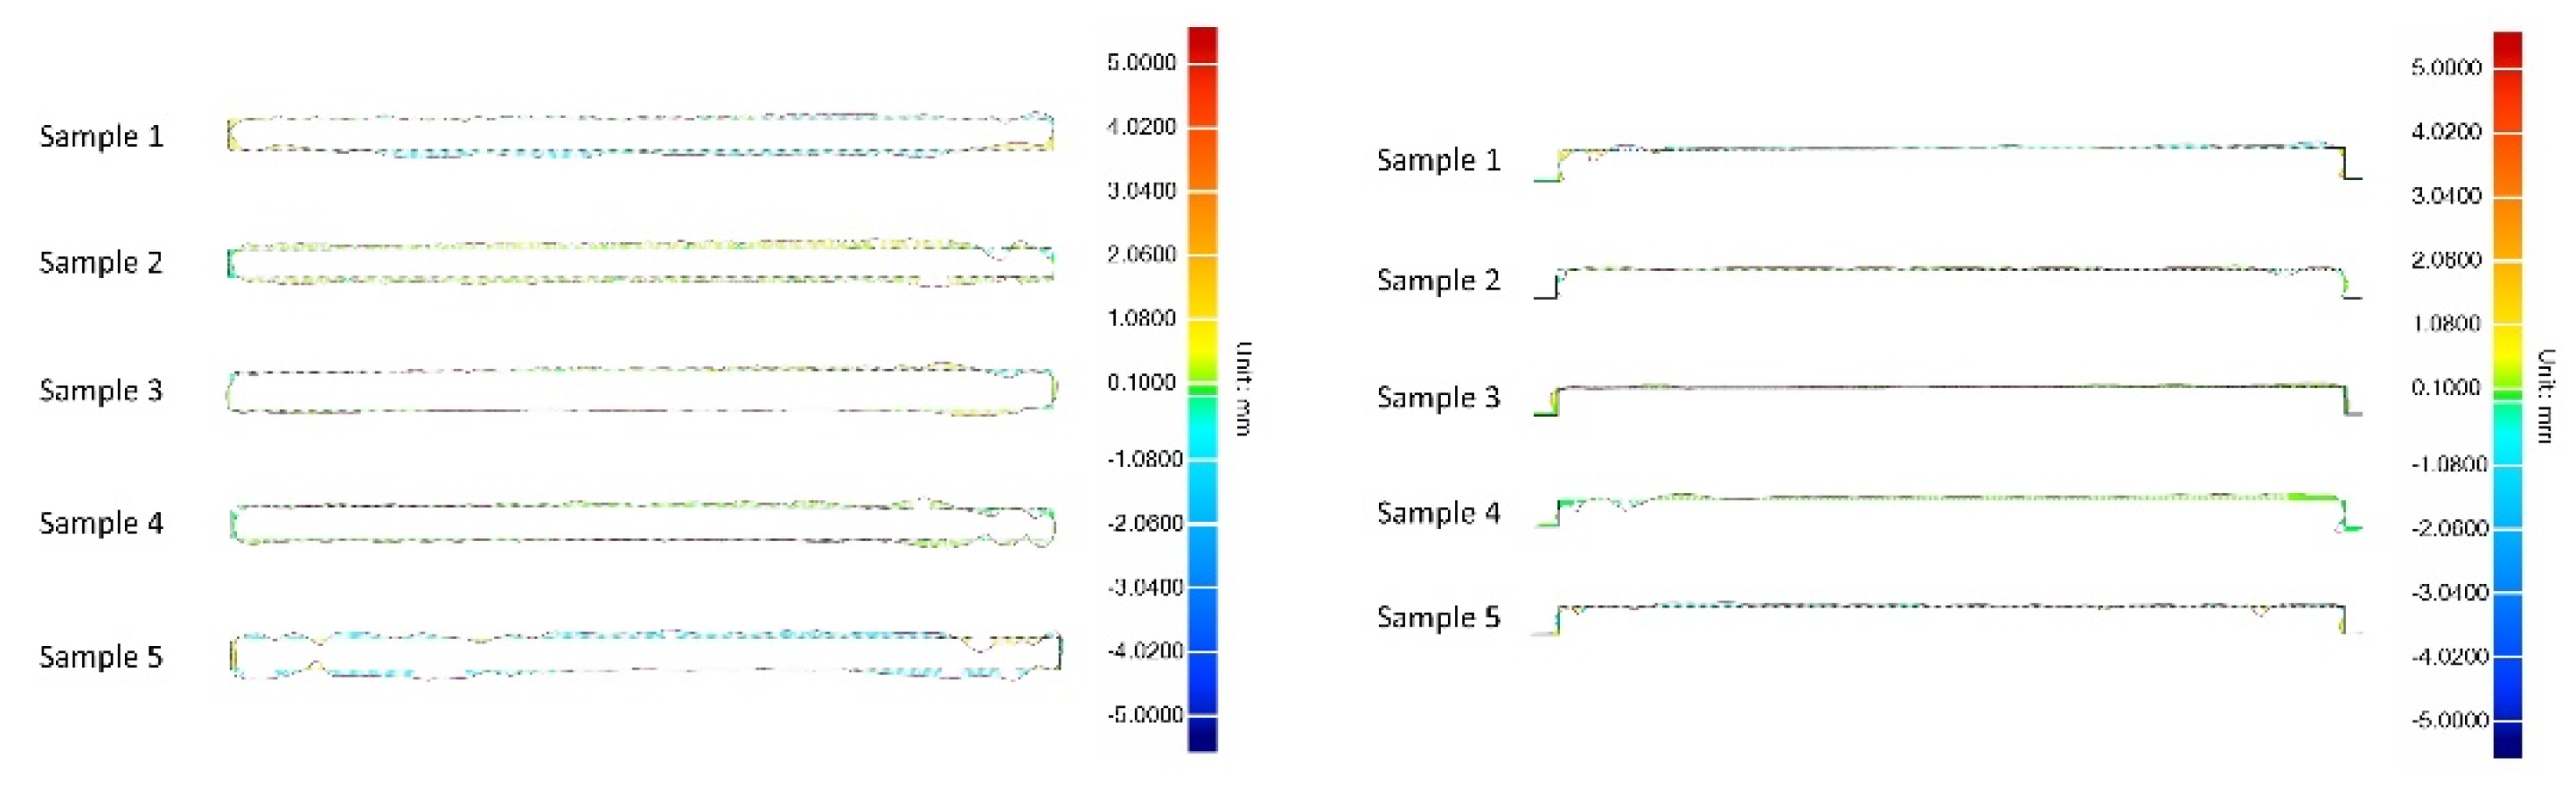
3.4. Surface Quality Evaluation

The actual molded specimen was used as the reference model, and the ideal profile model was used as the test model. Figure 6 shows the difference between the actual molded specimen surface and the ideal model surface under different heat input conditions. On the whole, the surface of each specimen has good consistency with the ideal model. However, due to the fact that there are many variables in WAAM, such as heat input, there was a certain difference between the specimen and the ideal model. For example, when the heat input is 11,250 J·mm−1 and 6160 J·mm−1, the surface of the specimen is quite different from the ideal model. When the heat input is moderate, the surface quality of the specimen has been improved to a large extent.
The average value of the error between the ideal model of the specimen and the actual formed surface under different heat input conditions is calculated, as shown in Figure 7. The average error of the overall profile tends to be negative, indicating that the actually formed profile is slightly larger than that of the ideal model. However, when the heat input is moderate, the average value of the error is positive, which reflects that the profile of the actual formed sample is smaller than that of the ideal model. The difference in heat input affects the contour shape of the actual formed specimen, which proves that there is a significant correlation between the surface quality of the specimen and the heat input.
The error average reflects the overall error of the specimen surface, while the standard deviation and root mean square error can reflect the local conditions of the specimen in more detail. As shown in Figure 7, there are significant differences in the standard deviation and root mean square deviation of the specimens under different heat input conditions. In the specimens, when the heat input is high and low, the surface quality of the specimens is lower than that of the specimens when the heat input is moderate, so the standard deviation and the root mean square value have the same changing trend, and both decrease first and then increase. It can be seen from Figure 7 that specimen 3 has the smallest root mean square value and standard deviation value, while the standard deviation and root mean square value of specimen 4 have changed to a greater extent.
Figure 8 is comparison diagrams of the transverse and longitudinal cross-sections of each specimen and the ideal cross-section. Where the difference is large, the line representing the ideal cross-section is broken.
Whether in the cross section or the longitudinal section, the volatility of the profile curve is higher in specimen 1 and specimen 5, and lower in the specimens with moderate heat input. In specimen 4, although the error between its cross section and the ideal cross-section is smaller than that of specimen 5, the profile curve of its longitudinal section gradually deviates from the horizontal direction from the beginning to the end, and has experienced a gradual increase. This not only reflects the high degree of influence of height on the standard deviation and root mean square value, but also provides a good explanation for the abnormal changes in the standard deviation and root mean square value of specimen 4 in Figure 7. In specimen 2 and specimen 5, there is little difference in longitudinal cross-section. Although the overall deviation of specimen 2 from the ideal model cross-section is relatively high, the fluctuation of its profile is much smaller. Thus, both the standard deviation and the root mean square value of specimen 2 are smaller than those of specimen 5.

4. Conclusions

In the current work, the effect of heat input on surface quality of arc additive manufacturing is studied using real-time heat monitoring and 3D scanning data. The key results are drawn as follows:
(1) In the WAAM process, for different positions on the substrate, the temperature change trend is different, so that the molten pool has different stabilization effects.
(2) Within a certain range of heat input, with the decrease of heat input, the average width and average height of these specimens show a downward trend.
(3) In the case of high or low heat input, the average error of the specimen is negative, and the standard deviation and root mean square value reached 1.908 and 1.963, respectively. However, the average value of the error of the specimen with moderate heat input is positive, and the standard deviation and root mean square value are only 1.634 and 1.713, respectively.
(4) The heat input has a relatively high degree of influence on the surface quality of the wire and arc additive manufacturing specimens, and higher or lower heat input is unfavorable to it.
Although single-layer, single-pass specimens are the basis of arc additive manufacturing, the industry needs metal parts that are formed once. In the following work, we will combine real-time temperature monitoring and 3D images to study the influence of heat input on the interlayer bonding and surface quality of arc additive manufacturing parts.

Author Contributions

Conceptualization, W.N.; Data curation, J.Z.; Investigation, X.L.; Meth-odology, X.L.; Software, J.Z.; Supervision, W.N.; Writing—original draft, J.Z.; Writing—review & editing, J.Z. All authors have read and agreed to the published version of the manuscript.

Funding

This research received no external funding.

Institutional Review Board Statement

Not applicable.

Informed Consent Statement

Not applicable.

Data Availability Statement

Not applicable.

Conflicts of Interest

The authors declare no conflict of interest.

References

  1. Williams, S.W.; Martina, F.; Addison, A.C. Wire plus arc additive manufacturing. J. Mater. Sci. Technol. 2016, 32, 641–647. [Google Scholar] [CrossRef] [Green Version]
  2. Chaturvedi, M.; Scutelnicu, E.; Rusu, C.; Mistodie, L.; Mihailescu, D.; Subbiah, A. Wire Arc Additive Manufacturing: Review on Recent Findings and Challenges in Industrial Applications and Materials Characterization. Metals 2021, 11, 939. [Google Scholar] [CrossRef]
  3. Chintala, A.; Kumar, M.T.; Sathishkumar, M.; Arivazhagan, N.; Manikandan, M. Technology Development for Producing Inconel 625 in Aerospace Application Using Wire Arc Additive Manufacturing Process. J. Mater. Eng. Perform. 2021, 30, 1–9. [Google Scholar] [CrossRef]
  4. Aldalur, E.; Suárez, A.; Veiga, F. Metal transfer modes for Wire Arc Additive Manufacturing Al-Mg alloys: Influence of heat input in microstructure and porosity. J. Mater. Process. Technol. 2021, 297, 117271. [Google Scholar] [CrossRef]
  5. Rosli, N.A.; Alkahari, M.R.; bin Abdollah, M.F.; Maidin, S.; Ramli, F.R.; Herawan, S.G. Review on effect of heat input for wire arc additive manufacturing process. J. Mater. Res. Technol. 2021, 11, 2127–2145. [Google Scholar] [CrossRef]
  6. Zhou, X.; Tian, Q.; Du, Y.; Zhang, Y.; Bai, X.; Zhang, Y.; Zhang, H.; Zhang, C.; Yuan, Y. Investigation of the effect of torch tilt and external magnetic field on arc during overlapping deposition of wire arc additive manufacturing. Rapid Prototyp. J. 2021, 27, 24–36. [Google Scholar] [CrossRef]
  7. Fang, X.; Ren, C.; Zhang, L.; Wang, C.; Huang, K.; Lu, B. A model of bead size based on the dynamic response of CMT-based wire and arc additive manufacturing process parameters. Rapid Prototyp. J. 2021, 27, 741–753. [Google Scholar] [CrossRef]
  8. Tang, S.; Wang, G.; Song, H.; Li, R.; Zhang, H. A novel method of bead modeling and control for wire and arc additive manufacturing. Rapid Prototyp. J. 2021, 27, 311–320. [Google Scholar] [CrossRef]
  9. Kulkarni, J.D.; Goka, S.B.; Parchuri, P.K. Microstructure evolution along build direction for thin-wall components fabricated with wire-direct energy deposition. Rapid Prototyp. J. 2021, 27, 1289–1301. [Google Scholar] [CrossRef]
  10. Taborda, L.L.L.; Maury, H. Design for additive manufacturing: A comprehensive review of the tendencies and limitations of methodologies. Rapid Prototyp. J. 2021, 27, 918–966. [Google Scholar] [CrossRef]
  11. Chen, X.; Kong, F.; Fu, Y.; Zhao, X.; Li, R.; Wang, G.; Zhang, H. A review on wire-arc additive manufacturing: Typical defects, detection approaches, and multisensor data fusion-based model. Int. J. Adv. Manuf. Technol. 2021, 117, 707–727. [Google Scholar] [CrossRef]
  12. Li, F.; Chen, S.; Shi, J.; Zhao, Y.; Tian, H. Thermoelectric Cooling-Aided Bead Geometry Regulation in Wire and Arc-Based Additive Manufacturing of Thin-Walled Structures. Appl. Sci. 2018, 8, 207. [Google Scholar] [CrossRef] [Green Version]
  13. Wu, B.; Pan, Z.; Ding, D. Effects of heat accumulation on microstructure and mechanical properties of Ti6Al4V alloy deposited by wire arc additive manufacturing. Addit. Manuf. 2018, 23, 151–160. [Google Scholar] [CrossRef]
  14. Cunningham, C.R.; Flynn, J.M.; Shokrani, A. Invited review article: Strategies and processes for high quality wire arc additive manufacturing. Addit. Manuf. 2018, 22, 672–686. [Google Scholar] [CrossRef]
  15. Li, J.L.Z.; Alkahari, M.R.; Rosli, N.A.B.; Hasan, R.; Sudin, M.N.; bin Ramli, F.R. Review of Wire Arc Additive Manufacturing for 3D Metal Printing. Int. J. Autom. Technol. 2019, 13, 346–353. [Google Scholar] [CrossRef]
  16. Wang, S.; Gu, H.; Wang, W.; Li, C.; Ren, L.; Wang, Z.; Zhai, Y.; Ma, P. The Influence of Heat Input on the Microstructure and Properties of Wire-Arc-Additive-Manufactured Al-Cu-Sn Alloy Deposits. Metals 2020, 10, 79. [Google Scholar] [CrossRef] [Green Version]
  17. Gudur, S.; Nagallapati, V.; Pawar, S.; Muvvala, G.; Simhambhatla, S. A study on the effect of substrate heating and cooling on bead geometry in wire arc additive manufacturing and its correlation with cooling rate. Mater. Today Proc. 2021, 41, 431–436. [Google Scholar] [CrossRef]
  18. Honnige, J.R.; Colegrove, P.A.; Ahmad, B. Residual stress and texture control in Ti-6Al-4V wire + arc additively manufactured intersections by stress relief and rolling. Mater. Des. 2018, 150, 193–205. [Google Scholar] [CrossRef] [Green Version]
  19. Cui, J.; Yuan, L.; Commins, P.; He, F.; Wang, J.; Pan, Z. WAAM process for metal block structure parts based on mixed heat input. Int. J. Adv. Manuf. Technol. 2021, 113, 503–521. [Google Scholar] [CrossRef]
  20. Zhou, Y.; Lin, X.; Kang, N.; Huang, W.; Wang, J.; Wang, Z. Influence of travel speed on microstructure and mechanical properties of wire + arc additively manufactured 2219 aluminum alloy. J. Mater. Sci. Technol. 2020, 37, 143–153. [Google Scholar] [CrossRef]
  21. Dongqing, Y.; Xiaowei, W.; Yikai, W. Surface quality evaluation of multi-bead overlapping for high nitrogen steel by CMT based additive manufacturing. Hanjie Xuebao 2020, 41, 73–76, 83. [Google Scholar]
  22. Pépe, N.; Egerland, S.; Colegrove, P.A. Measuring the process efficiency of controlled gas metal arc welding processes. Sci. Technol. Weld. Joining 2011, 16, 412–417. [Google Scholar] [CrossRef] [Green Version]
  23. Suryakumar, S.; Karunakaranb, K.P.; Bernard, A. Weld bead modeling and process optimization in hybrid layered manufacturing. Comput. Aided. Design. 2011, 43, 331–344. [Google Scholar] [CrossRef]
  24. Donghong, D.; Zengxi, P.; Dominic, C. A multi-bead overlapping model for robotic wire and arc additive manufacturing (WAAM). Robot Cim.-Int. Manuf. 2015, 31, 101–110. [Google Scholar]
  25. Jintian, Z.; Xinghua, W.; Tao, W. Study on the processing characteristics of single-bead and single-layer in the WAAM. Mater. Rep. 2020, 34, 24132–24137. [Google Scholar]
Figure 1. Placement of thermocouples.
Applsci 11 10201 g001
Figure 2. Surface evaluation procedure of the specimen manufactured by WAAM.
Applsci 11 10201 g002
Figure 3. Specimens of WAAM with different heat input.
Applsci 11 10201 g003
Figure 4. Average width and height of specimens by wire and arc additive manufacturing with different heat input.
Applsci 11 10201 g004
Figure 5. The temperature profiles of different locations and the middle part of the specimen.
Applsci 11 10201 g005
Figure 6. Comparison of each specimen with the ideal model.
Applsci 11 10201 g006
Figure 7. The average value of the error, standard deviation, and root mean square value of each specimen.
Applsci 11 10201 g007
Figure 8. The degree of deviation of the cross-section and the longitudinal-section of each specimen.
Applsci 11 10201 g008
Table 1. The content of each element in the substrate and wire.
MaterialsElement
AlMgCrTiMnOther
SubstrateBal.0.25%0.6%0.7%0.15%1.4%
WireBal.4.5–5.5%0.05–0.2%0.06–0.2%0.05–0.2%
Table 2. Process parameters during WAAM under different heat input.
Heat Input
(J·mm−1)
Current
(A)
Voltage
(V)
Travel Speed
(m·min−1)
Wire Feed Rate
(m·min−1)
12,250100140.081.123
10,1979513.80.091.263
85689013.60.101.404
72488513.40.111.544
61608013.20.121.685
Table 3. Mathematical model of the cross-sectional profile of the specimen.
Contour ModelModel Equation PrototypeModel Formula
Parabola f ( x ) = a x 2 + b f ( x ) = H W 2 x 2 + H
Half-period cosine curve f ( x ) = a cos ( b x ) f ( x ) = H cos π x W
Full cycle cosine curve f ( x ) = a cos ( b x ) + c f ( x ) = H 2 · cos 2 π x W + H 2
Elliptic curve f 2 ( x ) = x 3 + a x + b f 2 ( x ) = x 3 + W x + 2 W 3 + H 3
Table 4. Integral value and error value of each model.
Specimen NumberParabolaHalf-Period Cosine CurveFull Cycle Cosine CurveElliptic CurveExtract Model
SδSδSδSδST
117.1371.08911.9020.7569.3480.59415.6280.99315.737
214.8691.05210.3270.7318.1110.57413.9990.99114.133
314.2251.0339.8790.7177.7590.56413.4730.97913.769
413.1711.0769.1470.7477.1840.58712.8971.05312.246
514.1331.0289.8150.7147.7090.56113.5280.98413.742
Publisher’s Note: MDPI stays neutral with regard to jurisdictional claims in published maps and institutional affiliations.

