Article

Assignments as Influential Factor to Improve the Prediction of Student Performance in Online Courses

Department of Computer Science and Numerical Analysis, Andalusian Research Institute in Data Science and Computational Intelligence (DaSCI), University of Cordoba, 14071 Cordoba, Spain
*
Author to whom correspondence should be addressed.
Appl. Sci. 2021, 11(21), 10145; https://doi.org/10.3390/app112110145
Submission received: 25 July 2021 / Revised: 25 September 2021 / Accepted: 23 October 2021 / Published: 29 October 2021
(This article belongs to the Collection Machine Learning in Computer Engineering Applications)

Abstract

:
Studies on the prediction of student success in distance learning have explored mainly demographics factors and student interactions with the virtual learning environments. However, it is remarkable that a very limited number of studies use information about the assignments submitted by students as influential factor to predict their academic achievement. This paper aims to explore the real importance of assignment information for solving students’ performance prediction in distance learning and evaluate the beneficial effect of including this information. We investigate and compare this factor and its potential from two information representation approaches: the traditional representation based on single instances and a more flexible representation based on Multiple Instance Learning (MIL), focus on handle weakly labeled data. A comparative study is carried out using the Open University Learning Analytics dataset, one of the most important public datasets in education provided by one of the greatest online universities of United Kingdom. The study includes a wide set of different types of machine learning algorithms addressed from the two data representation commented, showing that algorithms using only information about assignments with a representation based on MIL can outperform more than 20% the accuracy with respect to a representation based on single instance learning. Thus, it is concluded that applying an appropriate representation that eliminates the sparseness of data allows to show the relevance of a factor, such as the assignments submitted, not widely used to date to predict students’ academic performance. Moreover, a comparison with previous works on the same dataset and problem shows that predictive models based on MIL using only assignments information obtain competitive results compared to previous studies that include other factors to predict students performance.

1. Introduction

The popularization of Internet access and the advances in the exploration of digital resources have led to a growing interest in distance education. This education has as main advantages the accessibility (students can follow a course from anywhere in the world) and the flexibility (students can fit their learning around their daily routine) [1]. The current distance studies could not be understood without a digital platform that provides fundamental features like the publication of the contents of the course, a channel to maintain professor-students communication or the tools to keep a control of the student evolution. These systems, called Virtual Learning Environments (VLEs), include course content delivery instruments, quiz modules and assignment submission components, among other functionalities [2]. In addition, VLEs are very useful to control the student involvement in the course, since all his/her activity is recorded in log files that can be analyzed [3].
Even though the history of distance courses is too recent, they have experimented a high expansion, with Massive Open Online Course (MOOCs) as the most popular example. This new format is opening a widespread investigation, due to its differences with respect to traditional face-to-face higher education. Among these features, an open environment regardless of the location of students stands out, as well as a higher number of enrollments [4]. This also implies an important growth in the number of dropouts and academic failures [5]. In this context, the prediction of student success according to their work collected by VLE’s system has become an essential task to be able to discover the main features that describe to the students that pass satisfactorily a course. Thus, some works analyze the impact of the chosen learning platform [6,7], others study the effectiveness of the student-instructor interaction in this engagement [8], while other works have focused on the dynamic adaptation of the e-learning system to the current level of knowledge of each student, based on the interaction with the exercises of the course [9] or prior knowledge and other social factors of students [10].
In this context, this work explores a little used factor to predict student success in distance learning analyzing how this information should be treated to extract all its potential. Specifically, the factor proposed is assignment information, understood as the tasks submitted by the students throughout the online course. The use of information about assignments is not extended as essential factor to determine the students’ performance [1,4,11]. Preliminary, it could be estimated that delivered assignments may help predict the student performance more effectively than the number of accesses or clicks on the course resources, that it is the most used factor. Probably, the lower use of assignments information may be due to a combination of the little number of users who complete assignments, in relation to the total enrollments, and the substantial variation across courses in the assignments scheduled. In this context, our work proposes to use assignments information from a flexible data representation perspective based on Multiple Instance Learning (MIL). This learning framework introduced by Dietterich et al. [12] is considered an extension of supervised traditional learning focused on weakly labeled data. MIL could make a better use of the information provided by submitted assignments to predict the impact of students’ achievement.
In the field of educational data mining there are not many public datasets due to the sensitivity of the data being worked with. This makes it difficult to compare different proposals since the data used by each study are usually so different to be compared. In this context, it is of great relevance the Open University Learning Analytics Dataset (OULAD) [13] availability, one of the few existing public datasets in the field. OULAD collects a large number of student data from an important distance university during two academic years, including demographic data, student interactions with the VLE and assignments submitted. Many works have used it to predict students’ performance but mainly centered in clicks activity, as it is discussed in related work section. This work uses OULAD to obtain assignments information, adapt the representation to the MIL paradigm and store it in ARFF format to work with a popular framework for data mining called Weka. Thus, following the open access philosophy, these files have been made public online for the scientific community that wants to continue the line of this study.
Summarizing, this work carries out an exhaustive study to determine the relevance that information about assignments has to predict the student’s performance. Specifically, this work addresses the following research questions:
1.
How should the information about assignments be represented? Previous works in distance learning use a classical representation based on single instances. However, each course has different type and number of assignments, and these are submitted by few students, which suggests a high sparsity in the data. Representation should be adapted to this environment so that machine learning algorithms can perform well. We propose to use an optimized representation based on MIL able to adapt to the specific information available for each student.
2.
Are machine learning algorithms affected by the way that assignments are represented? It is analyzed a wide set of machine learning algorithms using two different representations of assignments information: representation based on single instances (it is used in previous studies) and based on MIL (the representation that it has been proposed in the previous step). A significant performance difference between the same algorithms using both representations shows the relevance of an appropriate representation so that assignments can be considered a very influential factor for predicting students’ performance.
3.
Is information about assignments a relevant feature to predict the student performance? The accuracy in predicting student performance using MIL is compared with previous studies that use different factors such as demographic features and interactions on VLEs to address the same problem. Algorithms using only information about submitted assignments reach competitive results achieving better accuracy in relation to the previous works that predict academic performance using other factors provided in the same dataset. This justifies the relevance of assignments to predict students’ performance, if it is represented appropriately.
This paper is organized in following sections. Section 2 presents a briefly introduction to MIL and other concepts of background for this study. In Section 3, a review of related work for solving students’ success prediction tasks in distance education is presented. Moreover, this section briefly introduces MIL and its application to the educational environment. Section 4 addresses an in-depth analysis of problem representation and the available information. In Section 5, it is presented the experimentation carried out and the obtained results. Finally, Section 6 draws some conclusions and proposes some ideas for future work.

2. Background

This section presents a basic background of concepts to understand the rest of the work. On the one hand, a brief introduction to MIL is carried out. On the other hand, it is presented the description of the algorithms that will be used in the comparative study from the traditional and MIL perspectives.

2.1. Multiple Instance Learning

Multiple Instance Learning (MIL) was introduced by Dietterich et al. [12] to represent complicated objects [14]. Its inherent capacity to represent ambiguous information allows an efficient representation of different types of objects, such as alternative representations or different views of the same object [15], compound objects formed by several parts [16] or evolving objects composed of samples taken at different time intervals [17].
The main characteristic of MIL is its input space representation: patterns are represented as bags which can contain a variable number of instances. In a supervised learning environment based on multi-instance, each bag or pattern has a label, however there is no information about the instance label. Thus, the hypothesis that relates each instance with each bag depends on the type of representation used. One of the most used is known as standard MI assumption, defined by Dietterich et al. [12]. This hypothesis determines that a bag represents a specific concept whether at least one of its instances represents the desired concept to learn, and the bag does not represent the concept whether none of its instances represent it. However, with the application of MIL to more domains, different assumptions have been proposed [18]. Formally, in a traditional machine learning setting, an object M can be represented by a feature vector V ( M ) associated with a label f ( M ) , ( V ( M ) , f ( M ) ). However, in Multiple Instance Learning setting, each object M may have a variable number n of instances m 1 , m 2 , ⋯, m n , and each instance has an associated features vector V ( m i ) , thus the complete training object M is represented as ( { V ( m 1 ) , V ( m 2 ) , , V ( m n ) } ) associated with a label f ( M ) , ( { V ( m 1 ) , V ( m 2 ) , , V ( m n ) } , f ( M ) ) .

2.2. Supervised Data Mining Techniques for Predicting Students’ Performance

Predicting students’ performance has been addressed from a wide range of popular methods within the field of supervised data mining [2]. There is a special attention to those models that are explainable, since they allow to identify the most determining factors in the result, i.e., student demographic information, VLE activity, etc. Thus, most popular methods for predicting students’ performance are those based on decision trees [11]. These methods offer one of the most intuitive solutions: nodes in the decision tree involve specific predictive factors, and leaf nodes give a classification that applies to all students that reach that leaf. With similar points, rule-based methods offer a solution composed by an antecedent that presents several logical expressions and a consequent that gives the outcome for students covered by the rule. Bayesian methods and logistic regression are among most popular methods too, since they offer predictions based on likelihood of classes where it is possible to determinate the influence of each factor in the result. Support vector machines (SVM) are relatively popular as well, with an approach based on finding the maximum-margin hyperplane in the factor space that gives the separation between types of students. Artificial Neural Networks (ANN) are non-linear models composed of units organized in layers that transmit and transform an input, i.e., the student information, to the end of the network to provide a prediction. These models are less popular [11] because of their lack of explainability, although, on the other side, they tend to be more accurate in their predictions.

3. Related Work

Although VLEs have been used in traditional education for several years, their application to distance education has important particularities. Thus, distance education usually has higher number of enrolled students, more diverse demographic characteristics and, in general, a lower motivation level. These characteristics cause more academic failures and higher dropout rates. In this context, the task of predicting student success in distance education is particularly challenging [3,4].
This section presents a review of previous works and more specifically works that use OULAD. As it has been commented in introduction section, this dataset has had a notable relevance in EDM. In addition, it is addressed a review of the application of MIL framework in education.

3.1. Predicting Student Success in Distance Higher Education

Predicting student’ performance in higher education is a problem that has attracted great attention [1,11,19]. Due to the rise of the VLE, online activities and the increase in log data generated by these environments that can be processed with machine learning techniques in order to detect at-risk students, measure the effectiveness of the e-learning system or give an idea of the success of the academic institution. In this context, several student background factors, previous academic record, or activity during the course can be selected to measure his/her engagement, and therefore, the chances of success in the course. According to [19], the most influential factors are the prior academic achievement (44%) and the demographic information (25%). In [11], these factors are also the most common, but they also include e-learning activities (25%) in the top-3 ranking. The e-learning category includes different statistics like number of logins, assignments or quizzes done. However, the number of clicks on the course resources is the most used factor by far in this category.
Recent proposals for predicting students’ performance in distance higher education include several works such as [20]. This work combines demographic, assignments and clicks information with information about interaction with video of the recorded classes. The case of [21] also explores three-based methods combining assignments submission and clicks information. In [22], clicks information is explored, but from a frequency perspective rather than number of clicks during the course. In [23], it is explored a novel proposal based on graphical visualization of the logit leaf model that combines demographic, number of clicks and submitted assignments. The case of weakly labeled data in the student record is also addressed from an active learning perspective [24], from a semi-supervised learning approach [25] and from number of clicks. However, all these proposals work with sensible data that can not been published, and each one considers distinct demographic or assignments attributes, so it is difficult to compare proposals and results.
This study uses for evaluating results the OULA dataset or OULAD [13]. It is one of the few existing open datasets about learning analytic and educational data mining. Moreover, it is collected from a real case of study, specifically at the Open University (https://www.open.ac.uk/, accessed on 23 October 2021), the largest institution of distance education in United Kingdown and one of the most important worldwide, with around 170,000 students per year and a wide range of degrees, as well as free courses under its platform Open Learn (https://www.open.edu/openlearn/, accessed on 23 October 2021). The dataset contains information of 32,593 students and 7 courses in their different semesters. It is focused on students, aggregating their demographic data, information about their course enrollments, number of daily accesses done to course resources (clickstream), and records about assignments submitted to the VLE (referred as their assessments) during a course. Due to the characteristics of this dataset and the large amount of information, some literature works have referenced it as MOOC data [26,27,28,29]. Specific dataset details are addressed in-depth in Section 4.
An open dataset with these characteristics implies the possibility of having a common framework where different authors can compare their studies with previous works. In this context, although it is a recent dataset (published in 2017), it has reached a high relevance in the field, counting with more than 20 works to date that use it to study the problem of predicting the academic performance. Table 1 summarizes the main characteristics of these previous proposals, taking into account the purpose of the study, the criteria used and the algorithm proposed (or the main one among proposals).
Considering the factors used to carry out the prediction tasks in OULAD, it can be observed slight differences in the most used factors with respect to the previous general work. Thus, a 39% of studies use the number of accesses to resources (clickstreams) [26,29,30,31,32,33,34,35], while a 25% of studies combine this information with demographic data from the students [27,28,32,36,37,38,39]. Focusing solely on assignment information, only one study [40] uses exclusively this factor. Concretely, it considers assignments as an important factor to predict the student’s performance. However, this study has important limitations, like the fact of analyzing only two courses of a total of seven available. The other studies that use assignment information, a 30% of works, use this factor together with the rest of sources sources [3,39,41,42,43]. Thus, the real relevance of this factor in the final prediction cannot be analyzed.
Regarding the purpose of the different works, under the main task of predicting student performance, it can be found that the majority of studies pretend to predict whether the student will pass or fail a course [3,27,30,31,32,37,38,39,40,41,42,43,44,45]. Other approaches focus on the dropout rate [26,29,32,33], while others follow an early prediction study [33,35,36,46]. It is also notable that most studies distinguish among courses or even presentations to make these predictions.
With regard to the algorithms used, it can be appreciated that different supervised learning techniques have been used, mainly trees-based methods [28,30,31,33,36,40,44,46], although Bayesian methods have also been applied [38], as well as support vector machines [27], generative methods based on sequences [26,32] and neural networks or deep learning [3,34,35,39,41,42,43,45].
This work explores how only information on assignments improves the prediction of academic achievement. The purpose is to show that less data can be used more efficiently to obtain competitive results. For this aim, a study is carried out including all OULAD courses, as well as all specific characteristics of assignments in each course with different representations. The study is conducted over a set of different machine learning algorithms belonging to different paradigms in order to provide a comparison as representative as possible.

3.2. MIL in Educational Data Mining

MIL has been used in a wide range of application domains, including classification, regression, ranking and clustering tasks [14]. This framework has experienced a growing interest to represent problems because of its characteristics in data representation. MIL can naturally adapt to complex problems and it allows to work with weakly labeled data. Prediction of the student’s performance from VLE logs has also been addressed with this learning approach [16]. This previous research is set in a different context of traditional e-learning courses. Thus, it is taught in combination with face-to-face classes and it uses different factors in the study. However, it can be considered as an example of MIL efficiency to represent educational data mining problems. From another perspective in [48], it is shown a tool to discover relevant e-activities for learners using MIL.

4. Materials and Methods

In this section, information on assignments in Open University Learning Analytics Dataset (OULAD) [13] is analyzed. It is an anonymized, public and open dataset supported by Open University of United Kingdom. It maintains information about courses, students and their interactions with VLE.
In this section, the original structure of OULAD is analyzed first; secondly, the problem of predicting student’s performance from the activity associated to his/her submitted assignments is discussed and, finally, it is addressed the representation based on MIL and the main differences with respect to traditional representation.

4.1. Information Analysis of OULAD

The original source of OULAD has been published by Kuzilek et al. at (https://analyse.kmi.open.ac.uk/open_dataset, accessed on 23 October 2021). It contains 7 distance learning courses (called modules), all of them taught at the Open University in several semesters during the years 2013 and 2014 (called presentations). The courses consider different domains and difficulties. Thus, courses AAA, BBB and GGG belong to Social Sciences domain and courses CCC, DDD, EEE and FFF to Science, Technology, Engineering and Mathematics (STEM). Concerning to difficulty levels, AAA is a level-3 course, GGG is a preparatory course, and the rest are level-1 courses [36]. Each course has several resources on the VLE used to present the contents of the course, one or more assignments that mark the milestones of the course and a final exam. In total, it contains records of 32,593 students. There is demographic information, such as their gender, region or age band. There is information related to their enrollment in the courses, such us number of previous attempts or the final mark obtained in the course. Also, there is information related to their activity during the courses. This information includes interactions with the resources in the VLE, number of clicks, and the submitted assignments during the course.
An overview of the course structure can be seen in Figure 1. Students can register in several courses during a semester. Moreover, courses are repeated in different years (they have different editions). The content of a course is usually available in VLE a couple of weeks before the official course start. The course assignments are defined as their assessments whose purpose is to have a control of the student’s evolution. During the presentation of the course, students’ knowledge is evaluated by means of assignments which define milestones. Two types of assignments are considered: Tutor Marked Assessment (TMA) and Computer Marked Assessment (CMA). If the student decides to submit an assignment, the VLE collects information about the date of submission and the obtained mark. By contrast, if a student doesn’t submit the assignment, no record is stored. At the end of a presentation, a student enrolled in a certain course takes a final exam and achieves a final mark. This mark can take 3 different values: pass, distinction or fail. Additionally, if the student doesn’t carry out this exam, it will be considered that he/she doesn’t finish the course and the final mark is set as withdrawn.
Table 2 shows a summary of available information for each course considering the number of times that the course has been offered, the average number of students per course and its standard deviation (considering the different times that it has been offered), the number of assignments by course, the average number of assignments submitted by students, and the percentage of students that fail or drop out the course relative to the total enrolled students. Assignments are divided between TMA and CMA types, as it has been commented previously.
As we can see, there are significant differences between courses: they have been offered at different times during the considered academic years and the number of enrolled students also differs. There are also differences in terms of number and type of assignments, as well as the average number of submissions per student. Figure 2 shows the difference between courses. Figure 2a shows the average number of enrollments in a course versus the average pass rate. Figure 2b shows the number of assignments available by course versus the average submitted assignments per student. It can be observed that the number of assignments is different in each course and there are courses where the average percentage of submitted assignments is approximately 90% (as AAA course) while in other ones, as DDD course, this rate only reaches a 40% of submitted assignments. However, there is a tendency that seems to indicate that the more assignments are submitted, the more students pass the course. Thus, AAA course has a 71% of students that pass while DDD course has only a 42%.

4.2. Problem Representation Based on Assignment Information

In this study, prediction of student’s performance to determine whether he/she will pass a course is focused on the information of submitted assignments. Table 3 shows the specific information provided by OULAD for assignments submitted by a student in each course: assignment_type is a categorical value specifying the two types of assignments considered (TMA and CMA). Each assignment has a weight (assignment_weight) and a score (assignment_score). Normally, the weighted sum of all assignments in each course is 100. The score is a numerical value in the range from 0 to 100. Assessement_advanced considers the number of days between the submission of the assignment by the student and its deadline. This is not a direct attribute in OULA dataset, but it can be calculated as the difference between the deadline date and the day on which student submitted it. Finally, it is considered assignment_banked that indicates if the assignment has been transferred from a previous enrollment in that course.
This study presents the traditional representation based on single instance and proposes a representation based on multiple instances learning to solve the problems of traditional representation. Since OULAD is presented in form of several CSV tables, it has been converted to ARFF format [49] using both mentioned representations. This process has implied the load of the dataset in a MySQL database and a slight restructuring of the data schema to ensure that it is maintained the Codd’s normal form and data are not duplicated. Finally, from the database and through automated scripts, the different ARFF files with relationships considered have been generated. These datasets have been published in open access mode in the web repository associated with this paper (http://www.uco.es/kdis/mildistanceeducation/, accessed on 23 October 2021). Thus, a reproducible experimentation is facilitated to allow new advances in the area. The following sections define the representations proposed to solve the problem.

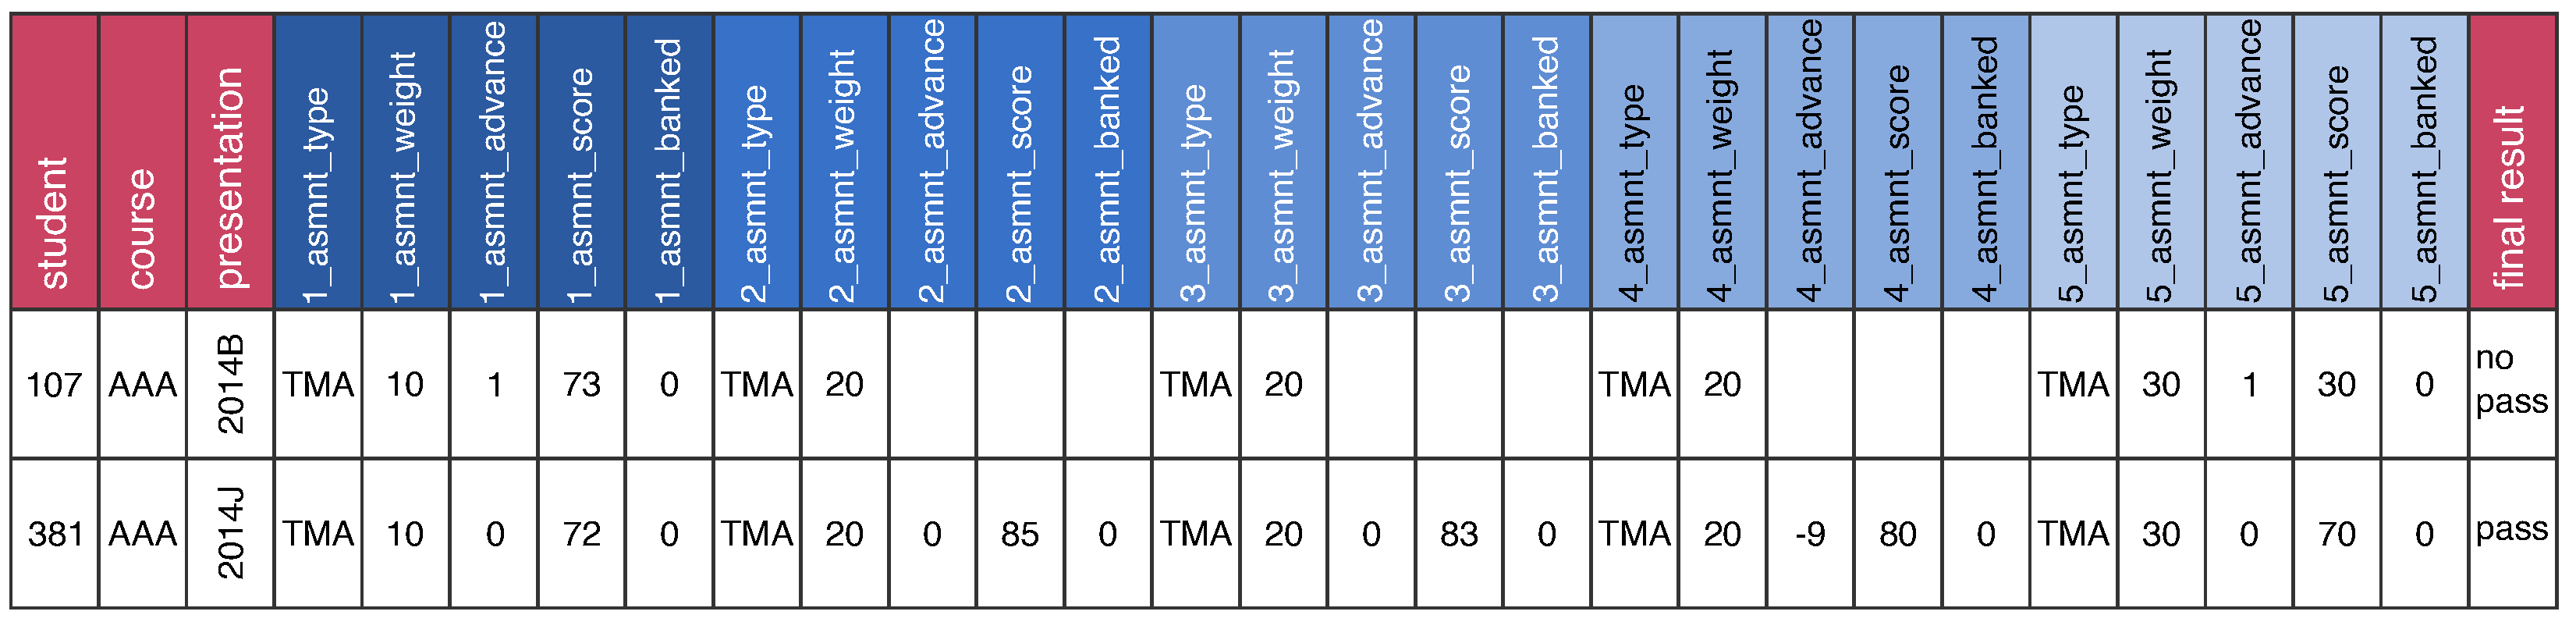
4.2.1. Representation Based on Single Instance Learning

As it has been commented, each student can submit a different number of assignments. Actually, assignments are not necessary to pass the course, although they are recommended to get a better understanding of the course. This information should be kept in an appropriate way so that it can influence in the prediction of student’s academic achievement. That is, with the aim of predicting whether a student passes (with or without distinction) or does not pass (aggregating the failure and the dropout) a course.
The traditional supervised learning representation, used in previous studies with this dataset, is characterized by representing each student enrolled in a course during a semester as a pattern or vector of characteristics. Each pattern keeps the student’s activity by means of a fixed number of attributes. According to the information specified in the Table 3, each assignment is represented by five attributes. Thus, each student is an pattern composed of 5 × X attributes, being X the total of programmed assignments during that course and the final mark (student passes or fails the course). Moreover, the student’s participation in a course is specified by means of his/her identification, the course identification and the presentation identification that represents the edition of the course.
An illustrative example of problem representation can be seen in Figure 3. Here, we can see two students who belong to course AAA. Course AAA has 5 assignments. Therefore, it is necessary 25 attributes ( 5 × 5 = 25 ) to represent information about student’s assignments. One student submitted only two of the five assignments while the other one submitted all of them. As we can see, in traditional supervised learning, both students have the same number of attributes. Thus, if a student doesn’t submit an assignment, the attributes related to this submission will have an empty value, but they have to be presented. This representation forces you to fill all attributes related to the non-submitted assignments, so there is a potential increase of the computational and storage resources needed for courses with a representative number of assignments.
The equivalent representation of the commented example in ARFF format to be processed by machine learning algorithms using Weka framework can be seen in Table 4. In this case, it is necessary to define the 25 attributes in the header of the file. The instances are defined one per line following the @data label. Each instance represents one student and each attribute is separated by comma in the same order that were defined in the header. Thus, although a student does not submit an assignment, the information related to that assignment has to be filled in the instance. Other problem in this approach is that representation depends on the course. Thus, whether the previous example of AAA course is compared with an example of DDD course shown in Table 5, as DDD course has 13 assignments instead of 5, the dataset would have 65 attributes instead of 25 attributes. As we can see, the representation becomes more inefficient in cases of students that submit a low number of assignments. Moreover, there is a limitation of working with different courses because the representation is not uniform between courses. It depends of the assignments by course.

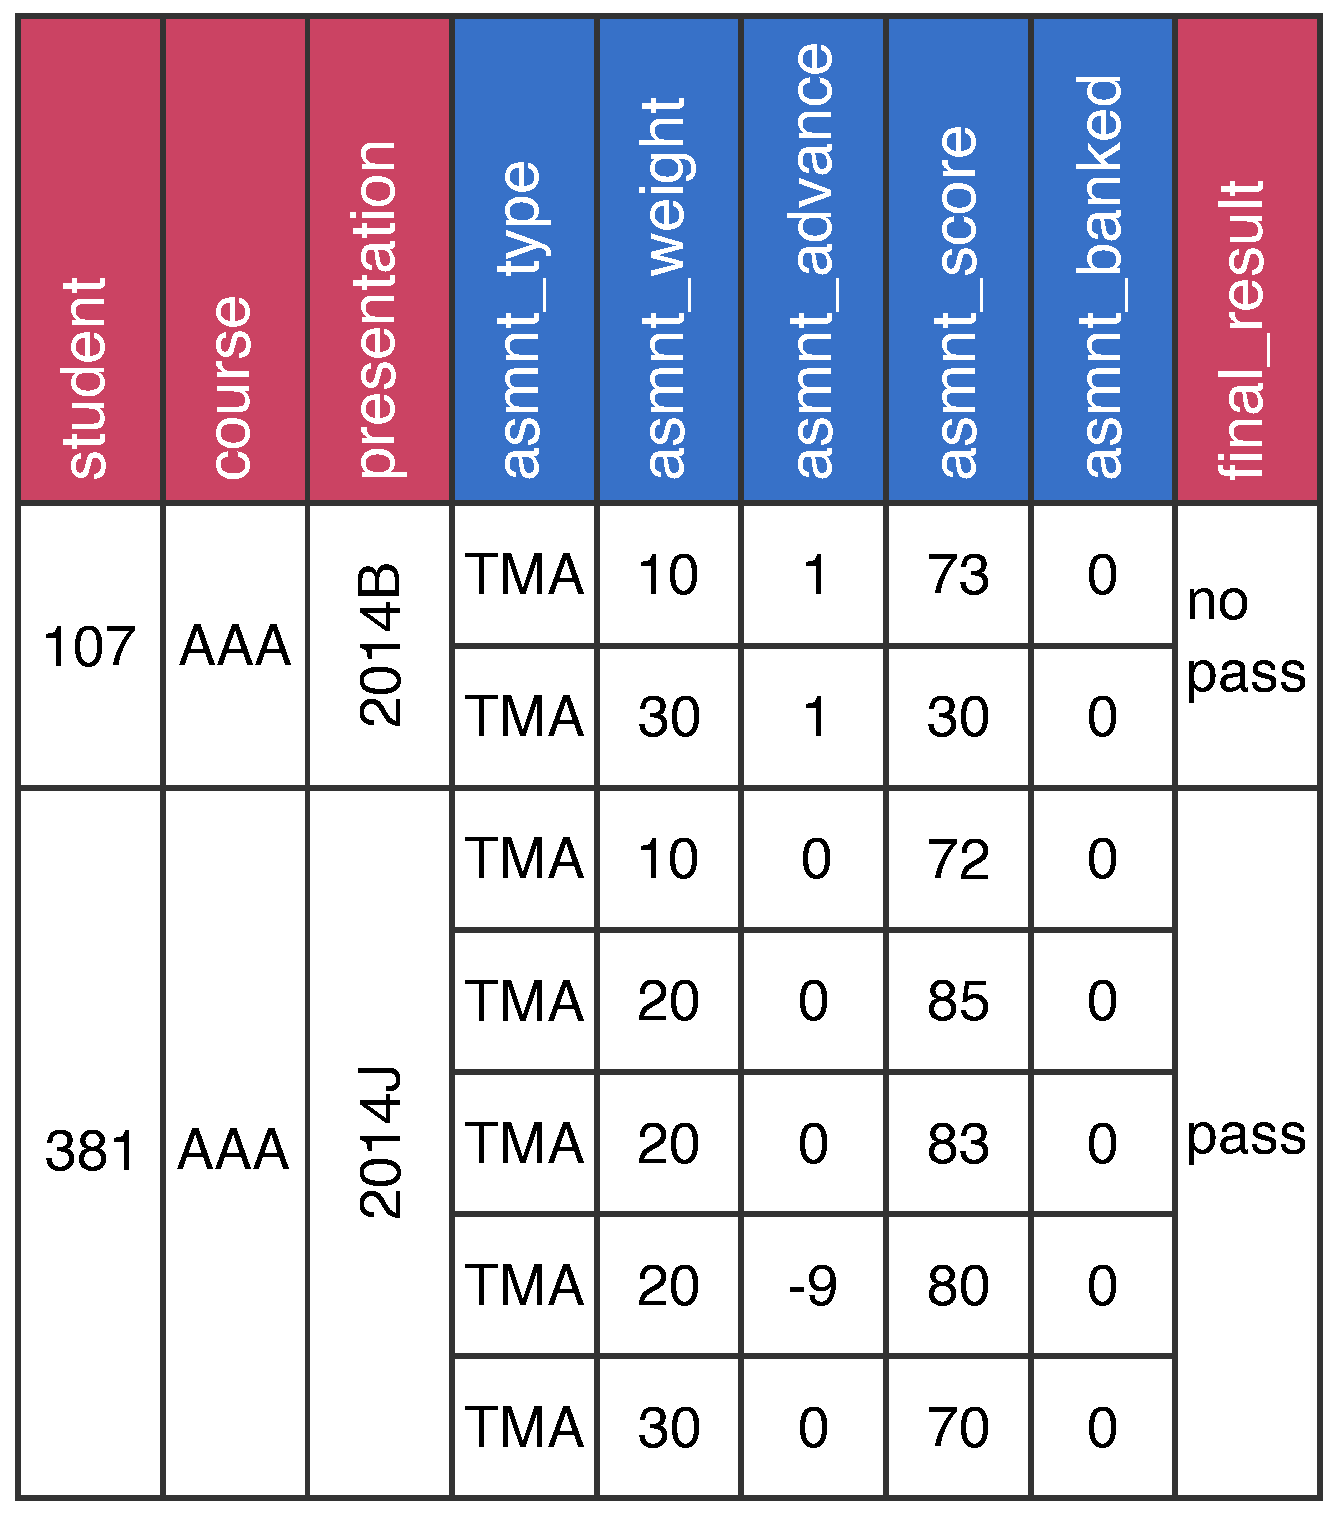
4.2.2. Representation Based on Multiple Instance Learning

MIL allows a flexible representation that adapts itself to the specific information available for each student according to his/her work in the course. In MIL representation, each pattern is called bag and represents a student enrolled in a course during one semester. Each bag represents the student’s activity. Thus, the bag is composed of a variable number of instances being each instance an assignment submitted by the student. Therefore, each bag has as many instances as assignments submitted by the student during a presentation of a course and one class attribute that can take, similarly to traditional representation, two values: the student passes (with distinction or without it) or does not pass the course (aggregating the failure and the dropout). This representation fits the problem perfectly because it can be customized by each student. Thus, the number of attributes in an instance is always the same, while the number of instances in a bag depends on the student’s activity. There are five attributes in every instance described in Table 3: type, weight, days between the submission and the deadline, score obtained by the student and a status flag that indicates if the given assignment has been transferred from a previous presentation coursed by the student.
The same example presented in traditional supervised learning (see previous Section 4.2.1) is addressed in Figure 4 from a flexible representation based on MIL. There are two students enrolled on AAA course: one of them submits only two assignments and he/she doesn’t pass the course while the other one submits all assignments and he/she passes the course. In case of MIL, the data representation is much more efficient: each student is represented as a bag with so many instances as assignments he/she had submitted. As we can see, with this representation there are no empty fields and the representation. It is adapted perfectly to the available information of each student. The corresponding ARFF representation used by machine learning algorithms in Weka can be seen in Table 6. In this case, attributes for each instance must be defined as part of a relational attribute. Thus, they do not depend on the number of assignments in the course achieving a uniform representation between courses. For all course there are one relational attribute (with five instance attributes) independently of the number of assignments by course. Thus, the ARFF representation for DDD course would use the same number of attributes than AAA course. Each student is represented by one bag with all their instances enclosed in double quotes and each one separated by the character “\n” representing each submitted assignments.

5. Experimentation and Results

The goal of the experimental study is to investigate the potential of assignments to predict whether a student will or won’t pass a course. As it has been commented in related work, the previous studies focus on this problem with OULA dataset involve mainly the evaluation of the student interactions with resources in VLE to determine his/her success in the course. On the contrary, this paper explores the potential of assignments to determine the level of engagement of students in a particular course. To validate this hypothesis, the performance of same algorithms will be analyzed. Thus, same information is used, but it is represented in one case from a traditional approach and in another case from a MIL approach. Thus, the flow of the experimental study is divided in five steps: first the configuration of the algorithms used to predict the student performance is presented in Section 5.1. Secondly, in Section 5.2 two procedures that permit to algorithms perform with MIL problems are presented and configured. Then, Section 5.3 defines the evaluation metrics as well as their meaning from a classification perspective and from a educational perspective. Next, Section 5.4 addresses the results contextualizing them in two comparative studies: attending to representations and attending to previous works. Finally, in Section 5.5, a discussion of the obtained results is carried out.

5.1. Configuration of Classification Algorithms

The experimentation of this is designed to offer a fair comparison between MIL and the traditional single-instances paradigm evaluating the same metrics in the same problem with the same information and in the same wide set of algorithms, part of the state of the art in supervised learning. They have been selected 23 algorithms considering the main paradigms of machine learning and the most popular methods for predicting student performance (see Section 2.2).
The experimentation has been developed using Weka [49], a framework for machine learning in Java. In order to ensure solid evaluation, each experiment is executed with a 10-fold cross-validation. In addition, stochastic algorithms are executed 5 times with different seeds, having a total of 50 executions per algorithm and course. The datasets in ARFF format ready to be used in Weka have been published in open access mode in the web repository associated to this paper (http://www.uco.es/kdis/mildistanceeducation/, accessed on 23 October 2021). In order to easily reproduce the experimentation, this section presents the studied algorithms as well as their configurations. Since the purpose of this study is to compare types of learning under equal conditions, the configuration of the predictive algorithms should not favor one or the other representation paradigm. Thus, these configurations has been chosen based on the default settings that the authors specified according to the Weka workbench [49], where more information can be consulted.
The 23 predictive algorithms and their configurations are listed bellow:
  • Methods based on trees: Decision Stump [50], J48 [51], Random Tree [52] and Random Forest [53]. See configurations in Table 7.
  • Methods based on rules: ZeroR [49], OneR [54], NNge [55], PART [56] and Ridor [57]. See configurations in Table 7.
  • Method based on Bayesian models: naive Bayes classifier [58]. See configuration in Table 7.
  • Methods based on logistic regression: the algorithm considered in this paradigm is the proposal of Cessie and Houwelingen [59]. See configuration in Table 7.
  • Methods based on Support Vector Machines (SVM): LibSVM [60], SGD with SVM as loss function [61], SMO with polynomial kernel [62] and SPegasos [63]. See configurations in Table 8.
  • Methods based on Artificial Neural Networks (ANN): Multilayer Perceptron [64] and RBFNetwork [64]. See configurations in Table 8.
  • Methods based on ensembles: AdaBoostM1 [65] and Bagging [66]. These meta-algorithms have been used with three distinct base classifiers previously commented: Random Forest, PART and Naive Bayes. See configurations in Table 8.

5.2. Configuration of Wrappers for MIL

With respect to MIL representation based on multiple instance, it is proposed the use of two different wrappers available in Weka [49] to adapt the MIL problem to single instance or traditional learning problem. Once that the problem is transformed, the same algorithms used in single instance representation (presented in previous Section 5.1) can be used with MIL representation. Thus, it is a more fair comparison because same algorithms and configurations are used. The proposals of MIL wrappers are the following:
  • SimpleMI [67]: this wrapper makes a summary of all the instances of a bag in order to build a unique instance that can be processed by a simple instance algorithm.
  • MIWrapper [68]: this wrapper assumes that all instances contribute equally and independently to the bag’s label. Thus, the method breaks up the bag into its individual instances labeling each one with the bag label and assigning weights proportional to the number of instances in a bag. At evaluation time, the final class of the bag is derived from the classes assigned to its instances.
In the case of SimpleMI, there are two possible configurations to compute the summary of the instances of a bag into a single instance:
  • Configuration 1: computing arithmetic mean of each attribute using all instances of the bag and using it in the summarized instance.
  • Configuration 2: computing geometric mean of each attribute using all instances of the bag and using it in the summarized instance.
In the case of MIWrapper, three configurations to compute the final class of the bag, extracted from the classes assigned at evaluation time:
  • Configuration 1: computing the arithmetic average of the class probabilities of all the individual instances of the bag.
  • Configuration 2: computing the geometric average of the class probabilities of all the individual instances of the bag.
  • Configuration 3: checking the maximum probability of single positive instances. If there is at least one instance with its positive probability greater than 0.5, the entire bag is positive.
This study evaluates the accuracy of the different configurations to predict if a student will pass or fail the course. The experimentation consists of a 10-fold stratified cross-validation for every combination of wrapper configuration, algorithm and course. The complete results of this experimentation can be downloaded from the web repository associated to this work (http://www.uco.es/kdis/mildistanceeducation/, accessed on 23 October 2021).
With the average accuracy of the cross-validation, a statistical analysis is carried out in order to find significant differences between configurations in each MIL wrapper. Concretely, it is used the non-parametric Wilcoxon signed-rank test [69] to carry out a pairwise statistical procedure between every two configurations. In each comparison is applied the test and obtained a p-value independent to show if algorithms obtain significantly better accuracy values with a specific configuration. Table 9 shows the R + , R and p-values for all pairwise comparisons carried out. For both wrappers and considering a confidence level of 99%, the configuration 1 obtains significantly higher accuracy values than the others. Thus, for SimpleMI is more convenient to summarize the bag with the arithmetic mean and in case of MIWrapper, it is also better to use the arithmetic mean to combine the class probabilities of instances into the final class bag.

5.3. Evaluation Metrics

The metrics used for evaluation are some of the most common ones in the field of classification. In this context, classical concepts of binary classification are re-defined to our specific problem of having success in a course (passing it with or without distinction) or not having it (failure or dropout) as follow:
  • t p is the number of students correctly identified to pass the course.
  • t n is the number of students correctly identified to fail the course.
  • f p is the number of students do not correctly identified to pass the course (it is predicted that students pass the course, but they really do not pass).
  • f n is the number of students do not correctly identified to fail the course (it is predicted that students do pass the course, but they really pass).
Given the nature of the problem, in this context it is specially interesting to focus on students who are likely to fail. Thus, the metrics studied are [70]:
  • Accuracy is the proportion of correctly classified students, i.e., identifying if they pass or not the course.
    A c c = t p + t n t p + t n + f p + f n
  • Sensitivity is the proportion of students correctly classified that pass the course.
    S e = t p t p + f n
  • Specificity is the proportion of students correctly classified that do not pass the course.
    S p = t n t n + f p

5.4. Comparative Study

This section presents experimental results in the problem of comparing both multiple instances and single instance representation in predicting student performance using only his/her assignments activity. First, it is evaluated the performance of 23 machine learning algorithms using both representations. Statistical tests are used to determine if there are significant differences between performance using the different representations. Then, the best results achieved in this study are compared with the results of previous works shown in Section 3 that also predict the success of students for the same public dataset but using other student information available in OULAD.

5.4.1. Comparative Analysis between Different Representations

This section compares the performance of a wide set of algorithms in the problem of predicting student’s success in a distance course using the same student information with different representations: traditional representation (based on single instance learning) and flexible representation (based on MIL). For solving the problem using flexible representation, as it is commented in Section 5.2, two different methods (MIWrapper and SimpleMI) that transform the MIL problem are used.
The experimental study carries out a 10-fold stratified cross-validation. The full results of this experimentation can been downloaded from the web repository associated to this work (http://www.uco.es/kdis/mildistanceeducation/, accessed on 23 October 2021).
Table 10 and Table 11 show average accuracy results for each course. Thus, for each representation and algorithm, it is presented the average accuracy results of each course presented in OULAD. It can be observed that SimpleMI (using flexible representation) obtains the highest accuracy for most algorithms in the different courses. Thus, with an accuracy between 85% and 95% for all algorithms, SimpleMI outperforms in a robust way to traditional representation. MIWrapper (also using flexible representation) achieves similar results to SimpleMI and it obtains better results for the most algorithms than traditional representation. Although its values are somewhat lower. This affects to general accuracy of MIWrapper (around 80%) that is lower than those of SimpleMI. Algorithms that use traditional representation have a more variable performance. It can be appreciated that in general, this representation obtains lower accuracy (around 65%). In this case, we appreciate that more complex algorithms like the multi-layer perceptron, LibSVM or Ridor are needed to reach results comparable to SimpleMI. This is a disadvantage in terms of interpretability, since these methods do not provide information of which are the most relevant attributes in order to obtain representative information to help students. In this line, methods like those based on rules or trees get to outperform their results using SimpleMI representation while maintaining interpretable results. Concretely, they obtain a 20% more than accuracy in average, using the same data but with a more optimal representation that fixes better to the problem.
For a more detailed analysis, Table 12 shows the average results for accuracy, sensitivity and specificity considering average results of the seven courses by the different algorithms. Results are grouped by representation: traditional representation and flexible representation (SimpleMI and MIWrapper). A full report of the results can be seen at the web repository associated to the article (http://www.uco.es/kdis/mildistanceeducation/, accessed on 23 October 2021). These data help to see in more detail tendencies like the superiority of SimpleMI, that gets the best accuracy results in all courses. Thus, the general tendency is that flexible representation (using SimpleMI) gets to improve the algorithms performance, obtaining better accuracy values versus traditional representation. In addition, this table shows in-depth the differences of performance between methods with the different representations. On the one hand, it is shown that traditional representation causes that algorithms obtain better values for specificity (predicting students that do not pass the course) at the expense of obtaining worse values for sensitivity (predicting students that pass the course). On the other hand, flexible representation (using WrapperMI) entails that algorithms obtain better values for sensitivity (predicting students that pass the course) at the expense of obtaining worse values for specificity (predicting students that do not pass the course). The fact of this off-balance between these measures is traduced in worse predictions overall. Again, flexible representation (using SimpleMI) obtains the most balanced results for both measures, sensitivity and specificity. Thus, this representation gets the best value or a very close one, achieving the best accuracy.
To analyze final results and show if there is significant differences between the behavior of algorithms using different representations, it is applied the test of Wilcoxon signed-ranks [69]. Thus, a pairwise comparison is carried out facing representation based on single instance (traditional) and the two MIL-based representations (SimpleMI, MIWrapper). Table 13 shows the results of the tests attending to accuracy measure. It is shown the R + , R and p-values. With a confidence level of 99%, SimpleMI shows an improvement over the other representations. With a confidence level of 95%, MIWrapper shows an improvement over traditional representation.
Analyzing the differences in sensitivity, Table 14 shows a similar tendency: both flexible representations significantly outperform with a confidence level of 99% to traditional representation. However, attending to specificity results in Table 15, it can be appreciated that MIWrapper has difficulties to distinguish the negative class, which leads to a bad performance compared to SimpleMI and traditional representation. However, SimpleMI does not have this problem, reaching the best results in this metric too.
The main conclusion extracted from this experimentation is the importance of an appropriate problem representation. It can be seen that the assignments represented with single instance learning obtain lower results. These results can explain why assignments are not widely included as influencing factors in previous studies of predicting students’ performance. Using the same type of information and the same learning algorithms, but a representation based on MIL, algorithms can predict the student’s success in distance education with more accuracy. Thus, we can see that flexible representation can obtain differences of more than 20% of performance in comparison with traditional representation.

5.4.2. Comparative Analysis with Previous Works

Based on previous studies shown in Section 3 (Table 1), this work deviates from the general trend marked by the use of clickstreams (well known as student interactions with the VLE). As it has been shown, a limited number of studies use the information about assignments as influential factor for the predictions.
However, as it has been shown in the previous comparative study, assignments can obtain equal or better results if they are processed with the appropriate representation. Thus, in this section a comparison of the accuracy to predict student’s performance is carried out attending to the best MIL method according previous section, SimpleMI, and the related work. Table 16 shows these differences with a special focus on previous works that have used same algorithms but from a traditional learning perspective. Thus, it is shown the algorithm and the data from OULAD in previous work compared to the use of MIL. For example, we can focus on the unique previous work that uses solely assignments data [40]. This work is limited to courses CCC and FFF and it obtains an average accuracy of 83% using decision trees. In our work, for these courses and algorithms, the best results reached show an average accuracy of 92’1%. Focusing on previous works focus on predicting student success or failure in a course but not based on assignments data, the best results are achieved by [30]. This work applies J48 over VLE activity data obtaining an average accuracy over all the courses 90%. In our case, using only assignment data with the same algorithm, the best result achieved for each course gets an average accuracy of 92.7%.
There are also some works that use algorithms not included in our study, like XGBoost [36], Gausian Mixture Models [29], or Deep Learning [39,41,42,43]. However, if their best results are compared to the best results obtained in this work, MIL achieves equals or better results using less data and in a more interpretative way. This is shown in Table 17. This table shows each previous work that employs an algorithm not included in our study and it addresses the same problem of predicting student’s performance, as well as the information used, with the best result obtained using MIL (SimpleMI) for the same courses.
Nevertheless, these comparisons should be taken carefully, since the conditions of experimentation and evaluation may differ. Thus, our study shows that general performance of predictive models based on MIL and assignments data are competitive with respect to other approaches that do not use this information or combine it with other factors. To promote future fair comparisons, all information necessary to carry out this experimental study is available in the public repository associated to the article.

5.5. Discussion of Results

In this section, it is highlighted the implications of using MIL to predict students’ performance in a context of distance learning. Moreover, the possible limitations that the proposed approach may have are also discussed. Comparative analysis between different representations has shown that MIL robustly outperforms to traditional representation. Concretely, it is obtained approximately a 20% more accurate results on average. In the context of the problem of student’s performance, it is important to attend not only to general metrics that give the same importance to all classes, but also to metrics that explain how well our system finds those problematic students that will not pass or dropout the course. This can be measured with metrics like specificity, in which MIL also outperforms traditional data representation. Given the superiority in performance, it is also worth commenting on the advantage of using MIL in terms of interpretability of results. In the context of predicting student’s performance, it is very important that the models are not a black box. Thus, they could be interpreted by mentors and tutors in order to be able to correct in time trends that may lead to students failing or dropping out of the course. With MIL, a student’s assignment information takes up to four times less than using the simple instance-based representation. This helps to create models more quickly and reduce redundancy in the information, which makes the results easier for a human to read. This, together with the lack of the need for deep learning or black box algorithms to obtain results above 90% accuracy, means that the level of interpretability of MIL models remains high and can be used in real-world tools to identify potential problems in distance learning courses with large numbers of failures, as well as to identify specific students at risk of failing.
On the other side, the approach of this work may also have limitations that should be taken into account. The authors can identify two main problems that can be addressed in future works. First, this work has been carried out by analyzing the dropout and failure profiles together. Although both profiles correspond to students who do not pass the course, this could be due to different causes, so it is worth considering the possibility of carrying out a separate analysis to identify each type of student at risk. Second, the study has been made considering all the activities of the course, i.e., it is required to have reached an advanced point of the course to have all the information of the assignments that have been submitted. This limits the possibilities of action to prevent an at-risk student from failing the course. It would be desirable to tweak the approach to only use the information from the assignments up to a certain point in the course, in order to have enough time before the final exam to be able to adequately guide the at-risk student to avoid failure.

6. Conclusions and Future Work

This paper shows the impact of assignments information to predict the academic achievements. Online courses are characterized by a high number of enrolled students with a low participation and engagement, in general terms. Moreover, assignments depend on each course, because each has its own curriculum, scheduling and evaluation approach, so offers different number and type of assignments. This has led to ignore assignments as a criterion to predict students performance, as proves the very limited number of works that study them. The main problem is that traditional representation produces a very complex representation that machine learning algorithms cannot properly process.
This work shows that information about assignments can be very valuable to predict students performance when it is appropriately represented. The comparative study has employed a public dataset in learning analytics, OULAD. This dataset allows to work with a big amount of data and the comparison of the proposed study and results in an existing common framework. Thus, starting from this dataset, the appropriate transformations have been applied to use MIL as the learning paradigm, generating the files in ARFF format necessary to train the predictive models. These files are publicly available in the web repository associated with the article. Experimental results over a wide set of 23 machine learning algorithms and 7 courses show that, in a general way, using assignments in a flexible representation improve the accuracy with respect to use the same information in a traditional representation, achieving an important balance between sensitivity and specificity measures. Statistical tests confirm these results showing significant differences in every studied metric between multiple instances and single instance representations. Finally, it is carried out a comparison with previous studies that also use OULAD for predicting student performance from other factors, such as demographic information and students interactions with VLE, showing the relevance of assignments as a very influential factor to determine the student success or failure.
The great variety of information gathered in OULAD together with the promising results obtained open the door to continue this line of research. Thus, it may be tested another source of information to predict the student success like the clicks activity in the VLE, the number of times that the student has done a course or including demographic data. In addition, it is propose to extend the study to algorithms unique to MIL paradigm, as well as explore different MI assumptions existing in the bibliography.

Author Contributions

Conceptualization, A.E., C.R. and A.Z.; methodology, A.E., C.R. and A.Z.; software, A.E.; validation, A.E. and A.Z.; formal analysis, C.R. and A.Z.; investigation, A.E., C.R. and A.Z.; writing—original draft preparation, A.E., C.R.; writing—review and editing, A.Z.; supervision, C.R. and A.Z. All authors have read and agreed to the published version of the manuscript.

Funding

This work was supported by the Spanish Ministry of Science and Technology [No. PID2020-115832GB-100].

Institutional Review Board Statement

Not applicable.

Informed Consent Statement

Not applicable.

Data Availability Statement

Source data are available https://analyse.kmi.open.ac.uk/open_dataset, accessed on 23 October 2021, and dataset processed with arff format can be found at https://www.uco.es/kdis/mildistanceeducation, accessed on 23 October 2021.

Conflicts of Interest

The authors declare no conflict of interest.

References

  1. Yunusa, A.A.; Umar, I.N. A scoping review of Critical Predictive Factors (CPFs) of satisfaction and perceived learning outcomes in E-learning environments. Educ. Inf. Technol. 2021, 26, 1223–1270. [Google Scholar] [CrossRef]
  2. Romero, C.; Ventura, S. Data mining in education. Wiley Interdiscip. Rev. Data Min. Knowl. Discov. 2013, 3, 12–27. [Google Scholar] [CrossRef]
  3. Tomasevic, N.; Gvozdenovic, N.; Vranes, S. An overview and comparison of supervised data mining techniques for student exam performance prediction. Comput. Educ. 2020, 143, 103676. [Google Scholar] [CrossRef]
  4. Gardner, J.; Brooks, C. Student success prediction in MOOCs. User Model. User Adapt. Interact. 2018, 28, 127–203. [Google Scholar] [CrossRef] [Green Version]
  5. Panagiotakopoulos, T.; Kotsiantis, S.; Kostopoulos, G.; Iatrellis, O.; Kameas, A. Early Dropout Prediction in MOOCs through Supervised Learning and Hyperparameter Optimization. Electronics 2021, 10, 1701. [Google Scholar] [CrossRef]
  6. Gong, J.W.; Liu, H.C.; You, X.Y.; Yin, L. An integrated multi-criteria decision making approach with linguistic hesitant fuzzy sets for E-learning website evaluation and selection. Appl. Soft Comput. 2021, 102, 107118. [Google Scholar] [CrossRef]
  7. Yang, Q.; Lee, Y.C. The Critical Factors of Student Performance in MOOCs for Sustainable Education: A Case of Chinese Universities. Sustainability 2021, 13, 8089. [Google Scholar] [CrossRef]
  8. Jaggars, S.S.; Xu, D. How do online course design features influence student performance? Comput. Educ. 2016, 95, 270–284. [Google Scholar] [CrossRef] [Green Version]
  9. Muñoz-Merino, P.J.; González Novillo, R.; Delgado Kloos, C. Assessment of skills and adaptive learning for parametric exercises combining knowledge spaces and item response theory. Appl. Soft Comput. J. 2018, 68, 110–124. [Google Scholar] [CrossRef]
  10. Birjali, M.; Beni-Hssane, A.; Erritali, M. A novel adaptive e-learning model based on Big Data by using competence-based knowledge and social learner activities. Appl. Soft Comput. J. 2018, 69, 14–32. [Google Scholar] [CrossRef]
  11. Abu Saa, A.; Al-Emran, M.; Shaalan, K. Factors Affecting Students’ Performance in Higher Education: A Systematic Review of Predictive Data Mining Techniques. Technol. Knowl. Learn. 2019, 24, 567–598. [Google Scholar] [CrossRef]
  12. Dietterich, T.G.; Lathrop, R.H.; Lozano-Pérez, T. Solving the multiple instance problem with axis-parallel rectangles. Artif. Intell. 1997, 89, 31–71. [Google Scholar] [CrossRef] [Green Version]
  13. Kuzilek, J.; Hlosta, M.; Zdrahal, Z. Data Descriptor: Open University Learning Analytics dataset. Sci. Data 2017, 4, 1–8. [Google Scholar] [CrossRef] [PubMed] [Green Version]
  14. Carbonneau, M.A.; Cheplygina, V.; Granger, E.; Gagnon, G. Multiple instance learning: A survey of problem characteristics and applications. Pattern Recognit. 2018, 77, 329–353. [Google Scholar] [CrossRef] [Green Version]
  15. Sudharshan, P.J.; Petitjean, C.; Spanhol, F.; Oliveira, L.E.; Heutte, L.; Honeine, P. Multiple instance learning for histopathological breast cancer image classification. Expert Syst. Appl. 2019, 117, 103–111. [Google Scholar] [CrossRef]
  16. Zafra, A.; Romero, C.; Ventura, S. Multiple instance learning for classifying students in learning management systems. Expert Syst. Appl. 2011, 38, 15020–15031. [Google Scholar] [CrossRef]
  17. Kotsiantis, S.; Kanellopoulos, D.; Tampakas, V. Financial application of multi-instance learning: Two Greek case studies. J. Converg. Inf. Technol. 2010, 5, 42–53. [Google Scholar]
  18. Foulds, J.; Frank, E. A review of multi-instance learning assumptions. Knowl. Eng. Rev. 2010, 25, 1–25. [Google Scholar] [CrossRef] [Green Version]
  19. Alyahyan, E.; Düştegör, D. Predicting academic success in higher education: Literature review and best practices. Int. J. Educ. Technol. High. Educ. 2020, 17, 1–21. [Google Scholar] [CrossRef] [Green Version]
  20. Hasan, R.; Palaniappan, S.; Mahmood, S.; Abbas, A.; Sarker, K.U.; Sattar, M.U. Predicting student performance in higher educational institutions using video learning analytics and data mining techniques. Appl. Sci. 2020, 10, 3894. [Google Scholar] [CrossRef]
  21. Hung, H.C.; Liu, I.F.; Liang, C.T.; Su, Y.S. Applying educational data mining to explore students’ learning patterns in the flipped learning approach for coding education. Symmetry 2020, 12, 213. [Google Scholar] [CrossRef] [Green Version]
  22. Shelton, B.E.; Hung, J.L.; Lowenthal, P.R. Predicting student success by modeling student interaction in asynchronous online courses. Distance Educ. 2017, 38, 59–69. [Google Scholar] [CrossRef]
  23. Coussement, K.; Phan, M.; De Caigny, A.; Benoit, D.F.; Raes, A. Predicting student dropout in subscription-based online learning environments: The beneficial impact of the logit leaf model. Decis. Support Syst. 2020, 135, 113325. [Google Scholar] [CrossRef]
  24. Kostopoulos, G.; Lipitakis, A.D.; Kotsiantis, S.; Gravvanis, G. Predicting student performance in distance higher education using active learning. Commun. Comput. Inf. Sci. 2017, 744, 75–86. [Google Scholar]
  25. Kostopoulos, G.; Kotsiantis, S.; Fazakis, N.; Koutsonikos, G.; Pierrakeas, C. A Semi-Supervised Regression Algorithm for Grade Prediction of Students in Distance Learning Courses. Int. J. Artif. Intell. Tools 2019, 28, 1940001. [Google Scholar] [CrossRef]
  26. Haiyang, L.; Wang, Z.; Benachour, P.; Tubman, P. A time series classification method for behaviour-based dropout prediction. In Proceedings of the 18th IEEE International Conference on Advanced Learning Technologies, Mumbai, India, 9–13 July 2018; pp. 191–195. [Google Scholar]
  27. Heuer, H.; Breiter, A. Student Success Prediction and the Trade-Off between Big Data and Data Minimization. In Die 16. E-Learning Fachtagung Informatik; Krömker, D., Schroeder, U., Eds.; Gesellschaft für Informatik e.V.: Bonn, Germany, 2018; pp. 219–230. [Google Scholar]
  28. Doijode, V.; Singh, N. Predicting student success based on interaction with virtual learning environment. In Proceedings of the SouthEast SAS Users Group Conference, Bethesda, MD, USA, 16–18 October 2016; p. 10. [Google Scholar]
  29. Alshabandar, R.; Hussain, A.; Keight, R.; Laws, A.; Baker, T. The Application of Gaussian Mixture Models for the Identification of At-Risk Learners in Massive Open Online Courses. In Proceedings of the IEEE Congress on Evolutionary Computation, Rio de Janeiro, Brazil, 8–13 July 2018; pp. 1–8. [Google Scholar]
  30. Netto Silveira, P.D.; Lube Dos Santos, O. A predictive model of academic failure or success for institutional and trace data. In Proceedings of the 14th Latin American Conference on Learning Technologies, San Jose Del Cabo, Mexico, 30 October–1 November 2019; pp. 162–165. [Google Scholar]
  31. Netto Silveira, P.D.; Cury, D.; Menezes, C.; Dos Santos, O.L. Analysis of classifiers in a predictive model of academic success or failure for institutional and trace data. In Proceedings of the IEEE Frontiers in Education Conference, Covington, KY, USA, 16–19 October 2019; pp. 1–8. [Google Scholar]
  32. Kuzilek, J.; Vaclavek, J.; Fuglik, V.; Zdrahal, Z. Student Drop-out Modelling Using Virtual Learning Environment Behaviour Data. In European Conference on Technology Enhanced Learning; Springer: Cham, Switzerland, 2018; pp. 166–171. [Google Scholar]
  33. Hussain, M.; Zhu, W.; Zhang, W.; Abidi, S.M.R. Student Engagement Predictions in an e-Learning System and Their Impact on Student Course Assessment Scores. Comput. Intell. Neurosci. 2018, 2018, 6347186. [Google Scholar] [CrossRef] [Green Version]
  34. Hassan, S.U.; Waheed, H.; Aljohani, N.R.; Ali, M.; Ventura, S.; Herrera, F. Virtual learning environment to predict withdrawal by leveraging deep learning. Int. J. Intell. Syst. 2019, 34, 1935–1952. [Google Scholar] [CrossRef]
  35. Aljohani, N.R.; Fayoumi, A.; Hassan, S.U. Predicting at-risk students using clickstream data in the virtual learning environment. Sustainability 2019, 11, 7238. [Google Scholar] [CrossRef] [Green Version]
  36. Hlosta, M.; Zdrahal, Z.; Zendulka, J. Ouroboros: Early identification of at-risk students without models based on legacy data. In Proceedings of the 7th International Learning Analytics &Knowledge Conference, Vancouver, BC, Canada, 13–17 March 2017; pp. 6–15. [Google Scholar]
  37. Casalino, G.; Castellano, G.; Mencar, C. Incremental and Adaptive Fuzzy Clustering for Virtual Learning Environments Data Analysis. In Proceedings of the International Conference on Information Visualisation, Paris, France, 2–5 July 2019; pp. 382–387. [Google Scholar]
  38. Azizah, E.N.; Pujianto, U.; Nugraha, E. Comparative performance between C4.5 and Naive Bayes classifiers in predicting student academic performance in a Virtual Learning Environment. In Proceedings of the 4th International Conference on Education and Technology, Malang, Indonesia, 26–28 October 2018; pp. 18–22. [Google Scholar]
  39. He, Y.; Chen, R.; Li, X.; Hao, C.; Liu, S.; Zhang, G.; Jiang, B. Online at-risk student identification using RNN-GRU joint neural networks. Information 2020, 11, 474. [Google Scholar] [CrossRef]
  40. Ho, L.C.; Jin Shim, K. Data Mining Approach to the Identification of At-Risk Students. In Proceedings of the IEEE International Conference on Big Data, Seattle, WA, USA, 10–13 December 2018; pp. 5333–5335. [Google Scholar]
  41. Waheed, H.; Hassan, S.U.; Aljohani, N.R.; Hardman, J.; Alelyani, S.; Nawaz, R. Predicting academic performance of students from VLE big data using deep learning models. Comput. Hum. Behav. 2020, 104, 106189. [Google Scholar] [CrossRef] [Green Version]
  42. Qiao, C.; Hu, X. A Joint Neural Network Model for Combining Heterogeneous User Data Sources: An Example of At-Risk Student Prediction. J. Assoc. Inf. Sci. Technol. 2019, 71, 1192–1204. [Google Scholar] [CrossRef]
  43. Song, X.; Li, J.; Sun, S.; Yin, H.; Dawson, P.; Doss, R.R.M. SEPN: A Sequential Engagement Based Academic Performance Prediction Model. IEEE Intell. Syst. 2021, 36, 46–53. [Google Scholar] [CrossRef]
  44. Rizvi, S.; Rienties, B.; Khoja, S.A. The role of demographics in online learning; A decision tree based approach. Comput. Educ. 2019, 137, 32–47. [Google Scholar] [CrossRef]
  45. Waheed, H.; Anas, M.; Hassan, S.U.; Aljohani, N.R.; Alelyani, S.; Edifor, E.E.; Nawaz, R. Balancing sequential data to predict students at-risk using adversarial networks. Comput. Electr. Eng. 2021, 93, 107274. [Google Scholar] [CrossRef]
  46. Hlosta, M.; Zdrahal, Z.; Zendulka, J. Are we meeting a deadline? classification goal achievement in time in the presence of imbalanced data. Knowl.-Based Syst. 2018, 160, 278–295. [Google Scholar] [CrossRef] [Green Version]
  47. Adnan, M.; Habib, A.; Ashraf, J.; Mussadiq, S.; Raza, A.A.; Abid, M.; Bashir, M.; Khan, S.U. Predicting at-Risk Students at Different Percentages of Course Length for Early Intervention Using Machine Learning Models. IEEE Access 2021, 9, 7519–7539. [Google Scholar] [CrossRef]
  48. Zafra, A.; Romero, C.; Ventura, S. DRAL: A tool for discovering relevant e-activities for learners. Knowl. Inf. Syst. 2013, 36, 211–250. [Google Scholar] [CrossRef]
  49. Witten, I.H.; Frank, E.; Hall, M.A.; Pal, C.J. Data Mining: Practical Machine Learning Tools and Techniques, 4th ed.; Elsevier: Saint Louis, MO, USA, 2016; pp. 1–621. [Google Scholar]
  50. Quinlan, J.R. Induction of Decision Trees. Mach. Learn. 1986, 1, 81–106. [Google Scholar] [CrossRef] [Green Version]
  51. Salzberg, S.L. C4.5: Programs for Machine Learning by J. Ross Quinlan. Morgan Kaufmann Publishers, Inc., 1993. Mach. Learn. 1994, 16, 235–240. [Google Scholar] [CrossRef] [Green Version]
  52. Drmota, M. Random Trees: An Interplay between Combinatorics and Probability; Springer: New York, NY, USA, 2009; pp. 1–458. [Google Scholar]
  53. Breiman, L. Random forests. Mach. Learn. 2001, 45, 5–32. [Google Scholar] [CrossRef] [Green Version]
  54. Holte, R.C. Very Simple Classification Rules Perform Well on Most Commonly Used Datasets. Mach. Learn. 1993, 11, 63–90. [Google Scholar] [CrossRef]
  55. Martin, B. Instance-Based Learning: Nearest Neighbor with Generalization. Master’s Thesis, University of Waikato, Hamilton, New Zealand, 1995. [Google Scholar]
  56. Frank, E.; Witten, I.H. Generating accurate rule sets without global optimization. In Proceedings of the Fifteenth International Conference on Machine Learning, Hamilton, New Zealand, 24–27 July 1998; pp. 144–151. [Google Scholar]
  57. Gaines, B.R.; Compton, P. Induction of ripple-down rules applied to modeling large databases. J. Intell. Inf. Syst. 1995, 5, 211–228. [Google Scholar] [CrossRef]
  58. John, G.H.; Langley, P. Estimating Continuous Distributions in Bayesian Classifiers. In Proceedings of the 11th Conference on Uncertainty in Artificial Intelligence, Montreal, QC, Canada, 18–20 August 2013; pp. 338–345. [Google Scholar]
  59. Cessie, S.L.; Houwelingen, J.C.V. Ridge Estimators in Logistic Regression. Appl. Stat. 1992, 41, 191. [Google Scholar] [CrossRef]
  60. Chang, C.C.; Lin, C.J. LIBSVM: A Library for support vector machines. ACM Trans. Intell. Syst. Technol. 2011, 2, 1–27. [Google Scholar] [CrossRef]
  61. Zhang, T. Solving large scale linear prediction problems using stochastic gradient descent algorithms. In Proceedings of the Twenty-First International Conference on Machine Learning, Banff, AB, Canada, 4–8 July 2004; pp. 919–926. [Google Scholar]
  62. Meng, L.; Wu, Q.H. Fast training of Support Vector Machines using error-center-based optimization. Int. J. Autom. Comput. 2005, 2, 6–12. [Google Scholar] [CrossRef]
  63. Shalev-Shwartz, S.; Singer, Y.; Srebro, N.; Cotter, A. Pegasos: Primal estimated sub-gradient solver for SVM. Math. Program. 2011, 127, 3–30. [Google Scholar] [CrossRef] [Green Version]
  64. Hastie, T.; Tibshirani, R.; Friedman, J. The Elements of Statistical Learning: Data Mining, Inference and Prediction; Springer: New York, NY, USA, 2009; p. 744. [Google Scholar]
  65. Freund, Y.; Schapire, R.E. Experiments with a New Boosting Algorithm. In Proceedings of the 13th International Conference on Machine Learning, Bari, Italy, 3–6 July 1996; pp. 148–156. [Google Scholar]
  66. Breiman, L. Bagging predictors. Mach. Learn. 1996, 24, 123–140. [Google Scholar] [CrossRef] [Green Version]
  67. Dong, L. A Comparison of Multi-Instance Learning Algorithms. Master’s Thesis, University of Waikato, Hamilton, New Zealand, 2006. [Google Scholar]
  68. Frank, E.; Xu, X.; Zealand, N. Applying propositional Learning Algorithms to Multi-Instance Data; Computer Science Working Papers; University of Waikato: Hamilton, New Zealand, 2003. [Google Scholar]
  69. Demšar, J. Statistical comparisons of classifiers over multiple data sets. J. Mach. Learn. Res. 2006, 7, 1–30. [Google Scholar]
  70. Sammut, C.; Webb, G.I. Encyclopedia of Machine Learning; Springer: Boston, MA, USA, 2010; p. 892. [Google Scholar]
Figure 1. Typical course structured [13].
Applsci 11 10145 g001
Figure 2. Information about enrolled students and submitted assignments.
Applsci 11 10145 g002
Figure 3. Representation example based on simple instance of two students in course AAA.
Applsci 11 10145 g003
Figure 4. MIL representation example of two students in course AAA.
Applsci 11 10145 g004
Table 1. Comparison between proposals that use OULAD.
WorkAlgorithmCriteriaPrediction
[28]Decision TreeDemographic data. Number of clicks per day. Assignments data.Final outcome. All courses together.
[40]Decision TreeAssignments data.Final outcome: Fail vs. all. In courses CCC and FFF.
[44]Decision TreeDemographic data.Final outcome, excluding Withdraw. In course AAA, per presentation.
[30,31]J48Number of clicks per resource.Final outcome binarized in Pass+Distinction/Fail+Withdraw. All courses separately.
[33]J48Number of clicks per resource.Engagement to the course: a combination of the first assignment score, course final result and total number of clicks.
[47]Random ForestDemographic data. Number of clicks per day. Assignments score.Final outcome binarized in Pass+Distinction/Fail+Withdraw. All courses together. At different percentages of course length
[36,46]XGBoostDemographic data. Statistics over of clicks until the first assignment of the course.Deadline compliance. In courses BBB, DDD, EEE, FFF, only last presentation
[38]Naive BayesDemographic data. Total number of clicks, only in web page resource.Final outcome, only Pass or Fail. All courses together.
[27]Support Vector MachineDemographic data. Number of clicks per day.Final outcome binarized in Pass+Distinction/Fail+Withdraw. All courses together.
[29]Gaussian Mixture ModelNumber of clicks and number of sessions per resource and time-interval.Final outcome: Withdraw vs. all. Course BBB. At different intervals of the course.
[37]Dynamic Incremental Semi-Supervised Fuzzy C-MeansDemographic data. Number of clicks per resource. Assignments average score and number of submissions.Final outcome binarized in Pass+Distinction/Fail+Withdraw. Course DDD.
[26]Time Series ForestNumber of clicks per resource and day, only in 3 resources.Final outcome: Withdraw vs. all. All courses and presentations separately.
[32]Markov ChainsNumber of clicks per week in planned and non-planned activities.Final outcome: Withdraw vs. all. Course FFF, one presentation.
[3]Artificial Neural Network (ANN)Demographic data. Number of clicks per assignment. Assignment score.Regression of final score. Course DDD, by presentations.
[41]Deep Artificial Neural NetworkDemographic data. Number of clicks. Assignments data.Final outcome: Fail vs. all. In all courses. At different quarties of course.
[42]Joint Neural Network ModelDemographic data. Number of clicks per resource and day.Final outcome, only Pass or Fail. Courses BBB, CCC, FFF, one presentation.
[39]Recurrent Neural NetworkDemographic data. Number of clicks per week and resource. Assignment data.Final outcome binarized in Pass+Distinction/Fail+Withdraw. All courses together. At different weeks.
[43]Convolutional and recurrent deep modelDemographic data. Number of clicks. Assignment score.Final score discretized in six ranges. Course AAA.
[45]Up-sampling based on Adversarial Network + ANNNumber of clicks per resource and course quartiles.Final outcome, only Pass or Fail. All courses together.
[34]LSTMNumber of clicks per week of 25 first weeks.Final outcome: Withdraw vs. all.
[35]LSTMNumber of clicks per week.Final outcome, only Pass or Fail. All courses together.
Table 2. Information of each course.
CourseCallsEnrollmentsAssignmentsSubmissionsNo-Pass Rate
AvgSDTMACMATMACMA
AAA2374.0012.73504.4729%
BBB41977.25338.34654.474.1253%
CCC22217.00397.39442.892.9162%
DDD41568.00354.18674.635.0258%
EEE3978.00255.18403.4344%
FFF41940.50446.52573.966.0453%
GGG3844.67102.00362.695.1540%
Table 3. Available information of each assignment.
AttributeDescription
assignment_typeType of assignment: TMA or CMA.
assignment_weightA number in range [ 0 , 100 ] that represents the weight of the assignment in the course.
assignment_advanceThe number of days in advance with which the student submitted the assignment.
assignment_scoreThe score of the student in the assignment in range [ 0 , 100 ] .
assignment_bankedA boolean flag that indicates if the assignment has been transferred from a previous presentation.
Table 4. Fragment of ARFF header for simple instance representation in course AAA.
CodeAttributes
@relation assignments-course-AAA
@attribute 1-assignment_type { TMA, CMA }
 
@attribute 1-assignment_weight numeric

 
@attribute 5-assignment_score numeric
@attribute 5-assignment_banked numeric
 
@attribute final_result { pass, no_pass }
 
@data
5 × assignment_type
5 × assignment_weight
5 × assignment_advance
5 × assignment_score
5 × assignment_banked
Total: 25 attributes


Table 5. Fragment of ARFF representation for simple instance representation in course DDD.
CodeAttributes
@relation assignments-course-DDD
 
@attribute 1-assignment_type { TMA, CMA }
@attribute 1-assignment_weight numeric

 
@attribute 7-assignment_type { TMA, CMA }
@attribute 7-assignment_weight numeric

 
@attribute 13-assignment_score numeric
@attribute 13-assignment_banked numeric
 
@attribute final_result { pass, no_pass }
 
@data
13 × assignment_type
13 × assignment_weight
13 × assignment_advance
13 × assignment_score
13 × assignment_banked
Total: 65 attributes


Table 6. Fragment of ARFF header for multiple instance representation in any course.
CodeAttributes
@relation assignments-course
 
@attribute id_student-code_course-code_presentation {...}
@attribute bag relational
@attribute assignment_type { TMA, CMA }
@attribute assignment_weight numeric
@attribute assignment_advance numeric
@attribute assignment_score numeric
@attribute assignment_banked numeric
@end bag
@attribute final_result { pass, no_pass }
 
@data
1 × assignment_type 1 × assignment_weight
1 × assignment_advance
1 × assignment_score
1 × assignment_banked
Total: 5 attributes


Table 7. Configuration of the studied algorithms I.
AlgorithmParameterValueAlgorithmParameterValue
Decision Stump--ZeroR--
J48binarySplitsFalseOneRminBucketSize6
collapseTreeTrueNNgenumAttemptsOf
GeneOption5
confidenceFactor0.25numFolderMIOption5
doNotMakeSplit PointActualValueFalsePARTbinarySplitsFalse
minNumObj2confidenceFactor0.25
numFolds3doNotMakeSplit PointActualValueFalse
reduceErrorPruningFalseminNumObj2
useLaplaceFalsenumFolds 3
useMDLcorrectionTruereduceErrorPruningFalse
Random TreeallowUnclassified InstancesFalseuseMDLcorrectionTrue
breakTiesRandomlyFalseRidorfolds3
maxDepth0majorityClassFalse
minNum1.0minNo2.0
minVarianceProp0.001shuffle1
Random ForestbagSizePercent100wholeDataErrFalse
breakTiesRandomlyFalseNaive BayesuseKernelEstimatorFalse
computeAttribute ImportanceFalseuseSupervised DiscretizationFalse
maxDepth0LogisticmaxIts−1
numFeatures0ridge 1 × 10 8
numIterations100useConjugate GradientDescentFalse
Table 8. Configuration of the studied algorithms II.
AlgorithmParameterValueAlgorithmParameterValue
LibSVMSVMTypeC-SVCMultilayer PerceptrondecayFalse
coef00hiddenLayersa
cost1.0learningRate0.3
degree3momentum0.2
doNotReplace MissingValuesFalsenormalize AttributesTrue
eps0.001resetTrue
gamma0.0trainingTime500
kernelTyperadialvalidationThreshold20
normalizeFalseRBF NetworkmaxIts−1
probability EstimatesFalseminStdDev0.1
shrinkingTruenumClusters2
SGDdontNormalizeFalseridge 1 × 10 8
dontReplace MissingFalseAdaBoost-Random ForestnumIterations10
epochs500useResamplingFalse
lambda 1 × 10 4 weightThreshold100
learningRate0.01AdaBoost-PARTnumIterations10
lossFunctionSVMuseResamplingFalse
SMObuildCalibration ModelsFalseweightThreshold100
c1.0AdaBoost-Naive BayesnumIterations10
epsilon 1 × 10 12 useResamplingFalse
filterTypeNormalizetrainingweightThreshold100
kernelPolyKernelBagging—Random ForestbagSizePercent100
toleranceParameter0.001numIterations10
SPegasosdontNormalizeFalseBagging—PARTbagSizePercent100
dontReplace MissingFalsenumIterations10
epochs500Bagging—Naive BayesbagSizePercent100
lambda 1 × 10 4 numIterations10
lossFunctionSVM
Table 9. Wilcoxon signed-rank test between MIL wrappers.
WrapperComparison R + R p-Value
SimpleMIConf. 1 vs. Conf. 212,740.5300.5 4.78 × 10 25
MIWrapperConf. 1 vs. Conf. 28274.04606.0 5.19 × 10 4
Conf. 1 vs. Conf. 312,846.0195.0 2.32 × 10 25
Conf. 2 vs. Conf. 312,847.0194.0 2.28 × 10 25
Table 10. Accuracy results by algorithm and courses I/II.
AAABBBCCC
TraditionalSimpleMIWrapperMITraditionalSimpleMIWrapperMITraditionalSimpleMIWrapperMI
Trees methodsDecisionStump0.7100.9180.7890.6550.8230.6270.7940.7880.740
J480.7050.9190.8090.5690.9010.7700.6220.8990.845
RandomTree0.6930.8680.7960.6240.8530.7500.7010.8600.832
RandomForest0.7270.9040.8180.6190.8860.7540.6910.8870.843
Rules methodsZeroR0.7100.7520.7520.5250.6180.6180.6220.5090.509
OneR0.7100.9180.7750.6530.9020.6270.8000.8890.712
NNge0.9090.8980.7790.5010.8770.6570.4150.8680.578
PART0.7090.9200.8120.5690.8990.7790.6300.9000.846
Ridor0.8990.9020.7440.9150.8590.5690.9010.8500.655
NaiveBayes0.7300.9210.8100.7850.7350.7060.8230.7790.807
Logistic0.7220.9250.7880.7970.8070.7400.9040.8370.822
SVM methodsLibSVM0.8060.9160.7590.8510.8320.6580.8300.8610.752
SPegasos0.3010.9130.7590.4890.7950.6270.4540.8240.662
SGD0.7330.9150.7550.7550.8050.6270.8150.8360.729
SMO0.7210.9180.7590.7410.8080.7350.8060.8370.815
ANN methodsRBFNetwork0.7580.8590.8130.8560.9070.6870.8820.8730.829
MultilayerPerceptron0.8790.9190.8080.9110.9390.7600.9180.9070.837
Ensembles methodsAdaBoost&RandomForest0.6560.9050.8130.7430.8850.7540.6890.8840.838
AdaBoost&PART0.7380.9180.8110.6990.8940.7780.7150.8940.847
AdaBoost&NaiveBayes0.7300.9210.8090.7900.8050.7530.8360.7880.830
Bagging&RandomForest0.7260.9190.8200.6250.9050.7600.6900.9030.845
Bagging&PART0.7150.9150.8110.5620.8950.7780.6290.8920.848
Bagging&NaiveBayes0.7320.9200.8090.7850.6990.6830.8260.7770.795
Table 11. Accuracy results by algorithm and courses II/II.
DDDEEEFFFGGG
TraditionalSimpleMIWrapperMITraditionalSimpleMIWrapperMITraditionalSimpleMIWrapperMITraditionalSimpleMIWrapperMI
Trees methodsDecisionStump0.6670.7750.7240.6460.9030.7180.6610.9060.7970.6070.9070.717
J480.5840.8630.8090.5930.8980.8160.5300.9310.8680.5970.9080.784
RandomTree0.5840.8280.7760.5960.8720.7890.6670.9090.8300.5900.8620.771
RandomForest0.5840.8550.7970.6030.8880.7990.6590.9290.8480.6000.9000.771
Rules methodsZeroR0.5840.5280.5280.5620.7180.7180.5300.5800.5800.5980.7170.717
OneR0.6650.8440.6680.6460.9040.7290.6560.9240.6110.6030.9070.720
NNge0.8630.8300.6950.9110.8710.7220.5060.9180.6370.6120.8870.635
PART0.5840.8620.8120.5880.9000.8050.5780.9310.8740.5930.9080.791
Ridor0.8760.8330.6180.9070.8920.7390.9410.9150.6700.9050.8680.697
NaiveBayes0.8170.7650.7420.6020.9000.7730.7890.9100.8320.5880.9020.814
Logistic0.8330.8420.7800.8020.8990.7940.9170.9150.8260.6100.9070.743
SVM methodsLibSVM0.8140.8430.7240.8840.8960.7610.8450.9090.6620.8540.8460.7232
SPegasos0.5830.8400.7670.4430.9020.7480.4950.9110.6010.5980.9070.717
SGD0.7960.8470.6880.6070.8950.7220.7190.9110.5940.6040.9070.717
SMO0.7870.8450.7710.5920.8950.7810.7860.9060.7930.6000.9070.717
RBFNetwork0.7580.7990.7680.8560.9020.7930.8820.9090.8370.6940.9040.790
ANN methodsMultilayerPerceptron0.8790.8550.7870.9110.9030.8070.9180.9300.8700.8810.9070.784
Ensembles methodsAdaBoost&RandomForest0.7610.8570.7860.6790.8890.7920.8050.9260.8380.7280.8980.769
AdaBoost&PART0.6230.8590.8080.7210.8940.7990.7010.9290.8730.6770.9040.793
AdaBoost&NaiveBayes0.8200.8140.7670.8180.9000.7790.8380.9100.8550.5880.9020.809
Bagging&RandomForest0.5840.8680.7980.6020.9010.8030.6670.9350.8540.6020.9120.775
Bagging&PART0.5840.8610.8170.5970.8960.8120.5850.9310.8760.5980.9050.790
Bagging&NaiveBayes0.8180.7430.7300.6010.9000.7710.7890.9110.8200.5930.9020.816
Table 12. Average results by algorithm for all courses.
AccuracySensitivitySpecificity
TraditionalSimpleMIWrapperMITraditionalSimpleMIWrapperMITraditionalSimpleMIWrapperMI
Trees methodsDecisionStump0.6770.8600.7300.4580.94909350.8220.7030.300
J480.6000.9030.8140.4340.9530.9590.5920.8020.505
RandomTree06360.8650.7920.5040.8890.9510.6160.8070.463
RandomForest06400.8930.8040.5100.9310.9570.6100.8100.485
Rules methodsZeroR0.5900.6310.6310.4290.8570.8570.5710.1430.143
OneR0.6760.8980.6920.4580.9660.9850.8180.7700.156
NNge0.6740.8780.6720.9540.9050.8910.3970.8140.298
PART0.6070.9030.8170.4430.9490.9570.6040.8060.515
Ridor0.9060.8740.6700.9480.9490.8710.7320.7200.291
NaiveBayes0.7330.8440.7830.8510.9380.9550.5600.6760.440
Logistic0.7980.8760.7850.8220.9450.9620.7160.7380.417
SVM methodsLibSVM0.8410.8720.7200.9780.9200.9890.6670.7690.218
SPegasos0.4800.8700.6970.5480.9480.9640.4830.7170.193
SGD0.7180.8740.6900.7280.9500.9680.5870.7200.142
SMO0.7190.8740.7670.7220.9530.9650.5850.7160.354
ANN methodsRBFNetwork0.8120.8790.7880.8610.9470.9540.6470.7270.433
MultilayerPerceptron0.8990.9090.8080.9190.9430.9540.7570.7880.498
Ensembles methodsAdaBoost&RandomForest0.7230.8920.7980.6070.9300.9530.7190.8100.478
AdaBoost&PART0.6960.8990.8160.6840.9460.9560.6170.7990.514
AdaBoost&NaiveBayes0.7740.8630.8000.8430.9250.9490.6170.7380.488
Bagging&RandomForest0.6420.9060.8080.5130.9580.9570.6100.7990.495
Bagging&PART0.6100.8990.8190.4440.9400.9590.6030.8110.518
Bagging&NaiveBayes0.7350.8360.7750.8490.9450.9580.5250.6480.416
Table 13. Wilcoxon signed-rank test results for accuracy measure.
Comparison R + R p-Value
SimpleMI vs. Traditional2733 1.192 × 10 6
MIWrapper vs. Traditional212620.02332
SimpleMI vs. MIWrapper2750 4.768 × 10 7
Table 14. Wilcoxon signed-rank test results for sensitivity measure.
Comparison R + R p-Value
SimpleMI vs. Traditional2697 4.53 × 10 6
MIWrapper vs. Traditional2697 4.53 × 10 6
SimpleMI vs. MIWrapper442310.003252
Table 15. Wilcoxon signed-rank test results for specificity measure.
Comparison R + R p-Value
SimpleMI vs. Traditional239370.001279
MIWrapper vs. Traditional0276 2.384 × 10 7
SimpleMI vs. MIWrapper2750 4.768 × 10 7
Table 16. Comparison with previous works that uses same algorithms from a traditional learning perspective.
AlgorithmCoursePrevious WorkProposed MIL Approach
Ref.Assign.ClicksDemog.Acc.Assign.ClicksDemog.Acc.
Decision treeCCC [40]X 86.6%X 89.9%
FFF 79.4%X 93.1%
AAA [44] X83.1%X 91.9%
J48All courses [30] X 86.7%X 90.3%
[33] X 88.5%
RandomForestAll courses [47]XXX81.8%X 89.3%
[26] X 86.2%
NaiveBayesAll courses [38] XX63.8%X 84.4%
SVMAll courses [27] XX88.0%X 87.2%
ANNAll courses [45] X 89.0%X 90.9%
Table 17. Comparison with previous works that use different algorithms from a traditional learning perspective.
CoursePrevious WorkProposed MIL Approach
Ref.AlgorithmAssign.ClicksDemog.Acc.AlgorithmAssign.ClicksDemog.Acc.
BBB [29]Gaussian Mixture X 85.5%Multilayer PerceptronX 93.9%
DDD [37]Dynamic Incremental
Semi-supervised
Fuzzy C-means
XXX89.3%Bagging & RandomForestX 86.8%
AAA [43]Convolutional and
Recurrent Deep Model
XXX61.0%PARTX 92.0%
All courses [41]
[39]
[45]
Deep ANN
Recurrent Neural Network
Adversarial Network + ANN
X
 
 
X
X
X
X
X
 
84.5%
75.0%
89.0%
 
Multilayer
Perceptron
 
X


90.9%
 
Publisher’s Note: MDPI stays neutral with regard to jurisdictional claims in published maps and institutional affiliations.

