Article

Application of ANN in Predicting the Cantilever Wall Deflection in Undrained Clay

Key Laboratory of Geotechnical and Underground Engineering of Ministry of Education, Department of Geotechnical Engineering, Tongji University, Shanghai 200092, China
*
Author to whom correspondence should be addressed.
Appl. Sci. 2021, 11(20), 9760; https://doi.org/10.3390/app11209760
Submission received: 18 August 2021 / Revised: 27 September 2021 / Accepted: 18 October 2021 / Published: 19 October 2021
(This article belongs to the Section Civil Engineering)

Abstract

:
The main objective of this study is to propose an artificial neural network (ANN)-based tool for predicting the cantilever wall deflection in undrained clay. The excavation width, the excavation depth, the wall thickness, the at-rest lateral earth pressure coefficient, the soil shear strength ratio at mid-depth of the wall, and the soil stiffness ratio at mid-depth of the wall were selected as the input parameters, whereas the cantilever wall deflection was selected as an output parameter. A set of verified numerical data were utilized to train, test, and validate the ANN models. Two commonly used performance indicators, namely, root mean square error (RMSE) and mean absolute error (MAE), were selected to evaluate the performance of the proposed model. The results indicated that the proposed model can reliably predict the cantilever wall deflection in undrained clay. Moreover, the sensitivity analysis showed that the excavation depth is the most important parameter. Finally, a graphical user interface (GUI) tool was developed based on the proposed ANN model, which is much easier and less expensive to be used in practice. The results of this study can help engineers to better understand and predict the cantilever wall deflection in undrained clay.

1. Introduction

In recent decades, embedded retaining structures have been increasingly used for excavations in urban areas around the world [1,2,3,4]. The cantilever wall is a conventional earth-retaining structure with a relatively simple construction process and is commonly used for excavations no more than 6 m deep. Generally, they provide open excavations and do not require bracing or anchoring. However, excavation work will inevitably cause cantilever wall deflection, i.e., the wall top displacement, and ground movement, ultimately posing a risk to adjacent structures. Therefore, the control of deformation is as important as the safety requirements against collapse in the design of such retaining walls [5,6]. In this regard, an accurate and practical tool for predicting the cantilever wall deflection should be of great interest to engineers and stakeholders.
Numerous studies have been conducted to analyze the cantilever wall deflection using various methods, such as field measurements [7,8,9], centrifuge modelling tests [10,11], numerical analyses [12,13,14,15,16], and analytical methods [17,18,19]. Zhou et al. [9] analyzed the monitoring data of diaphragm wall deflection using a Bayesian network. Kunasegaram et al. [11] developed a centrifuge modelling system to study the response of a cantilever retaining wall. Hashash et al. [12] conducted a series of numerical analyses to investigate the ground movement caused by deep excavations in soft clay. Sert et al. [13] studied the effect of soil spatial variability on the excavation-induced lateral wall deflection through a large number of numerical simulations. Zhang et al. [16] developed a simplified polynomial regression model to predict the maximum wall deflection. More recently, Qi et al. [19] developed an efficient probabilistic back-analysis method for braced excavations using wall deflection data at multiple points. Generally, it is noted that the studies of field measurement and centrifuge modelling test are of high cost, and thus it is hard to obtain sufficient datasets. The analytical method is relatively rapid and of low cost, but the existing ones are commonly quite complex and sensitive to the input parameters, which are hard for engineers to validate from case to case. Numerical analysis [15] is most commonly used by the researchers among the above-mentioned investigated methods. However, it requires special soil testing to calibrate the parameters used in soil constitutive models and lengthy computer calculations [16], which are practically unrealistic especially at the preliminary design stage.
As an alternative, machine learning (ML) algorithms have recently been introduced in the field of geotechnical engineering because of their advantages in dealing with nonlinear complicated problems [20,21,22]. One of the strongest ML algorithms is the so-called artificial neural network (ANN), which is widely used in predicting the ground displacements or the response of retaining structures. In general, traditional prediction methods such as the numerical approach generally need intensive simulations to obtain enough analysis results. Recently developed ANN models can be used as a convenient and reliable substitute for time-consuming field measurements or numerical analyses so that less computational power is needed for further studies. Considering the power of artificial neural networks (ANN) to solve nonlinear complicated problems, the application of ANNs in geotechnical problems is quite promising and can provide powerful tools for civil engineers in practice.
In the past decades, many researchers have tried to apply ANN-based models to geotechnical problems. For instance, Chua and Goh [20] proposed a Bayesian neural network-based approach to predict the wall deflections in deep excavations. Gowda et al. [21] used the ANN approach to predict the optimized cantilever earth retaining wall. Ozturk et al. [22] evaluated the earthquake-induced deformation of geosynthetic reinforced retaining walls by an ANN-based method. Alias et al. [23] predicted the stability of cantilever retaining walls based on an ANN-based approach. Gordan et al. [24] adopted the neural network technique to estimate the safety factors of retaining wall under different loading conditions. Zhang et al. [25] estimated the deflections of diaphragm walls caused by a deep braced excavation through the ANN model. More recently, Mishra et al. [26] reported their work on proposing a probabilistic design procedure of a retaining wall using the ANN method. It is concluded that ANNs were widely applied in the field of geotechnical engineering. However, the application of ANN in predicting the cantilever wall deflection has not yet been investigated. Moreover, the study by Nguyen et al. [27] also indicated that an ANN-based prediction tool, which is much simpler and cost-efficient, can be developed for easy application in practical engineering.
In view of the above limitations, this study is devoted to predicting the cantilever wall deflection in undrained clay based on a machine learning model, namely, an artificial neural network (ANN). First, a database of cantilever wall deflections was generated from rigorously verified finite element models. Then, six important factors were utilized as the input parameters for the proposed ANN model, while the cantilever wall deflection in undrained clay was set as the output parameter. The acceptable performance of the developed ANN model was verified, and the relative importance of various input parameters on the cantilever wall deflection was highlighted. Finally, an explicit mathematical equation as well as a graphical user interface (GUI) tool were established using the developed ANN model to facilitate the prediction of the cantilever wall deflection in undrained clay.

2. Materials and Methods

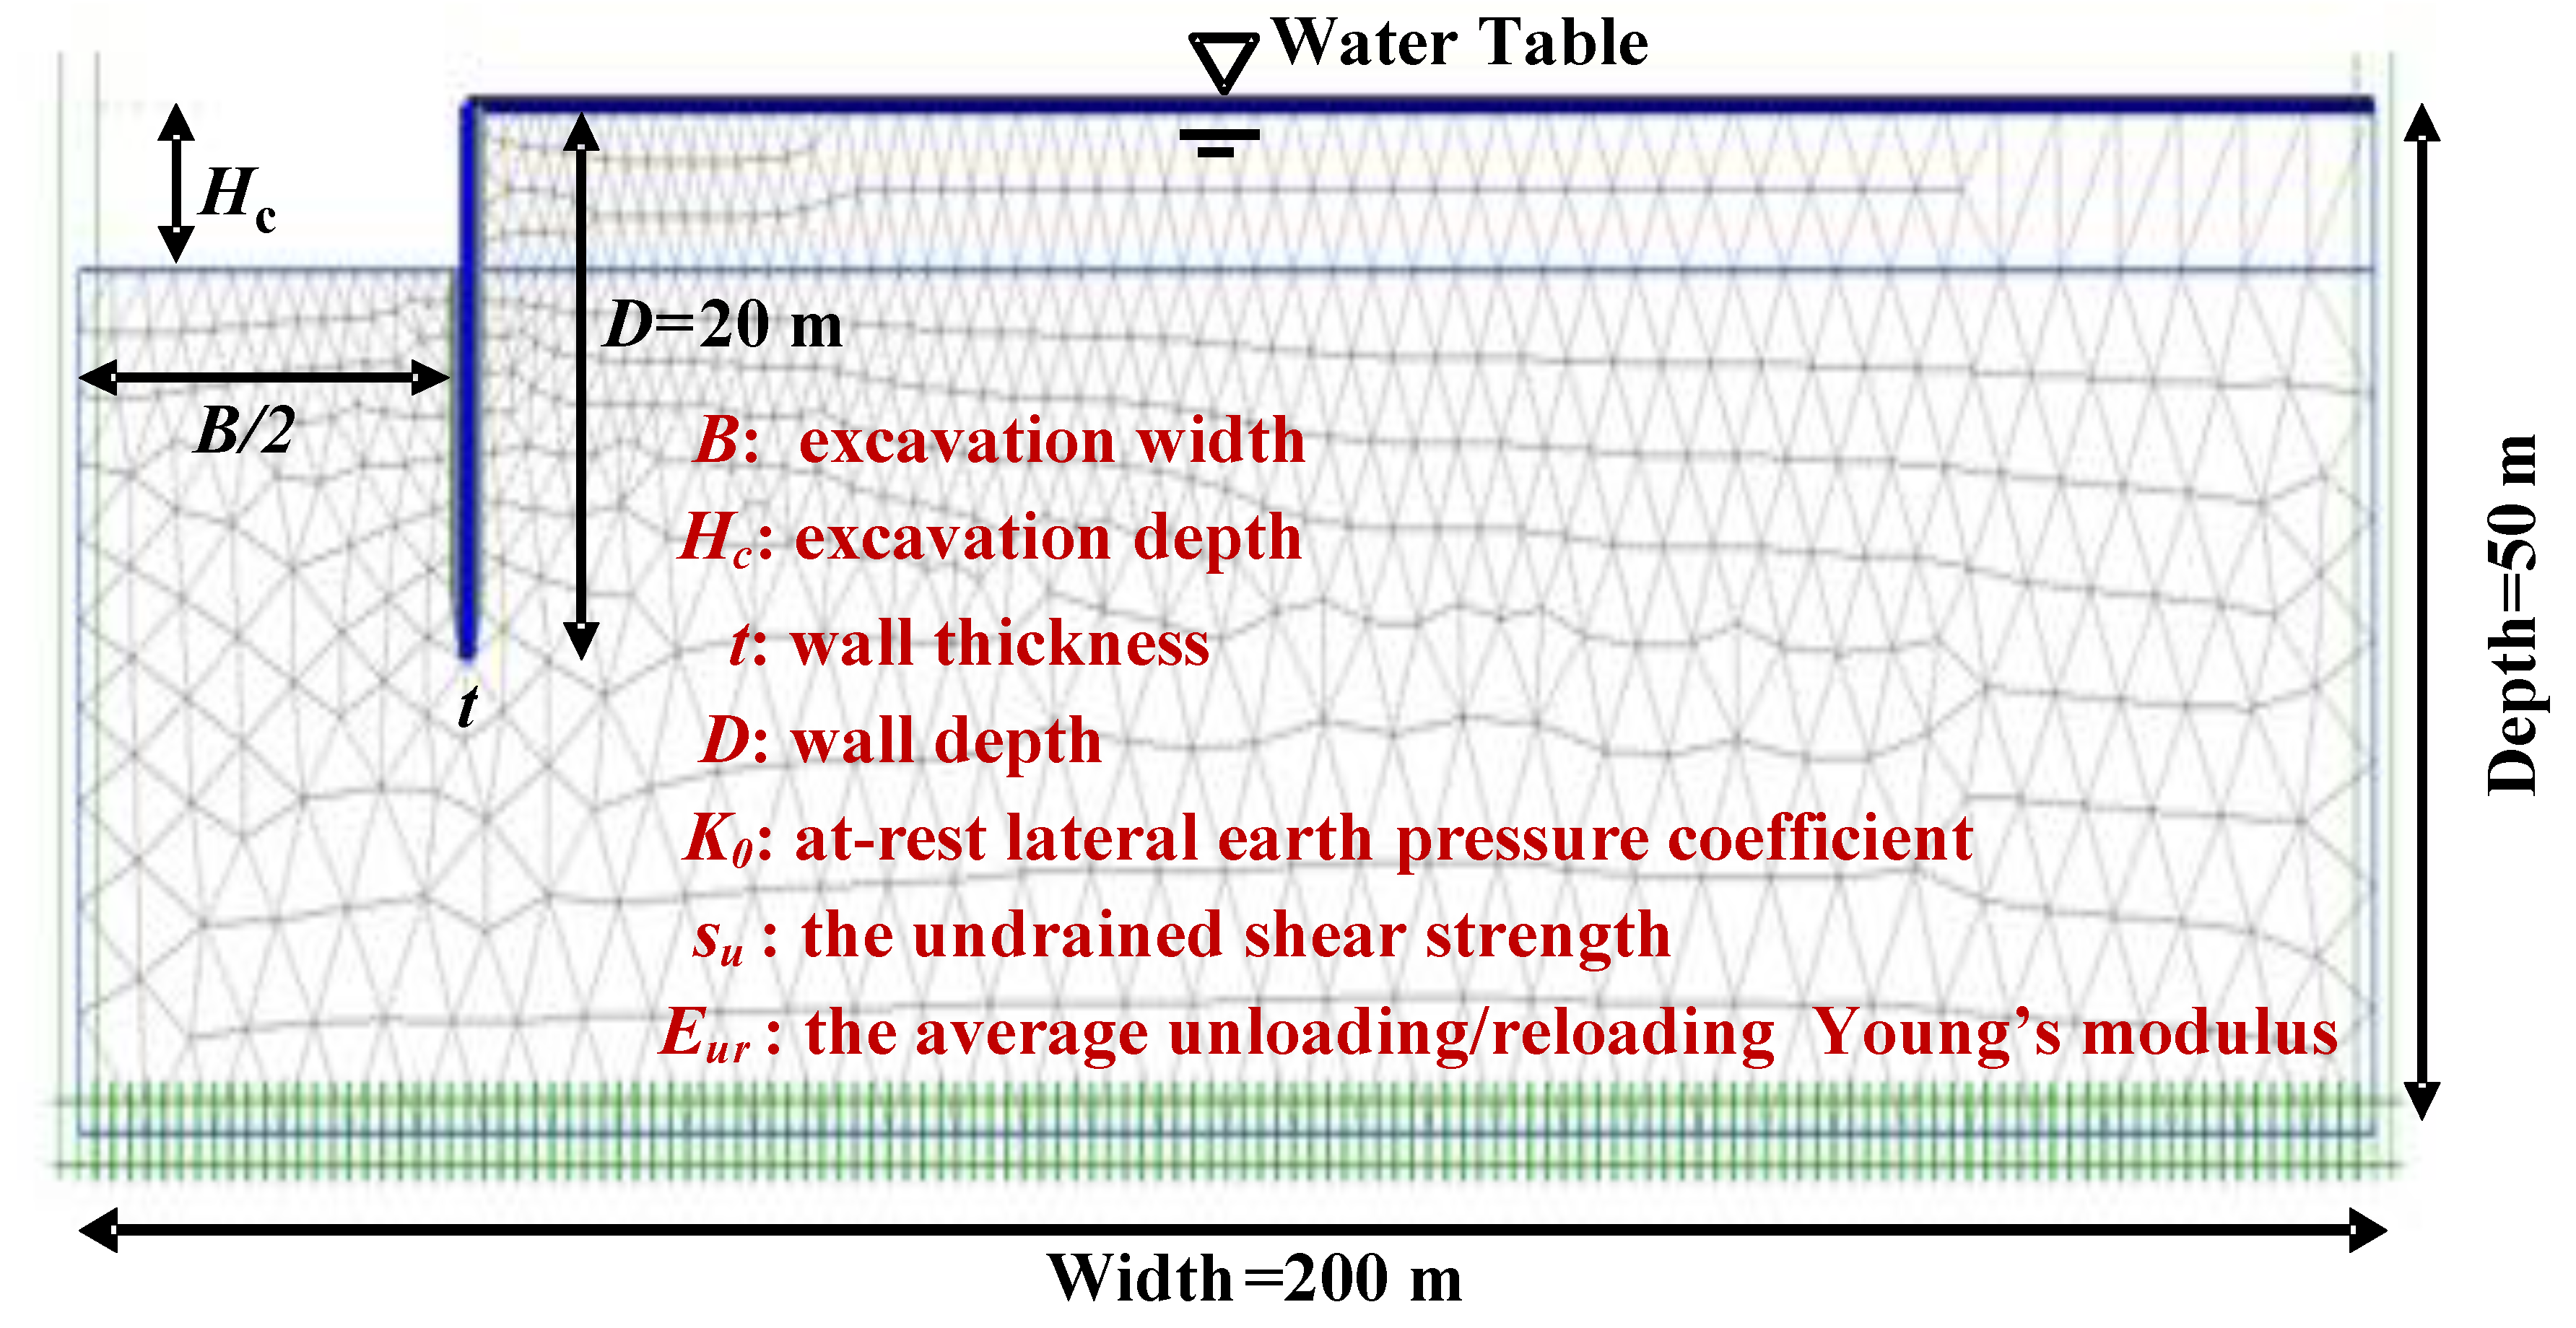
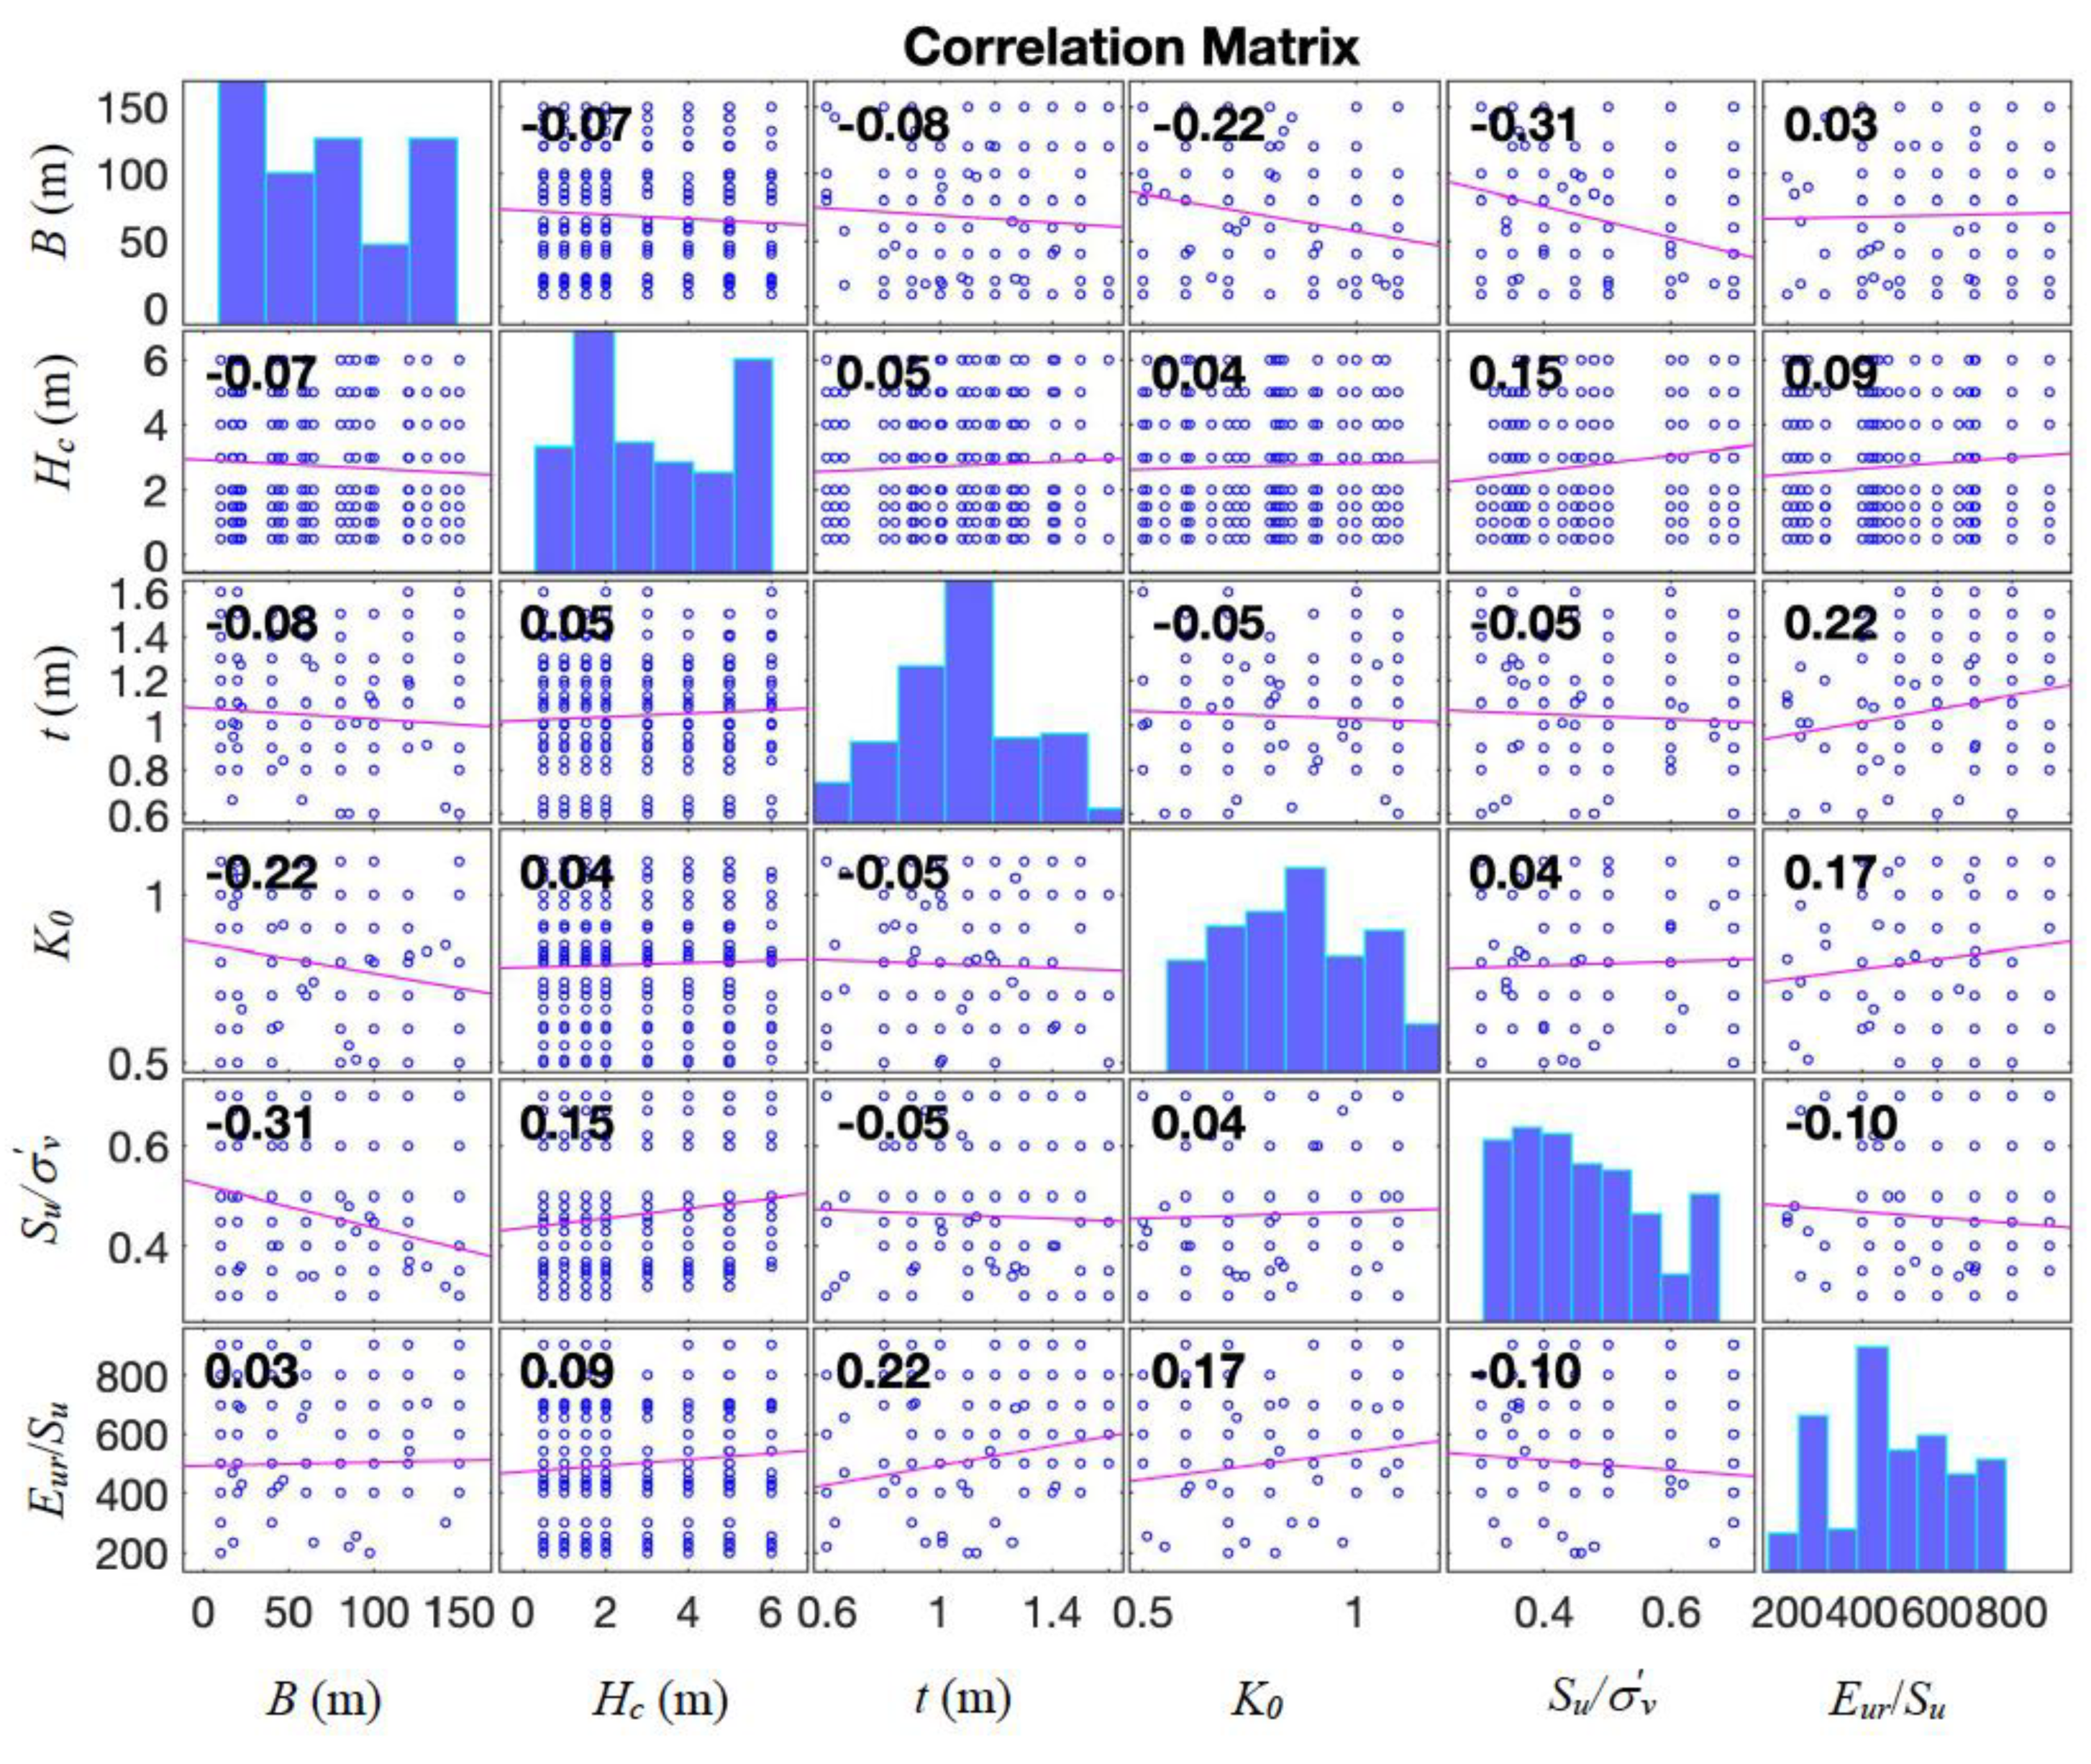
2.1. Generation of Database

In this study, the database was constructed through a series of numerical simulations. The finite element model of the soil–cantilever wall system was built by Plaxis 2D, a commercial software. The typical numerical model is shown in Figure 1. As the soil small strain behavior is well recognized from the case histories, the Hardening Soil model with small strain stiffness (HSsmall) available in Plaxis is used for the simulation of clays in this study. The HSsmall model includes not only the stress dependency but also the strain dependency of the soil stiffness. The undrained condition was assumed for the analyses [28,29]. The retaining wall is linear elastic. A half width of the excavation was modeled because of symmetry of the problem. The size of the finite element mesh depends on the excavation size for each case history. The adopted finite element mesh is presented in Figure 1. Basically, four times the wall length was required for the distance from the wall to the right-side boundary [6]. The bottom boundary was set to 50 m deep to minimize the effect of the presence of bottom boundary on the wall deflection [15], and it was restricted from both horizontal and vertical movements, while the left- and right-side boundaries were only restricted horizontally. Moreover, the soil mass and the retaining structure were modelled by about 1200 15-node triangular soil elements and 15 5-node plate elements, respectively.
It is worth noting that the finite element method (FEM) analysis was rigorously verified based on 14 centrifuge tests and 45 field cases [30]. Figure 2 presents the comparisons between the cantilever wall deflections δFEM, i.e., the wall top displacements, calculated by Plaxis 2D and the measured displacements δm. Since the results of FEM were quite close to the 45° trend line, the rationality of the analysis of FEM was demonstrated. Therefore, the use of database from the verified finite element model in ANN is appropriate and reliable. More detailed information about the numerical models used and the validation process can be found in the authors’ previous work [30]. As a result, a total of 191 numerical simulations of the soil–cantilever wall system were conducted, and the corresponding numerical data of the cantilever wall deflection δ as well as other associated parameters were obtained.
From the above numerical results, it is noted that the cantilever wall deflection δ is significantly influenced by the excavation width B, the excavation depth Hc, the wall thickness t, the at-rest lateral earth pressure coefficient K0, the soil shear strength ratio at mid-depth of the wall su/σv, and the soil stiffness ratio at mid-depth of the wall Eur/su. Therefore, these six important parameters were selected as the main influential factors used in the following ANN model. Finally, as described previously, a total of 191 results of finite element analyses of the cantilever wall deflection were used, and the statistical analysis of these data sets is presented in Table 1. In this database, the excavation width B is distributed between 10.00 and 150.00 m, the excavation depth Hc is distributed between 0.50 and 6.00 m, the wall thickness t is distributed between 0.60 and 1.60 m, the at-rest lateral earth pressure coefficient K0 is distributed between 0.50 and 1.10, the soil shear strength ratio at mid-depth of the wall su/σv is distributed between 0.30 and 0.70, and the soil stiffness ratio at mid-depth of the wall Eur/su is distributed between 199.38 and 900.00.
Figure 3 presents the relationship between each input and output parameter. The results in Figure 4 indicate that the correlation between all input parameters is weak, so the input datasets used in this study are appropriate.

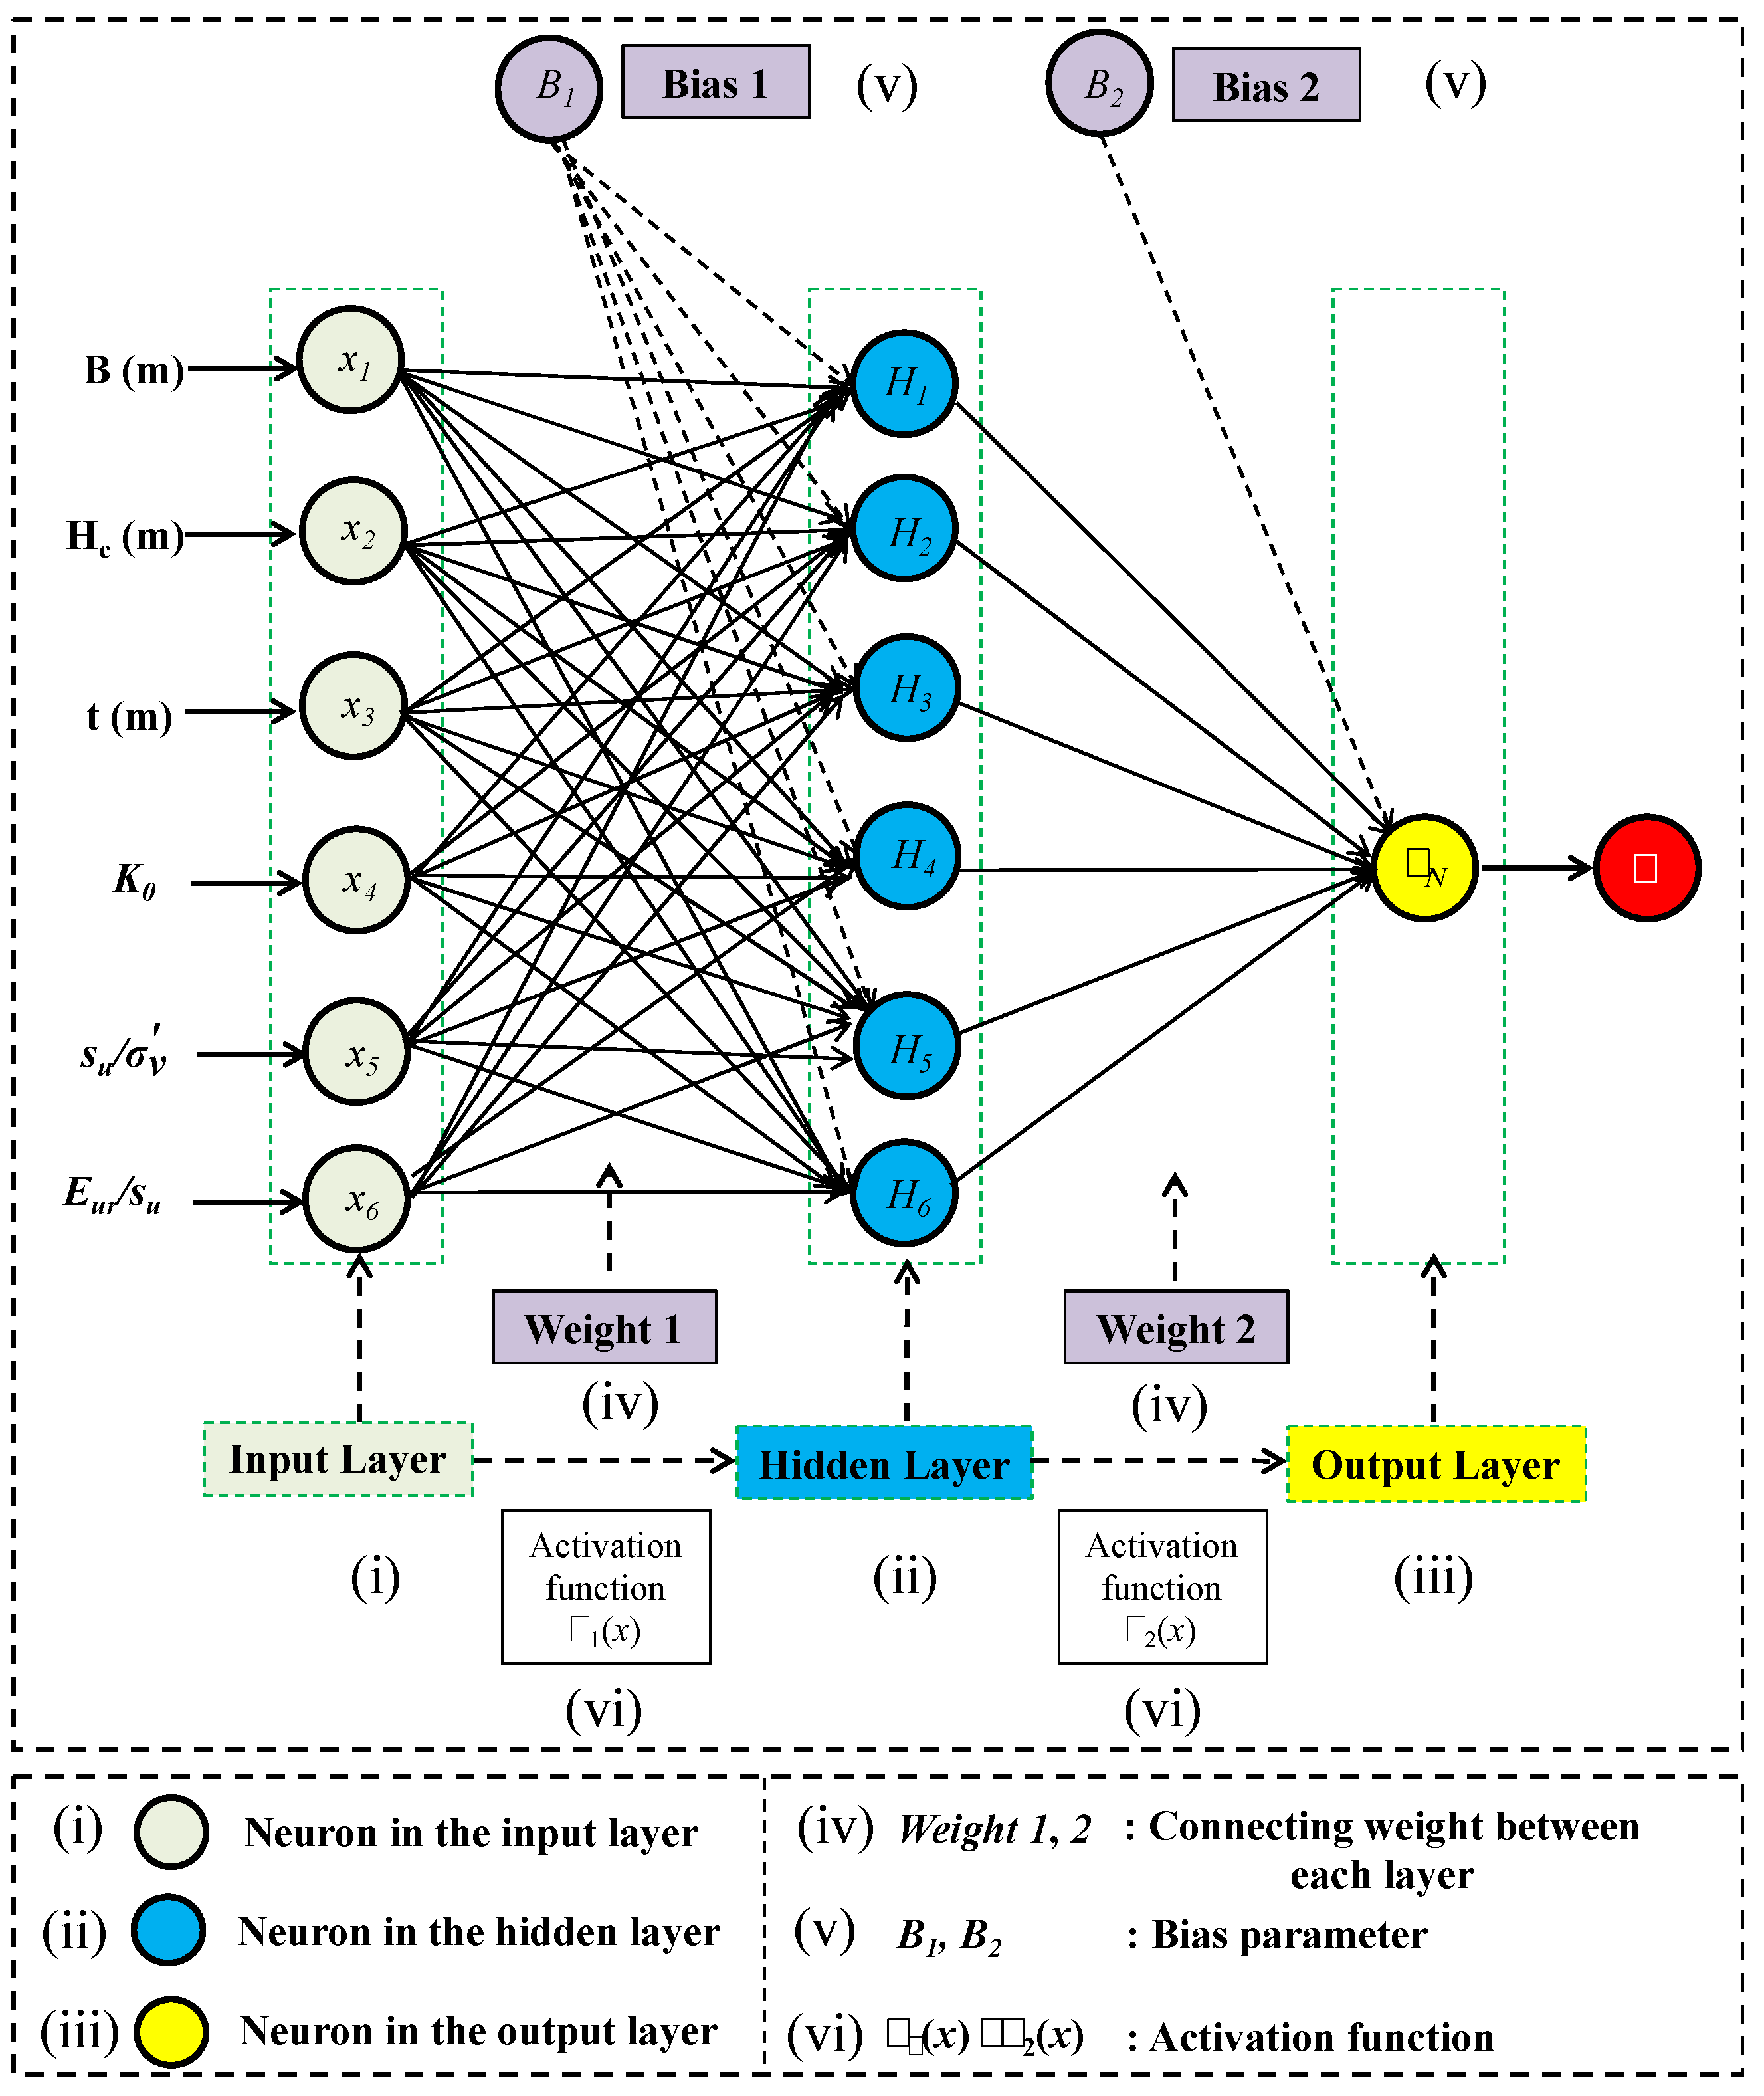
2.2. Introduction of ANN

The ANN, which works similarly to human cognition, is one of the best machine learning models to handle complex nonlinear problems, and it has been successfully applied to many geotechnical problems. Typically, an ANN model consists of an input layer, one or more hidden layers, and an output layer. The input layer receives the information from the input data and transforms it into the hidden layer. The hidden layer and the output layer perform the complex computations of the ANN model. In this work, the ANN model was constructed in the spirit of multilayer perceptron, typically trained using the feed-forward back-propagation algorithm [31]. For simplicity, only one hidden layer was used, as previous research [32,33] has reported that the ANN model with one hidden layer can perform well in handling similar problems. Hence, the final ANN model consisted of a single input, hidden, and output layer.
The so-called weights, biases, and activation functions are used to connect to the neurons of different layers, and based on them, the whole ANN model can be represented in a mathematical form, as shown below:
Y = f   ( X )
f   ( X ) = f 2 ( b 2 + W 2 × ( f 1 ( b 1 + W 1 × X ) ) )
where Y is the final output for the ANN model; X is the matrix of input parameters; f1, B1, W1 are the activation function, the weight matrix, and the biases vector of the hidden layer, respectively; and f2, B2, W2 are the activation function, the weight matrix, and the biases vector of the output layer, respectively. For the activation functions, this study adopted the commonly used LOGSIG function and PURELIN function in the hidden and output layers, respectively. Their functions are presented in Figure 5.
In the training process of the ANN model, the connecting weights and biases are adjusted to minimize the error of the ANN. A term named the mean square error (MSE) is widely utilized to terminate the training of the model. The MSE can be calculated by Equation (3) below:
MSE = 1 N i = 1 N ( e i ) 2
where N represents the number of input datasets; ei is the difference between the predicted and actual results.

2.3. Architecture of the Developed ANN Model for Cantilever Wall Deflection

To select the appropriate hidden neurons to obtain the best ANN geometry, a trial- and-error procedure was performed. First, the collected datasets were normalized in a range of −1 and 1 based on Equation (4) to achieve dimensional consistency for all the parameters and avoid potential overfitting issues.
Z n = 2 × ( Z i     Z min ) ( Z max     Z min ) 1
where Zn represents the normalized data sample; Zi represents the data sample; Zmax and Zmin stand for the maximum and minimum values of the data for the interested parameter, respectively.
Second, the collected database was randomly spilt into training, testing, and validation sets, respectively. The training ratio was set as 0.70, while the testing and validation ratios were set as equal, i.e., 0.15, respectively. The training set was utilized to compute the associated weights matrix and the biases vector in Equation (2), and the testing set was used to evaluate the performance of the ANN model. Furthermore, the validation set was used to monitor ANN model overfitting. The error of validation data will increase accordingly once overfitting occurs.
Finally, the number of neurons in the hidden layer varied from 1 to 12, and accordingly, a total of 12 ANN models were trained. Figure 6 presents the computed MSE of the training, testing, and validation sets for different numbers of neuron. It can be found that the case of 6 neurons in the hidden layer results in the best performance. The obtained best ANN architecture is schematically shown in Figure 7. It shows 6 neurons in the input layer, 6 neurons in the hidden layer and 1 neuron in the output layer.

3. Results and Discussions

3.1. Performance of the Proposed ANN Model

Figure 8 shows the performance of the proposed ANN model. As can be seen in the figure, the MSE for training, testing, and validation decreases rapidly as the number of epochs increases. The minimum MSE is reached at the ninth epoch with a value of 4.6964 × 10⁻⁴, indicating that the performance of the proposed ANN model is good.
Figure 9a compares the cantilever wall deflection derived from the proposed ANN model with the actual numerical data in the training process. In general, there is a fairly good agreement between the two datasets. Figure 9b shows the evolution of the error with the change in the number of samples. The histogram of the error values with the mean and standard deviation (StD) during the training is also shown in Figure 9c. It can be seen that most of the errors during the training process are close to 0. A similar phenomenon was also observed when comparing the results of the ANN model and the corresponding numerical data for the testing and validation, as well as for all data (see Figure 10, Figure 11 and Figure 12). The above results confirm the effectiveness of the developed ANN model and show that it is reliable in predicting the cantilever wall deflection in undrained clay.
Furthermore, the actual values of the cantilever wall deflection δ were compared with the values predicted by the ANN model using the regression analysis, as shown in Figure 13. It can be observed that the values of R2 for the training, testing, validation, and all data are 0.9823, 0.9135, 0.9915, and 0.9811, respectively. They are all quite close to 1, which again indicates the acceptable performance of the developed ANN model.
Two commonly used performance indicators, root mean square error (RMSE) and mean absolute error (MAE), were selected to evaluate the network performance. The expression for each indicator is given in Equations (5) and (6). The value of the MAE represents the absolute differences between the predicted and actual values, while the RMSE represents the existing deviation between the predicted and actual values. The results of two indicators for training, testing, validation, and all data are shown in Figure 14. This again demonstrates that the predicted cantilever wall deflection using the developed ANN model were quite similar to the actual values. These results confirm that the developed ANN model performs well and could be successfully used to coherently predict the cantilever wall deflection in undrained clay. Equations (5) and (6) are calculated as follows:
RMSE = 1 N i = 1 N ( e i ) 2
MAE = i = 1 N | e i   | N
where N represents the input datasets number; ei is the difference between the predicted and actual results.

3.2. Parametric Study

A parametric study was further conducted to evaluate the influences of different input parameters on the cantilever wall deflection. For this purpose, in the following analyses, each input parameter was changed from the minimum to the maximum values according to the database in Table 1, while the other parameters corresponded to the mean values. However, it is noted that the influences of multiple variations of different input parameters on the cantilever wall deflection were not studied in this section.
Figure 15a–f present the influence of six input parameters on the cantilever wall deflection. It is obvious that the cantilever wall deflection is increased as the parameters of the excavation width B, and the excavation depth Hc changed from the minimum and the maximum values, as shown in Figure 15a,b. For the parameter of the at-rest lateral earth pressure coefficient K0, the cantilever wall deflection was found to increase slightly as K0 varied from the minimum and the mean values, while it was decreased significantly as K0 increased from the mean to the maximum values. For the other three parameters of the wall thickness t, the soil shear strength ratio at mid-depth of the wall su/σv and the soil stiffness ratio at mid-depth of the wall Eur/su, the cantilever wall deflection was decreased as they increased from the minimum and the maximum values, as presented in Figure 15c,e,f. The above observations highlighted that all the considered input parameters had moderate effects on the cantilever wall deflection.

3.3. Sensitivity Analysis

Since the proposed ANN model in this study has only one hidden layer, the Garson factor [34] can be used to evaluate the relative importance of various input parameters to the output. The importance factor of each input parameter is computed using the following equation:
  U i o = h = 1 L ( w i h r = 1 M w r h v h o ) i = 1 E ( h = 1 L ( w i h r = 1 E w r h v h o ) )
where r = 1 E w r h is the weights summation within the hidden neuron h and the input neuron E; and vho is the connection weight for the hidden neuron h and the output neuron o.
Figure 16 shows the relative importance of the different input parameters through sensitivity analysis. In general, it can be seen that these input parameters all have a significant effect on the cantilever wall deflection δ. In particular, the excavation depth Hc is the most important parameter, followed by the soil stiffness ratio at mid-depth of the wall Eur/su, while the at-rest lateral earth pressure coefficient K0 has the least importance. Obviously, the parameter of Hc is demonstrated to be the most sensitive parameter, which means that it plays a key role in predicting the cantilever wall deflection.

4. Practical Tool for Predicting the Cantilever Wall Deflection

4.1. ANN-Based Formulation

For the application of the developed ANN model to practical problems, the current form of ANN can be converted into an explicit mathematical equation. Based on the procedures discussed in the above sections, the formula for calculating the cantilever wall deflection δ can be obtained directly from the proposed ANN model by utilizing its weights, biases, activation functions, and normalization factors. The normalized cantilever wall deflection δN is a function of six considered input parameters presented in Figure 7. The above procedures are further illustrated in the Equations (8) and (9) as below:
δ N = p 0 + i = 1 T = 6 p i G i
G i = LOGSIG ( C i 0 + C i 1 X 1 + C i 2 X 2 + C i 3 X 3 + C i 4 X 4 + C i 5 X 5 + C i 6 X 6 )
where t = 6 is the number of the hidden neurons. Table 2 shows the other coefficients, i.e., p0 to pn and Ci0 to Ci6, for the formulation of the cantilever wall deflection.
It is noted that the output in Equation (8) of the cantilever wall deflection δN is a normalized value ranged between −1 and 1. Hence, it needs to be transformed into the real value, and the cantilever wall deflection δ (m) can then be further calculated as:
δ = 4 . 48 × 10 4 + ( δ N + 1 ) × 3 . 75 × 10 1
where δN and δ stand for the normalized and real value of the cantilever wall deflection, respectively.

4.2. GUI Tool

In recent years, geotechnical engineers have paid more attention to the development of user-friendly and practical software, because the complex mathematical equations are usually challenging for practitioners. Therefore, a graphical user interface (GUI) tool was established by MATLAB [31] to predict the cantilever wall deflection δ in undrained clay, as shown in Figure 17. In accordance with the proposed ANN model, six considered input parameters, i.e., from X1 to X6, are presented in this tool. People can input the values for the excavation width B, the excavation depth Hc, the wall thickness t, the at-rest lateral earth pressure coefficient K0, the soil shear strength ratio at mid-depth of the wall su/σv, and the soil stiffness ratio at mid-depth of the wall Eur/su. After entering the input parameters, the cantilever wall deflection δ is immediately displayed when you click on the Start Predict button. In addition, it should be noted that the scope of the developed ANN and this GUI tool is limited to the lower and upper bound of these six input parameters because the ANN model is generally not accurate for extrapolation [25].

5. Conclusions

In this study, an application of ANN to predict the cantilever wall deflection in undrained clay based on a set of numerical data from verified finite element models was presented. The proposed ANN model was well trained, tested, and validated, indicating its reliable performance. In addition, a series of parametric studies were conducted to evaluate the influences of six input parameters on the cantilever wall deflection. Based on the analysis, the following conclusions were drawn:
  • The proposed ANN model can predict the cantilever wall deflection in undrained clay with acceptable performance.
  • The most influential parameter in determining the cantilever wall deflection in undrained clay is the excavation depth, followed by the soil stiffness ratio at mid-depth of the wall, while the at-rest lateral earth pressure coefficient presents least influence among the considered parameters.
  • An ANN model-based formula, which included all input parameters, was developed to calculate the cantilever wall deflection.
  • A new GUI was developed to easily predict the cantilever wall deflection in undrained clay. The developed GUI tool is much simpler and more cost-efficient and can be recommended for use in practical engineering in advance.
However, there are some limitations to the proposed ANN model. First, it should be noted that the database in this study is generally small, and more high-quality datasets urgently need to be generated for a future investigation. Second, commonly used K-fold cross-validation methods can be used to improve the performance and robustness of the proposed ANN model. Third, comparisons should be made between the proposed ANN model and other mathematical models to verify the performance and reliability of the proposed ANN model. Finally, to enhance the ability and robustness of the proposed ANN model in more complicate problems, extra work on the use of other strong machine learning algorithms, such as the modular neural network and radial basis function neural network, could be performed.

Author Contributions

Z.H.: conceptualization, methodology, writing (original draft), data curation; D.Z. (Dongmei Zhang): funding acquisition, project administration, supervision; D.Z. (Dongming Zhang): methodology and data curation. All authors have read and agreed to the published version of the manuscript.

Funding

This research was funded by the National Natural Science Foundation of China (Grants No. 52108381, 52090082, 41772295, 51978517), the Innovation Program of Shanghai Municipal Education Commission (Grant No. 2019-01-07-00-07-456 E00051), the Shanghai Science and Technology Committee Program (No. 20dz1201404, 21DZ1200601), and the key innovation team program of innovation talents promotion plan by MOST of China (No. 2016RA4059).

Institutional Review Board Statement

Not applicable.

Informed Consent Statement

Not applicable.

Data Availability Statement

All data generated or analyzed during this study are included in this published article.

Acknowledgments

The author would like to thank the editors for their helpful and constructive comments that greatly contributed to improving the quality of the paper. The helpful comments from three anonymous reviewers are also greatly appreciated by the authors.

Conflicts of Interest

The authors declare no conflict of interest.

Abbreviations

ANNartificial neural network
MLmachine learning
GUIgraphical user interface
FEMfinite element method
δcantilever wall deflection
Bexcavation width
Hcexcavation depth
twall thickness
K0at-rest lateral earth pressure coefficient
su/σvsoil shear strength ratio at mid-depth of the wall
Eur/susoil stiffness ratio at mid-depth of the wall
MSEmean square error
StDstandard deviation
RMSEroot mean square error
MAEmean absolute error
δNnormalized cantilever wall deflection

References

  1. Argyroudis, S.; Amir, M.K. Analytical seismic fragility functions for highway and railway embankments and cuts. Earthq. Eng. Struct. Dyna. 2015, 44, 1863–1879. [Google Scholar] [CrossRef]
  2. Fathipour, H.; Payan, M.; Chenari, R.J. Limit analysis of lateral earth pressure on geosynthetic-reinforced retaining structures using finite element and second-order cone programming. Comput. Geotech. 2021, 134, 104119. [Google Scholar] [CrossRef]
  3. Xu, P.; Yang, G.; Li, T.; Hatami, K. Finite element limit analysis of bearing capacity of footing on back-to-back reinforced soil retaining walls. Transp. Geotech. 2021, 30, 100596. [Google Scholar] [CrossRef]
  4. Zhang, C.; Lijun, S.U.; Weizhi, C.H.E.N.; Jiang, G. Full-scale performance testing of bored piles with retaining walls in high cutting slope. Transp. Geotech. 2021, 29, 100563. [Google Scholar] [CrossRef]
  5. Simpson, B. Retaining structures: Displacement and design. Géotechnique 1992, 42, 541–576. [Google Scholar] [CrossRef] [Green Version]
  6. Ou, C.Y.; Liao, J.T.; Cheng, W.L. Building response and ground movements induced by a deep excavation. Géotechnique 2000, 50, 209–220. [Google Scholar] [CrossRef]
  7. Leung, E.H.; Ng, C.W. Wall and ground movements associated with deep excavations supported by cast in situ wall in mixed ground conditions. J. Geotech. Geoenviron. Eng. 2007, 133, 129–143. [Google Scholar] [CrossRef]
  8. Luo, M.; Liu, D.; Luo, H. Real-time deflection monitoring for milling of a thin-walled workpiece by using PVDF thin-film sensors with a cantilevered beam as a case study. Sensors 2016, 16, 1470. [Google Scholar] [CrossRef] [PubMed]
  9. Zhou, Y.; Li, C.; Zhou, C.; Luo, H. Using Bayesian network for safety risk analysis of diaphragm wall deflection based on field data. Reliab. Eng. Syst. Saf. 2018, 180, 152–167. [Google Scholar] [CrossRef]
  10. Ortiz, L.A.; Scott, R.F.; Lee, J. Dynamic centrifuge testing of a cantilever retaining wall. Earthq. Eng. Struct. Dyn. 1983, 11, 251–268. [Google Scholar] [CrossRef]
  11. Kunasegaram, V.; Takemura, J. Deflection and failure of high-stiffness cantilever retaining wall embedded in soft rock. Int. J. Phys. Modell. Geotech. 2021, 21, 114–134. [Google Scholar] [CrossRef]
  12. Hashash, Y.M.; Whittle, A.J. Ground movement prediction for deep excavations in soft clay. J. Geotech. Eng. 1996, 122, 474–486. [Google Scholar] [CrossRef]
  13. Sert, S.; Luo, Z.; Xiao, J.; Gong, W.; Juang, C.H. Probabilistic analysis of responses of cantilever wall-supported excavations in sands considering vertical spatial variability. Comput. Geotech. 2016, 75, 182–191. [Google Scholar] [CrossRef]
  14. Luo, Z.; Li, Y.; Zhou, S.; Di, H. Effects of vertical spatial variability on supported excavations in sands considering multiple geotechnical and structural failure modes. Comput. Geotech. 2018, 95, 16–29. [Google Scholar] [CrossRef]
  15. Kung, G.T.; Juang, C.H.; Hsiao, E.C.; Hashash, Y.M. Simplified model for wall deflection and ground-surface settlement caused by braced excavation in clays. J. Geotech. Geoenviron. Eng. 2007, 133, 731–747. [Google Scholar] [CrossRef]
  16. Katsamakas, A.A.; Papanikolaou, V.K.; Thermou, G.E. A FEM-based model to study the behavior of SRG-strengthened R/C beams. Compo. Struct. 2021, 266, 113796. [Google Scholar] [CrossRef]
  17. Gohari, S.; Mouloodi, S.; Mozafari, F.; Alebrahim, R.; Moslemi, N.; Burvill, C.; Albarody, T.M.B. A new analytical solution for elastic flexure of thick multi-layered composite hybrid plates resting on Winkler elastic foundation in air and water. Ocean Eng. 2021, 235, 10937. [Google Scholar] [CrossRef]
  18. Zhang, W.; Goh, A.T.; Xuan, F. A simple prediction model for wall deflection caused by braced excavation in clays. Comput. Geotech. 2015, 63, 67–72. [Google Scholar] [CrossRef]
  19. Qi, X.H.; Zhou, W.H. An efficient probabilistic back-analysis method for braced excavations using wall deflection data at multiple points. Comput. Geotech. 2017, 85, 186–198. [Google Scholar] [CrossRef]
  20. Chua, C.G.; Goh, A.T. Estimating wall deflections in deep excavations using Bayesian neural networks. Tunn. Undergr. Space Technol. 2005, 20, 400–409. [Google Scholar] [CrossRef]
  21. Gowda, K.; Prasad, G.E.; Velmurgan, R. Prediction of optimized cantilever earth retaining wall using ANN. Int. J. Emerg. Trends Eng. Dev. 2012, 6, 328–333. [Google Scholar]
  22. Ozturk, T.E. Artificial neural networks approach for earthquake deformation determination of geosynthetic reinforced retaining walls. Int. J. Intell. Syst. Appl. Eng. 2014, 2, 1–9. [Google Scholar] [CrossRef] [Green Version]
  23. Alias, R.; Kasa, A.; Taha, M.R. Artificial neural networks approach for predicting the stability of cantilever RC retaining walls. Int. J. Appl. Eng. Res. 2015, 10, 26005–26014. [Google Scholar]
  24. Gordan, B.; Koopialipoor, M.; Clementking, A.; Tootoonchi, H.; Mohamad, E.T. Estimating and optimizing safety factors of retaining wall through neural network and bee colony techniques. Eng. Comp. 2019, 35, 945–954. [Google Scholar] [CrossRef]
  25. Zhang, R.; Wu, C.; Goh, A.T.; Böhlke, T.; Zhang, W. Estimation of diaphragm wall deflections for deep braced excavation in anisotropic clays using ensemble learning. Geosci. Front. 2021, 12, 365–373. [Google Scholar] [CrossRef]
  26. Mishra, P.; Samui, P.; Mahmoudi, E. Probabilistic design of retaining wall using machine learning methods. Appl. Sci. 2021, 11, 5411. [Google Scholar] [CrossRef]
  27. Nguyen, D.D.; Tran, V.L.; Ha, D.H.; Nguyen, V.Q.; Lee, T.H. A machine learning-based formulation for predicting shear capacity of squat flanged RC walls. Structures 2021, 29, 1734–1747. [Google Scholar] [CrossRef]
  28. Huang, Z.K.; Pitilakis, K.; Tsinidis, G.; Argyroudis, S.; Zhang, D.M. Seismic vulnerability of circular tunnels in soft soil deposits: The case of Shanghai metropolitan system. Tunn. Undergr. Space Technol. 2020, 98, 103341. [Google Scholar] [CrossRef]
  29. Huang, Z.K.; Pitilakis, K.; Argyroudis, S.; Tsinidis, G.; Zhang, D.M. Selection of optimal intensity measures for fragility assessment of circular tunnels in soft soil deposits. Soil Dyn. Earthq. Eng. 2021, 145, 106724. [Google Scholar] [CrossRef]
  30. Zhang, D.M.; Phoon, K.K.; Huang, H.W.; Hu, Q.F. Characterization of model uncertainty for cantilever deflections in undrained clay. J. Geotech. Geoenviron. Eng. 2015, 141, 04014088. [Google Scholar] [CrossRef] [Green Version]
  31. MathWorks. Global Optimization Toolbox: User’s Guide (R2018); Springer: Cham, Switzerland, 2018. [Google Scholar]
  32. Chern, S.; Tsai, J.H.; Chien, L.K.; Huang, C.Y. Predicting lateral wall deflection in top-down excavation by neural network. Int. J. Offshore Polar Eng. 2009, 19, 151–157. [Google Scholar]
  33. Salsani, A.; Daneshian, J.; Shariati, S.; Yazdani, A.; Taheri, M. Predicting roadheader performance by using artificial neural network. Neural Comput. Appl. 2014, 24, 1823–1831. [Google Scholar] [CrossRef]
  34. Garson, G.D. Interpreting neural-network connection strengths. AI Expert 1991, 6, 47–51. [Google Scholar]
Figure 1. Finite element model in Plaxis.
Applsci 11 09760 g001
Figure 2. Cantilever wall deflections by Plaxis 2D versus measured values.
Applsci 11 09760 g002
Figure 3. Relationship between input and output parameters.
Applsci 11 09760 g003
Figure 4. Correlation matrix of the database.
Applsci 11 09760 g004
Figure 5. Activation functions of ANN model: (a) PURELIN; (b) and LOGSIG function.
Applsci 11 09760 g005
Figure 6. The MSE for different neuron number in the hidden layer.
Applsci 11 09760 g006
Figure 7. Architecture of the developed ANN model.
Applsci 11 09760 g007
Figure 8. Performance of the developed ANN model.
Applsci 11 09760 g008
Figure 9. The performance of training data: (a) Predicted versus actual data; (b) error; (c) the histogram of error values.
Applsci 11 09760 g009
Figure 10. The performance of testing data: (a) Predicted versus actual data; (b) error; (c) the histogram of error values.
Applsci 11 09760 g010
Figure 11. The performance of validation data: (a) Predicted versus actual data; (b) error; (c) the histogram of error values.
Applsci 11 09760 g011
Figure 12. The performance of all data: (a) Predicted versus actual data; (b) error; (c) the histogram of error values.
Applsci 11 09760 g012
Figure 13. Regression of the developed ANN model: (a) training data; (b) testing data; (c) validation data; (d) and all data.
Applsci 11 09760 g013
Figure 14. Activation functions of ANN model: (a) MAE (b) and RMSE.
Applsci 11 09760 g014
Figure 15. Influence of input parameters on the cantilever wall deflection. (a) influence of the excavation width B; (b) influence of the excavation depth Hc; (c) influence of the wall thickness t; (d) influence of the at-rest lateral earth pressure coefficient K0; (e) influence of the soil shear strength ratio at mid-depth of the wall su/σv; (f) and influence of the soil stiffness ratio at mid-depth of the wall Eur/su.
Applsci 11 09760 g015
Figure 16. Sensitivity analysis of input parameters.
Applsci 11 09760 g016
Figure 17. ANN interactive graphical user interface.
Applsci 11 09760 g017
Table 1. Statistical results of these datasets.
DataB (m)Hc (m)t (m)K0su/σvEur/suδ (m)
Minimum10.000.500.600.500.30199.384.48 × 10−4
Mean68.592.741.040.790.46500.510.055
Maximum150.06.001.601.100.70900.000.753
Standard Deviation (StD)44.441.820.270.120.12201.310.109
Table 2. Coefficients for formulation of the cantilever wall deflection δN.
iStandard Deviation (StD)piCi0Ci1Ci2Ci3Ci4Ci5Ci6
00.01511.3064-------
1-4.4400−0.66370.1058−3.41060.64220.66992.95972.5766
2-−1.1517−0.0507−0.4111−3.12521.05414.4313−2.87630.8767
3-−0.7667−0.00942.1242−0.00131.2719−1.55362.83140.5952
4-1.56320.05043.9952−1.3110−0.95954.8911−3.0350−2.5302
5-12.7459−1.56090.0537−7.90930.8502−0.95787.59182.0398
6-3.6588−0.07721.2851−4.38673.1687−1.43891.1998−2.9990
Publisher’s Note: MDPI stays neutral with regard to jurisdictional claims in published maps and institutional affiliations.

