Article

Holding Force and Vertical Vibration of Emergency Gate in the Closing Process: Physical and Numerical Modelling

State Key Laboratory of Hydraulic Engineering Simulation and Safety, College of Civil Engineering, Tianjin University, Tianjin 300350, China
*
Author to whom correspondence should be addressed.
Appl. Sci. 2021, 11(18), 8440; https://doi.org/10.3390/app11188440
Submission received: 19 August 2021 / Revised: 7 September 2021 / Accepted: 9 September 2021 / Published: 11 September 2021
(This article belongs to the Topic Dynamical Systems: Theory and Applications)

Abstract

:
A two-dimensional unsteady fluid–structure interaction numerical model was established, based on the physical model test, to investigate the influence of vertical vibration on the holding force of an emergency gate in the closing process. Gate motion was controlled by the user-defined function in Fluent. Attention was paid to the relationship between the vertical vibration, hydrodynamic loads and flow discharge. The experiment results show that holding force has three typical forms in the closing process and it is related to the service gate height. The numerical model can reflect the gate vertical vibration and the gate-closing displacement in the form of steps. Gate vertical vibration in the closing process is a motion-induced vibration caused by gate active falling. Moreover, the transition from full-flow to open-flow behind the emergency gate has a great influence on the gate vertical vibration. With a small gate opening, gate vertical vibration makes the flow discharge fluctuation increase. Furthermore, flow discharge has an influence on the gate body loads, which is mainly concentrated in the upstream plate and gate bottom. Finally, the lift force coefficient at the gate bottom is different from the standard and is mainly controlled by the outflow boundary condition. The simulation result is in good agreement with the experiment and the relative error meets engineering requirements, suggesting that the numerical model can successfully simulate the gate fluid–structure interaction and reproduce the characteristics of physical quantities in the closing process.

1. Introduction

Gate vibration is a common phenomenon in water resource and hydropower projects. The vibration is motivated by the hydrodynamic loads, and the flow field around the gate also produces changes in turn, which forms the fluid–structure interaction between the fluid and gate structure [1]. Strong fluid–structure interactions can cause gate structure deformation or even destruction, posing a serious threat to the safety and stability of the water conservancy project.
Naudascher [2] divided the flow-induced vibration into three categories based on its induced mechanism, and gate vibrations jointly induced by flow instability and structure feedback mechanisms are the most common. Hardwick [3] and Jongeling [4], through a physical model test, pointed out that the main cause of gate vibration was the vortex formed by the destruction of the free shear layer at the gate bottom. Thang [5,6] posited that gate vibration was caused by downstream vortex resonance and pointed out that the slope of lift coefficient curve was taken as a criterion by which to judge the gate dynamic stability. Ishii and Knisely [7] reckoned that the fluid feedback force induced by gate vibration mainly included two aspects: pressure pulsation caused by flow and alternating excitation derived from the vortex at the gate bottom. Kunihiro et al. [8] expounded that the curved gate vibration belonged to the self-excited vibration in the small gate opening. Anami et al. [9] simplified the curved gate into the plane gate, established load relations through the potential flow theory, and explored the influence of additional mass and wave-transmitted energy on the gate vibration. Based on physical model tests, Yang et al. [10] monitored the gate vibration and obtained the characteristics of the flow field by particle imaging technology. The results showed that the smaller was the gate opening height and the larger was the flow discharge, the more obvious was the gate vibration, which indicated that the discharge had a direct influence on the gate vibration. The physical experiment of Thang’s [6] was inversely simulated by the numerical method [11]. It was found that when the ratio between the opening height and the gate width was 0.8, the gate vibration intensity reached its maximum. The simulation result showed that the horizontal vibration was stronger than the vertical vibration at the fixed gate opening, and a similar result was obtained from their physical model test [12].
Although considerable research has been devoted to gate vibration in fixed gate openings, less attention has been paid to it in operation processes. Compared with the fixed gate opening, the gate constraint condition has changed. For some water conservancy projects in the southwest of China, the water depth in front of the emergency gate is relatively high and flow velocity has exceeded 18–20 m/s. The fluid–structure interaction between the gate and fluid makes the hydrodynamic loads change, which alters the holding force and finally affects the selection of the hoist capacity. Failure of gate-lifting and gate-closing has occurred in the past [13]. The current studies are to examine whether gates can be closed safely and quickly to ensure safe operation. There are still some problems for the calculation of hoist capacity in the design stage, such as the hydrodynamic loads and the effect of gate vibration in operation processes. Few studies have been conducted to investigate the relationship between gate vibration and holding force in operation processes. Wang et al. [12] examined the relationship between the holding force and gate vibration through the physical model test. Nevertheless, it is impossible to accurately obtain the relationship between the hydrodynamic loads and flow discharge with gate vibration. Thus, the purpose of this study is to establish a fluid–structure interaction simulation and to explore the characteristics related to gate operation processes.
The study is divided into six parts. Section 1 presents the previous achievements and existing problems about gate vibration. Section 2 describes the physical model setup and test conditions. Section 3 establishes a two-dimensional unsteady fluid–structure interaction numerical simulation model and determines the method applied to monitor the surface of the hydrodynamic loads and flow discharge. The characteristics of the holding force in experiment and simulation are evaluated in Section 4. In Section 5, the relationships between the hydrodynamic loads and discharge with gate vertical vibration are discussed in the closing process. The conclusion is given in Section 6.

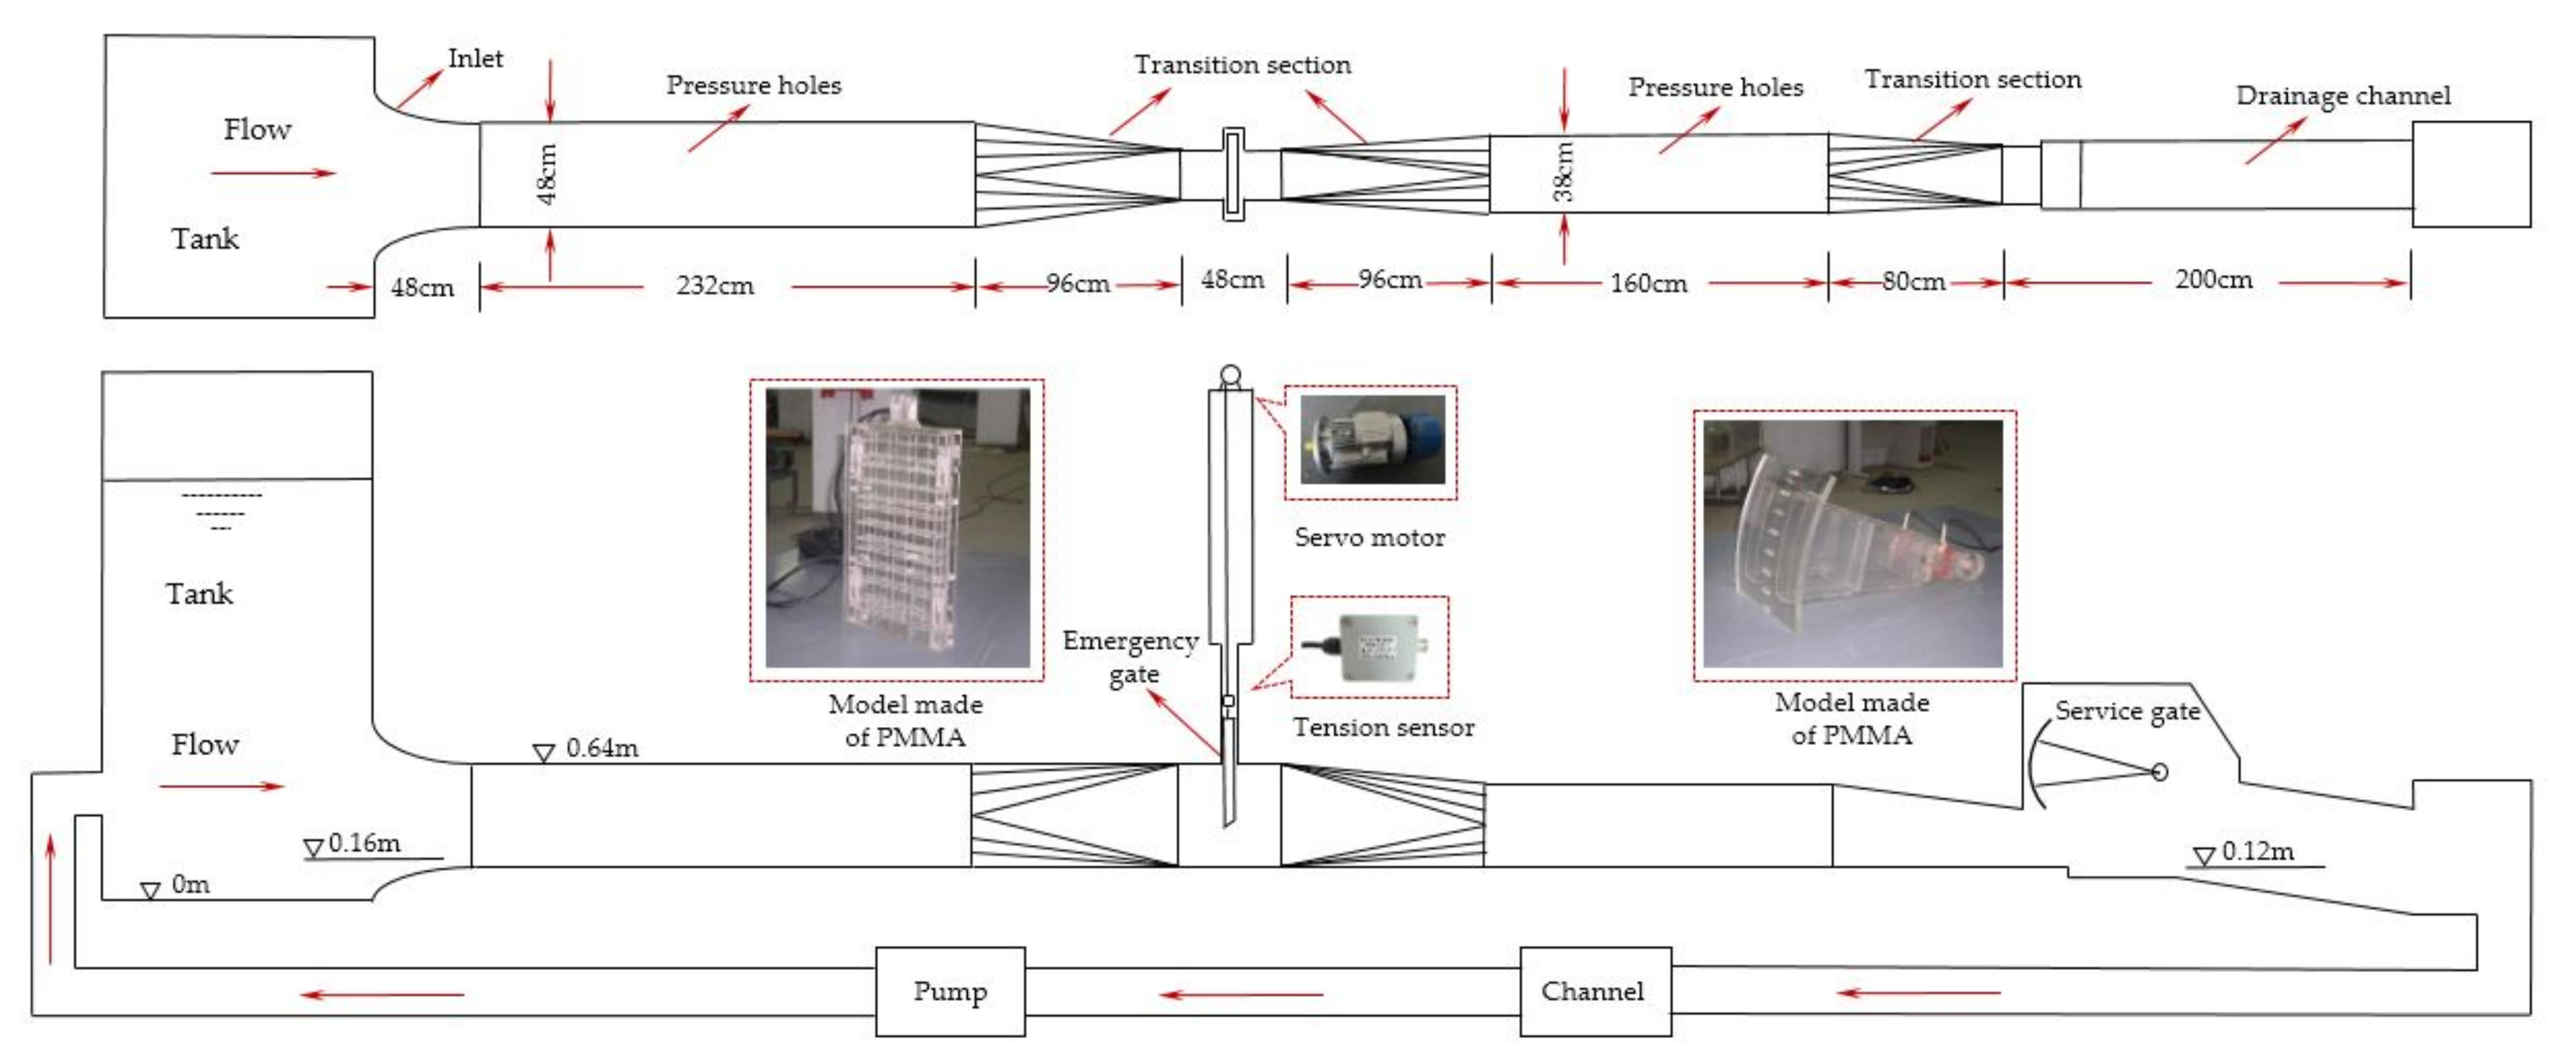
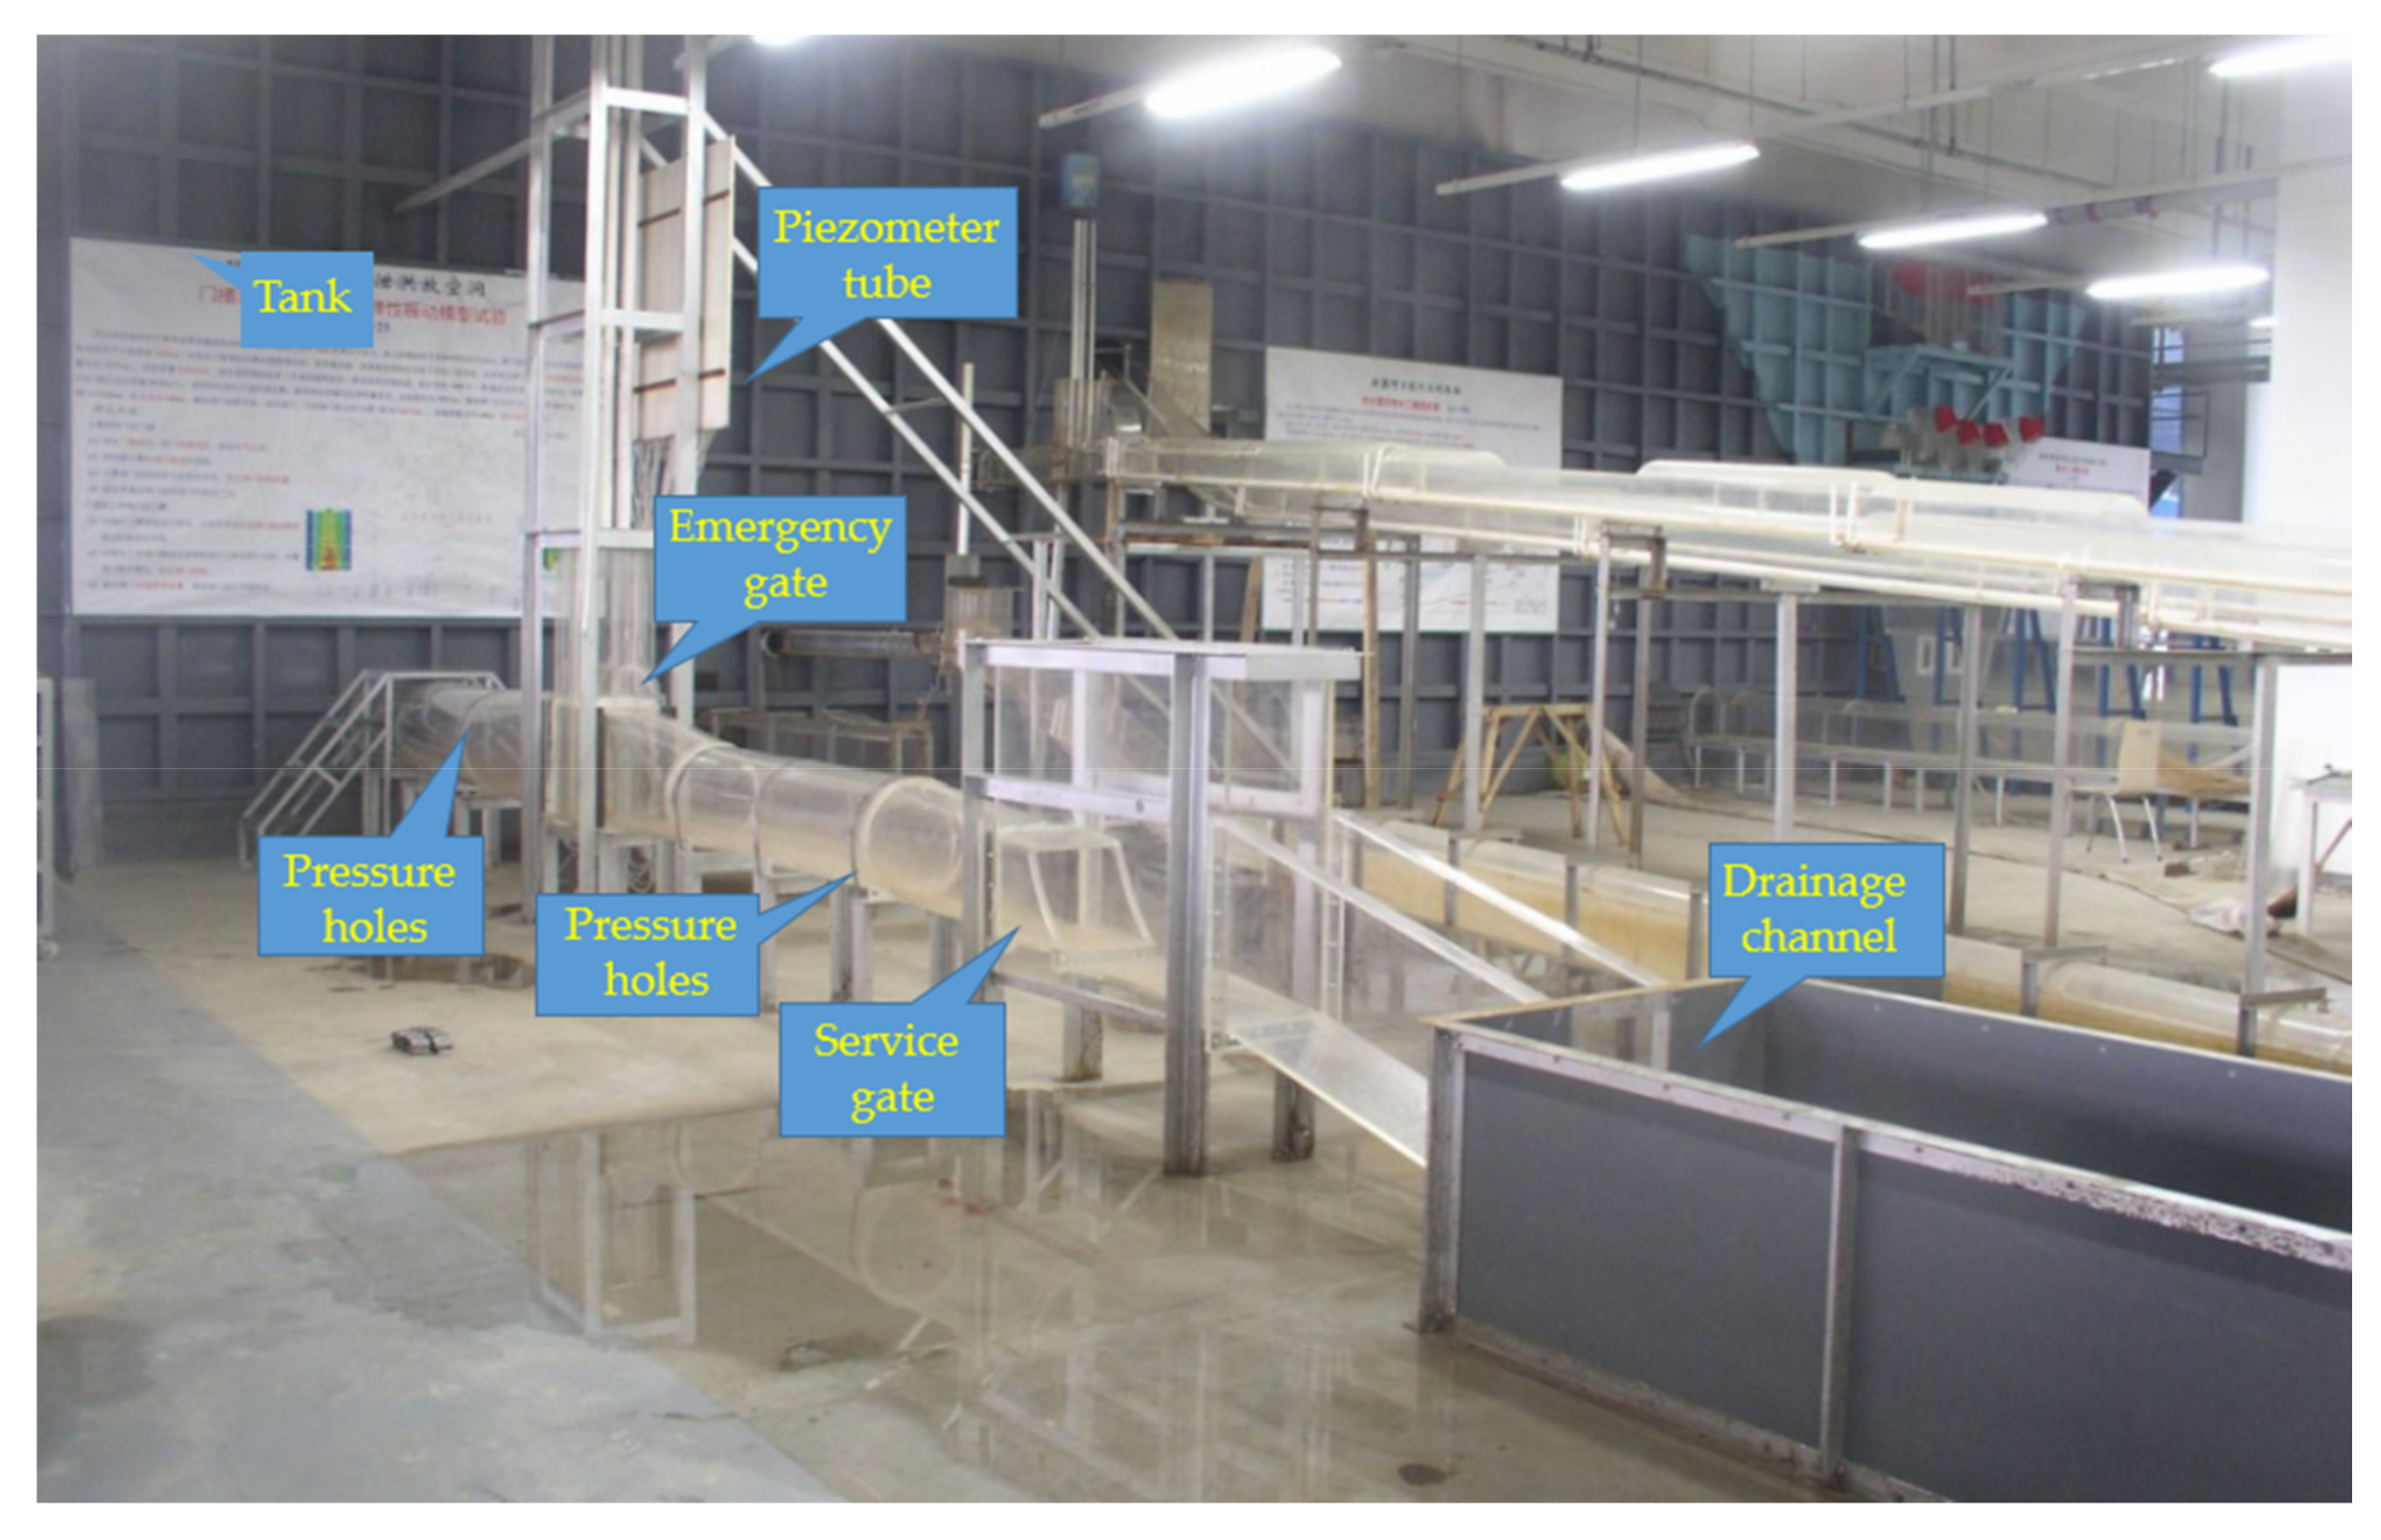
2. Physical Model Test

2.1. Model Setup

A 1:25 physical model was established based on the gravity similarity criterion, which was composed of a diversion tunnel, a pressurized tunnel, an emergency gate chamber, a service gate chamber, and a non-pressurized tunnel. The overall size of the physical model is shown in Figure 1. The emergency gate, service gate and flow channel boundaries were made of Perspex plastic, and the physical model boundaries were fixed with a steel structure. The overall layout of the physical model is presented in Figure 2. Meanwhile, the parameters of the emergency gate in prototype are displayed in Table 1.

2.2. Operation Condition

The emergency gate in the closing process often experienced crawl vibrations with intermittent movement or failure of gate-closing [14]. Thus, the characteristics of the closing process is the focus of this study. The operating malfunction of the service gate decided the downstream boundary conditions of the emergency gate. In the physical model test, the connecting rod was used to adjust the service gate height to represent the emergency situations of a service gate. The emergency gate was operated by servo motor to control its motion in the vertical direction. The upstream water depths and service gate heights determined the operation conditions of emergency gates. Service gate heights were 0.2, 1.0, 4.0 and 6.0 m, respectively, and upstream water depths were 49, 65, 85 and 100 m, respectively in the prototype. The holding force was obtained by the tension sensor. The sensor was installed in series at the top of the lifting lug. A data acquisition and signal processing (DASP) acquisition system developed by the China Orient Institute of Noise and Vibration was employed to collect, process and transmit the data. The data acquisition lasted for the duration of the gate-closing process and the sampling frequency was 200 Hz.

3. Numerical Modelling

The numerical simulation model was required to simulate the emergency gate fluid–structure interaction in the closing process. A fluid domain of 300 × 20 × 110 m3 (width × height × thickness) was required of the prototype. Because the simulation zone was relatively large and the closing time of the prototype was relatively long, it was not a wise choice to adopt a three-dimensional model to simulate the gate-closing process, which would expend lots of mesh elements and computational time. In addition, the average flow velocity through the gate can reach 27.35 m/s at an upstream water depth of 100 m. The high speed could weaken the lateral flow effect on the spillway tunnel. Thus, a two-dimensional numerical simulation model was established to denote the gate fluid–structure interaction.

3.1. Fluid Conditions

The fluid flow was assumed to be an unsteady, viscous and incompressible flow with constant fluid properties. The flow over the gate was modelled by the unsteady Reynolds-averaged Navier–Stokes (URANS) equations, including the mass and momentum conservation equations. Since URANS equations have been proposed in a large number of publications, they are not repeated in this study [15]. URANS equations are usually solved with the assistance of a turbulence model in practice. The realizable k-ε turbulence model has been demonstrated by many studies to give good performance in modelling flow with adverse pressure gradients and high-speed flows. A turbulence model including the kinetic energy and its specific dissipation rate transport equations was employed to close the URANS equations. The coupling between the pressure and the velocity was solved by the pressure-implicit with splitting of operators (PISO) method. The spatial discretization of the convective terms and the diffusion terms were carried out by second order upwind scheme and second order centered scheme, respectively. The second-order implicit scheme was adopted in the time domain. The free surface was tracked by Volume of Fluid (VOF) [16]. As for the boundary conditions in the numerical simulation, the upstream boundary was set to the pressure inlet and given different upstream water depths. The gate shaft of the emergency gate was also set as a pressure inlet with standard atmospheric pressure. The service heights were adjustable and the downstream boundary was set to pressure outlet with the standard atmospheric pressure. The simulated upstream water depths were 49, 65, 85 and 100 m, respectively. The service gate heights were set to 1.0 m and 4.0 m. The time step was 0.001 s and the total simulation time was over 360 s.

3.2. Motion Equations

The gate vertical vibration in the closing process was mostly the entire vibration. It was feasible and reliable to regard the emergency gate as a rigid body to describe its fluid–structure interaction [17,18]. In this study, the deformation stiffness of steel rope in the vertical direction was simplified to the equivalent system stiffness of a single degree of freedom, which can be expressed as k = EA/L (where k is the system equivalent stiffness; E is the elastic modulus of steel rope; A is the steel rope area; and L is the steel rope length). Considering the size and material properties of the steel rope, EA was 3.17E5. The steel rope length L would increase gradually with the emergency gate dropped. The equivalent system damping was obtained by the Rayleigh relation, and the coefficient was 3% [19]. The gate-closing speed was controlled by the macro through the user-defined function (UDF) in Fluent. Thus, the vertical vibration with a single degree of freedom of the gate-closing process can be expressed as:
( m + m ) y + ( c + c ) y + ( k + k ) y = F ( t )
where y″, y′ and y are the vertical vibration acceleration, velocity and displacement, respectively; m is the system mass; c is the system damping; k is the system spring; m′ is the added mass; c′ is the added damping; k′ is the added spring; and F(t) is the external excitation. The added coefficient loads derived from the mesh deformation of fluid. Nevertheless, the loads can be transmitted by the macro in Fluent. Thus, the gate vertical vibration process can be presented as:
m y + c y + k y = f ( t )
k = m ω 0 2 , c = 2 m ω 0 ξ
where ξ is the system damping ratio; ω0 is the system natural frequency; and f(t) represents the gate loads with fluid–structure coupling, and it is equal to the holding force of the emergency gate. Based on the current standard of hydraulic steel gates [20], the holding force of the emergency gate can be presented as:
f ( t ) = n G G + G j + W S + P X P t ( T z d + T z s )
where Tzd is the panel friction force; Tzs is the seal friction force; G is the gate mass; Ws is the water pressure at the gate top; Gj is the gate counterweight; PXPt is the hydrodynamic loads at the gate bottom (PX is the suction force and Pt is the lifting force); and nG is the gate weight correction factor.
The instantaneous displacement of the system was addressed by solving the motion equations utilizing an improved fourth order Runge–Kutta algorithm [21]. Thus, Equation (2) was discretized and rearranged as:
y ( t n + 1 ) = y ( t n ) + y ( t n ) Δ t + Δ t 2 6 ( K 1 + 2 K 2 + 2 K 3 + K 4 )
in which:
K 1 = f ( t n ) m c m y ( t n ) k m y ( t n ) K 2 = f ( t n ) m c m y ( t n ) + Δ t 2 K 1 k m y ( t n ) + Δ t 2 y ( t n ) K 3 = f ( t n ) m c m y ( t n ) + Δ t 2 K 2 k m y ( t n ) + Δ t 2 y ( t n ) + Δ t 2 8 K 1 K 4 = f ( t n ) m c m y ( t n ) + K 3 Δ t k m y ( t n ) + y ( t n ) Δ t + Δ t 2 2 K 1
where K1, K2, K3 and K4 are intermediate functions, and Δt is the time step in the fluid zone.
In the numerical simulation, two operation modes of direct closing and vibratory closing were carried out. The direct closing had a fixed speed v0 (v0 is the speed at which the hoist equipment releases the steel rope). The speed of vibratory closing was required to take the effect of fluid–structure interaction into account. Thus, the vibratory closing speed can be defined as the vector sum of the closing velocity v0 and vibratory velocity y′. In fact, the emergency gate was in transient water and had a small vibration response before the gate started to close, which was called the vibration adaption. During the vibration adaptation, the emergency gate vibrated with a single degree of freedom at its initial position. After the vibration adaptation was completed, the gate-closing process officially started. Moreover, there are two main problems that can arise in the closing process. Firstly, when the emergency gate vibrates, the gate movement trend might change. The friction force direction alters and transitions between kinetic and static friction, influencing the holding force f(t) in Equation (2). Secondly, the gate motion pattern would change. If the steel rope relaxed, it meant that the gate was no longer bound by the steel rope, and it would gradually slow down according to Newton’s second law of motion. The phenomenon of steel rope relaxation appeared in physical model test [15]. Thus, only the steel rope was in the tension state, the emergency gate vertical vibration in the closing process can be simplified to a single degree of freedom vibration.
The hydrodynamic loads on the gate plates and flow discharge were taken as the focus in a numerical simulation. The relationship between the flow discharge and the hydrodynamic loads and gate vertical vibration was explored. The hydrodynamic loads and flow discharge were monitored, and the positions of the monitoring surface were displayed in Figure 3. As can be seen from Figure 3, the ‘flow1’ and ‘flow2’ represented the flow discharge monitoring surface. ‘flow2’ was the sum of ‘flow1’ and the supplementary flow from the gate shaft. The other surfaces denoted the monitoring surface of hydrodynamic loads.

3.3. Mesh Dependence Check and Validation

The numerical model adopted different meshes in different simulation regions for the purposes of appropriately reducing the mesh number and increasing the computational efficiency. Structured mesh was used for the reservoir zone with a large size, while unstructured mesh with a relatively small size was used for the gate shaft to realize the mesh deformation and reconstruction. The other domains employed structured mesh and its size was between the two. Three different meshes were presented and mesh independence check was conducted. The simulation condition for the independence check was as follows: upstream water depth of 100 m and service gate height of 1.0 m. The panel pressure of the service gate was 38,288.6 kN in physical model test. The simulation results are shown in Table 2. From Table 2, as the mesh size decreased, the numerical simulation results showed little difference. The relative error between the simulation and the experiment was relatively small, indicating that the mesh size had no remarkable influence on the simulation result. In order to better adapt the mesh deformation of the gate structure boundary, a third mesh was chosen to carry out numerical simulations.
The hinge forces of the service gate were obtained under the service gate height of 1.0 m and 4.0 m, as shown in Table 3. Compared to the experiment results, it can be used to validate the reliability of the simulation results. It can be seen from Table 3 that the maximum relative error between the simulation and the experiment was less than 7.08%, which indicates that the simulation results were reliable and can meet the requirements of engineering precision.

4. Results

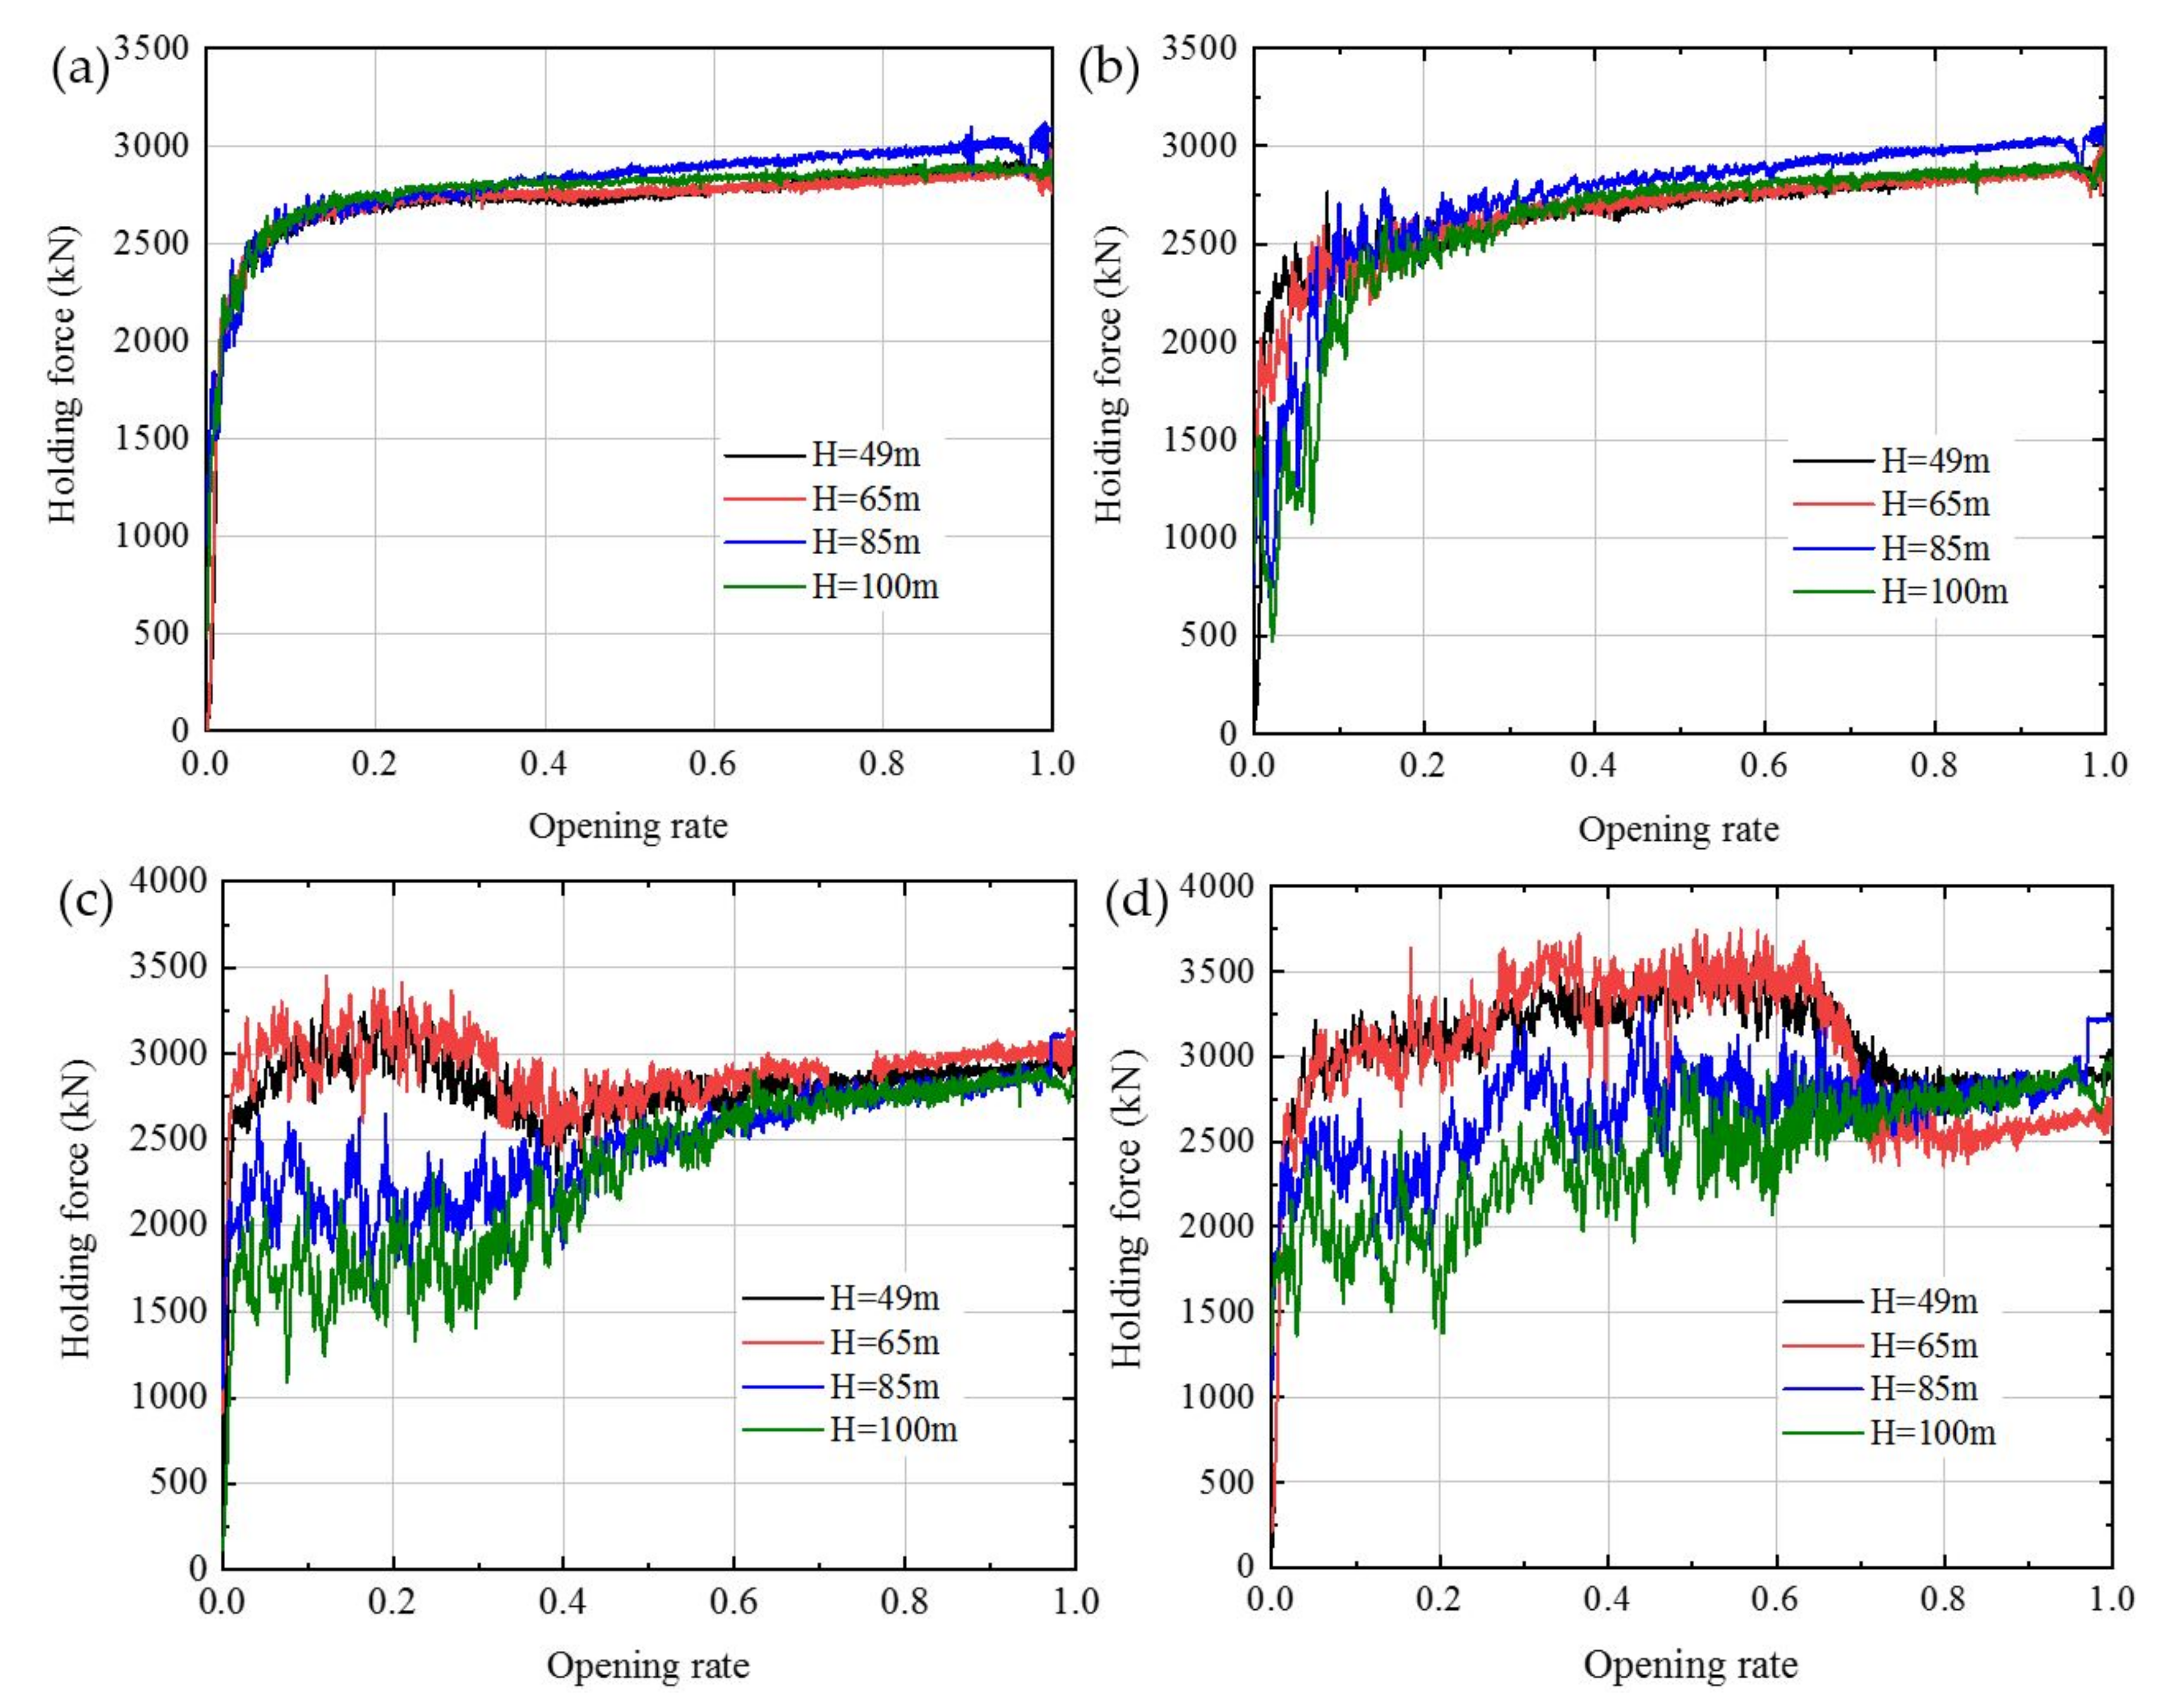
4.1. Results of Hysical Model Test

The experiment results, as revealed in Figure 4, showed that the holding force of the emergency gate has three typical curves in the closing process:
(1) The holding force gradually decreased with the decrease in opening rate e (opening rate e equals opening height dividing spillway tunnel height) and the maximum appeared under the opening rate e = 1.0 in Figure 4a. When the emergency gate approached full closure, the holding force suddenly dropped to zero. The flow behind the emergency gate was always full flow in the closing process. The flow pattern was relatively stable and the hydrodynamic loads acting on the gate body altered little.
(2) The holding force decreased slowly with a decrease in the opening rate, and decreased with drastic fluctuation before the gate was completely closed. The maximum holding force still appeared at the opening rate e = 1.0 (Figure 4b). With the upstream water depth increased, the panel thrust increased and friction force increased, making the holding force decrease the large opening rate. In terms of the small opening rate, nevertheless, the fluctuation intensity of the holding force increased gradually.
(3) With the opening rate decreased, the holding force decreased slowly at first, then reached the peak, and finally decreased to zero (Figure 4c). The peak was larger than the initial stage and it was the maximum holding force for the low water head. For the high water head, however, the maximum holding force still appeared at the initial stage. As depicted in Figure 4d, the variation in the holding force was consistent with that in Figure 4c. The reason for the situation was the lift force at the gate bottom. The lift force was related to the flow pattern behind the emergency gate. When the service gate was at a large opening rate and upstream water depth was low, the flow pattern would change from full-flow to open-flow and the lift force decreased rapidly. The decreased lift force was larger than the increased friction force, making the holding force peak significantly. While the service gate had a large opening rate and upstream water depth was high, nevertheless, the holding force was influenced by many factors and its regularity became worse. Thus, it is necessary to adopt the numerical simulation to study the characteristics of hydrodynamic loads in the closing process.
The critical opening rate corresponded with the initial moment when the open-flow behind the emergency gate first appeared, which meant that the air flowed into the pressurized channel and the flow pattern behind the gate was from full-flow to open-flow. Figure 5 shows the critical opening rate with upstream water depths and service gate heights. The lower is the upstream water depth and the middle one is the service gate height, while the higher one is the critical opening rate.

4.2. Results of Numerical Simulation

Figure 6 plots the comparison between the simulation and experiment of the holding force for the upstream water depth of 85 m. The difference between the simulation and experiment was small, and it was slightly large before the gate was completely closed. The relative error can meet the precision requirements, which shows that the method adopted in this study can be used to simulate the closing process of an emergency gate.
Figure 7 depicted the displacement of the emergency gate with time in vibration closing for the service gate height of 4.0 m. In closing process, the displacement approximately decreased with time in a step form and was intermittent motion in visual, which was consistent with the actual gate-closing process [19]. That means that the fluid–structure interaction numerical model can reflect the gate vertical vibration characteristic in the closing process. Because of the gate vertical vibration, the closing speed was slightly less than the specified speed v0. The falling displacement was small and the closing time was slightly increased.
Compared to the two closing modes, the variation of the flow discharge was consistent in general. Based on the formula Q = μe1B 2 g H 0 (where μ is the coefficient; e1 is the opening height; B is the orifice width; H0 is the moving water head; and g is the acceleration of gravity), the flow discharge has a roughly linear relationship with the opening height for the constant upstream water depth. However, Figure 8 describes the characteristics of flow discharge and velocity of the monitoring ‘flow1’. It can be seen from Figure 8 that the discharge was mainly affected by the service gate height and upstream water depth. The relationship between discharge and opening rate had two regions: linear and transitionary. In the initial stage, the discharge had a linear relationship with the opening rate accompanied by regular fluctuations. The fluctuation decreased as upstream water depth increased. There was also a linear relationship with the small gate opening and it had no significant fluctuation relationship. In the middle, the relationship was nonlinear. Moreover, the velocity gradually increased as the opening rate decreased, and the velocity with a significant fluctuation was only in the small gate opening.

5. Discussion

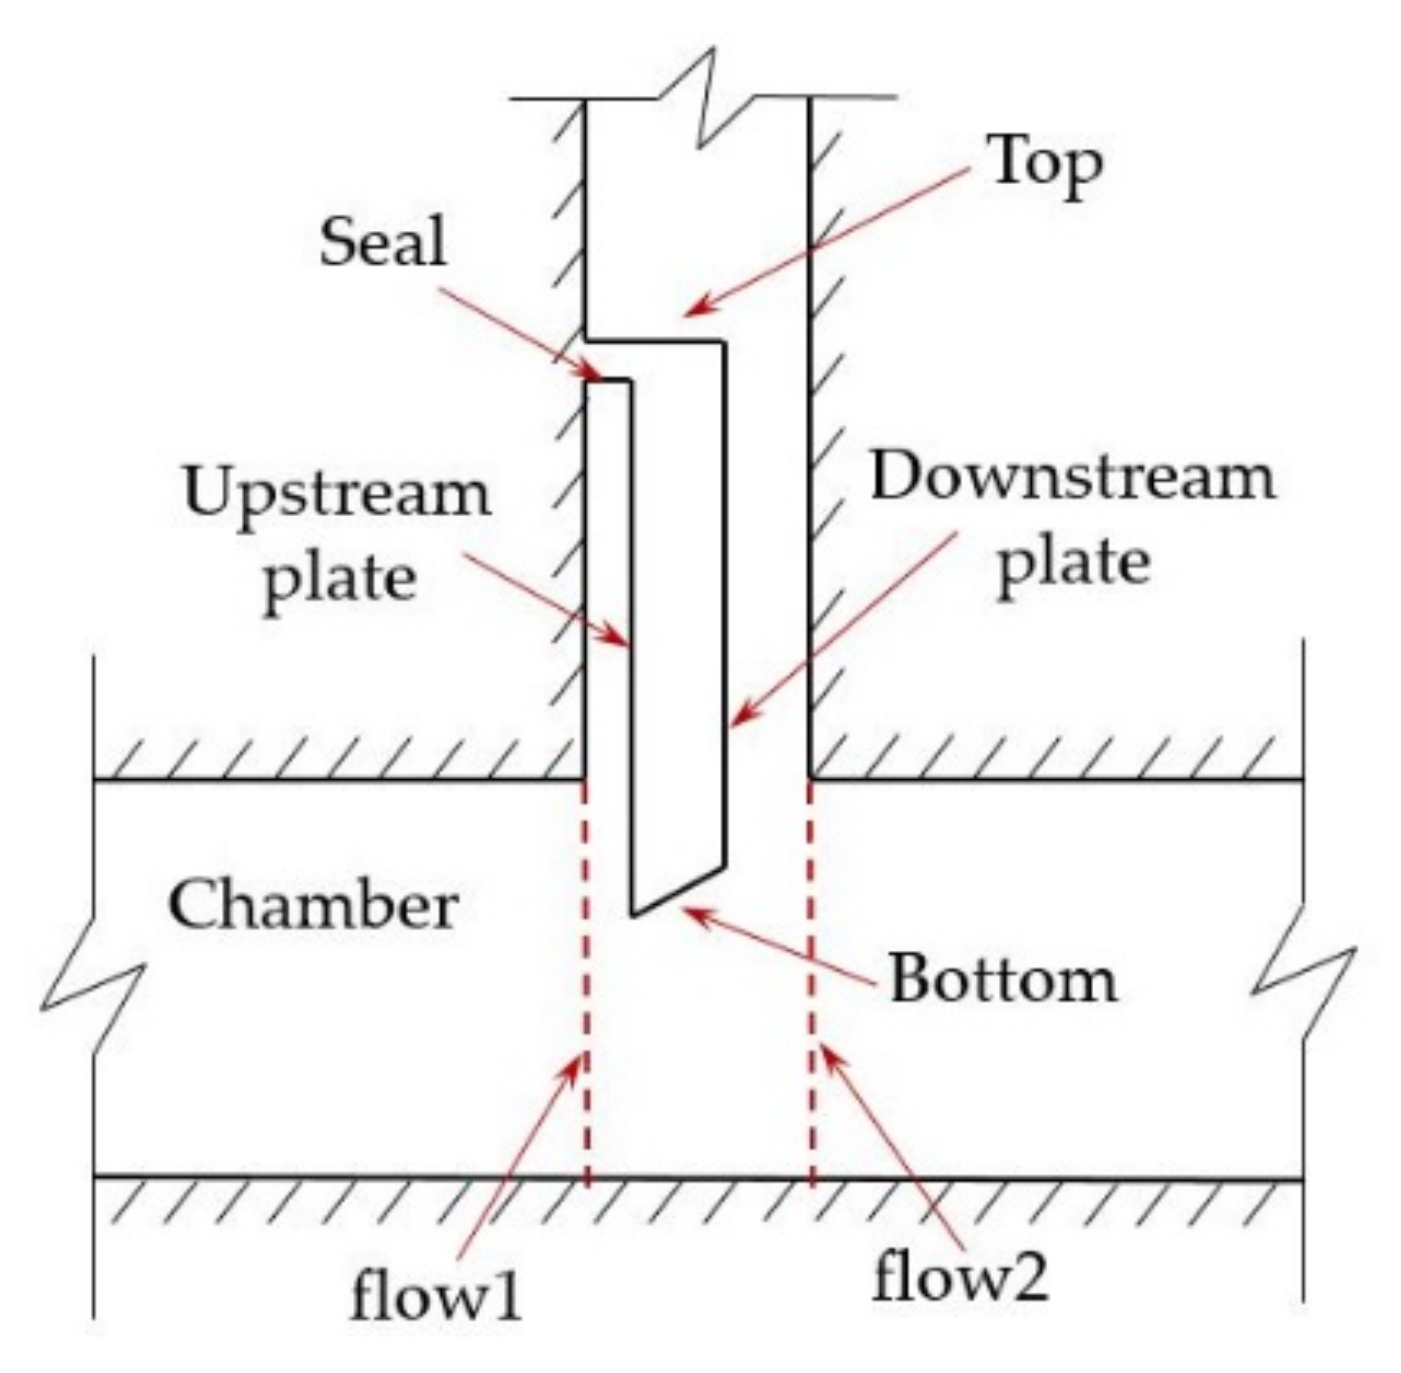
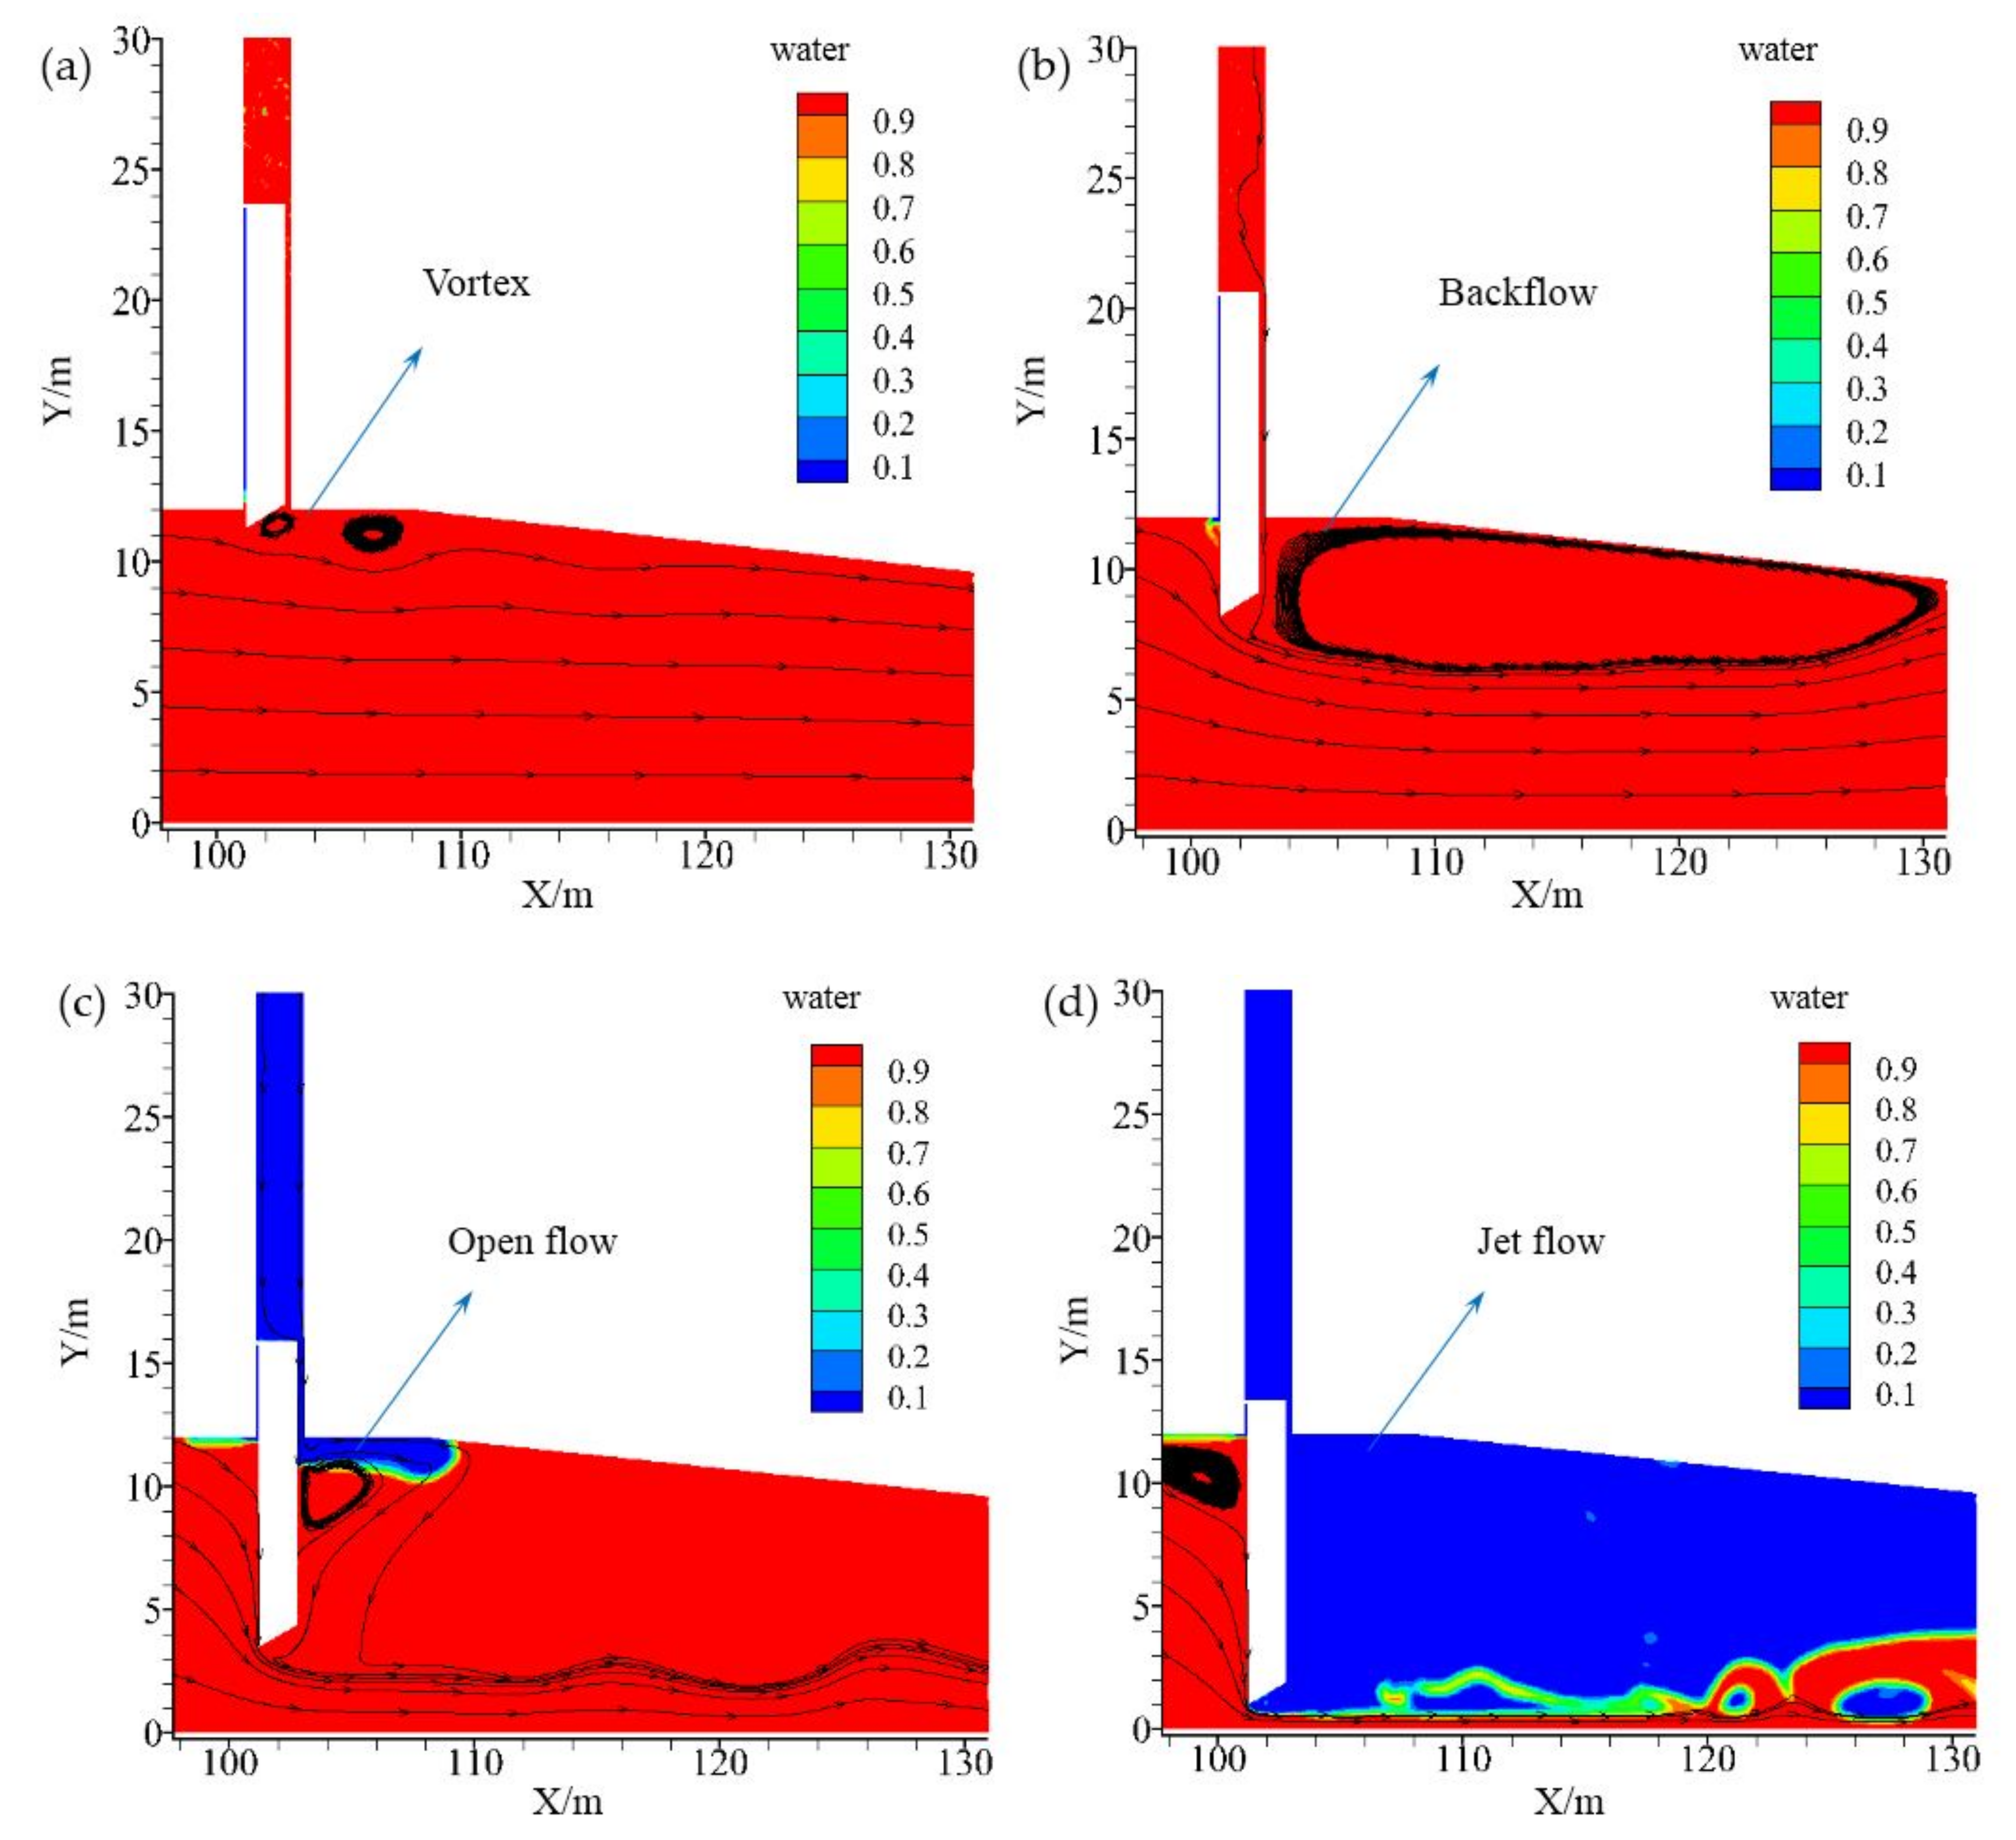
5.1. Flow Field Distribution

When the service gate height is small, the flow field behind the emergency gate is mostly full flow in the closing process. While the service gate height is large, the flow field behind the gate usually goes through the stages of the vortex, backflow, open flow and jet flow. For the upstream water depth of 65 m and service gate height of 4.0 m, Figure 9 exhibits the flow field behind the emergency gate. In the initial stage, the vortex shedding appears and mainly concentrates in a small area near the gate bottom, as displayed in Figure 9a. When the fluid flows through the gate bottom, the streamlines are separated. Afterwards, the vortex generates, detaches and moves into the downstream. The gate is subjected to the vortex action and forms the vertical vibration, which is similar to the vortex-induced vibration of marine pipelines [22]. As the gate continuously falls, the vortex shedding gradually transforms into the backflow. As depicted in Figure 9b, the backflow with a large range presents at the top of the spillway tunnel. The cause of the backflow is the shear action of the outflow and the flow draining from the gate shaft. Due to the separation of the flow draining downstream, there is a flow passage between the backflow and the gate downstream plate. As the gate drops further, the fluid in gate shaft drains completely, and air subsequently flows into the pressurized tunnel. At this stage, the flow pattern behind the gate transforms from full-flow to open-flow with strong turbulence, as displayed in Figure 9c. With the emergency gate being further closed, the flow jets out from the gate bottom and forms a submerged water jump with strong swirling and rolling in the pressurized channel, as shown in Figure 9d. At last, the emergency gate is completely closed and the flow cuts off.
Shen et al. [23] established the fluid–structure interaction numerical simulation for the emergency gate through Fluent and studied the gate vibration in a fixed gate opening. They believed that turbulent pressure and multi-vortex mixing were the main reasons for the gate flow-induced vibration. Moreover, some researchers pointed out that vortex shedding behind the gate bottom is the cause of the gate vibration [6,7]. Those results, nevertheless, were mostly obtained for low-speed flow conditions or in fixed gate openings. We found that there was no large-scale and continuous vortex shedding phenomenon at the gate bottom for high-speed flow, and vortex shedding only existed in a small range. The characteristics of gate vertical vibration in the closing process is different from that in a fixed gate opening. Thus, we have reason to believe that the gate vertical vibration is a motion-induced vibration due to the variation in fluid boundary and gate body loads caused by the gate active closing process. Meanwhile, a severe flow pattern would aggravate the gate vibration. Thus, some studies have tried to artificially create a good flow pattern to control the gate vibration. Thang and Naudascher [5] pointed out that the vibration amplitude dropped to nearly zero when a rigid plate was placed horizontally behind the gate. Markovic et al. [24] came up with a measure to effectively suppress hydrodynamic loads through placing a penetrating orifice at the gate bottom. Lee et al. [25] modified the shape of the curved gate bottom and added a guide plate to stabilize the flow. When the gate opening height is 0.08 m, the vibration reduction can reach 75%. Demirel et al. [26] mounted the horizontal porous baffle below the free surface to reduce the vortex in the gate downstream, which can effectively restrain the gate vibration.

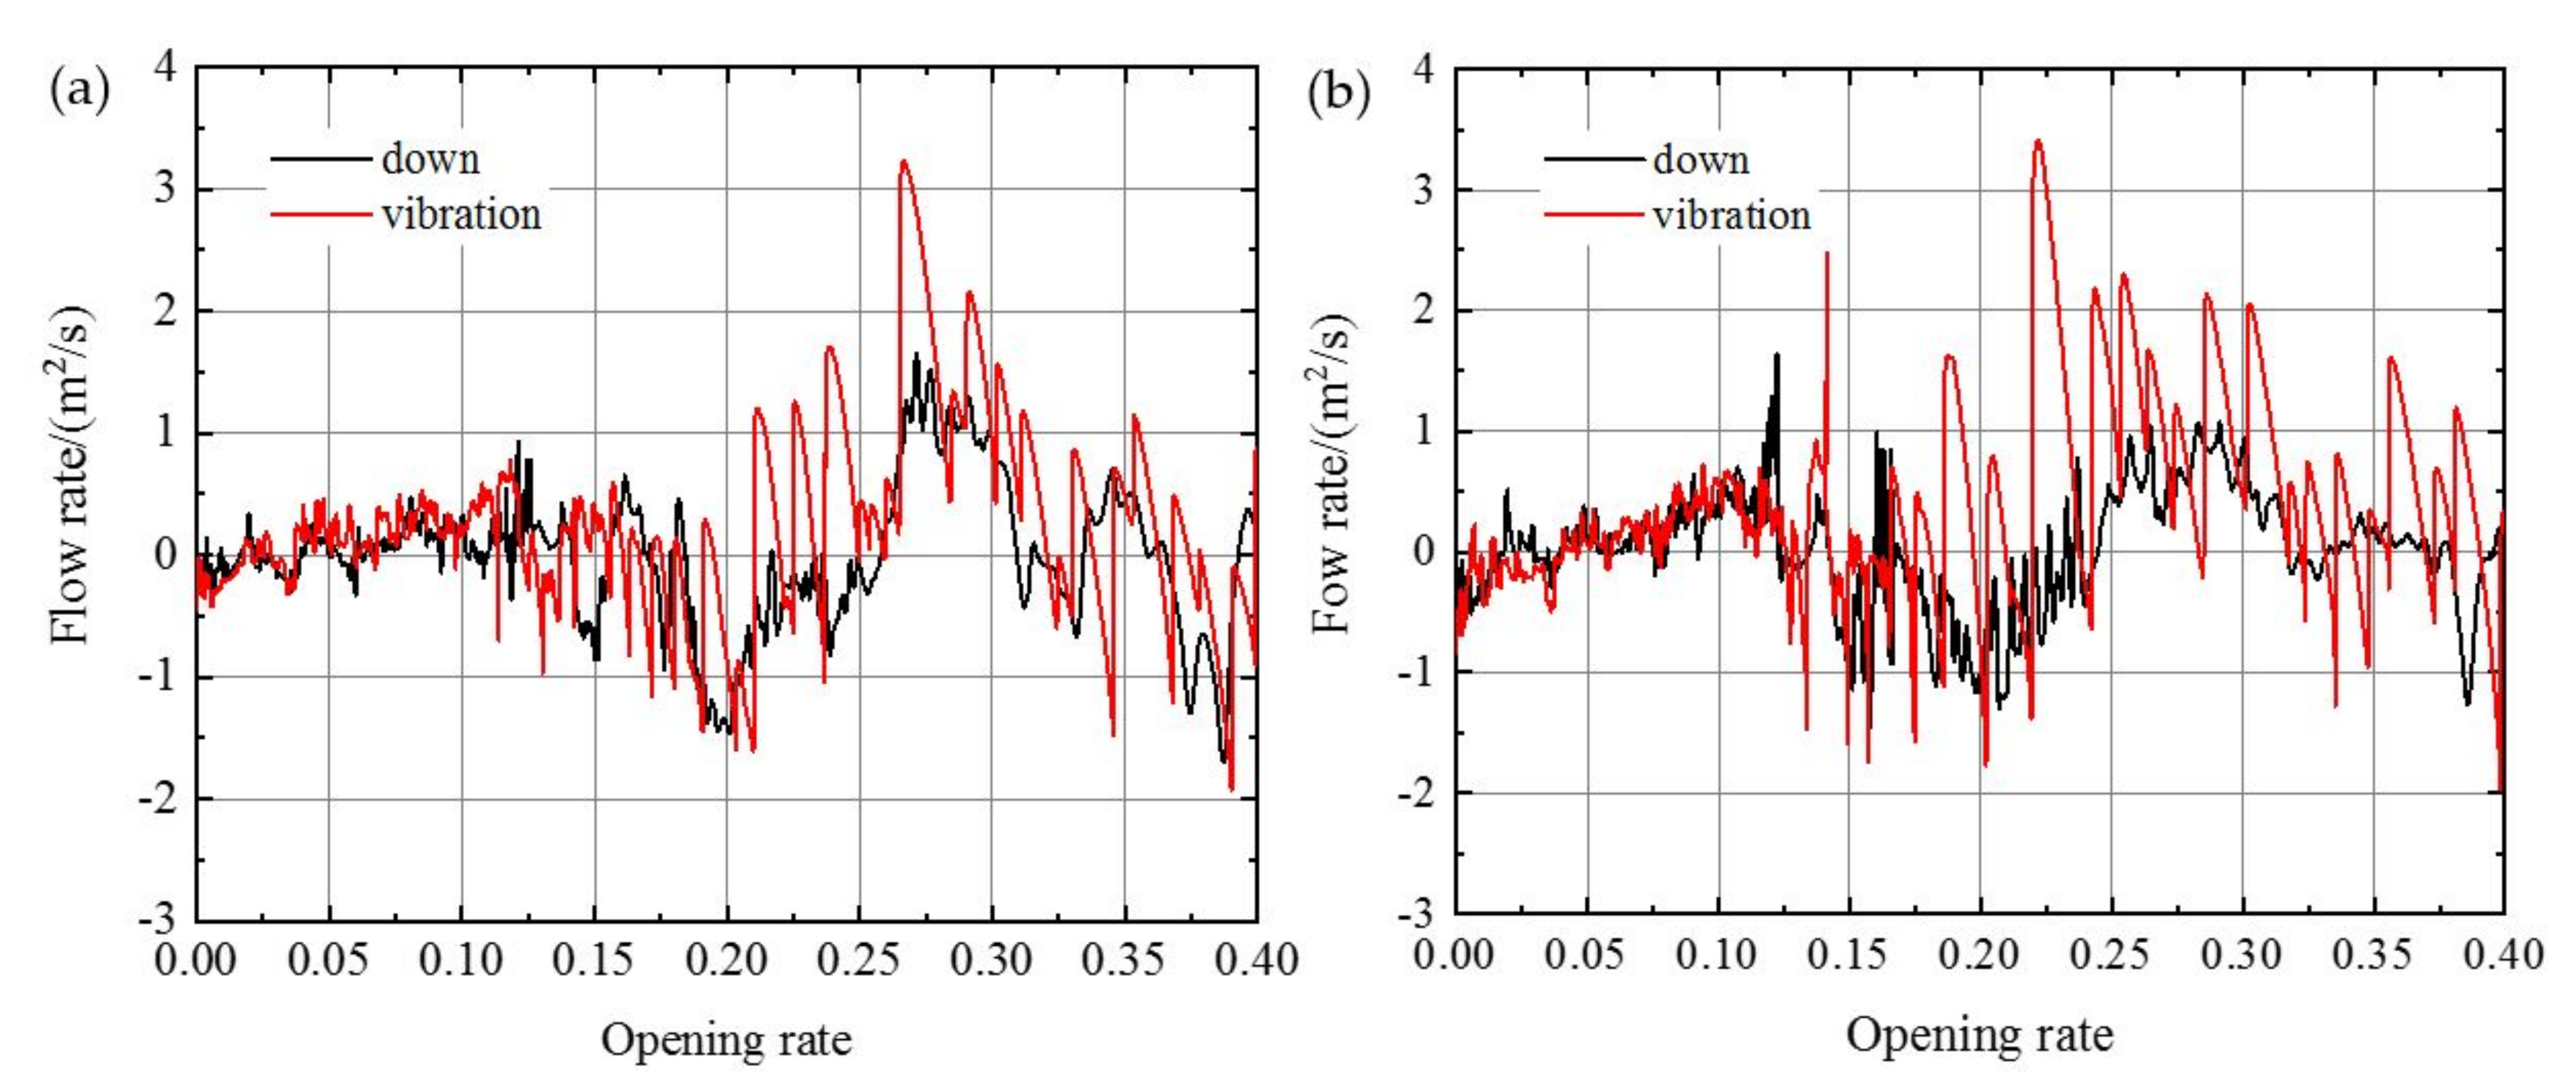
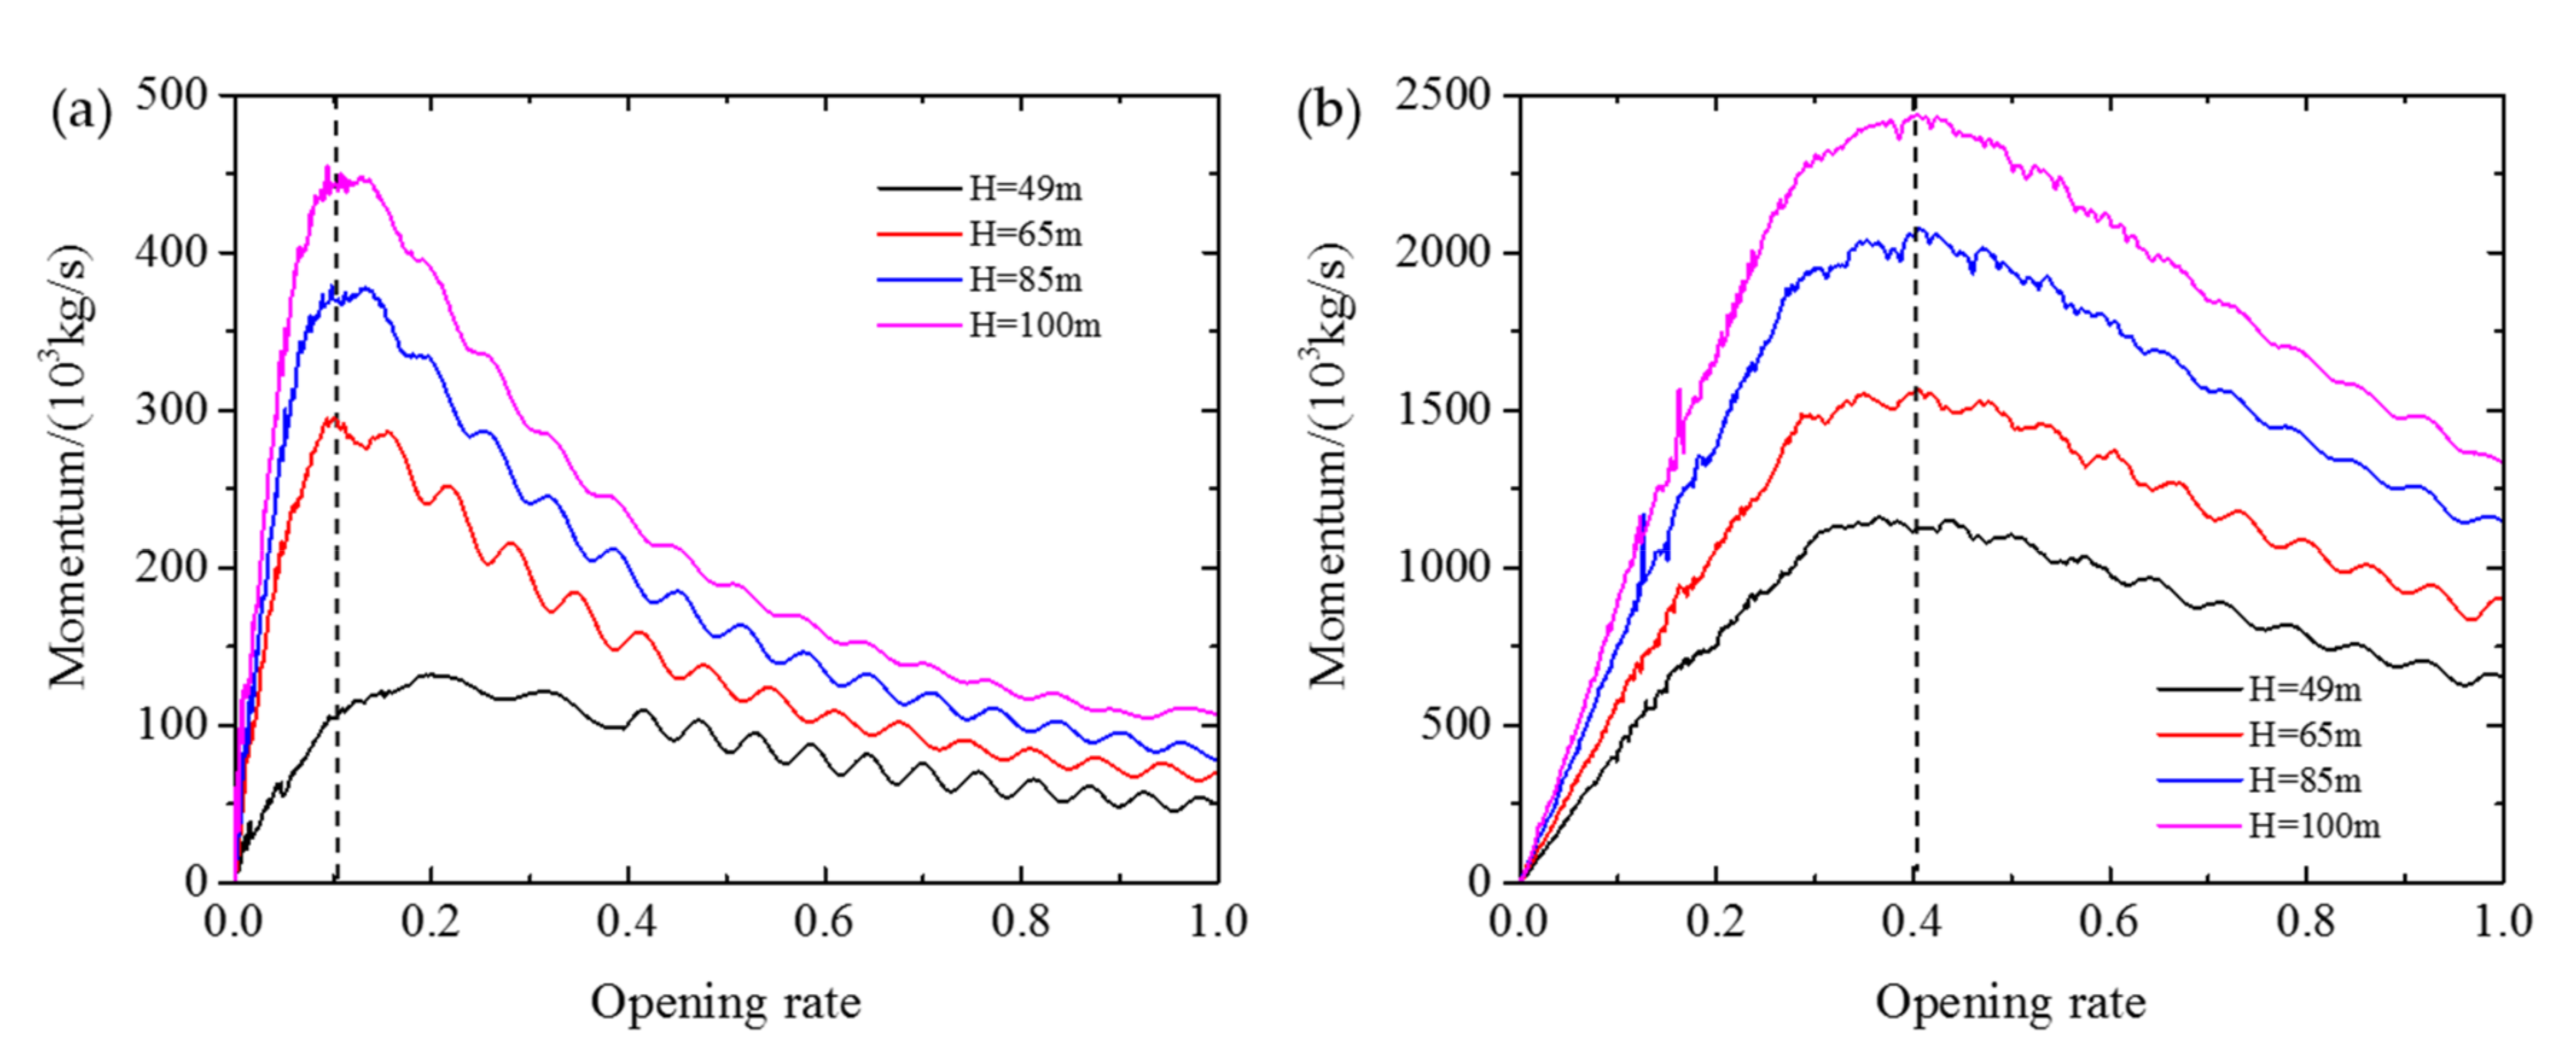
5.2. Relationship of Discharge, Loads and Vertical Vibration

Ishii and Knisely [27] reckoned that the gate stream-wise vibration was excited by upstream pressure fluctuations caused by flow discharge variations. Rogala et al. [28] confirmed that the main reason for the pressure pulsation was velocity pulsation caused by turbulence through experiment and numerical analysis. Those results indicated that there was a certain relationship between the gate vibration and flow discharge. Figure 10 exhibits the discharge difference between ‘flow1′ and ‘flow2′ for a service gate height of 4.0 m. ‘down’ means direct closing and ‘vibration’ denotes vibratory closing. The fluctuation of the discharge difference in vibratory closing is greater than that direct closing. When the upstream water depth increases, the discharge variation gradually increases. Moreover, the variation is also related to the service gate height. If the service gate is in the large gate opening, the outflow condition behind the emergency gate is open and the relationship between flow discharge and gate vibration is weak. While the service gate is in the small gate opening, gate vibration increases the discharge fluctuation. At this stage, the discharge of ‘flow1′ is less than that of ‘flow2′, and the fluid from the gate shaft needs to be supplemented with the downstream fluid. Once the fluid in gate shaft has completely drained, the air from the gate shaft enters the downstream. When the emergency gate opening rate is less than 0.1, the outflow condition is stable open-flow, and the discharge fluctuation for the two closing modes is relatively small.
Kolkman and Vrijer [29] pointed out that gate vertical vibration caused the variation in effective flow area and discharge pulsation. The discharge pulsation and its inertia effect produced the variation in pressure difference. The pressure difference would lead to the variation in hydrodynamic loads of the gate plate and affect the flow discharge in turn. Table 4 presents the correlation analysis of the flow discharge and hydrodynamic loads. With a decrease in the discharge, the gate bottom load, gate top load and downstream plate load decrease, while the upstream plate load and gate seal load increase. Meanwhile, the areas where the flow discharge have a great influence on the loads are concentrated in the upstream plate and gate bottom. Comparing to the relationship between the flow discharge, gate plate pressure and vertical vibration in terms of their numerical results, we can draw the conclusion that the vertical vibration has little influence on the discharge and gate plate pressure at a large opening rate. At a small opening rate, however, there is a strong correlation between the vertical vibration and the plate pressure due to the drastic flow pattern behind the gate. The correlation is related to the service gate height.
Figure 11 presents the relationships between panel momentum. When the opening rate decreases, the momentum initially increases and then decreases. There is a momentum peak at a certain opening rate. An increase in the upstream water depth directly causes the flow discharge and velocity to increase. Nevertheless, the increased upstream water depth has no significant effect on the position of the peak. When the service gate height increases from 1.0 m to 4.0 m, the opening rate corresponding to the momentum peak increases from e = 0.1 to e = 0.4, meaning that the peak position is mainly related to the service gate height. The reason for this phenomenon is that the downstream boundary directly affects the outflow condition and makes the open-flow behind the gate appear in advance, which causes the opening rate to increase.

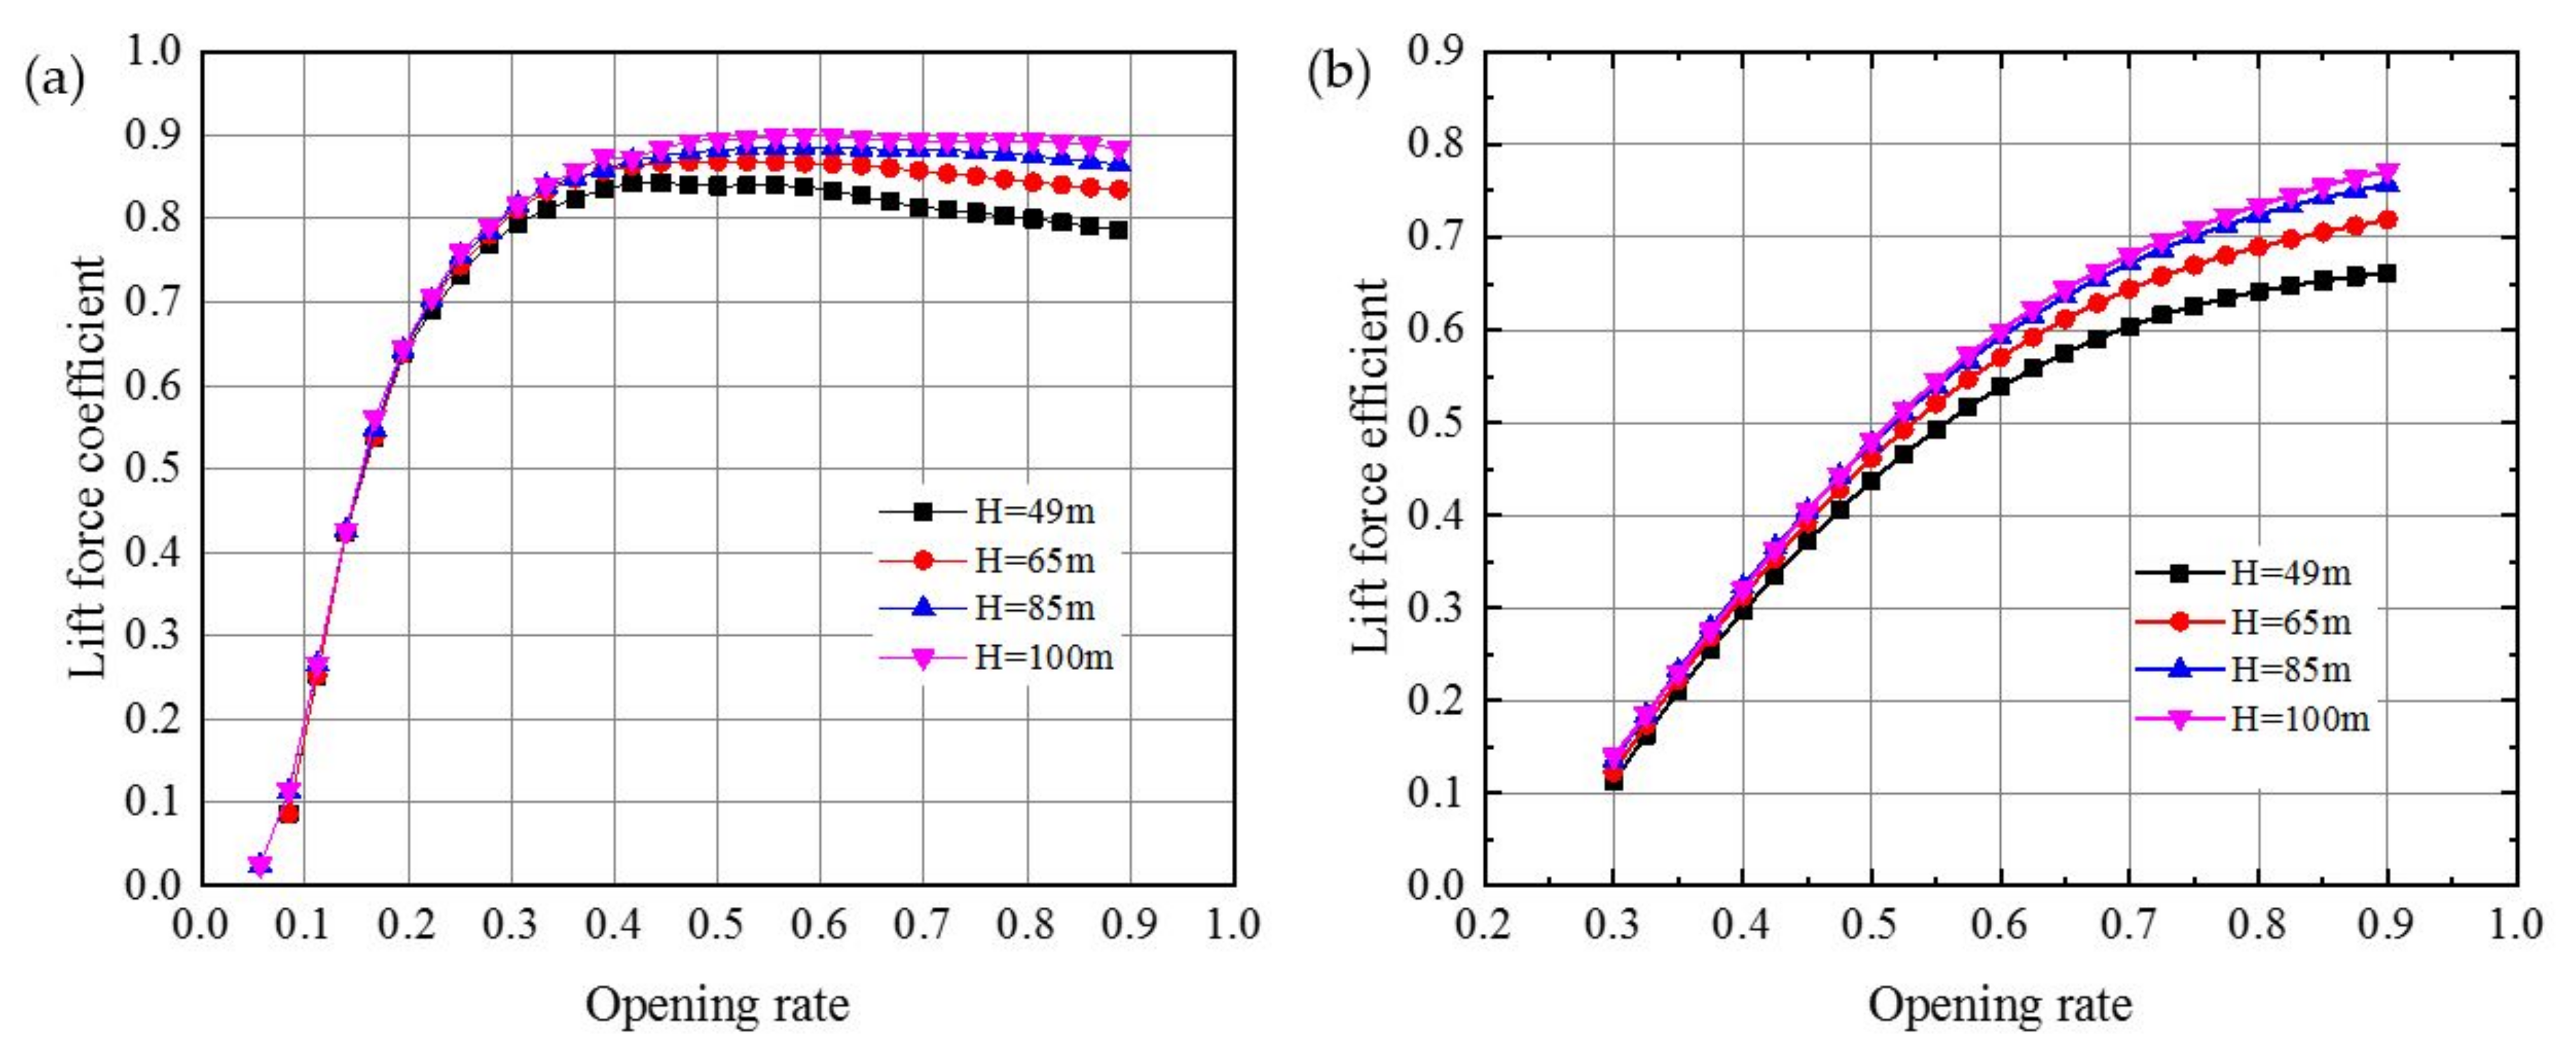
5.3. Factor Analysis

The standard gives the lift force formula: Pt = ρgβtHsD1Bzs (where ρ is the fluid density; βt is the lift force coefficient; Hs is the upstream water depth; D1 is the upstream side rake face width; and Bzs is the seal width) and suction force formula: PX = pXD2Bzs (where pX is the average intensity specified as 20 kN/m2; and D2 is the downstream side rake face width) [20]. Figure 12 depicts the lift force coefficient at the gate bottom with the opening rate. It can be seen from Figure 12 that the lift force coefficient is related to the upstream water depth, opening rate and service gate height. When the upstream water depth increases, the lift coefficient increases gradually. Nevertheless, it is different from the value 1.0 specified by the standard [20]. At a service gate height of 1.0 m, the coefficient remains almost constant at a large opening rate and decreases rapidly at opening rates below 0.3, as shown in Figure 12a. While the service gate height is 4.0 m, the coefficient decreases gradually with the decrease in opening rate (Figure 12b). However, an increase in the the upstream water depth only changes the value of the coefficient. It does not change the variation characteristics. Moreover, during the transition stage from the full-flow to open-flow, the flow pattern behind the gate is drastic turbulent. Afterwards, the air flows into the gate bottom and the negative pressure occurs at the gate bottom. The gate bottom pressure changes between the lift force and the suction force, which prompts the gate’s vertical vibration. Meanwhile, the suction force at the gate bottom does not often happen as it is related to this transition. Thus, it seems to be unreasonable to regard the suction force as a constant. The suction force should be determined based on the actual situation. Combined with the above model test results, the main influence factor of the gate bottom hydrodynamic loads is the flow pattern behind the gate, and this is determined by the service gate height.
Furthermore, the holding force is related to the gate opening rate, upstream water depth and service gate height, and its maximum might not always occur at the opening rate e = 1.0. Thus, the reasonable and accurate calculation of the holding force is of great significance to the selection of the hoist capacity. Based on the standard formula (4), the maximum holding force is 3246.45 kN under the upstream water depth of 100 m and service gate height of 1.0 m. The experimental result is 2943.53 kN and the relative error between the experiment and standard is over 10.36%. The standard calculation result might not meet the practical precision. Meanwhile, the simulation result is consistent with the experiment result. Thus, the fluid–structure interaction numerical simulation method can be used to predict the gate holding force in the closing process. If the gate counterweight is insufficient, the gate-closing speed would slow down gradually until it stops, suggesting that the method adopted in this study can also be utilized to check whether the counterweight meets the requirements and to predict the failure of gate-closing.
The variation of friction coefficient between the gate and track was weakened in this study, and the friction coefficient was viewed as a constant in the numerical model. In fact, the relationship between the friction coefficient and the relative velocity in the closing process should be taken into account, which involves the study of the friction mechanism [30,31]. Thus, the relationship and distinction of the friction-induced vibration and flow-induced vibration in the closing process need to be given more attention in subsequent research.

6. Conclusions

A two-dimensional fluid–structure interaction numerical simulation model was established to investigate the characteristics of an emergency gate closing process. Attention was paid to the relationship between the hydrodynamic loads, the flow discharge and the gate vertical vibration. The results are as follows.
The flow pattern behind the emergency gate in the closing process has no large-scale and continuous vortex shedding phenomenon for high-speed flow and the vortex shedding only exists within a small range. It is reasonable to reckon that the gate’s vertical vibration in the closing process is a motion-induced vibration due to the fluid boundary and gate plate loads caused by the gate’s active motion.
The flow discharge has a significant influence on the gate plate loads, mainly concentrated on the upstream plate and the gate bottom. The gate vertical vibration increases the fluctuation intensity of the flow discharge at a small opening rate. The transition from full-flow to open-flow behind the emergency gate makes the hydrodynamic loads change significantly and promotes the gate’s vertical vibration.
The lift force coefficient at the gate bottom is related to the downstream flow boundary and it is mainly determined by the service gate height. The relative error between the simulation and the experiment is small and meets the requirements of accuracy for practical engineering. The numerical method adopted in this study can achieve the gate fluid–structure interaction and be utilized to explore the characteristics of the holding force in the closing process, which can effectively make up for the deficiency of the standard formula for calculating the holding force.

Author Contributions

Conceptualization, Y.W. and G.X.; methodology, Y.W. and G.X.; investigation, Y.W.; data curation, F.L.; writing—original draft preparation, Y.W.; writing—review and editing, F.L.; visualization, Y.W.; and supervision, G.X. All authors have read and agreed to the published version of the manuscript.

Funding

This research was funded by National Natural Science Foundation of China (Grant No. 51779166).

Informed Consent Statement

Written informed consent has been obtained from the patient(s) to publish this paper.

Data Availability Statement

Exclude this statement.

Acknowledgments

The authors gratefully acknowledge the editors and anonymous reviewers for their insightful and professional suggestions.

Conflicts of Interest

The authors declare no conflict of interest.

References

  1. Peng, Y.; Zhang, J.; Xu, W.-L.; Rubinato, M. Experimental Optimization of Gate-Opening Modes to Minimize Near-Field Vibrations in Hydropower Stations. Water 2018, 10, 1435. [Google Scholar] [CrossRef] [Green Version]
  2. Naudascher, E. Flow-induced loading and vibration of gates. In Proceedings of the International. Symposium on Hydraulics for High Dams, Beijing, China, 15–18 November 1988; pp. 1–18. [Google Scholar]
  3. Hardwick, J.D. Flow-induced vibration of vertical-lift gate. J. Hydr. Div. ASCE 1974, 1005, 631–644. [Google Scholar] [CrossRef]
  4. Jongeling, T.H.G. Flow-induced self-excited in-flow vibrations of gate plates. J. Fluids Struct. 1988, 2, 541–566. [Google Scholar] [CrossRef]
  5. Thang, N.D.; Naudascher, E. Self-excited vibrations of vertical-lift gate. J. Hydraul. Res. 1986, 24, 391–404. [Google Scholar] [CrossRef]
  6. Thang, N.D. Gate Vibrations due to Unstable Flow Separation. J. Hydraul. Eng. 1990, 116, 342–361. [Google Scholar] [CrossRef]
  7. Ishii, N.; Knisely, C.W.; Nakata, A. Coupled-Mode Vibration of Gates with Simultaneous Over-and Underflow. J. Fluids Struct. 1994, 8, 455–469. [Google Scholar] [CrossRef]
  8. Ogihara, K.; Ueda, S. The Conditions of Self-Excited Vibration Occurring in Radial Gates. In Proceedings of the WaterPower Conference 1999, Las Vegas, NV, USA, 6–9 July 1999; pp. 1–10. [Google Scholar]
  9. Anami, K.; Ishii, N.; Knisely, C.W.; Tatsuya, T.; Sato, O. Friction-Maintained Dynamic Stability. In Vibration Problems ICOVP 2011; Springer Proceedings in Physics: Berlin/Heidelberg, Germany, 2011; pp. 779–785. [Google Scholar]
  10. Yang, T.; He, S.; Shen, C.; Qi, Y. Fluid-induced Vibrations Test of Hydraulic Plane Gate for Different Conditions. In Proceedings of the International Conference on Sensors, Shenzhen, China, 27–28 December 2015; pp. 1083–1089. [Google Scholar]
  11. Jafari, A.; Kabiri-Samani, A.; Behnamfar, F. Flow-induced horizontal and vertical vibration of sluice gates. Water Manag. 2018, 3, 152–162. [Google Scholar] [CrossRef]
  12. Wang, Y.; Xu, G.; Li, W.; Liu, F.; Duan, Y. Characteristics of Plane Gate Vibration and Holding Force in Closing Process by Experiments. Appl. Sci. 2020, 10, 6111. [Google Scholar] [CrossRef]
  13. Li, G.; Yang, J.; Yang, B.; Li, B. Analysis on prototype observation on lifting power of spillway tunnel working gate for Tianqiao Hydropower Station. Water Resour. Hydropower Eng. 2005, 36, 1–4. [Google Scholar]
  14. Ma, C.; Sheng, C.; Lian, J.; Ma, B.; Liu, F. Failure analysis of a leaf gate jammed in closing process. Eng. Fail. Anal. 2020, 110, 104391. [Google Scholar] [CrossRef]
  15. Kim, N.-G.; Cho, Y.; Lee, K.B. Flow-induced vibration and flow characteristics prediction for a sliding roller gate by two-dimensional unsteady CFD simulation. J. Mech. Sci. Technol. 2017, 31, 3255–3260. [Google Scholar] [CrossRef]
  16. Liu, Z.; Zhang, D.; Zhang, H.; Wu, Y. Hydraulic characteristics of converse curvature section and aerator in high-head and large discharge spillway tunnel. Sci. China Technol. Sci. 2011, 54, 33–39. [Google Scholar] [CrossRef]
  17. Billeter, P.; Staubli, T. Flow-induced multiple-mode vibrations of gates with submerged discharge. J. Fluids Struct. 2000, 14, 323–338. [Google Scholar] [CrossRef]
  18. Erdbrink, C.D.; Krzhizhanovskaya, V.V.; Sloot, P. Reducing cross-flow vibrations of underflow gates: Experiments and numerical studies. J. Fluids Struct. 2014, 50, 25–48. [Google Scholar] [CrossRef] [Green Version]
  19. Liang, C.; Zhang, J.; Lian, J.; Liu, F. Research on slip-stick vibration of emergency gate induced by high dam flood discharge. J. Hydraul. Eng. 2018, 49, 1503–1511. (In Chinese) [Google Scholar]
  20. Ministry of Water Resources of the People’s Republic of China. Specification for Design of Steel Gate in Hydraulic and Hydroelectric Engineering (NB 35055—2015); China Water & Power Press: Beijing, China, 2015; pp. 52–54. (In Chinese)
  21. Zhu, H.; Zhou, T. Flow around a circular cylinder attached with a pair of fin-shaped strips. Ocean Eng. 2019, 190, 106484. [Google Scholar] [CrossRef]
  22. Zhu, H.; Qi, X.; Lin, P.; Yang, Y. Numerical simulation of flow around a submarine pipe with a spoiler and current-induced scour beneath the pipe. Appl. Ocean Res. 2013, 41, 87–100. [Google Scholar] [CrossRef]
  23. Shen, C.; Wang, W.; He, S.; Xu, Y. Numerical and Experimental Comparative Study on the Flow-Induced Vibration of a Plane Gate. Water 2018, 10, 1551. [Google Scholar] [CrossRef] [Green Version]
  24. Jelena, M.; Helmut, D. A high head gate innovation numerical and experiment analysis of hydrodynamic forces. Math. Model. Civil Eng. 2010, 2, 27–34. [Google Scholar]
  25. Lee, S.O.; Seong, H.; Kang, J.W. Flow-induced vibration of a radial gate at various opening heights. Eng. Appl. Comput. Fluid Mech. 2018, 12, 567–583. [Google Scholar] [CrossRef] [Green Version]
  26. Demirel, E.; Aral, M.M. A Design for Vortex Suppression Downstream of a Submerged Gate. Water 2020, 12, 750. [Google Scholar] [CrossRef] [Green Version]
  27. Ishill, N.; Knisely, C.W. Flow-induced vibration of shell-type long-span gates. J. Fluids Struct. 1992, 6, 681–703. [Google Scholar]
  28. Ryszard, R.; Jan, W. Hydrodynamic Pressures Acting upon Hinged-Arc Gates. J. Hydraul. Eng. 1985, 111, 584–599. [Google Scholar]
  29. Kolkman, P.A.; Vrijer, A. Vertical Gate Vibrations by Galloping or by Fluid Inertia. J. Hydraul. Res. 1987, 25, 418–423. [Google Scholar] [CrossRef]
  30. Zhou, G.; Li, P.; Liao, D.; Zhang, Y.; Zhong, P. The Friction-Induced Vibration of Water-Lubricated Rubber Bearings during the Shutdown Process. Materials 2020, 13, 5818. [Google Scholar] [CrossRef] [PubMed]
  31. Sinou, J.J.; Chomette, B. Active vibration control and stability analysis of a time-delay system subjected to friction-induced vibration. J. Sound Vib. 2021, 500, 116013. [Google Scholar] [CrossRef]
Figure 1. Schematic diagram of experiment setup.
Applsci 11 08440 g001
Figure 2. Physical model layout.
Applsci 11 08440 g002
Figure 3. Schematic diagram of the monitoring section.
Applsci 11 08440 g003
Figure 4. Holding force with different upstream depths: (a) service gate height 0.2 m; (b) service gate height 1 m; (c) service gate height 4 m; and (d) service gate height 6 m.
Applsci 11 08440 g004
Figure 5. Critical opening rate from full-flow to open-flow in transition stage.
Applsci 11 08440 g005
Figure 6. Comparison of experiment and simulation: (a) service gate height 1 m; (b) service gate height 4 m.
Applsci 11 08440 g006
Figure 7. Closing displacement with time.
Applsci 11 08440 g007
Figure 8. Flow discharge and velocity: (a) service gate height 1.0 m; and (b) service gate height 4.0 m.
Applsci 11 08440 g008
Figure 9. Flow regime of behind the gate at different stages: (a) vortex; (b) backflow; (c) open flow; and (d) jet flow.
Applsci 11 08440 g009
Figure 10. Discharge difference of monitoring: (a) water depth 85 m; and (b) water depth 100 m.
Applsci 11 08440 g010
Figure 11. Panel momentum: (a) service gate height 1.0 m; and (b) service gate height 4.0 m.
Applsci 11 08440 g011
Figure 12. Lift force coefficient: (a) service gate height 1 m; and (b) service gate height 4 m.
Applsci 11 08440 g012
Table 1. Parameters of emergency gate.
ProjectsPrototype Size
Emergency gate7.96 × 12.46 × 1.55 m3 (width × height × thickness)
Spillway channel6 × 12 m2 (width × height)
Support typeFixed wheel
Mass235 t
Counterweight165 t
Operation speed2 m/min
Closing time6 min
SealUpstream seal
Gate bottom edgeDownstrem inclination with 30°
Operation requirementClose in transient water and open in still water
Table 2. Mesh dependence check.
Minimum Grid Size of Gate BoundaryForce (kN)Relative Error (%)
M1 (80 mm)38,473.530.48
M2 (60 mm)38,274.68−0.04
M3 (40 mm)38,435.010.38
Table 3. Simulation validation with experiment results. Unit: kN.
Upstream Water DepthService Gate Height 1.0 mService Gate Height 4.0 m
ExperimentSimulationRelative Error/%ExperimentSimulationRelative Error/%
49 m18,335.8018,549.44−1.166216.146194.580.34
65 m24,128.5824,847.90−2.988794.528745.520.56
85 m30,601.4631,946.04−4.3911,048.5211,336.64−2.60
100 m38,288.6039,619.44−3.4714,732.3613,659.247.08
Table 4. Correlation between the discharge and hydrodynamic loads.
Water Depth (m)496585100
Service gate height 1 mbottom0.600 **0.984 **0.986 **0.983 **
upstream−0.308 **−0.752 **−0.783 **−0.743 **
downstream0.765 **0.988 **0.987 **0.984 **
seal0.555 **−0.190 **−0.361 **−0.117 **
top0.735 **0.979 **0.980 **0.983 **
Service gate height 4 mbottom0.907 **0.896 **0.892 **0.889 **
upstream−0.950 **−0.873 **−0.936 **−0.896 **
downstream0.858 **0.861 **0.866 **0.867 **
seal−0.749 **−0.604 **−0.776 **−0.725
top0.798 **0.826 **0.84 5 **0.851 **
Note: * denotes a significant difference (p < 0.05), ** denotes a significant difference (p < 0.01).
Publisher’s Note: MDPI stays neutral with regard to jurisdictional claims in published maps and institutional affiliations.

