Article

Aerosol–Cloud Interaction at the Summit of Mt. Fuji, Japan: Factors Influencing Cloud Droplet Number Concentrations

1
Graduate School of Integrated Sciences for Life, Hiroshima University, Higashi-Hiroshima 739-8521, Japan
2
Faculty of Science Division I, Tokyo University of Science, Tokyo 162-8601, Japan
3
Graduate School of Science, Tokyo University of Science, Tokyo 162-8601, Japan
4
Atmosphere and Ocean Research Institute, The University of Tokyo, Kashiwa 277-8564, Japan
5
Center for Environmental Science in Saitama, Kazo 347-0115, Japan
6
Laboratory for Environmental Research at Mount Fuji, Tokyo 169-0072, Japan
*
Author to whom correspondence should be addressed.
Appl. Sci. 2021, 11(18), 8439; https://doi.org/10.3390/app11188439
Submission received: 26 July 2021 / Revised: 6 September 2021 / Accepted: 9 September 2021 / Published: 11 September 2021

Abstract

:
To investigate interactions between aerosols and clouds, the size and number concentrations of the cloud condensation nuclei (CCN) and the cloud droplets (CDs) were measured at the summit of Mt. Fuji (altitude 3776 m), Japan. The CCN number concentrations (NCCN) are significantly higher in continental air masses than in air masses from the Pacific Ocean. The hygroscopicity parameter κ did not change much for different air mass origins, indicating that aerosol particles in the free troposphere are well mixed. Based on the CD number concentrations (NCD), the degree of supersaturation in the ambient air during the cloud-shrouded period was estimated to be 0.15% (25th percentile) to 0.44% (75th percentile). To evaluate factors influencing the NCD, measured NCD were compared to ones calculated based on the Köhler theory using aerosol number size distributions, κ, and the degree of supersaturation. The results showed that NCD could not be reproduced satisfyingly when the mean number size distribution or the mean effective supersaturation were used for the calculation. This study highlights the importance of obtaining information about the degree of supersaturation to predict NCD in the atmosphere.

1. Introduction

Aerosol particles in the atmosphere can act as cloud condensation nuclei (CCN), which affect the Earth’s radiation budget, and consequently the Earth’s climate. The number concentration of CCN is a key factor for determining cloud optical properties and precipitation. The CCN activation of an aerosol particle is explained by the Köhler theory [1], and aerosol particles are more likely to act as CCN if the degree of water vapor supersaturation (SS) in the ambient air is higher, the particle size larger, and the particle more hygroscopic. The hygroscopicity of a particle strongly depends on its chemical composition. The relative importance of the size and chemical composition of aerosol particles in determining CCN concentrations at a given SS has been discussed elsewhere (e.g., [2,3]). Several publications state that the CCN activation of aerosol particles is mainly controlled by their size distribution rather than their chemical composition [2]. On the other hand, it has been reported that the chemical composition also matters, especially in regions with a mix of both fresh and aged aerosols [3]. In order to better understand the factors governing CCN number concentrations, it is important to accumulate CCN observation data at various sites. These data can contribute to the refinement of numerical predictions of both CCN and cloud droplet number concentrations.
With regard to the CCN activation of aerosol particles, both the particle size distribution and chemical composition of atmospheric aerosols have been measured at various locations (e.g., [4]), whereas the knowledge about SS is limited. Water vapor SS is an important parameter for CCN activation of aerosols and is necessary for numerical models predicting cloud/fog formation [5,6,7]. A critical degree of supersaturation (SSc) can be determined for a single particle based on the Köhler theory. In the atmosphere, where the size and chemical compositions of aerosol particles are complex, a range of critical supersaturations is generated for a number of CCN. The SS at which the CCN concentration equals the cloud droplet number concentration is termed effective supersaturation (SSeff) and is considered that the SSeff exceeds the SSc for all CCN active particles in the atmosphere [1]. Although direct measurement of the SS remains unattainable, it is possible to estimate the SSeff indirectly from observation data. The reported values of the SSeff have been limited to Europe [8,9,10,11], and SSeff values from Asian regions have been limited [12].
Observations using airplanes (e.g., [13]), balloons (e.g., [14]) or helicopters (e.g., [10]) are powerful approaches to observe both aerosol and cloud particles in the atmosphere directly. Although these observations by aircraft have provided important findings of aerosol-cloud interactions, it is difficult to get long-term observation data. At mountain sites, orographic clouds frequently form when air flows upward along a mountain slope and the air temperature drops below the dew point due to adiabatic expansion. Observations at mountain sites, therefore, make it possible to observe the CCN activate into cloud droplets on-site over a long time period. Several studies have reported CCN properties at mountain sites. For example, at Jungfraujoch (altitude 3580 m), Switzerland, the impact of the aerosol size distribution on cloud droplet properties [15], CCN activation over the period of one year [16], temporal variations of aerosol hygroscopicity in the free troposphere [17] and scavenge of black carbon in liquid-phase clouds [18] have been studied. Henning et al. [19] reported changes in the hygroscopicity of aerosols through cloud-processing observed at the upwind and downwind sites of Mt. Schmücke (altitude 937 m), Germany. Friedman et al. [20] reported the impact of anthropogenic aerosols on CCN activation at Storm Peak Laboratory in Colorado (altitude 3210m), United States. Asmi et al. [9] compared CCN and actually activated particles inside a cloud by using a two-inlet system at Puy-de-Dôme, France (altitude 1465 m), and Hsiao et al. [21] characterized CCN at two different mountain sites in Asia, Doi Ang Kang (altitude 1536 m), Thailand and Mt. Lulin (altitude 2862 m), Taiwan.
In this study, we observed aerosols and clouds at the summit of Mt. Fuji (altitude 3776 m; Figure 1a), Japan, at the highest atmospheric monitoring site downwind of East Asia, during the summer of 2014. Because the summit of Mt. Fuji is mostly in the free troposphere, the observation site is less affected by local air pollutants and thus is a suitable site to observe differences in CCN characteristics of different air mass origins. During the observation period, the number concentrations of aerosol particles, CCN, and cloud droplets were measured simultaneously. Using the observation data of cloud-shrouded periods, the SSeff of the ambient atmosphere is evaluated. In addition, the factors determining the cloud droplet number concentrations at the summit of Mt. Fuji are discussed, including the SSeff, aerosol size distribution, and the chemical composition of aerosol particles.

2. Materials and Methods
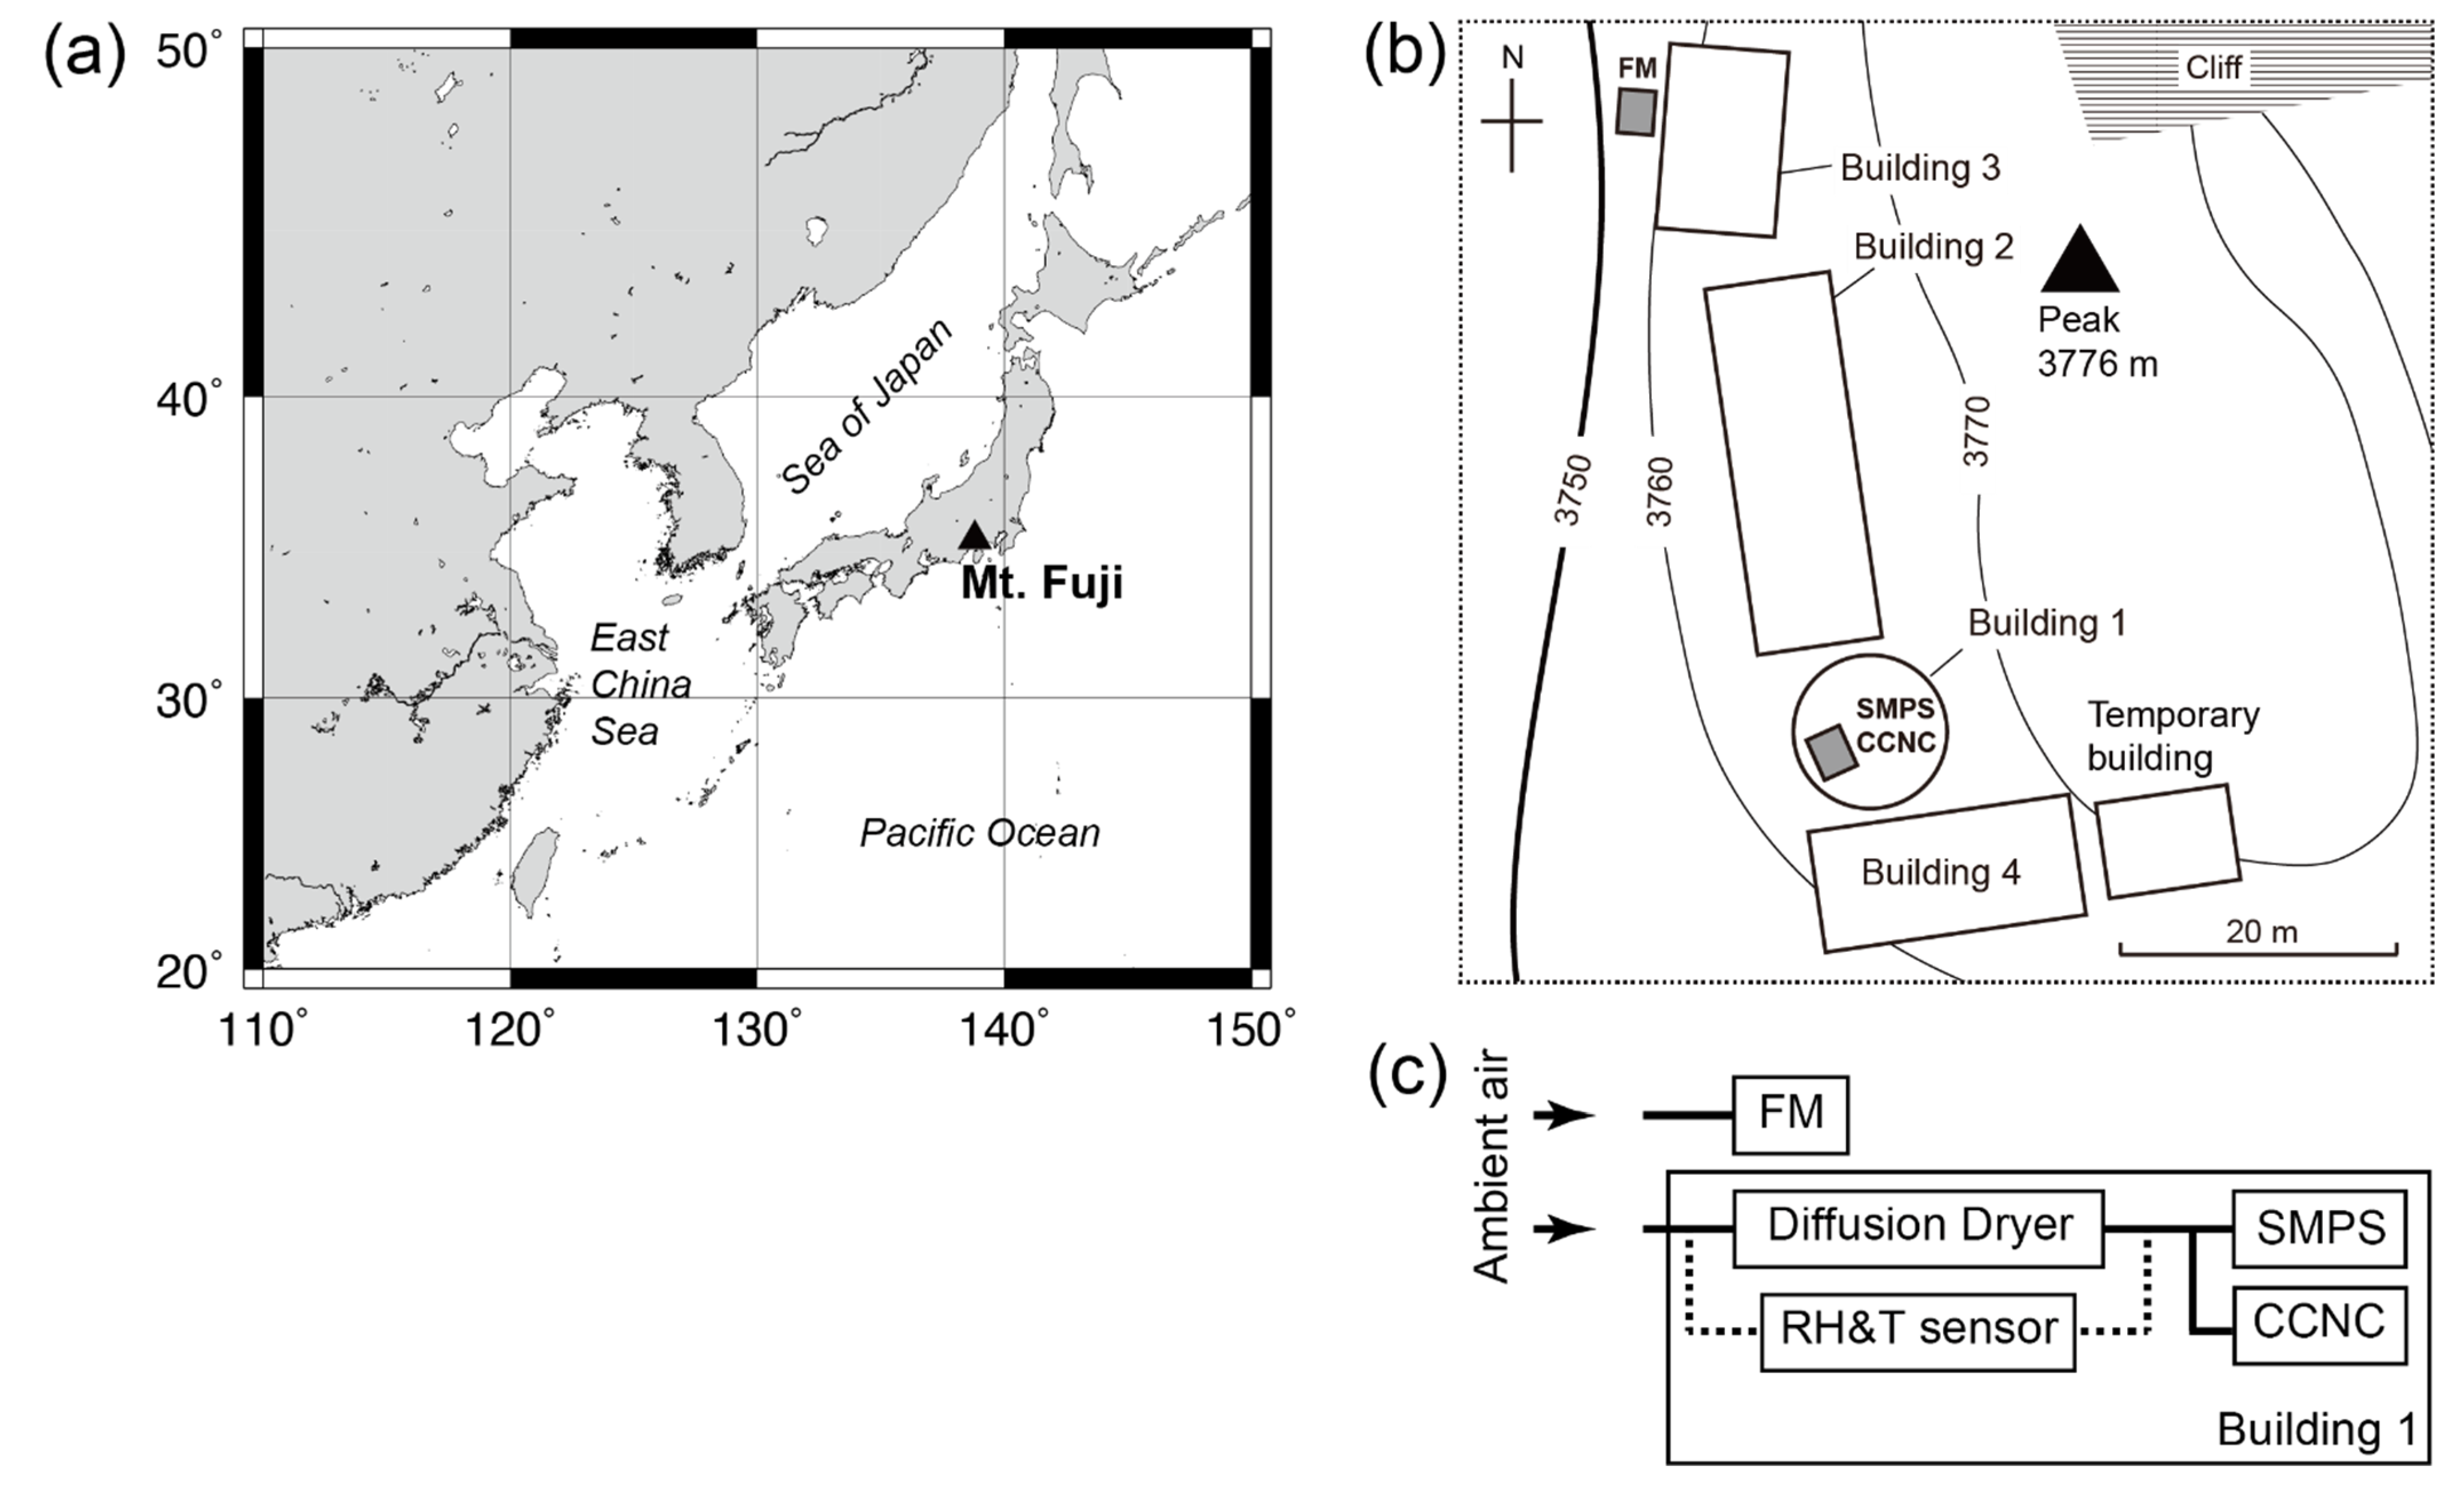
2.1. Observation

Atmospheric observations were conducted at the Mt. Fuji Research Station (MFRS) (35.36° N, 138.73° E, altitude 3776 m) at the summit of Mt. Fuji (Figure 1a) from 18 July to 20 August of 2014. More details on the MFRS can be found elsewhere (e.g., [22,23]). Briefly, the MFRS consists of five buildings: Building 1, building 2, building 3, building 4 and a temporary building (Figure 1b). Aerosol observations were conducted at buildings 1 and 3 during summer only, when the commercial power supply was available. The instrumental setup used in this study is shown in Figure 1c.
Ambient air was drawn from an air inlet installed on the 2nd floor of building 1 using a conductive silicon tube (I.D. 3/8 in.) and introduced into a diffusion dryer filled with silica gel to dehumidify the sample air down to a relative humidity (RH) of 30% or less. Temperature and RH of the sampled air both upstream and downstream of the diffusion dryer were measured by a temperature and humidity sensor (HygroPalm23, Rotronic AG). After the diffusion drying, the size distribution of aerosol particles ranging in size from 10 to 500 nm in diameter was determined by a scanning mobility particle sizer (SMPS; SMPS3034, TSI Inc., Shoreview, MN, USA). Number concentration of total aerosol particles (condensation nuclei, CN) (NCN) was calculated by the sum of the aerosol concentrations of particles in the range of 10 to 500 nm obtained by the SMPS. The particle loss at the diffusion dryer was calculated to be about 7% for the minimum size bin of the SMPS (the diameter midpoint is 10.4 nm), and less than 3% above 20 nm in diameter. The number size distributions were corrected on the basis of this calculation. Note that SPMS data are missing from 18:00 LT (LT = UTC + 9 h) 30 July to 07:00 LT 31 July, from 23:00 LT 1 August to 12:00 LT 3 August, and from 07:00 LT 7 August to 11:00 LT 14 August, due to maintenance and instrumental failure. Simultaneously, number concentrations of CCN (NCCN) at 6 different SSs (0.02, 0.06, 0.16, 0.21, 0.36 and 0.55%) were measured using a CCN counter (CCNC, CCN-100, DMT Inc., Loveland, CO, USA). The CCN data obtained at the 0.02% and 0.06% SS conditions were not used for the following analysis because those SSs are below the operating limit (0.07%; [24]). The SSs were calibrated on-site by using (NH4)2SO4 particles. For the calibration, the (NH4)2SO4 particles were generated by atomization of an aqueous solution of (NH4)2SO4 (Kanto Chemical Co., Inc., Tokyo, Japan, >99.5%) and introduced to a diffusion dryer filled with silica gel to dehumidify the (NH4)2SO4 aerosol to RH of 30% or less. A differential mobility classifier (Model 3081, TSI Inc., Minnesota, USA) was used to classify the particles in the range of 30 to 200 nm every 10 nm, and the NCN and NCCN of the monodisperse aerosol particles were measured by a condensation particle counter (Model 3025A, TSI Inc., Shoreview, MN, USA) and the CCNC, respectively, to obtain CCN activation spectra. For the calibration, a Köhler model similar to the Reference Köhler model described by Brechtel and Kreidenweis [25] was applied.
Number concentrations (NCD) and size distributions (from 2 to 50 μm in diameter) of cloud droplets (CD) were measured by a fog monitor (FM, FM-100, DMT Inc., Loveland, CO, USA) which was installed outside of building 3. The most frequent wind direction at the summit of Mt. Fuji was west [26]. Therefore, the FM was installed with its inlet facing the west slope because orographic clouds are likely to be generated by the wind ascending the westerly slope. Meteorological data, including air temperature, RH, atmospheric pressure, precipitation, wind speed and wind direction, were obtained by a meteorological data acquisition system.

2.2. Data Processing

The SMPS measured the number size distribution of the aerosol particles every 3 min. The hourly-averaged values of NCN and the size distributions were used in the following analyses. The CCN counter measured NCCN every second. It was operated at 6 different SS conditions and each SS condition continued for 10 min. Thus, it took 1 h to complete one cycle. Averaged values of NCCN at each SS condition were calculated for every hour. The NCCN data obtained at the 0.16, 0.21, 0.36 and 0.55% SSs were used for the following analysis. The FM measured the NCD every 10 s and hourly-averaged values of NCD were used for the following analyses.
When aerosol particles are mixed well internally, the particles with diameters larger than the activation diameter (da) can activate as CCN at a given SS. Then, NCCN can be written as:
N CCN = d a d max n ( log d ) dlog d ,
where d and n(logd) are the dry diameter and the number size distribution of the aerosol obtained by SMPS, respectively. Then da can be obtained by integrating the particle size distributions. The maximum particle size measured by SMPS, 500 nm, was used as dmax.
The relationship between the saturation ratio, S, and the droplet diameter is described by the Köhlor theory [1]. The theory can be re-written by using the hygroscopicity parameter κ [27] as follows:
S = d drop 3 d 3 d drop 3 d 3 ( 1 κ ) exp ( 4 σ s / a M w R T ρ w d drop ) ,
where ddrop is the droplet diameter, σs/a is the surface tension at the solution–air interface, Mw is the molecular weight of water, R is the universal gas constant, T is the droplet temperature, and ρw is the density of pure water. Note that the relationship between supersaturation, SS, and saturation ratio, S, is as below:
S S = ( S 1 ) × 100 % .
Equation (2) can be simplified as follows [27,28]:
S = exp ( 4 A 3 27 κ d 3 ) ,
The parameter A represents Kelvin’s term and can be written as:
A = 4 σ s / a M w R T ρ w ,
In Equation (5), A     0.66/T (in mm) can be used [29]. The κ of ambient aerosol was then calculated for each SS condition (0.16, 0.21, 0.36 and 0.55%) of the CCN counter by using d as da in Equation (4):
κ = 4 A 3 27 d a 3 ln 2 S .
By applying Equation (1) and replacing NCCN by NCD, the activation diameters (da, CD) under ambient SS conditions were calculated based on the aerosol size distributions:
N CD = d a , CD d max n ( log d p )   dlog d p .
To estimate the SSeff of the clouds observed at the MFRS, we used the regression curve of the relationship between mean da, calculated by Equation (1), and SS obtained by the CCN measurements. Using the data collected by the FM, the liquid water content (LWC) and the effective radius (Reff) of the cloud droplets were calculated using the following equations [15], respectively:
L W C = π 6 ρ w i n i d i 3 ,
R eff = 1 2 i n i d i 3 / i n i d i 2 ,
where, ni is the number concentration of cloud droplets and di is the geometric mean diameter of each size bin set by the FM.

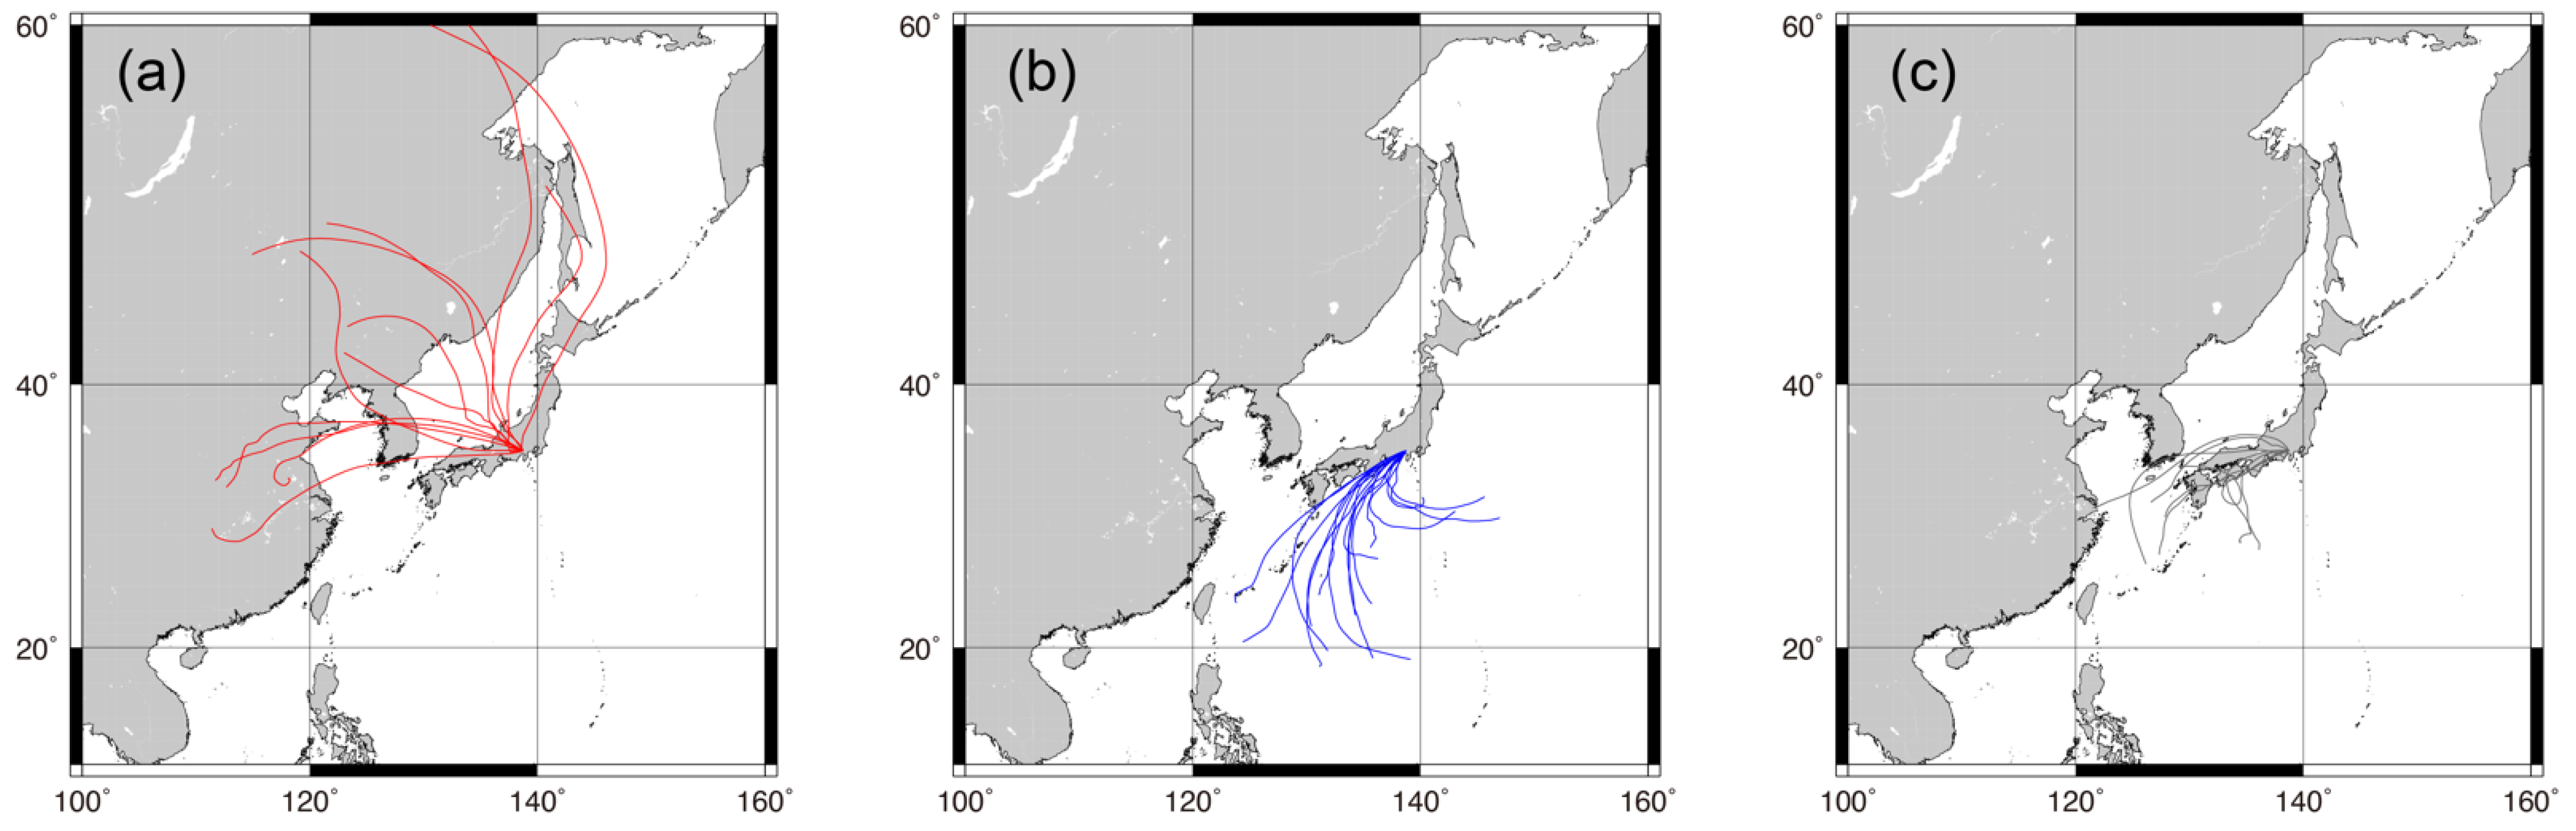
2.3. Classification of Air Mass Transport Pathways

Backward air mass trajectories for the past 72 h were calculated every hour using the hybrid single-particle Lagrangian integrated trajectory (HYSPLIT) model [30,31]. The trajectories were classified based on their vertical and horizontal transport pathways. Vertical pathways that transported constantly above 2000 m altitude were classified as free troposphere (FT). For all others, the trajectories were classified as originating from the planetary boundary layer. For the horizontal pathways, the trajectories were classified into four categories: Continental, Pacific, and Others, according to where each trajectory started (Figure 2). The trajectories that started from the Asian continent and Pacific Ocean were classified as Continental and Pacific, respectively. The trajectories classified as Others included those originating from the marginal seas (East China Sea, Sea of Japan and Okhotsk Sea) or those positioned over the Japanese mainland for more than 48 h.

3. Results and Discussion
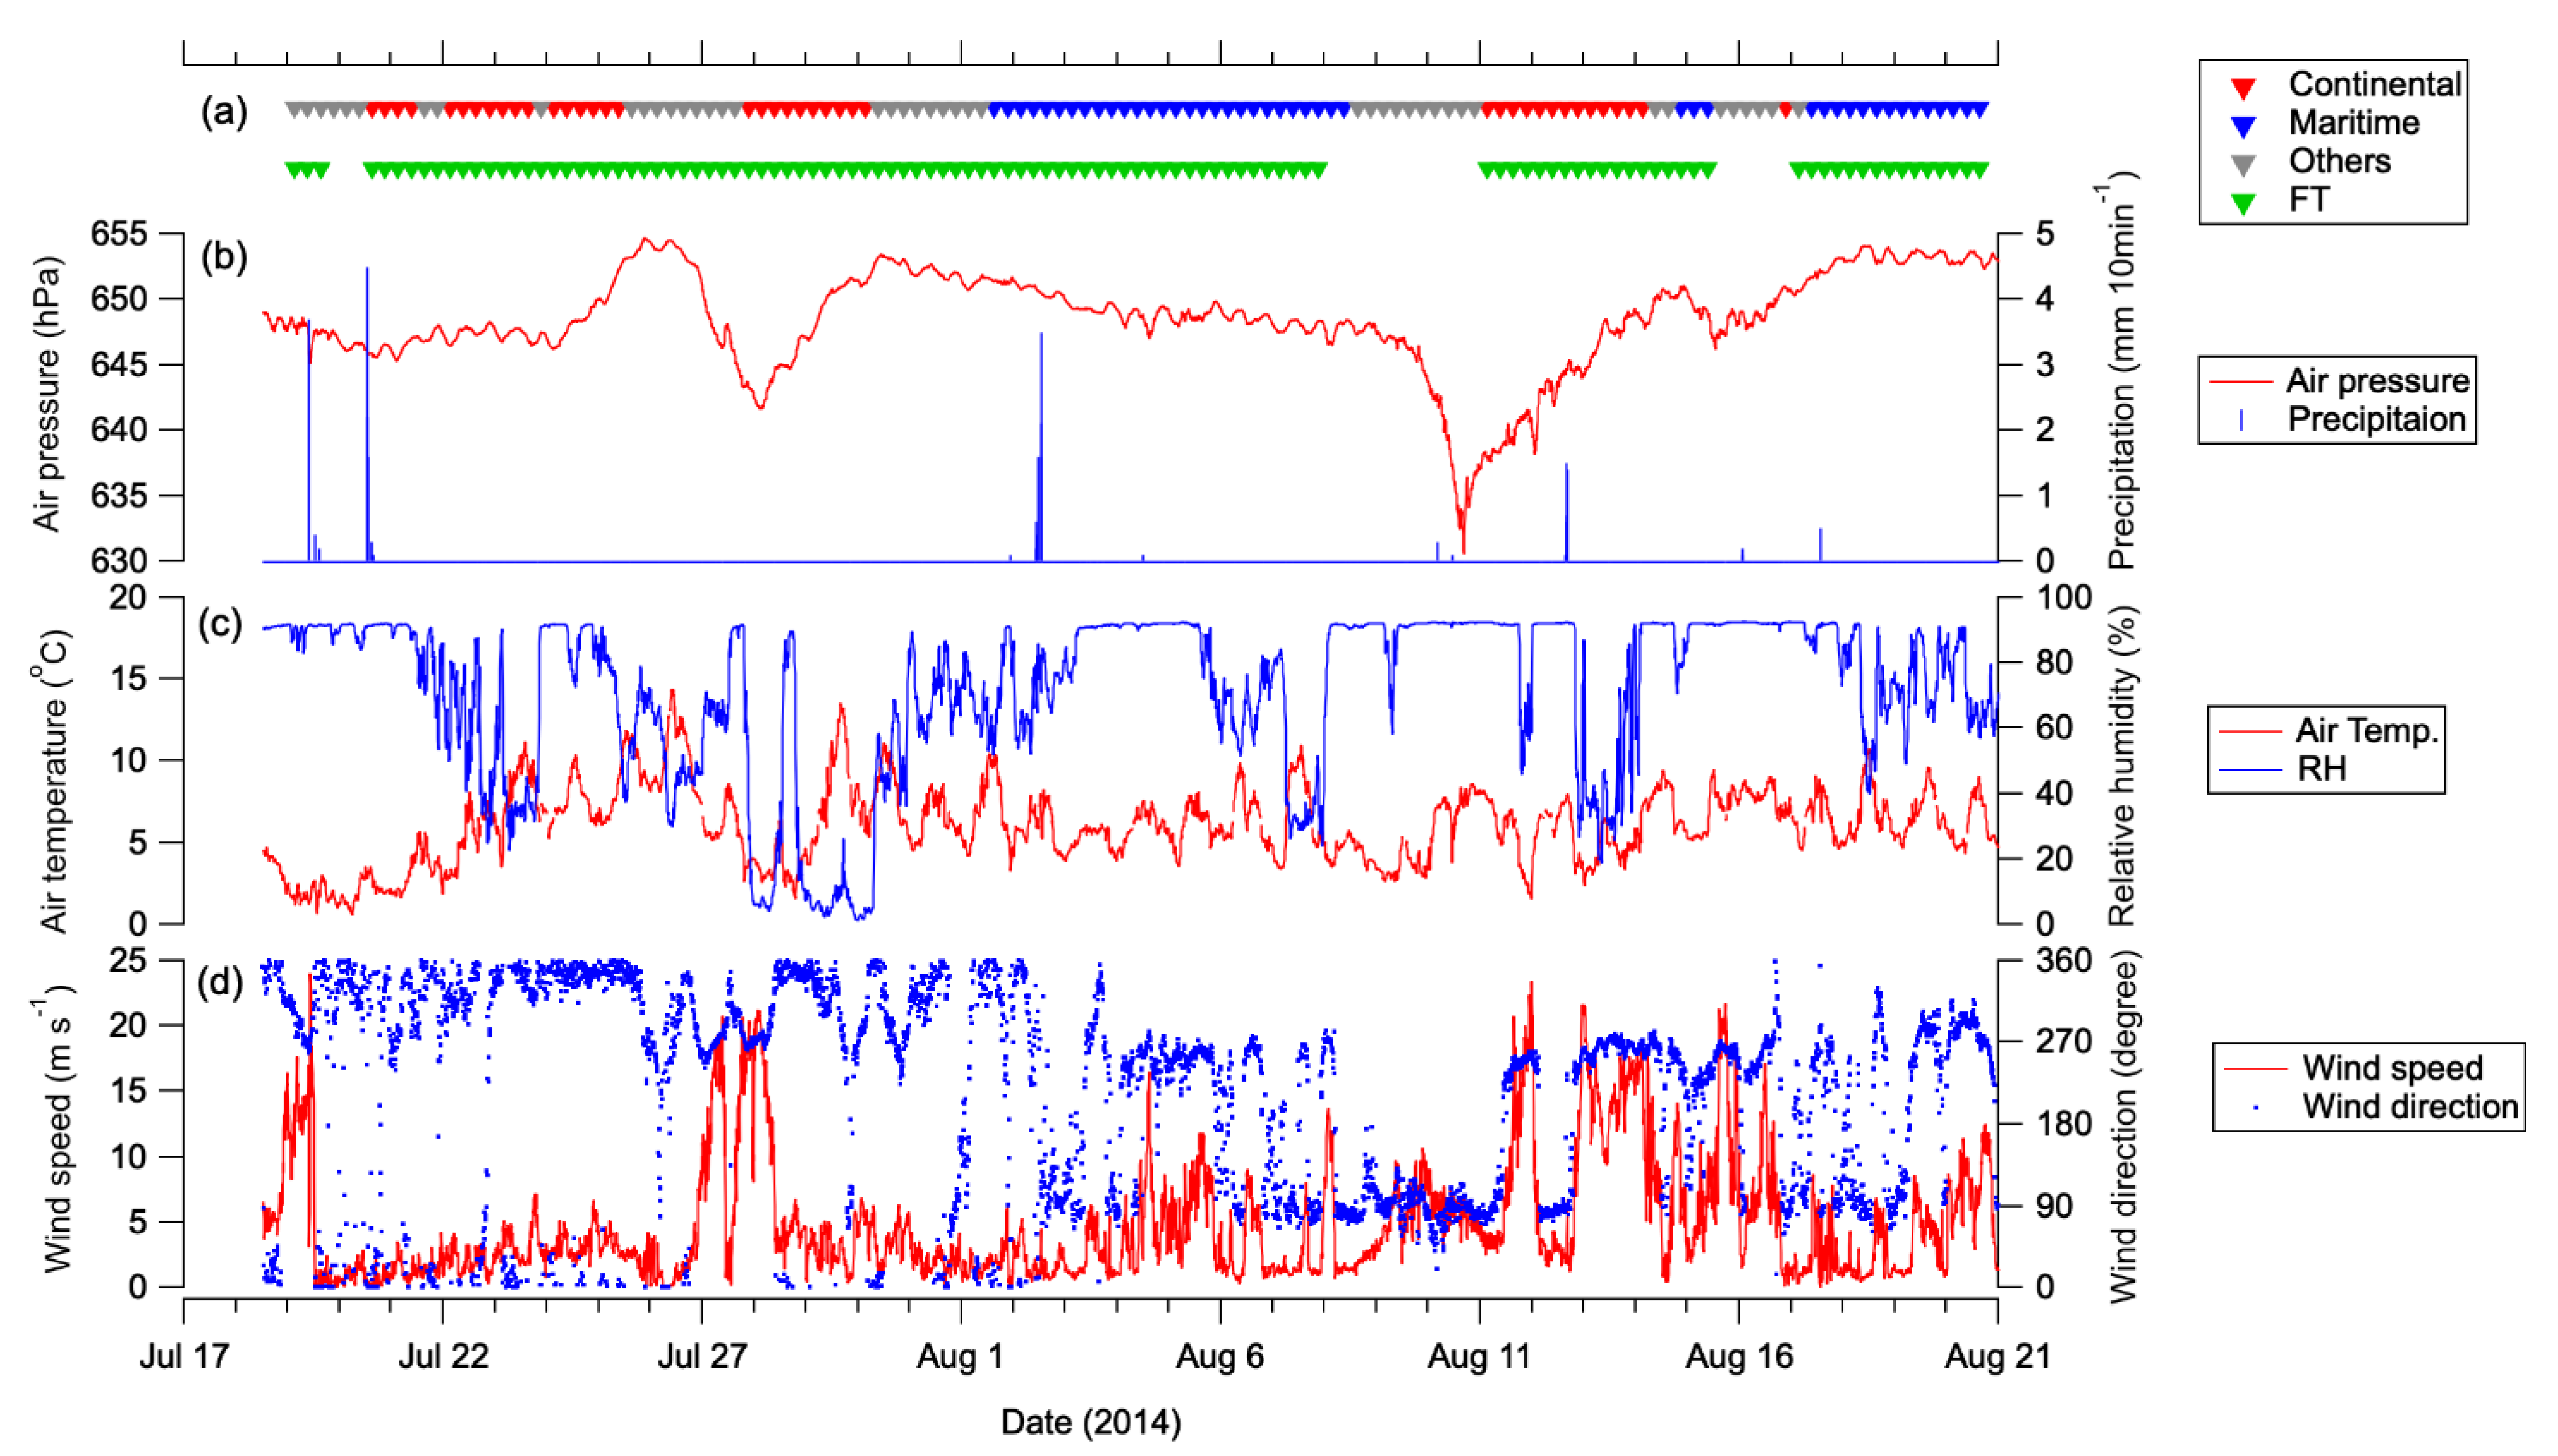
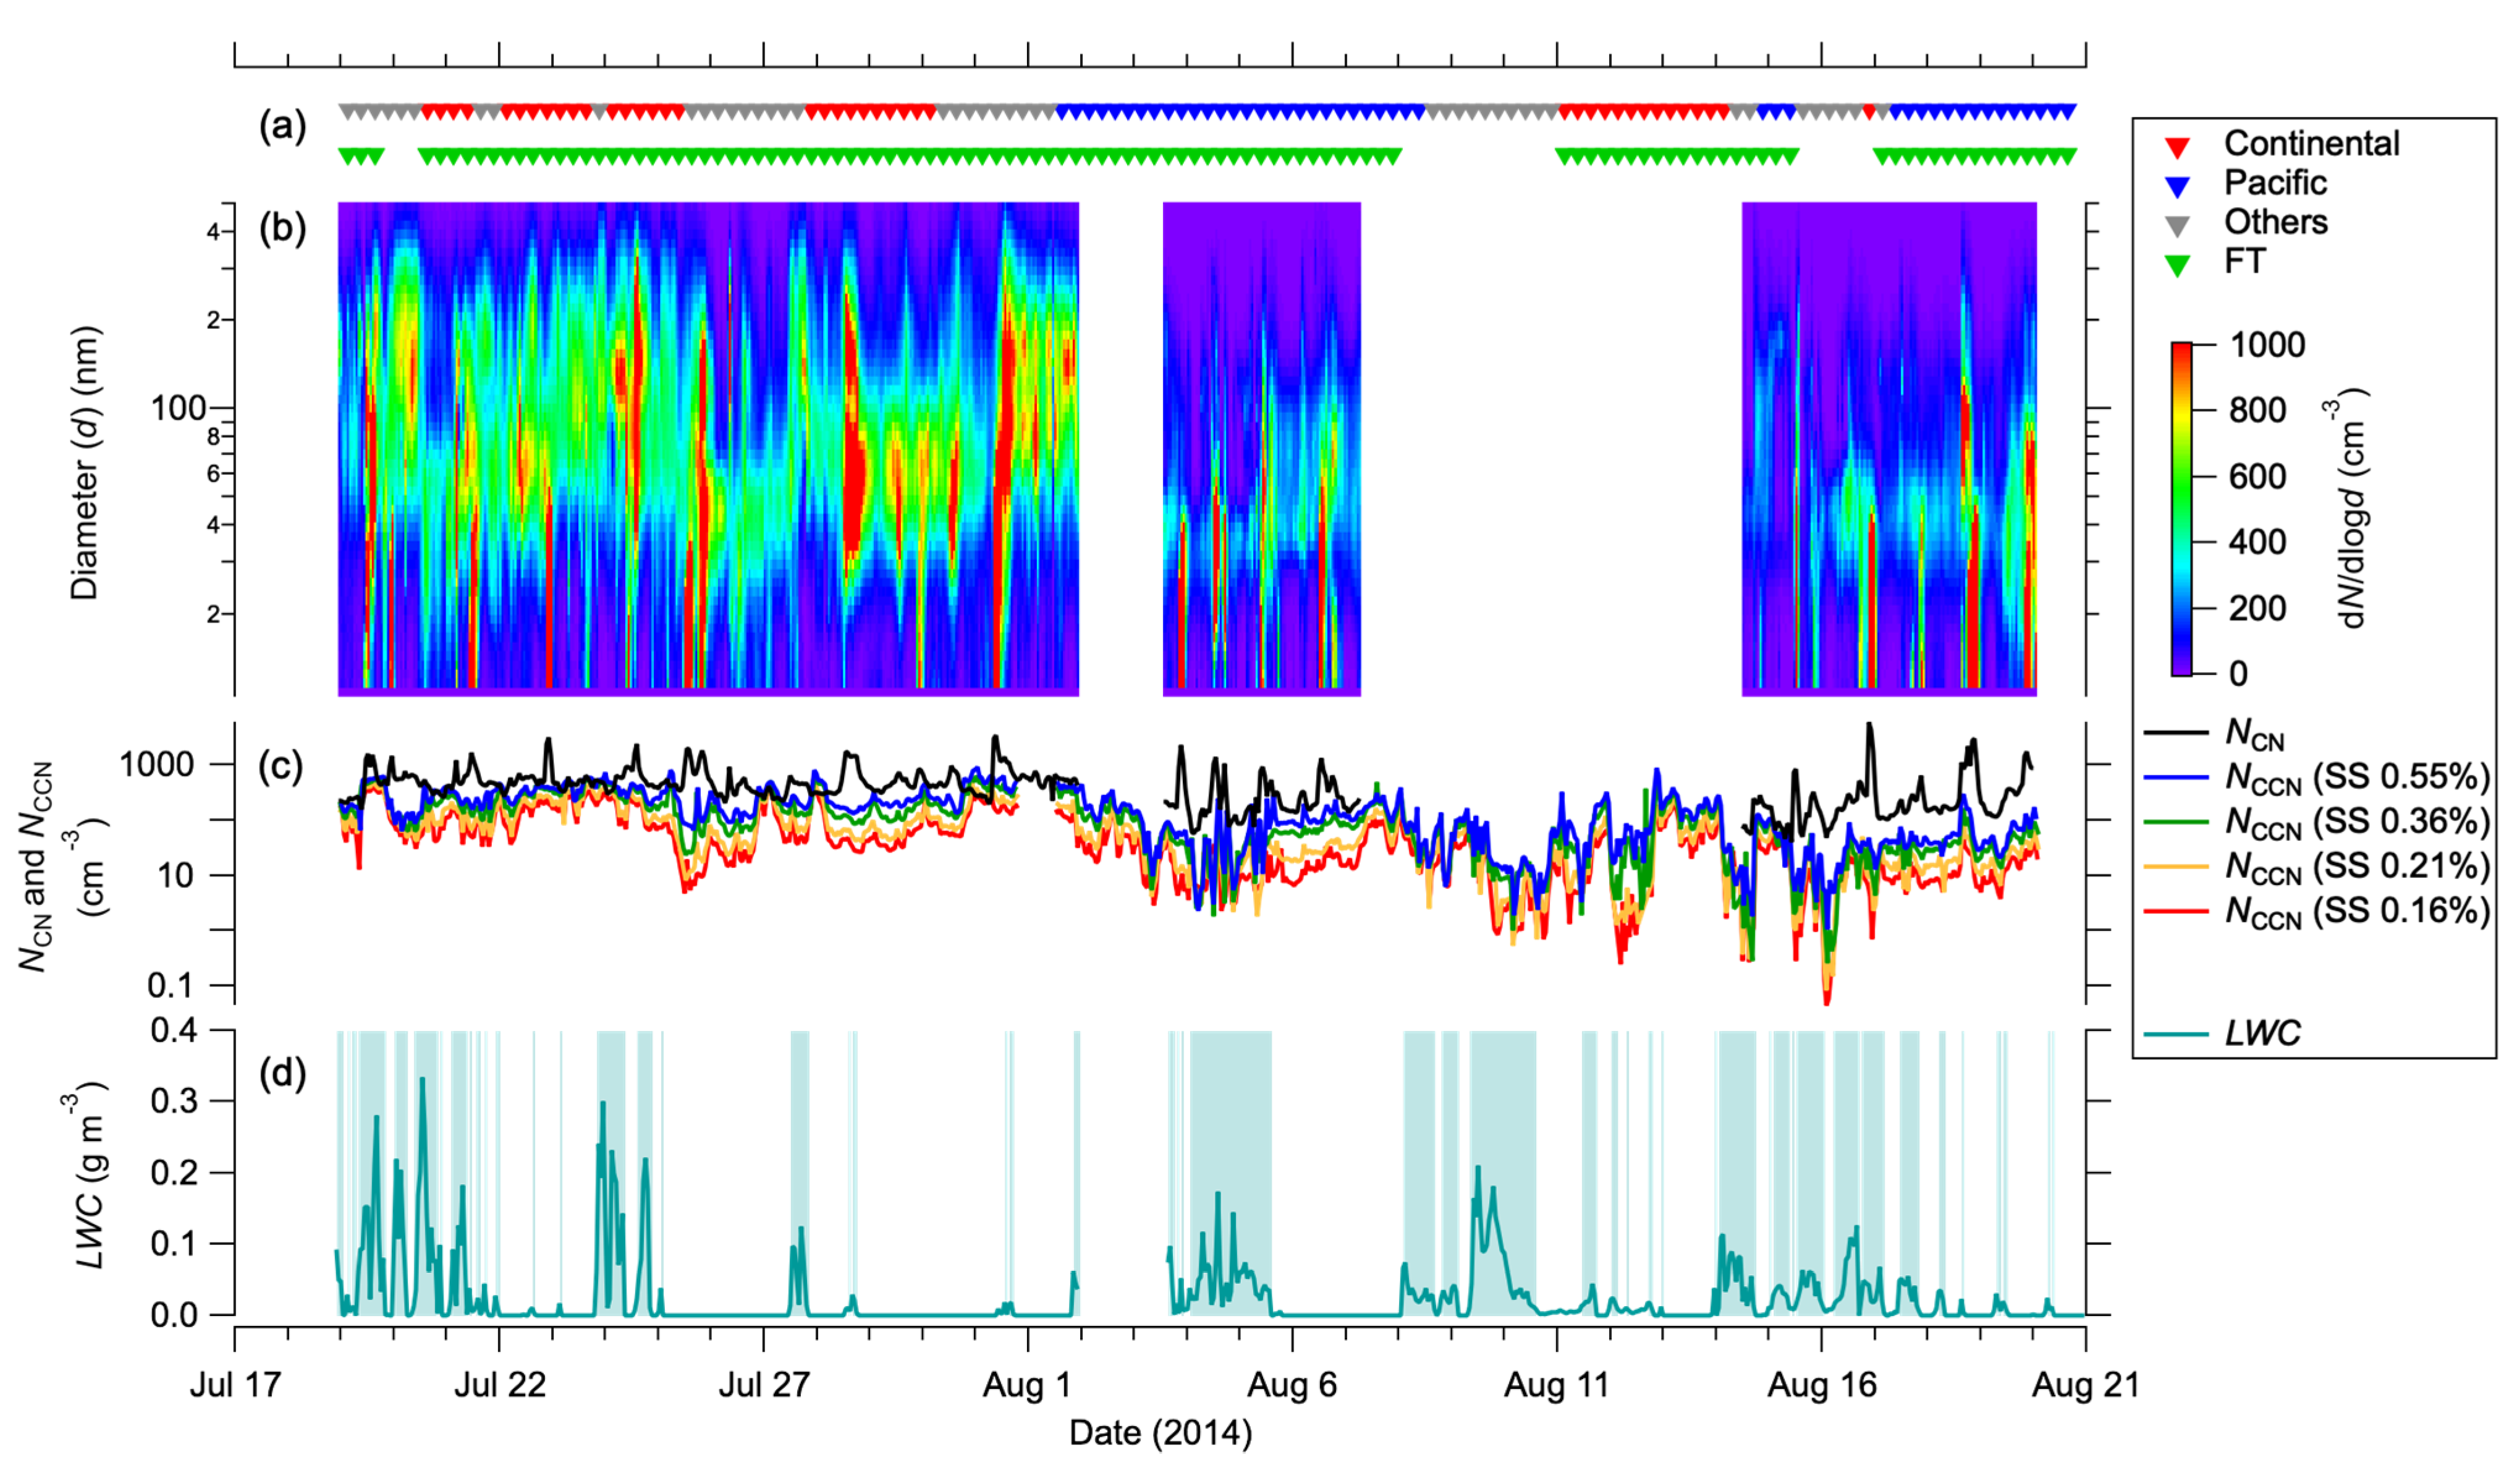
3.1. Overview

Figure 3 shows temporal variations in (a) air mass origins, (b) air pressure, precipitation, (c) air temperature, ambient RH (d) wind speed and wind direction throughout the observation period. About 84% of the backward trajectories were classified as FT (Figure 3a), indicating that the MFRS was in the free troposphere for most of the observation period. Thus, it is possible to see the effect of long-range transport of aerosols of different air mass origins on CCN characteristics. The trajectories classified as Continental are frequently observed in the early part of the observation period (20 to 29 July), whereas, those classified as Pacific are observed from about halfway through the observation period onwards (2 to 20 August) (Figure 3a). The mean air pressure during the observation period was 648.7 hPa. The drops of air pressure were observed on 27 July and 9 to 10 August, respectively, due to the passing of a cold front and the effect of the typhoon Halong (Figure 3b). The mean air temperature was 5.9 °C, with a range from 0.4 to 14.4 °C (Figure 3c). At the summit, northerly winds were dominant in July. In August, westerly winds prevailed except around 8 to 11 August, when easterly winds were observed along with the typhoon Halong passing through Japan islands (Figure 3d).
Figure 4 shows temporal variations in (a) air mass origins, (b) number size distributions of aerosol particles with 10 to 500 nm in diameter, (c) NCN and NCCN at each SS condition, and (d) LWC. Cloud-shrouded periods were defined as periods when the LWC is greater than 0.01 g m−3. As a result, 40% of the observation period was classified as cloud-shrouded (Figure 4d). In the following analysis, the data collected when (1) the backward trajectories were classified as FT, and (2) when the SMPS was in operation, were used.

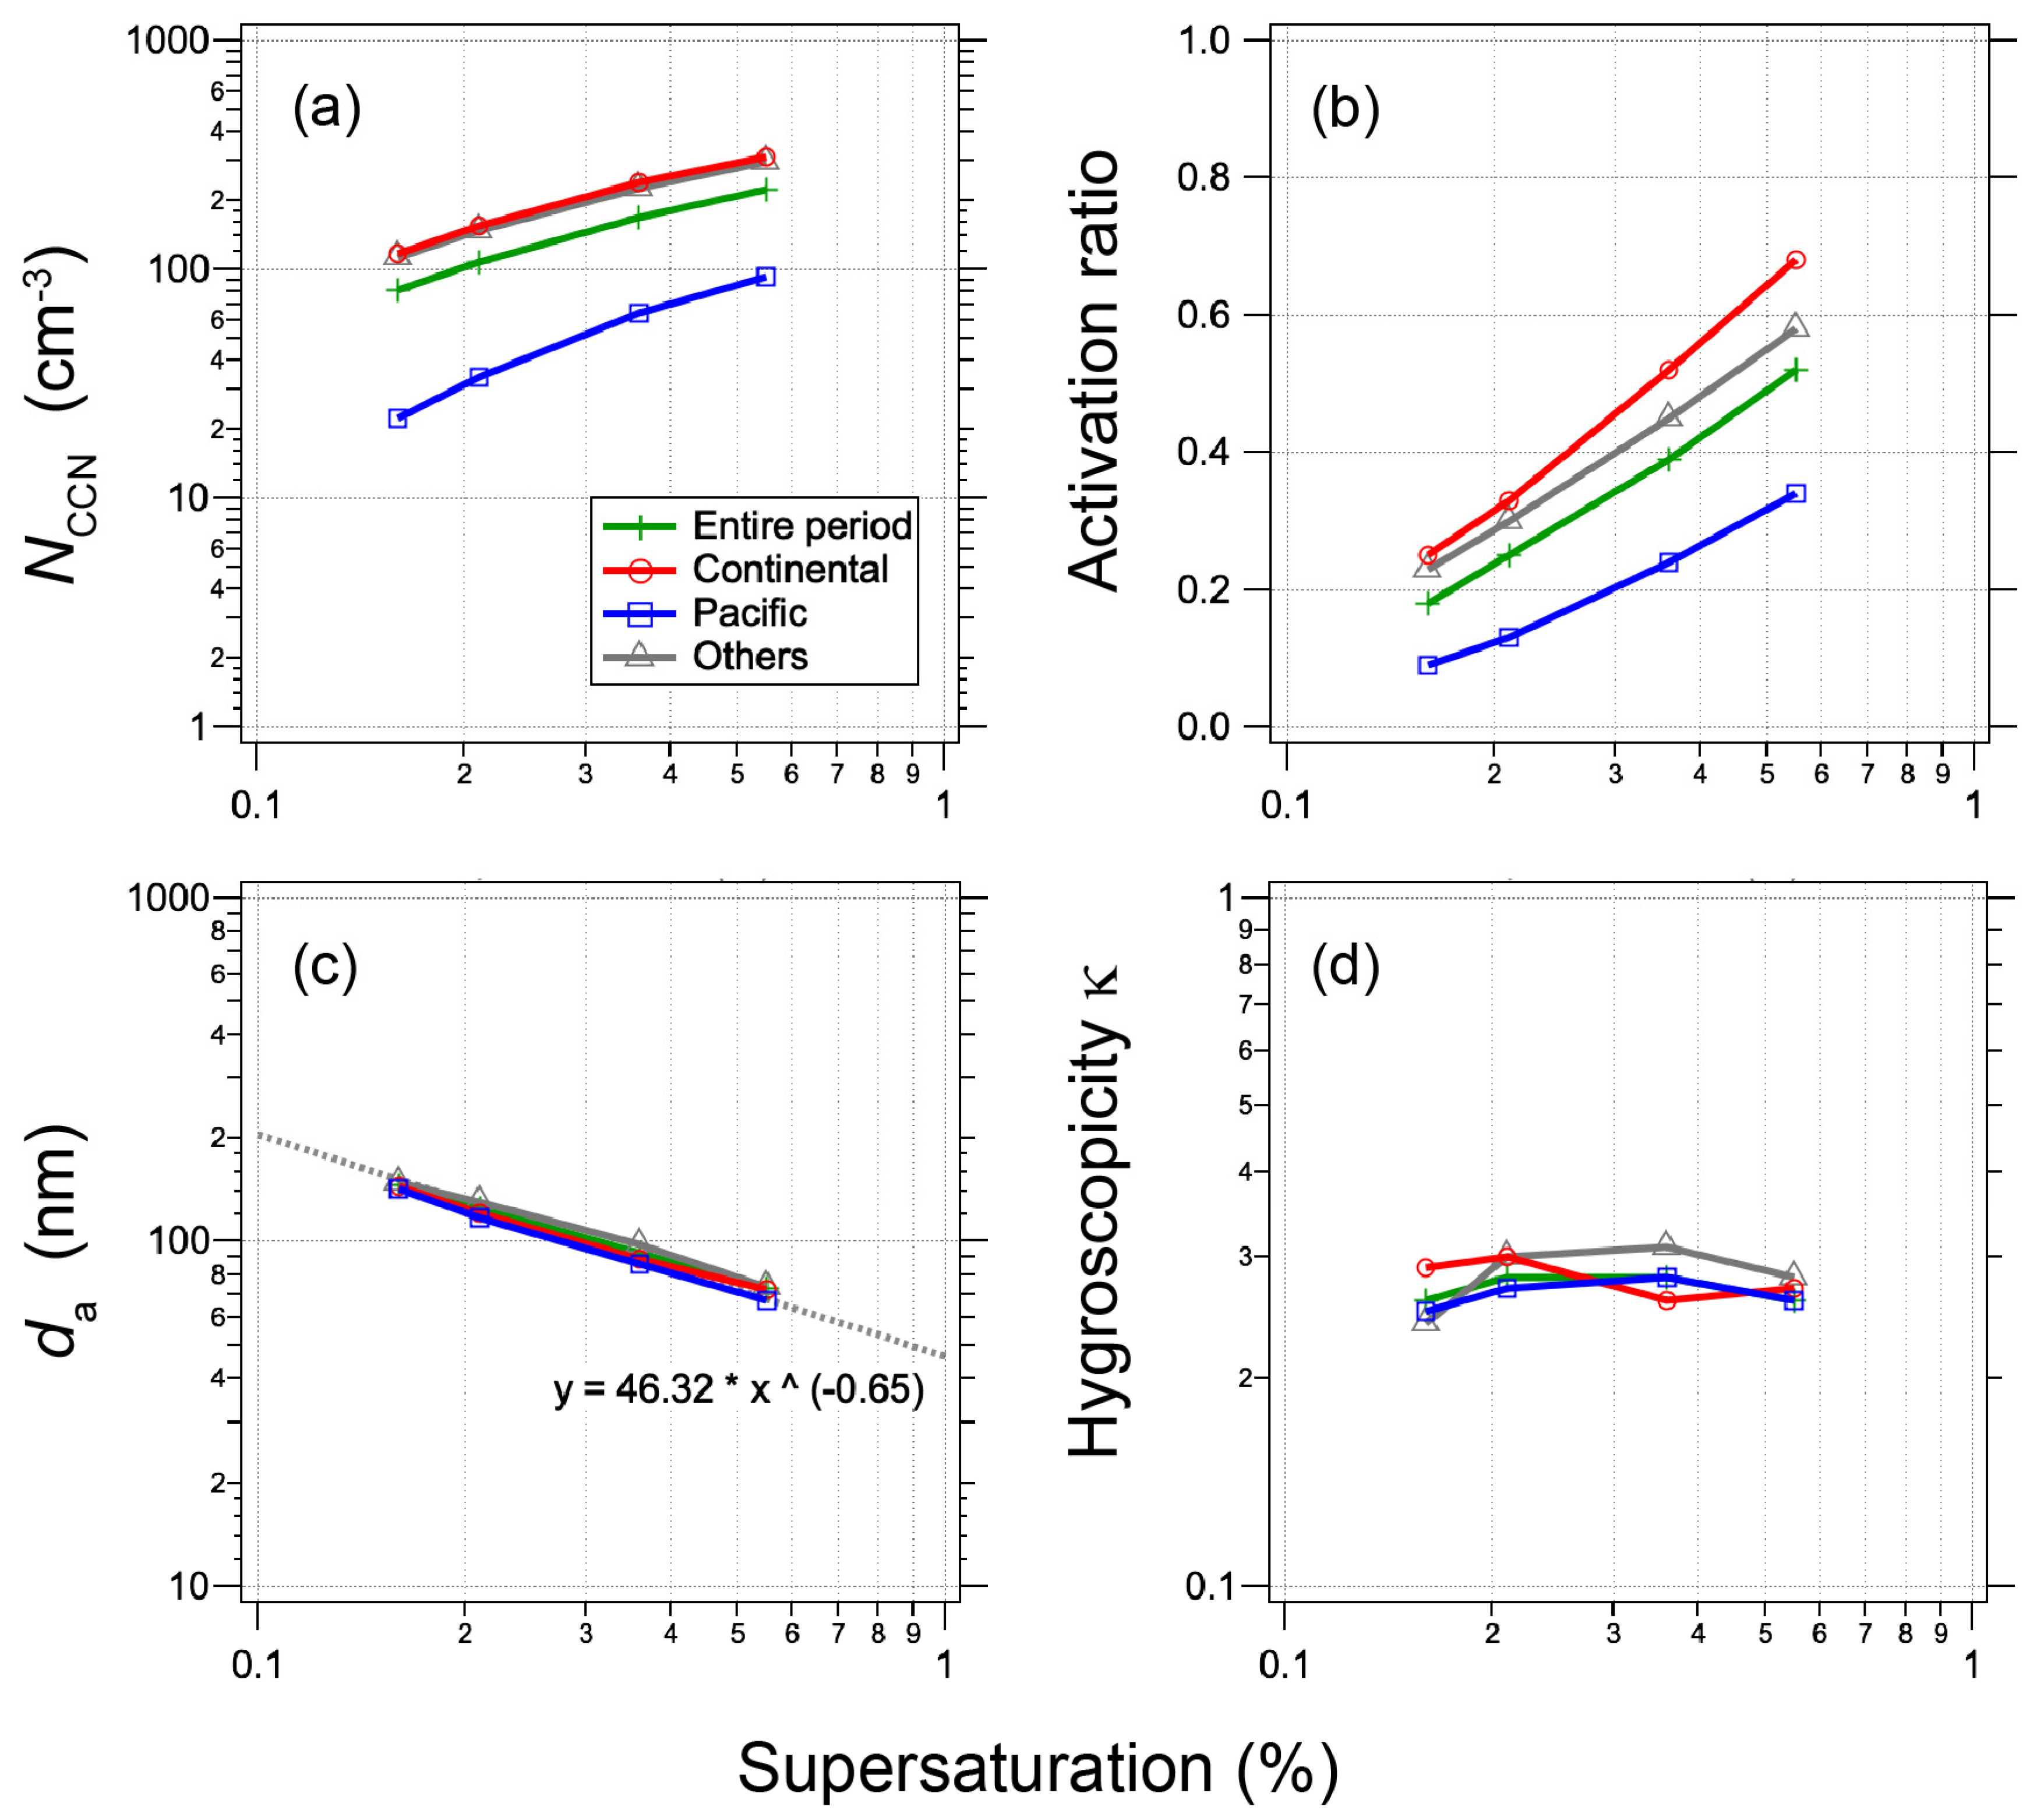
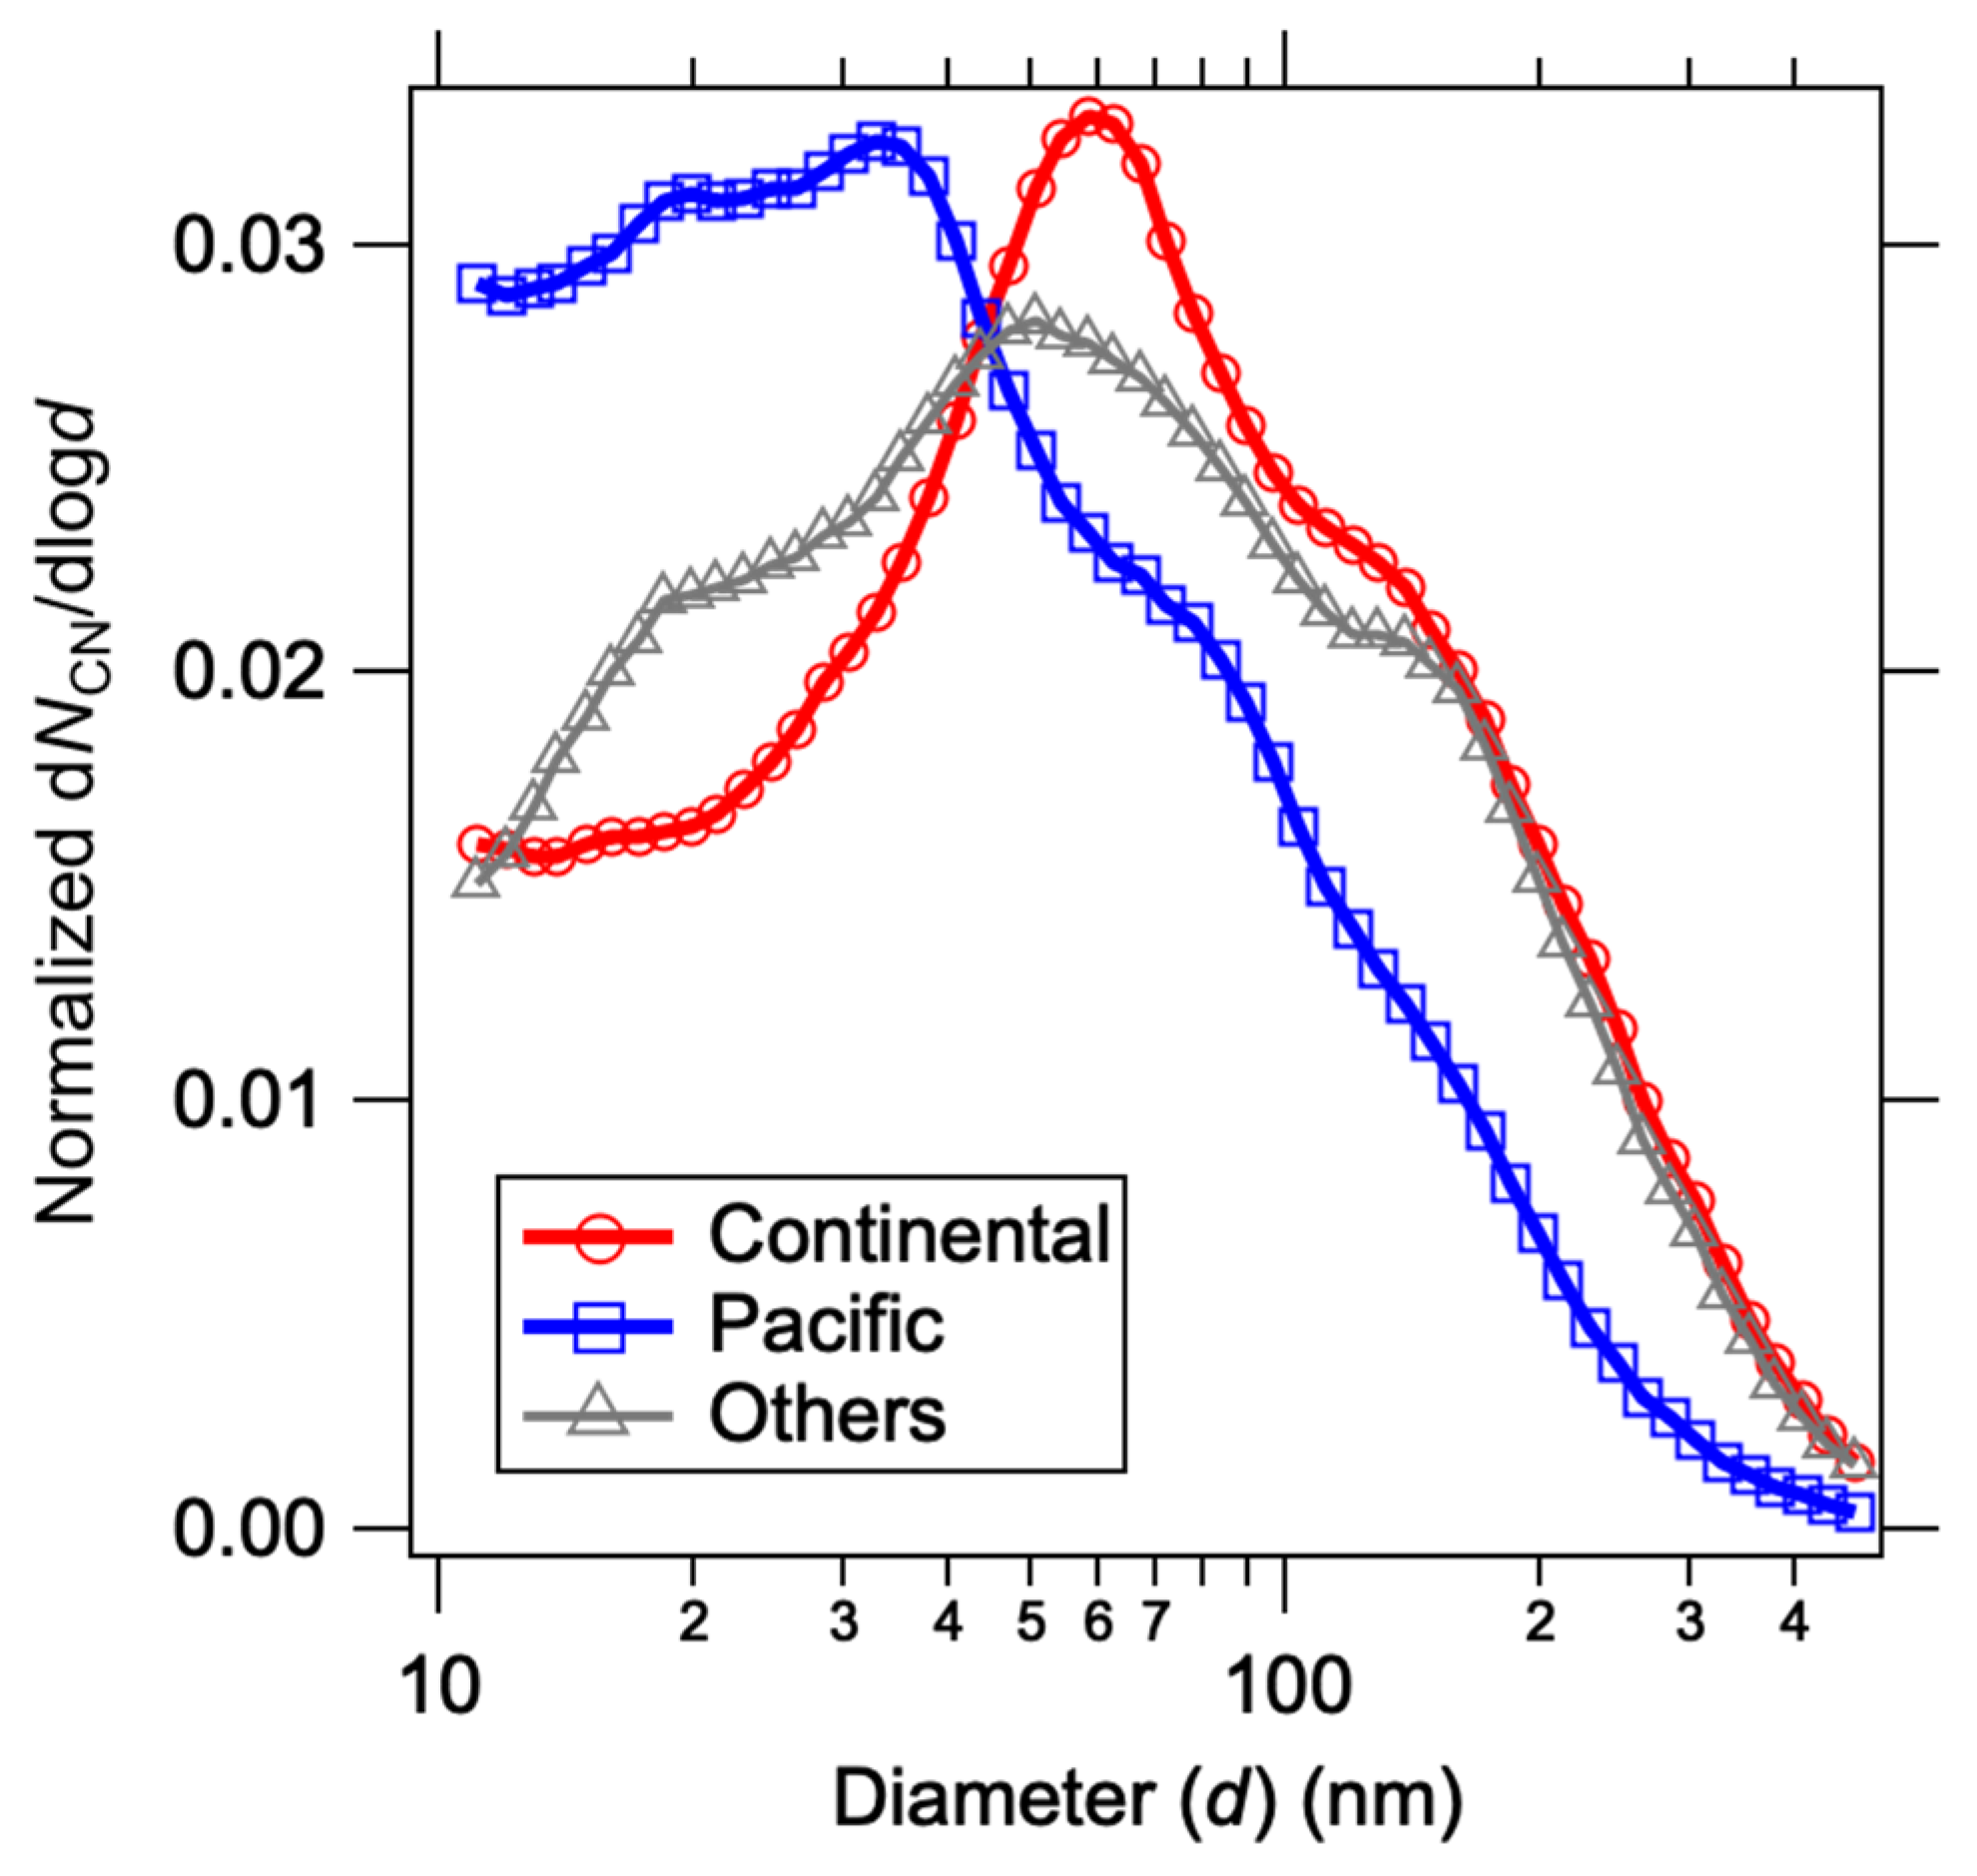
3.2. CCN Properties and Their Relationship to Air Mass Origins

The mean value of NCN for the entire observation period was 527.7 cm–3. By air mass origin, the mean values of NCN of the Continental, Pacific and Others periods were 617.9, 391.5 and 524.5 cm–3, respectively. The 25th percentile, median, mean and 75th percentile values of NCN and NCCN are summarized in Table 1 and Table 2, respectively. The mean values of NCN, NCCN and the activation ratio (NCCN/NCN) at each SS condition showed clear differences between the periods classified as Continental and Pacific; those values were significantly higher for the Continental air masses than for the air masses from the Pacific (Figure 5a,b). The same trend was observed in a previous study at the MFRS [32]. The mean values of κ were calculated by Equation (6), to be 0.25 to 0.28 at each SS condition over the analysis period. These values were similar to values observed at other mountain sites, Jungfraujoch (0.13 to 0.29 at SSs 0.12% to 1.18%; [16]) and Storm Peak Laboratory (0.2 ± 0.15 at SSs 0.07% to 0.72%; [20]). The recent study summarized aerosol chemistry at alpine sites and aircraft measurements and reported that the main components of submicron non-refractory aerosol in high-altitude sites are sulfate, ammonium and organics [33]. Additionally, it was reported that ammonium and sulfate are the main inorganic ion species in the aerosol collected at the summit of Fuji [34]. The κ values observed at MFRS during summer can be explained by the mixtures of inorganics (κ = 0.61 to 1.28; [27]) and organics (κ = 0 to 0.2; [35]). Black carbon (κ    0) may affect the aerosol composition at MFRS especially when the airmass comes from the planetary boundary layer [36] although it could not be a major component. For the different air mass origins, the mean values of κ are 0.26 to 0.30 (Continental), 0.19 to 0.28 (Pacific) and 0.24 to 0.30 (Others) (Figure 5d). In the free troposphere, aerosol particles have a longer lifetime because they are less susceptible to deposition. Therefore, particles in the free troposphere are more aged and well-mixed than those in the planetary boundary layer (e.g., [33]). This could cause the relatively uniform chemical composition made up of mainly sulfate and aged (oxidized) organics regardless of airmass origins. Because smaller particles require larger SS to activate, each κ value at a certain SS reflects the chemical composition of the particles around da. The κ values are relatively uniform regardless of the particle size (Figure 5c,d), indicating that no size dependency of the chemical composition of the aerosol at the MFRS during summer exists. This result differs from other CCN studies at non-alpine sites (e.g., [37,38,39]), in which smaller particles were shown to be less hygroscopic, suggesting that the aerosol in the free troposphere is well-mixed compared to the aerosol sampled closer to the sources.
The κ values are similar between air mass origins, while the particle size distribution is strongly dependent on the particle source (Figure 6). The mode diameter of the aerosol particles of Continental origin (58 nm) is significantly larger than that of Pacific origin (24 nm). It is thought that aging processes, such as condensation, coagulation and cloud processing, change number size distributions (e.g., [40]). The aerosols of Continental origin are more likely to be affected by these aging processes because an abundant supply of gaseous and particulate substances from these sources is likely. The larger the size of the aerosol, the easier it is to become activated CCN. From the above results, it can be concluded that the particle size distribution is the most important factor determining NCCN in the free tropospheric airmass at the MFRS during summer.

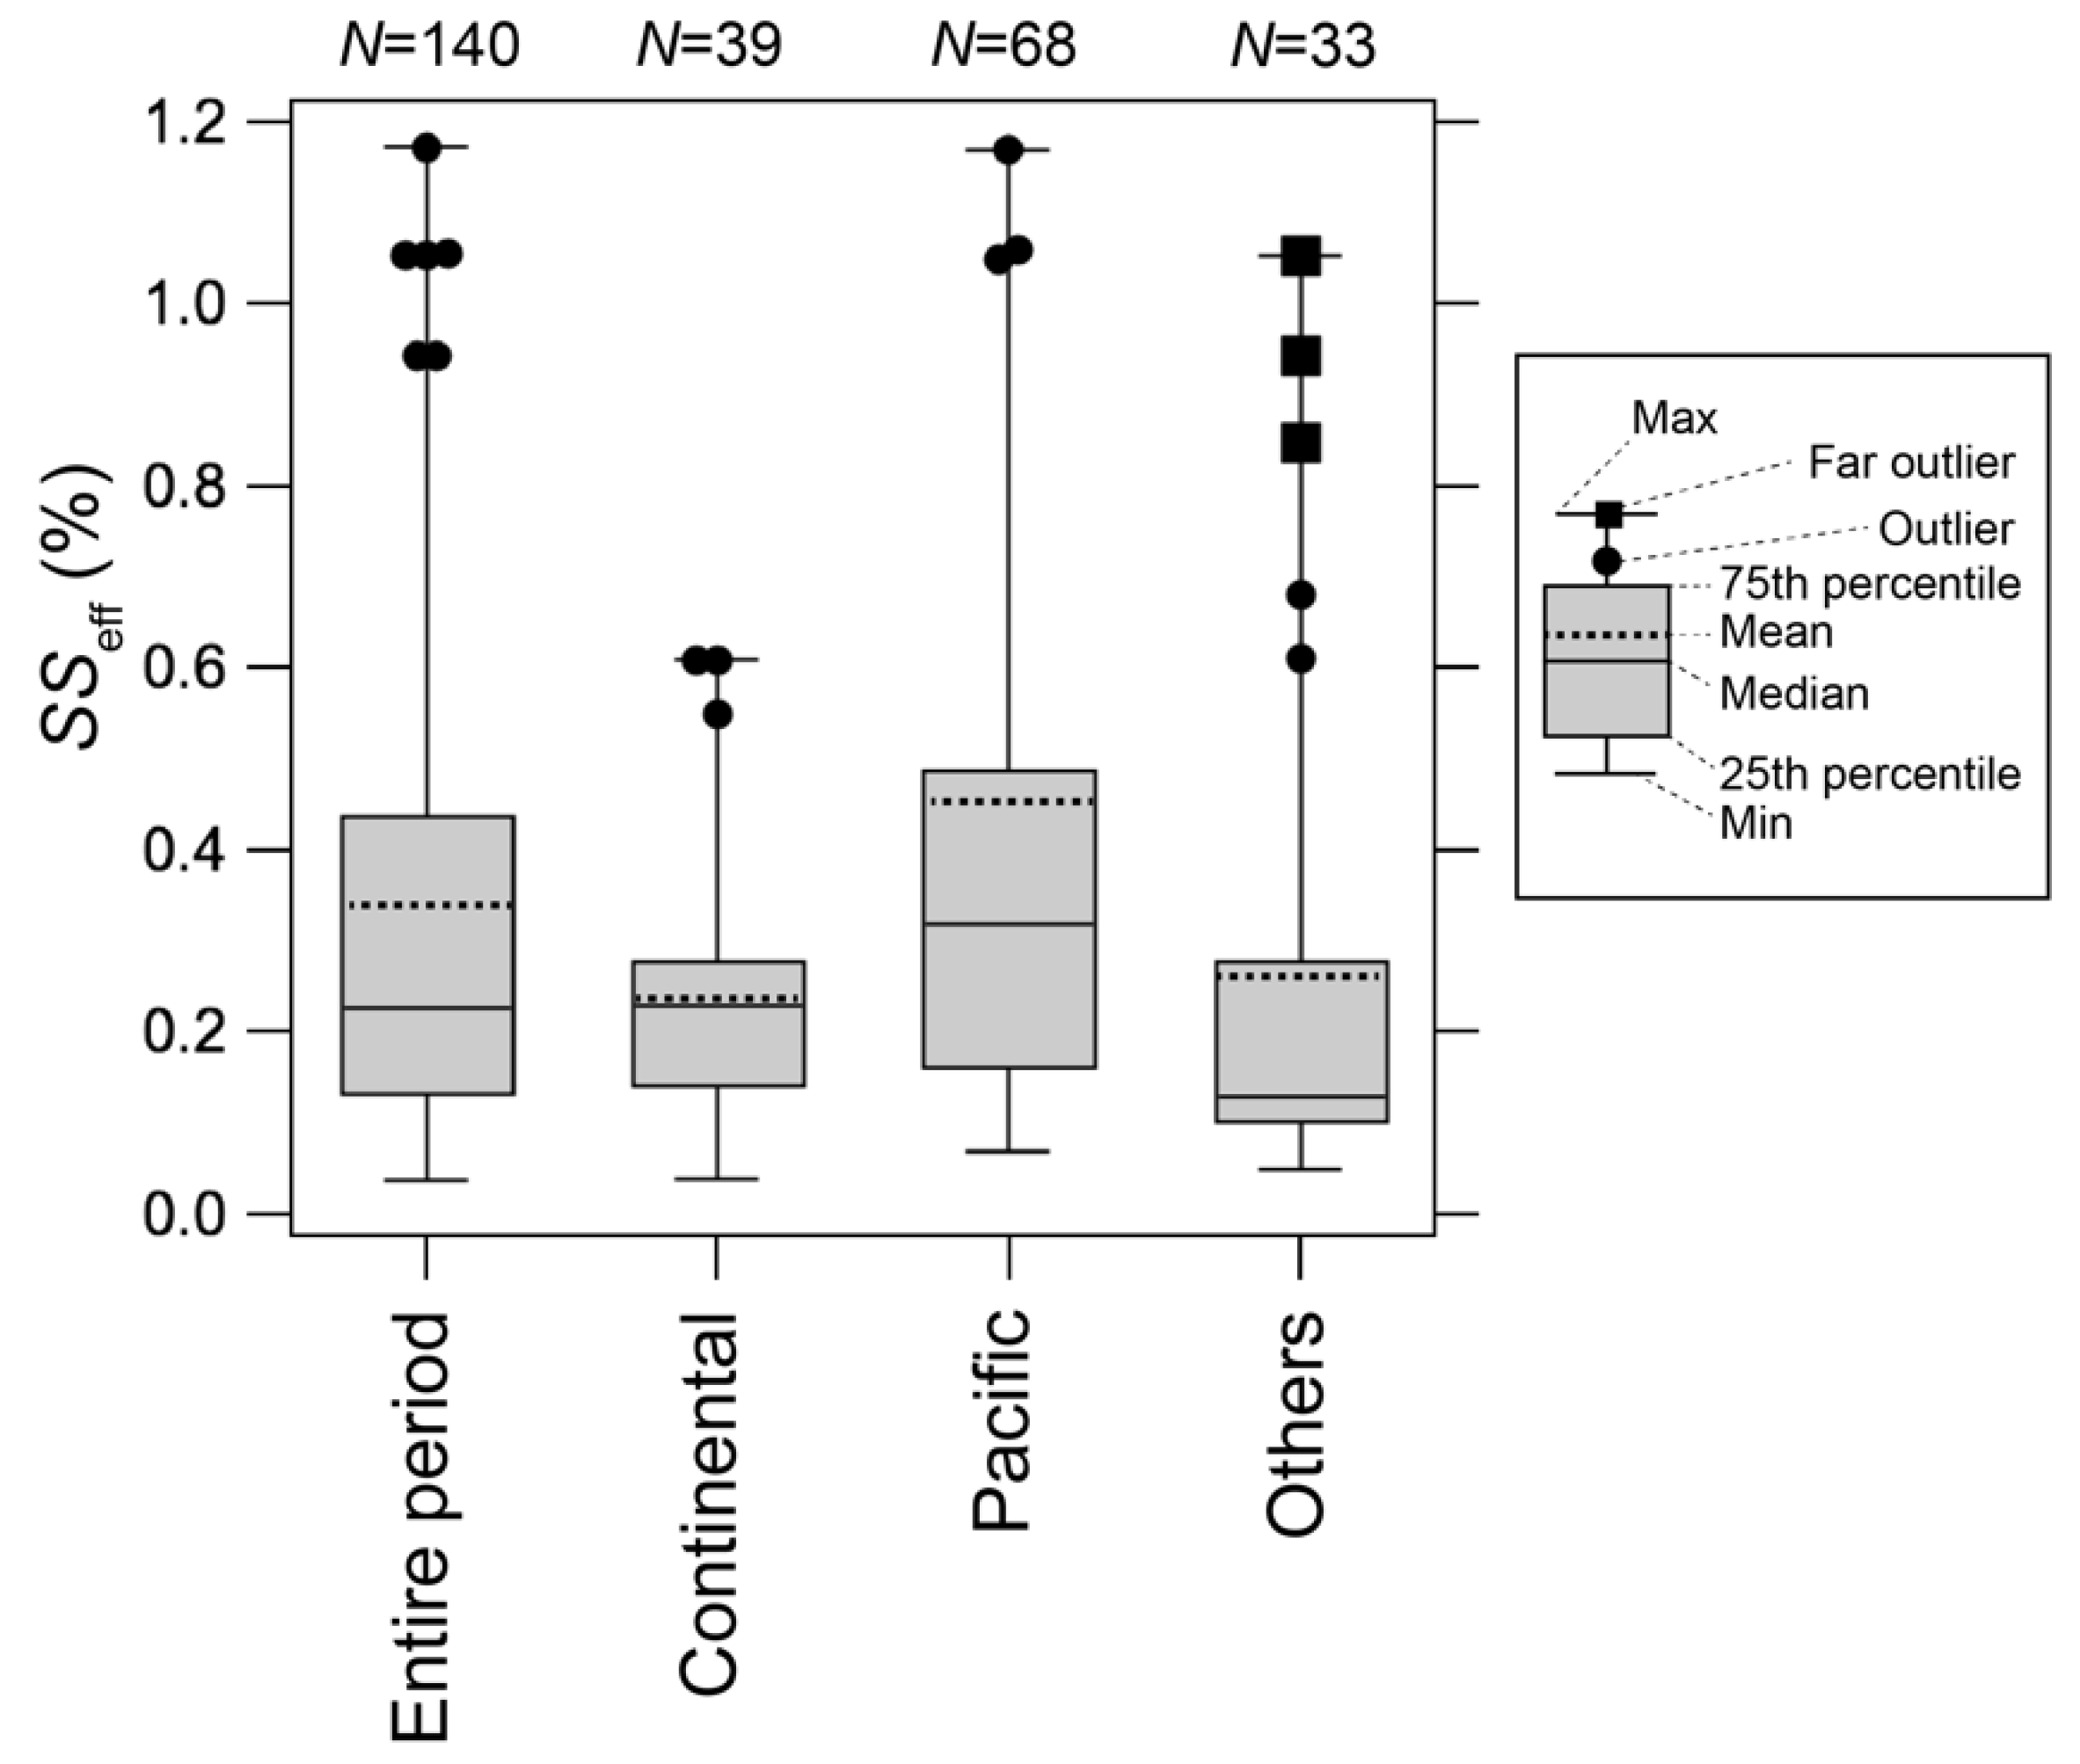
3.3. Evaluation of SSeff and Cloud Droplet Properties

The cloud droplet concentration (NCD) during the cloud-shrouded periods ranged from 1.6 to 389.1 cm−3 (mean: 78.3 cm−3). By using Equation (7), the activation diameters (da, CD) under ambient SS conditions were calculated and they ranged from 31.6 to 379.6 nm. To estimate the SSeff of the clouds observed at the MFRS, we used the regression curve of the relationship between mean da and SS obtained by the CCN measurements (Figure 5c):
d a , CD = 46.32 × S S p 0.65 .
Based on these calculations, the SSeff during the cloud-shrouded periods is estimated to be 0.15% (25th percentile) to 0.44% (75th percentile) (Figure 7). Asmi et al. [9] estimated the in-cloud SS at the Puy-de-Dôme station (altitude 1465 m) to be 0.1% to 0.6%, and Hammer et al. [11] reported an SSeff of cumulus and shallow-layer clouds at Jungfraujoch (attitude 3580 m) of 0.37% to 0.5% and 0.17% to 0.3%, respectively. The values of SSeff calculated in this study were comparable to the values of SS of clouds at mountain sites in previous studies. When compared to air mass origins, no significant differences among the SSeff of Continental, Pacific and Others were apparent (Figure 7). A positive correlation (R = 0.54, p <0.01) between NCD and NCCN under the 0.21% SS condition, which is close to the median value of SSeff, is observed. The points are scattered around an 1:1 line and large scatter is observed when LWC is lower (Figure 8).
Parameters characterizing the clouds at the MFRS are summarized in Table 3. Note that these parameters were obtained only during the cloud-shrouded periods. It was reported that SS tends to be higher at higher updraft wind velocities (e.g., [8]), because adiabatic expansion is an important factor for the determination of SS in a cloud. In this study, the updraft wind velocity was not measured. Hammer et al. [11] proposed a method to calculate the updraft velocity by multiplying the horizontal wind speed by the tangent of the angle of the mountain slope:
w = v h × tan θ ,
where w , v h and θ are updraft velocity, horizontal velocity, and the angle of mountain slope, respectively. Equation (11) assumes that the airmass rises along the slope of the mountain, otherwise it is overestimated. Here, it was used as a standard of the maximum value of the updraft velocity. As for the angle of the mountain slope, 38° (the angle of west side) was used. Note that Mt. Fuji is a stratovolcano with conical shape, and the angle of the slope is almost same regardless of the direction. The mean updraft velocity was slightly higher when the airmass origin was Pacific than when it was Continental. On the whole, however, the difference of updraft velocities by the airmass origin was not remarkable. The topography of the summit of Mt. Fuji is complicated due to the existence of a crater. This will disturb the air stream, so the actual updraft velocity was likely to be different from the estimate. In the future, it will be necessary to monitor the updraft velocity on site by installing multiple ultrasonic anemometers to understand the factor controlling SS.
The values of LWC range from 0.01 to 0.26 g m−3, and were similar to those of stratocumulus, stratus and fog (0.05–0.3 g m−3; [41]) (Table 3) There was a clear difference in NCD between air masses of Continental and Pacific origin as observed in NCCN (Figure 5a). The mean NCD in Continental airmass (144 cm−3) was similar to the annual mean value in East Asia region estimated by the satellite observation (136.9 cm−3) [42], however, the mean NCD during the entire period (78 cm−3) was less than the annual mean value. This could be caused by the seasonality of prevailing winds in East Asia: winds come from the Pacific under the Pacific high-pressure system during summer, but in other seasons, winds come mostly from the Asia continent. It is considered that the period (summer) in which we conducted our observations was the season with the lowest NCD of the year in the region. The normalized size distributions of NCD were illustrated in Figure 9. The shapes of size distributions resembled each other, but the CDs larger than 20 μm were more in the Pacific airmass. The calculated Reff were 6.5 and 9.3 μm, respectively, in the Continental and Pacific airmasses. If the water content is constant in the atmosphere, Reff of cloud particles decreases as NCD increases. This results in a change of the optical properties of the cloud and is known as the Twomey effect [43]. In this study, LWC of Continental airmasses is larger than that of Pacific airmass. This could be due to the higher NCD of Continental air masses, because LWC was a function of both number and size. Although the values of LWC differed, the inversely proportional relationship between NCD and Reff was still observed between Continental and Pacific airmasses.

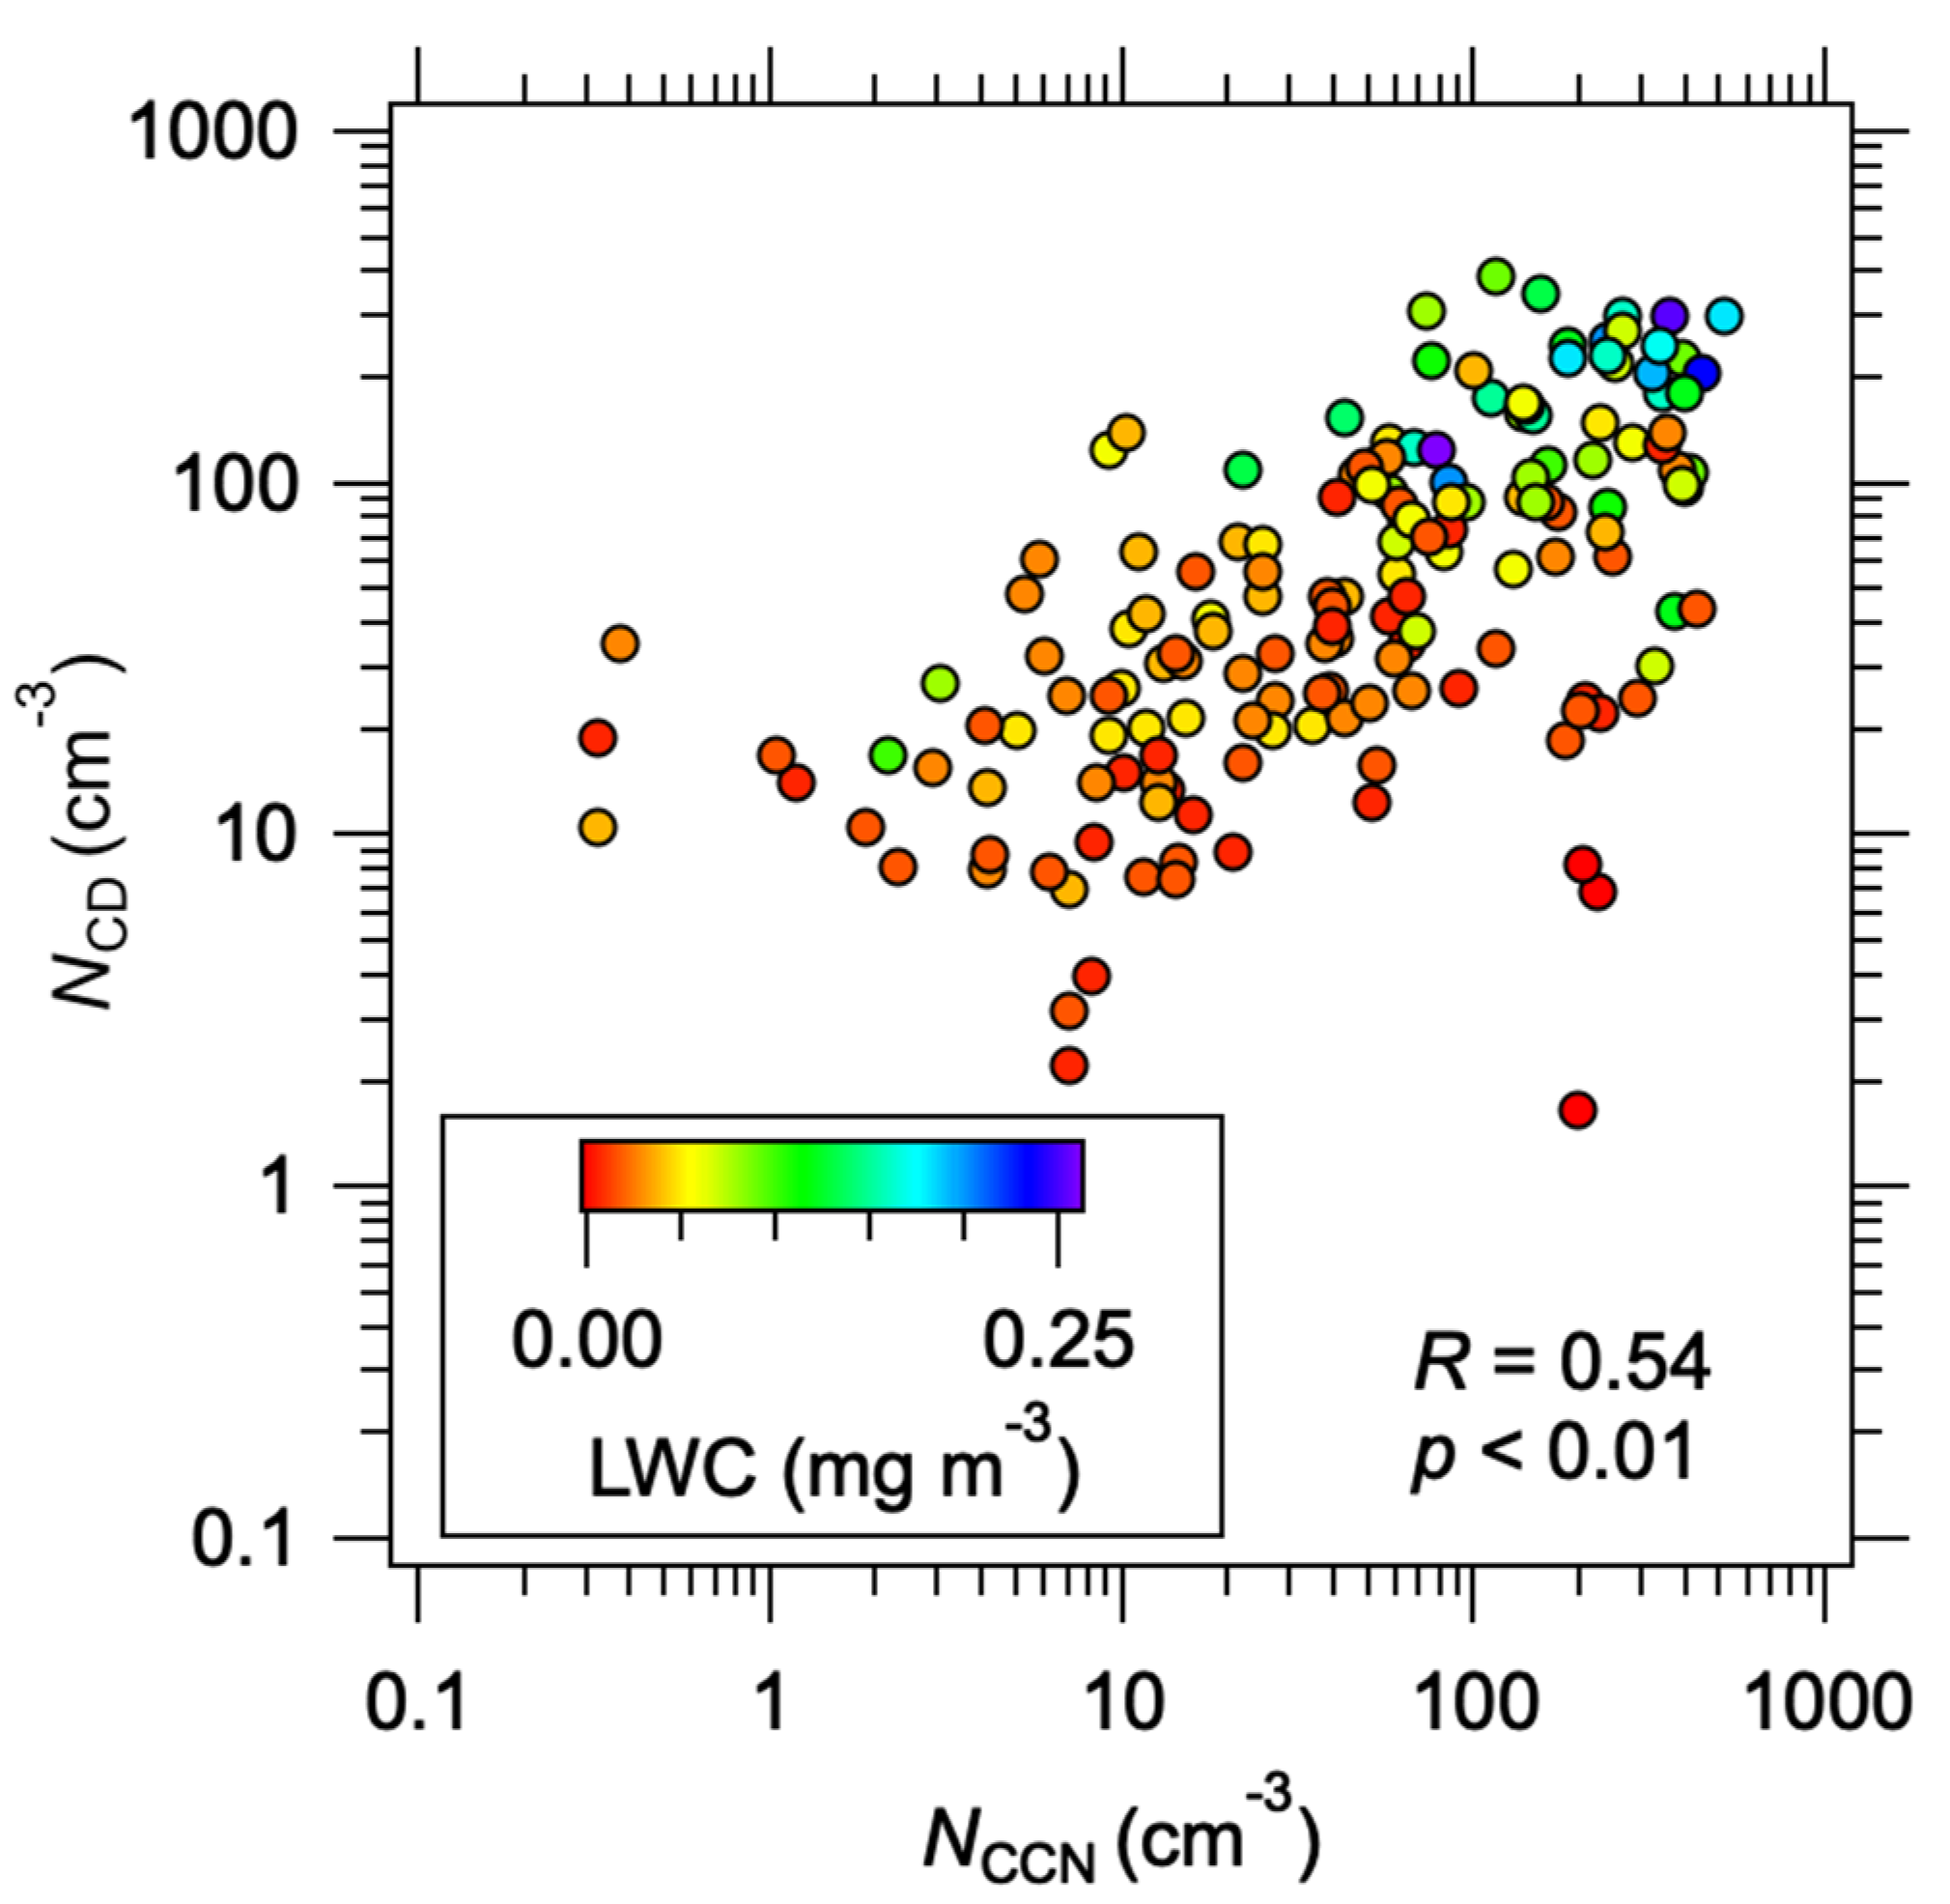
3.4. Factors Controlling the Cloud Droplet Concentration

To investigate factors controlling the NCD, NCD, cal was calculated by using the aerosol number size distribution, the hygroscopicity parameter (κ), and the SSeff. Where κ and the ambient SS were known, the activation diameter (da, cal) can be calculated based on the Köhler theory (Equations (2) or (4)). Then, the NCD can be calculated by inputting the calculated da, cal values and the size distribution into Equation (1). Here, each NCD, cal was calculated for the following three patterns: (1) mean size distribution shape, (2) mean SSeff, and (3) mean hygroscopicity parameter κ (at 0.21% SS of the CCN measurements) for the cloud-shrouded periods. Then the calculated value was compared to the measured value (NCD). As a result, relative errors were 278.7%, 139.4% and 43.4%, respectively, when size distributions, SSeff and κ were fixed to their mean values. Therefore, the NCD, cal can be estimated with ±50% error by using the mean value of κ during cloud-shrouded periods (Figure 10c). However, the NCD, cal cannot be reproduced well if the mean number size distribution or the mean SSeff are used in the calculations (Figure 10a,b). These results indicate that the size distribution is the most important factor controlling the cloud droplet number concentration at the MFRS, but that the concentration can be reproduced reasonably well when using a representative aerosol chemical composition. In addition, the evaluation of the SSeff seems to be of greater importance than the chemistry for accurately predicting cloud droplet number concentrations at the MFRS during summer, where well-mixed, free tropospheric aerosol is observed.

4. Concluding Remarks

Atmospheric observations at a high mountain site located in the free troposphere, where the influence of long-range transport is significant, revealed clear differences in CCN and cloud droplet characteristics for different air mass origins. Both CCN and cloud droplet concentrations were significantly higher in continental air masses compared to those in air masses from the Pacific Ocean. The effective radius of the cloud droplets was also affected by the number concentration of cloud droplets, with smaller radii in the continental air masses. Based on the CCN characteristics and cloud droplet number concentration obtained by our observations, the water vapor supersaturation of the atmosphere was estimated to be equivalent to that estimated at other alpine sites. A calculation based on the Köhler theory to investigate the factors controlling the cloud droplet concentration showed that the most important factor is the aerosol particle size distribution, followed by the supersaturation and the chemical composition.
In evaluating the climatic impact of aerosol–cloud interactions, it is highly important to predict the cloud droplet number concentration which determines the optical properties of clouds. In this study, we clarified for the first time in East Asia that it is important to know the supersaturation degree of cloud rather than the chemical composition of aerosol particles for the prediction of cloud particle number concentration by the simultaneous observation of aerosol and cloud. This would be true in the case of well-mixed aerosols at locations remote from the sources like the free troposphere. Although it is difficult to directly measure the degree of cloud supersaturation, it will lead to a more precise prediction of cloud droplet number concentrations if the cloud supersaturations in various atmospheric environments are known by using the indirect method proposed in this study. For further understanding, it is also necessary to know factors controlling the degree of supersaturation simultaneously. Updraft velocity is an important factor, but is difficult to reproduce with a meteorological model in field observation of alpine sites where air stream is complicated. When conducting similar observations in mountain sites, it is necessary to acquire observation data of updraft velocity by installing multiple ultrasonic anemometers or releasing radiosondes from the foot of the mountain periodically.

Author Contributions

Methodology, A.W., Y.I. and K.M.; observation, A.W., R.K., Y.I. and K.M.; formal analysis, A.W., R.K. and Y.I.; investigation, A.W., R.K. and Y.I.; resources, K.M. and M.U.; writing—original draft preparation, A.W. and Y.I.; writing—review and editing, K.M. and M.U.; visualization, Y.I.; supervision, K.M.; project administration, K.M.; funding acquisition, K.M. All authors have read and agreed to the published version of the manuscript.

Funding

This work was supported by the Certified Nonprofit Organization (NPO) Mount Fuji Research Station. This work was performed during the period for which the Certified NPO Mount Fuji Research Station had received a part of the Mt. Fuji Weather Station from the Japan Meteorological Agency and managed it. This work was partly supported by JSPS KAKENHI Grant-in-Aid for Scientific Research (C) (Grant No. 25340017).

Institutional Review Board Statement

Not applicable.

Informed Consent Statement

Not applicable.

Data Availability Statement

Data concerning aerosol size distribution, CCN and cloud droplets are retrieved from https://osf.io/68y2u/?view_only=03b0e1d2138c489c8fcbe36540e316d2. (Last accessed on 10 September 2021).

Acknowledgments

The authors gratefully acknowledge the NOAA Air Resources Laboratory (ARL) for the provision of the HYSPLIT transport and dispersion model and/or READY website (https://www.ready.noaa.gov; Last accessed on 12 August 2021) used in this publication. The authors thank Osamu Nagafuchi, Fukuoka Institute of Technology, for the providing the meteorological data. We appreciated critical review comments from two anonymous reviewers.

Conflicts of Interest

The authors declare no conflict of interest.

References

  1. Köhler, H. The nucleus in and the growth of hygroscopic droplets. Trans. Faraday Soc. 1936, 32, 1152–1161. [Google Scholar] [CrossRef]
  2. Dusek, U.; Frank, G.P.; Hildebrandt, L.; Curtius, J.; Schneider, J.; Walter, S.; Chand, D.; Drewnick, F.; Hings, S.; Jung, D.; et al. Size matters more than chemistry for cloud-nucleating ability of aerosol particles. Science 2006, 312, 1375–1378. [Google Scholar] [CrossRef] [Green Version]
  3. Furutani, H.; Dall’osto, M.; Roberts, G.C.; Prather, K.A. Assessment of the relative importance of atmospheric aging on CCN activity derived from field observations. Atmos. Environ. 2008, 42, 3130–3142. [Google Scholar] [CrossRef]
  4. Schmale, J.; Henning, S.; Decesari, S.; Henzing, B.; Keskinen, H.; Sellegri, K.; Ovadnevaite, J.; Pöhlker, M.L.; Brito, J.; Bougiatioti, A.; et al. Long-term cloud condensation nuclei number concentration, particle number size distribution and chemical composition measurements at regionally representative observatories. Atmos. Chem. Phys. 2018, 18, 2853–2881. [Google Scholar] [CrossRef] [Green Version]
  5. Kim, C.K.; Yum, S.S. A numerical study of sea-fog formation over cold sea surface using a one-dimensional turbulence model coupled with the weather research and forecasting model. Bound.-Layer Meteorol. 2018, 143, 481–505. [Google Scholar] [CrossRef]
  6. Stolaki, S.; Pytharoulis, I.; Karacostas, Y. A study of fog characteristics using a coupled WRF–COBEL model over Thessaloniki airport, Greece. Pure Appl. Geophys. 2012, 169, 961–981. [Google Scholar] [CrossRef]
  7. Zhao, C.; Klein, S.A.; Xie, S.; Liu, X.; Boyle, J.S.; Zhang, Y. Aerosol first indirect effects on non-precipitating low-level liquid cloud properties as simulated by CAM5 at ARM sites. Geophys. Res. Lett. 2012, 39, L08806. [Google Scholar] [CrossRef] [Green Version]
  8. Anttila, T.; Vaattovaara, P.; Komppula, M.; Hyvärinen, A.P.; Lihavainen, H.; Kerminen, V.M.; Laaksonen, A. Size-dependent activation of aerosols into cloud droplets at a subarctic background site during the second Pallas Cloud Experiment (2nd PaCE): Method development and data evaluation. Atmos. Chem. Phys. 2009, 9, 4841–4854. [Google Scholar] [CrossRef] [Green Version]
  9. Asmi, E.; Freney, E.; Hervo, M.; Picard, D.; Rose, C.; Colomb, A.; Sellegri, K. Aerosol cloud activation in summer and winter at puy-de-Dôme high altitude site in France. Atmos. Chem. Phys. 2012, 12, 11589–11607. [Google Scholar] [CrossRef] [Green Version]
  10. Ditas, F.; Shaw, R.A.; Siebert, H.; Simmel, M.; Wehner, B.; Wiedensohler, A. Aerosols-cloud microphysics-thermodynamics-turbulence: Evaluating supersaturation in a marine stratocumulus cloud. Atmos. Chem. Phys. 2012, 12, 2459–2468. [Google Scholar] [CrossRef] [Green Version]
  11. Hammer, E.; Bukowiecki, N.; Gysel, M.; Jurányi, Z.; Hoyle, C.R.; Vogt, R.; Baltensperger, U.; Weingartner, E. Investigation of the effective peak supersaturation for liquid-phase clouds at the high-alpine site Jungfraujoch, Switzerland (3580 m a.s.l.). Atmos. Chem. Phys. 2014, 14, 1123–1139. [Google Scholar] [CrossRef] [Green Version]
  12. Moteki, N.; Mori, T.; Matsui, H.; Ohata, S. Observational constraint of in-cloud supersaturation for simulations of aerosol rainout in atmospheric models. npj Clim. Atmos. Sci. 2019, 2, 6. [Google Scholar] [CrossRef] [Green Version]
  13. Adhikari, M.; Ishizaka, Y.; Minda, H.; Kazaoka, R.; Jensen, J.B.; Gras, J.L.; Nakajima, T. Vertical distribution of cloud condensation nuclei concentrations and their effect on microphysical properties of clouds over the sea near the southwest islands of Japan. J. Geophys. Res. 2005, 110, D10203. [Google Scholar] [CrossRef] [Green Version]
  14. Hofmann, D.J.; Rosen, J.M.; Harder, J.W.; Hereford, J.V. Balloon-borne measurements of aerosol, condensation nuclei, and cloud particles in the stratosphere at McMurdo Station, Antarctica, during the spring of 1987. J. Geophys. Res. 1989, 94, 11253–11269. [Google Scholar] [CrossRef]
  15. Henning, S.; Weingartner, E.; Schmidt, S.; Wendisch, M.; Gäggeler, H.W.; Baltensperger, U. Size-dependent aerosol activation at the high-alpine site Jungfraujoch (3580 m asl). Tellus B 2002, 54, 82–95. [Google Scholar] [CrossRef]
  16. Jurányi, Z.; Gysel, M.; Weingartner, E.; Bukowiecki, N.; Kammermann, L.; Baltensperger, U. A 17 month climatology of the cloud condensation nuclei number concentration at the high alpine site Jungfraujoch. J. Geophys. Res. 2011, 116, D10204. [Google Scholar] [CrossRef]
  17. Kammermann, L.; Gysel, M.; Weingartner, E.; Baltensperger, U. 13-month climatology of the aerosol hygroscopicity at the free tropospheric site Jungfraujoch (3580 m a.s.l.). Atmos. Chem. Phys. 2010, 10, 10717–10732. [Google Scholar] [CrossRef] [Green Version]
  18. Motos, G.; Schmale, J.; Corbin, J.C.; Modini, R.L.; Karlen, N.; Bertò, M.; Baltensperger, U.; Gysel-Beer, M. Cloud droplet activation properties and scavenged fraction of black carbon in liquid-phase clouds at the high-alpine research station Jungfraujoch (3580 m a.s.l.). Atmos. Chem. Phys. 2019, 19, 3833–3855. [Google Scholar] [CrossRef] [Green Version]
  19. Henning, S.; Dieckmann, K.; Ignatius, K.; Schäfer, M.; Zedler, P.; Harris, E.; Sinha, B.; Van Pinxteren, D.; Mertes, S.; Birmili, W.; et al. Influence of cloud processing on CCN activation behaviour in the Thuringian Forest, Germany during HCCT-2010. Atmos. Chem. Phys. 2014, 14, 7859–7868. [Google Scholar] [CrossRef] [Green Version]
  20. Friedman, B.; Zelenyuk, A.; Beranek, J.; Kulkarni, G.; Pekour, M.; Gannet Hallar, A.; McCubbin, I.B.; Thornton, J.A.; Cziczo, D.J. Aerosol measurements at a high-elevation site: Composition, size, and cloud condensation nuclei activity. Atmos. Chem. Phys. 2013, 11839–11851. [Google Scholar] [CrossRef] [Green Version]
  21. Hsiao, T.C.; Ye, W.C.; Wang, S.H.; Tsay, S.C.; Chen, W.N.; Lin, N.H.; Lee, C.T.; Hung, H.M.; Chuang, M.T.; Chantara, S. Investigation of the CCN activity, BC and UVBC mass concentrations of biomass burning aerosols during the 2013 BASELInE campaign. Aerosol Air Qual. Res. 2016, 16, 2742–2756. [Google Scholar] [CrossRef] [Green Version]
  22. Kato, S.; Shiobara, Y.; Uchiyama, K.; Miura, K.; Okochi, H.; Kobayashi, H.; Hatakeyama, S. Atmospheric CO, O3, and SO2 measurements at the summit of Mt. Fuji during the summer of 2013. Aerosol Air Qual. Res. 2016, 16, 2368–2377. [Google Scholar] [CrossRef] [Green Version]
  23. Nomura, S.; Mukai, H.; Terao, Y.; Machida, T.; Nojiri, Y. Six years of atmospheric CO2 observations at Mt. Fuji recorded with a battery-powered measurement system. Atmos. Meas. Tech. 2017, 10, 667–680. [Google Scholar] [CrossRef] [Green Version]
  24. Roberts, G.C.; Nenes, A. A Continuous-Flow Streamwise Thermal-Gradient CCN Chamber for Atmospheric Measurements. Aerosol Sci. Tech. 2005, 39, 206–221. [Google Scholar] [CrossRef]
  25. Brechtel, F.J.; Kreidenweis, S.M. Predicting Particle Critical Supersaturation from Hygroscopic Growth Measurements in the Humidified TDMA. Part II: Laboratory and Ambient Studies. J. Atmos. Sci. 2000, 57, 1872–1887. [Google Scholar] [CrossRef]
  26. Muraki, H. Fuji Sancho no Kaze no Kansoku. Kishou Kenkyu Note 1974, 118, 65–74. (In Japanese) [Google Scholar]
  27. Petters, M.D.; Kreidenweis, S.M. A single parameter representation of hygroscopic growth and cloud condensation nucleus activity. Atmos. Chem. Phys. 2007, 7, 1961–1971. [Google Scholar] [CrossRef] [Green Version]
  28. Rose, D.; Gunthe, S.S.; Mikhailov, E.; Frank, G.P.; Dusek, U.; Andreas, M.O.; Pöschl, U. Calibration and measurement uncertainties of a continuous-flow cloud condensation nuclei counter (DMT-CCNC): CCN activation of ammonium sulfate and sodium chloride aerosol particles in theory and experiment. Atmos. Chem. Phys. 2008, 8, 1153–1179. [Google Scholar] [CrossRef] [Green Version]
  29. Seinfeld, J.H.; Pandis, S.N. Cloud Physics. In Atmospheric Chemistry and Physics: From Air Pollution to Climate Change, 2nd ed.; John Wiley & Sons, Inc.: Hoboken, NJ, USA, 2006; pp. 761–827. [Google Scholar]
  30. Rolph, G.; Stein, A.; Stunder, B. Real-time environmental applications and display sYstem: READY. Environ. Model. Softw. 2017, 95, 210–228. [Google Scholar] [CrossRef]
  31. Stein, A.F.; Draxler, R.R.; Rolph, G.D.; Stunder, B.J.; Cohen, M.D.; Ngan, F. NOAA’s HYSPLIT atmospheric transport and dispersion modeling system. Bull. Am. Meteorol. Soc. 2015, 96, 2059–2077. [Google Scholar] [CrossRef]
  32. Hasegawa, T.; Miura, K.; Iinuma, K.; Kobayashi, H. Measurement of Cloud Condensation Nuclei at the summit of Mt. Fuji. Earozoru Kenkyu 2012, 27, 189–196, (In Japanese with English abstract). [Google Scholar]
  33. Zhou, S.; Collier, S.; Jaffe, D.A.; Zhang, Q. Free tropospheric aerosols at the Mt. Bachelor Observatory: More oxidized and higher sulfate content compared to boundary layer aerosols. Atmos. Chem. Phys. 2019, 19, 1571–1585. [Google Scholar] [CrossRef] [Green Version]
  34. Suzuki, I.; Hayashi, K.; Igarashi, Y.; Takahashi, H.; Sawa, Y.; Ogura, N.; Akagi, T.; Dokiya, Y. Seasonal variation of water-soluble ion species in the atmospheric aerosols at the summit of Mt. Fuji. Atmos. Environ. 2008, 42, 8027–8035. [Google Scholar] [CrossRef]
  35. Jimenez, J.L.; Canagaratna, M.R.; Donahue, N.M.; Prevot, A.S.; Zhang, Q.; Kroll, J.H.; DeCarlo, P.F.; Allan, J.D.; Coe, H.; Ng, N.L.; et al. Evolution of organic aerosols in the atmosphere. Science 2009, 326, 1525–1529. [Google Scholar] [CrossRef]
  36. Kaneyasu, N.; Igarashi, Y. Light absorption characteristics of atmospheric aerosols observed at the summit of Mt. Fuji in early summer. Earozoru Kenkyu 2007, 22, 318–321, (In Japanese with English abstract). [Google Scholar]
  37. Gunthe, S.S.; King, S.M.; Rose, D.; Chen, Q.; Roldin, P.; Farmer, D.K.; Jimenez, J.L.; Artaxo, P.; Andreae, M.O.; Martin, S.T.; et al. Cloud condensation nuclei in pristine tropical rainforest air of Amazonia: Size-resolved measurements and modeling of atmospheric aerosol composition and CCN activity. Atmos. Chem. Phys. 2009, 9, 7551–7575. [Google Scholar] [CrossRef] [Green Version]
  38. Iwamoto, Y.; Kinouchi, K.; Watanabe, K.; Yamazaki, N.; Matsuki, A. Simultaneous measurement of CCN activity and chemical composition of fine-mode aerosols at Noto peninsula, Japan, in autumn 2012. Aerosol Air Qual. Res. 2016, 16, 2107–2118. [Google Scholar] [CrossRef] [Green Version]
  39. Rose, D.; Nowak, A.; Achtert, P.; Wiedensohler, A.; Hu, M.; Shao, M.; Zhang, Y.; Andreae, M.O.; Pöschl, U. Cloud condensation nuclei in polluted air and biomass burning smoke near the mega-city Guangzhou, China–Part 1: Size-resolved measurements and implications for the modeling of aerosol particle hygroscopicity and CCN activity. Atmos. Chem. Phys. 2010, 10, 3365–3383. [Google Scholar] [CrossRef] [Green Version]
  40. Tunved, P.; Ström, J.; Hansson, H.C. An investigation of processes controlling the evolution of the boundary layer aerosol size distribution properties at the Swedish background station Aspvreten. Atmos. Chem. Phys. 2004, 4, 2581–2592. [Google Scholar] [CrossRef] [Green Version]
  41. Khvorostyanov, V.I.; Curry, J.A. Clouds and Their Properties. In Thermodynamics, Kinetics, and Microphysics of Clouds; Cambridge University Press: New York, NY, USA, 2014; pp. 9–44. [Google Scholar]
  42. Bennartz, R.; Rausch, J. Global and regional estimates of warm cloud droplet number concentration based on 13 years of AQUA-MODIS observations. Atmos. Chem. Phys. 2017, 17, 9815–9836. [Google Scholar] [CrossRef] [Green Version]
  43. Twomey, S. The nuclei of natural cloud formation part II: The supersaturation in natural clouds and the variation of cloud droplet concentration. Geofis. Pura Appl. 1959, 43, 243–249. [Google Scholar] [CrossRef]
Figure 1. (a) Location of Mt. Fuji (altitude 3776 m) in Japan, (b) Schematic of the MFRS with locations of the instruments and (c) schematic diagram of the instrumentation system in building 1.
Applsci 11 08439 g001
Figure 2. Examples of trajectories classified (a) Continental, (b) Pacific and (c) Others. For the vertical pathways, only trajectories classified as free troposphere (FT) are illustrated.
Applsci 11 08439 g002
Figure 3. Temporal variations of (a) air mass origins, (b) air pressure (red line), precipitation (blue sticks), (c) air temperature (red line), relative humidity (blue line), (d) wind speed (red lines) and wind direction (blue dots).
Applsci 11 08439 g003
Figure 4. Temporal variation of (a) air mass origins, (b) number size distributions (10–500 nm), (c) total particle concentrations (NCN) and CCN concentrations (NCCN) at each SS condition, and (d) Liquid water content (LWC). The green shading in (d) indicates cloud-shrouded periods.
Applsci 11 08439 g004
Figure 5. Relationship between water vapor supersaturation (%) and the median values of (a) number concentration of CCN (NCCN) (b) activation ratio (NCCN/NCN) (c) activation diameter (da) and (d) hygroscopicity parameter (κ), classified according to air mass origins. Green, red, blue, and gray lines and markers represent the entire period, Continental, Pacific, and Others airmass periods, respectively.
Applsci 11 08439 g005
Figure 6. Normalized number size distribution of the aerosol particles at the MFRS classified according to air mass origins.
Applsci 11 08439 g006
Figure 7. Effective supersaturation (SSeff) of clouds at the MFRS classified according to air mass origins. Number of data (N) for each group is indicated at the top of the panel.
Applsci 11 08439 g007
Figure 8. Relationship between NCD and NCCN under 0.21% SS.
Applsci 11 08439 g008
Figure 9. Normalized number size distribution of the cloud droplets at the MFRS classified according to air mass origins.
Applsci 11 08439 g009
Figure 10. Calculated and measured NCD during cloud-shrouded periods at the MFRS using the mean value of (a) the size distribution shape, (b) the water vapor supersaturation (SS) and (c) the hygroscopicity parameter κ.
Applsci 11 08439 g010
Table 1. The 25th percentile, median, mean and 75th percentile values of NCN. Number of data (N) for each air mass category is also indicated.
NCN (cm−3)
N25thMedianMean75th
Entire period502231.0414.2527.7590.7
Continental167383.3459.4617.9595.1
Pacific188153.8205.1391.5433.4
Others147272.9450.6524.5610.7
Table 2. The 25th percentile, median, mean and 75th percentile values of NCCN at each SS. Number of data (N) for each air mass category is also indicated.
NCCN (cm−3) (0.16% SS) NCCN (cm−3) (0.21% SS)
N25thMedianMean75thN25thMedianMean75th
Entire period48714.241.380.9117.849124.461.3107.8160.8
Continental16744.582.6176.1117.216768.1114.9155.3228.0
Pacific1797.612.822.424.818414.122.934.039.4
Others14130.162.3112.3181.214043.190.4147.9230.2
NCCN (cm−3) (0.36% SS) NCCN (cm−3) (0.55% SS)
N25thMedianMean75thN25thMedianMean75th
Entire period49150.2113.3169.7260.249276.2181.5224.2341.1
Continental167135.1204.2239.9324.4167206.2269.7310.0395.2
Pacific18527.946.264.473.318537.864.692.5103.0
Others13991.4158.2225.4355.6140138.2229.9295.7460.5
Table 3. Mean values of SSeff, w, NCD, LWC and Reff for clouds at the MFRS classified according to air mass origin. Standard deviations are indicated in parentheses.
Air Mass Origin
Entire PeriodContinentalPacificOthers
SSeff (%)0.34 (0.34)0.24 (0.14)0.44 (0.41)0.26 (0.26)
w (m s−1)1.29 (1.21)1.03 (1.32)1.40 (0.83)1.37 (1.63)
LWC (g m−3)0.05 (0.05)0.08 (0.06)0.03 (0.02)0.06 (0.05)
NCD (cm−3)78 (78)144 (92)36 (32)86 (65)
Reff (μm)8.1 (2.5)6.5 (1.7)9.3 (2.5)7.6 (2.1)
Publisher’s Note: MDPI stays neutral with regard to jurisdictional claims in published maps and institutional affiliations.

