Article

Spatiotemporal Characteristics of Radio Frequency Dielectric Barrier Glow Discharge at Atmospheric Pressure

1
Shanghai Publishing and Printing College, Shanghai 200093, China
2
State Key Laboratory of Biobased Material and Green Papermaking, School of Light Industry and Engineering, Qilu University of Technology (Shandong Academy of Sciences), Jinan 250353, China
3
Laboratory of Plasma Physics and Materials, Beijing Institute of Graphic Communication, Beijing 102600, China
*
Author to whom correspondence should be addressed.
Appl. Sci. 2021, 11(18), 8430; https://doi.org/10.3390/app11188430
Submission received: 26 July 2021 / Revised: 4 September 2021 / Accepted: 9 September 2021 / Published: 11 September 2021

Abstract

:
In this paper, argon was used in radio frequency (13.56 MHz) dielectric barrier discharge (rf-DBD) at atmospheric pressure. The IV curve was recorded after gas breakdown, and discharge photos were captured by ICCD camera. Discharges of α mode and γ mode were observed based on IV curve and ICCD photos. As the existence of negative glow in γ mode, the luminescence intensity of different position of the discharge gap was analyzed. It was found that in the α mode, the electron avalanche occurs from negative to positive and negative glow appeared after the discharge changed into γ mode. In every half cycle, the peak position of negative glow is 13 ± 1 ns later than that of electron avalanche on cathode surface.

1. Introduction

Atmospheric pressure glow discharge (APGD) is now a fascinating area of research in low temperature plasma physics. It provides a chamber-free and low cost route for industrial applications, such as surface modification, functional film deposition, and biological purification [1,2,3,4,5]. Compared with bare electrodes, dielectric barrier discharge (DBD) allow plasma to retain its large volume without constriction [6].
On the other hand, radio frequency DBD is now a popular source used to achieve a stable and large-gap atmospheric pressure glow discharge with lower breakdown voltage and avoid emergence of arc discharge and filamentary discharge, compared with DC glow discharge and low and medium frequency DBD at atmospheric pressure [6,7,8,9,10,11]. Therefore, a lot of study has been done on the discharge mechanism, simulation, and speckle pattern of radio-frequency dielectric barrier discharge (rf-DBD) at atmospheric pressure [12,13,14,15,16,17,18,19,20,21,22,23].
Many experiments demonstrated that there are α mode and γ mode in rf-DBD [6,8,10]. The mechanism of discharge in α mode is volume ionization, electron avalanche occurs under the acceleration of electric field. In every current cycle, there are two volume ionization process of opposite direction in the first half cycle and the second half cycle. The change from α mode to γ mode happens when the electric field intensity reach a certain value to give the positively charged ions a certain speed in half a cycle, so they could break the sheath binding and bombard the dielectric on cathode, thus producing a large number of secondary electrons.
Therefore, an important mark to distinguish the two discharge modes is the negative glow. Kong’s team has earlier used ICCD camera (Andor i-Star DH720, Belfast, UK) to capture photos of negative glow at 1/4 t and 3/4 t of the discharge cycle (current) as evidence for mode transition of rf-DBD. The time characteristics, including the time and duration of occurrence of electron avalanche (volume ionization) and negative glow in one cycle have not been reported. In this paper, the ICCD camera was used to capture 36 photos in a radio frequency cycle (73.7 ns). The temporal characteristics of electron avalanche and negative glow were studied based on changes of the luminous intensity of different plasma position in one cycle under different discharge modes.

2. Materials and Methods

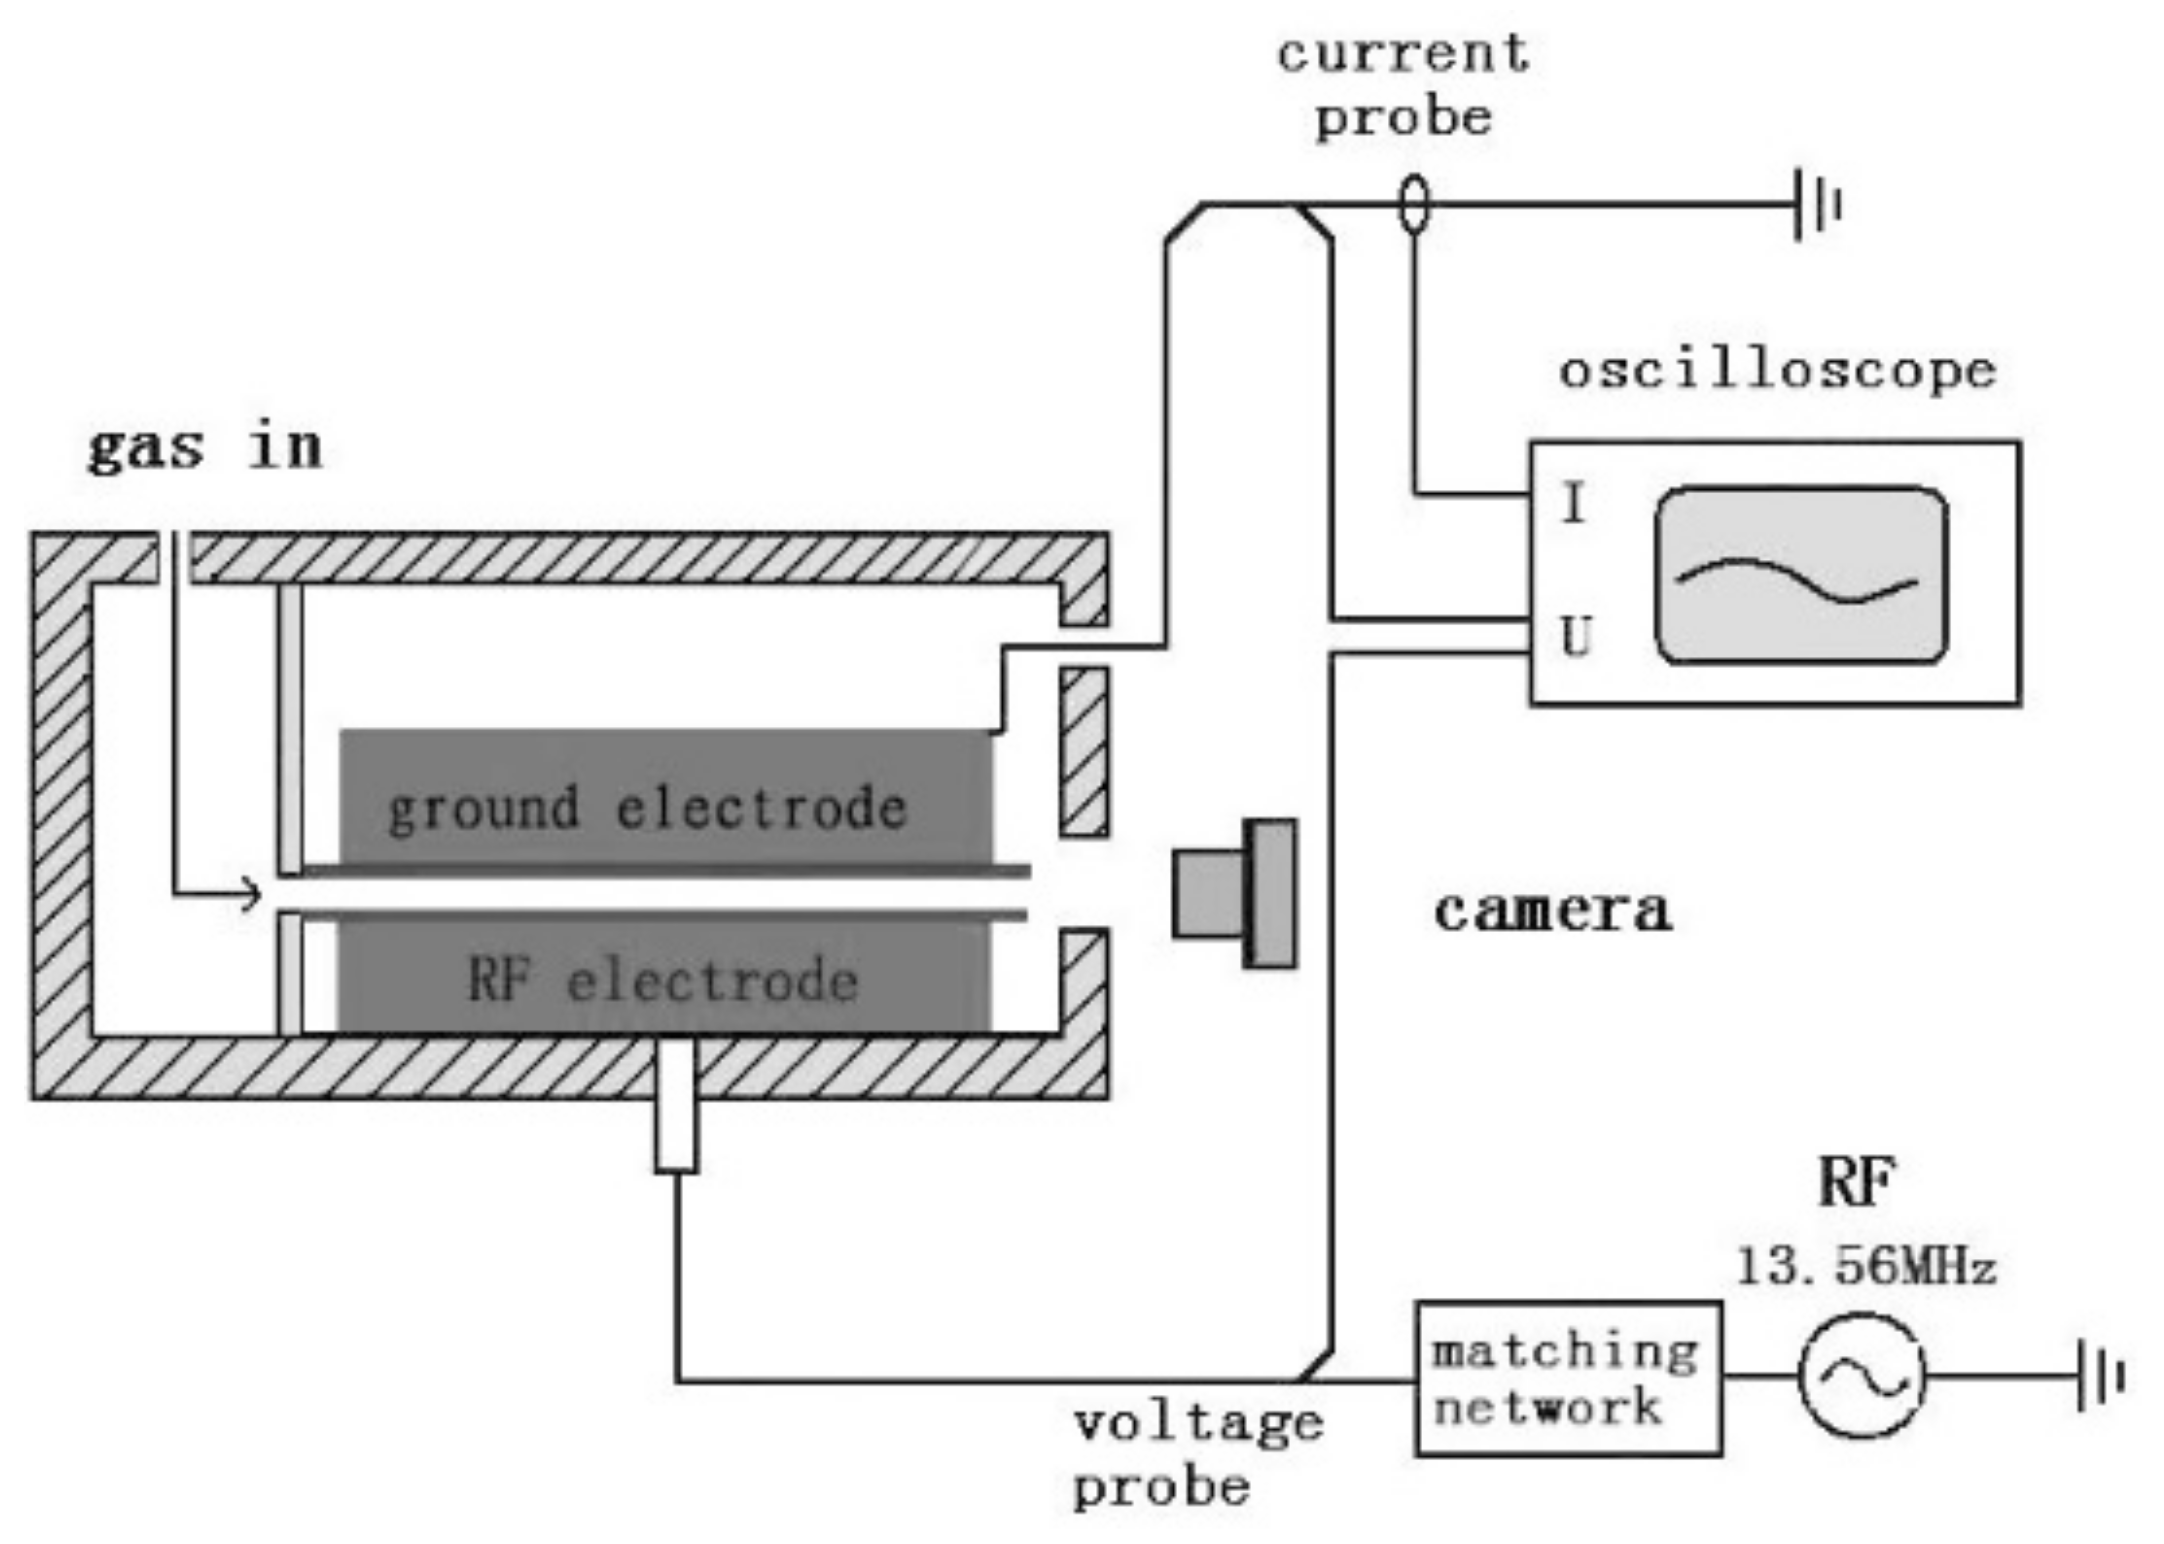
2.1. Experimental Facility

As shown in Figure 1, two square copper electrodes shaped 10 × 10 cm2 were used, both of which were covered by quartz sheet as barrier layers (14 × 14 × 1 mm3). The discharge gap was fixed as 4.4 mm. The bottom electrode was connected to rf power with the maximum power of 2 kW (13.56 MHz) through an automatic matching net and the upper electrode was grounded. The current and voltage were measured by a wide band current probe (Tektronix 6021AC, Beaverton, OR, USA) and a wide band voltage probe (Tektronix P6015A, Beaverton, OR, USA), respectively, and the probe signal was collected by oscilloscope (Tektronix DPO 4104, Beaverton, OR, USA). Discharge photos were captured by an ICCD camera (Princeton Instrument-PI-MAX2), which was placed to aim at the middle of discharge gap. The optical emission spectrum was obtained by a spectroscope (Avantes Avaspec 2048, Apeldoorn, The Netherlands) with a resolution of 0.12 nm.

2.2. Experimental Method

First, the valve was opened and argon gas passed through the discharge gap at a fixed rate of 2.0 L per minute (SLM), and the input power was increased. After the argon gas was broken down, the input power was continuously increased, and the RMS voltage and RMS current of the discharge were recorded at each power. At the same time, the plasma photos were captured at each power by the ICCD camera. The photos were t captured using two different exposure times of 100 μs and 2 ns. In a current cycle (73.7 ns), current curve passes zero in the direction of positive value at 0 T, and passes zero in the direction of negative value at ½ T. In the experiment, oscilloscope was connected with ICCD camera, which could be triggered to take photos by the signal of action of current curve passes zero in the direction of positive value. Therefore, by calculating the delay caused by the electric wires and the shooting distance, and setting the shooting delay time, a photo of plasma at a certain time in one cycle could be captured. In this paper, 36 photos with exposure time of 2 ns were captured at intervals of 2 ns.

2.3. Optical Diagnostics with ICCD Photos

The photos captured by ICCD are grayscale bitmaps with resolution of 1024 × 1024, in which the plasma region is about 952 pixel (transverse) times 44 pixel (longitudinal), and each pixel has its own intensity value. By analyzing the changes of intensity at different positions of plasma region at different times within one cycle, spatiotemporal characteristics of the discharge were studied.

3. Results and Discussion

3.1. ICCD Diagnostics with Exposure Time of 100 μs

IV curve of 4.4 mm rf-DBD at atmospheric pressure is shown in Figure 2. The voltage from point 1 to point 2 (138–208 W) basically remained unchanged, because the plasma area increased during this process. From point 2 (208 W) when the plasma filled the discharge gap, the voltage and current show a linear relationship. From point 8 to point 9 (624–686 W), the linear relationship suddenly changed, which is preliminarily assumed to be due to the change of plasma impedance after the switch from α mode to γ mode [6,18].
Figure 3 shows photos of two discharge modes. In α mode at 138 W (Figure 3a), the luminous intensity seems to be distributed evenly along the gap. At the highest power (836 W, Figure 3b), it is possible to observe longitudinal luminous intensity profile typical for γ mode, with dark spaces and strongly shining negative glow near surfaces [6,13].
In order to obtain the relationship between the luminescence intensity at different longitudinal positions of the plasma and the discharge power, ICCD photos were analyzed and the relational graph is shown in Figure 4. The coordinates represent the position between the gaps (0–4.4 mm), discharge power (100–900 W) and luminous intensity (0–40,000), respectively. As we can see, the luminous intensity of the plasma increases with the power at all positions. At the beginning, the luminous intensity at different positions of the discharge gap is basically the same. As the power increased, the intensity of plasma on dielectric surface is obviously higher than that at the middle position. However, throughout the process, there is no obvious turning point from which it can be considered as the change of discharge mode. Therefore, the spatiotemporal characteristics within one cycle (73.7 ns) of rf-DBD were studied.

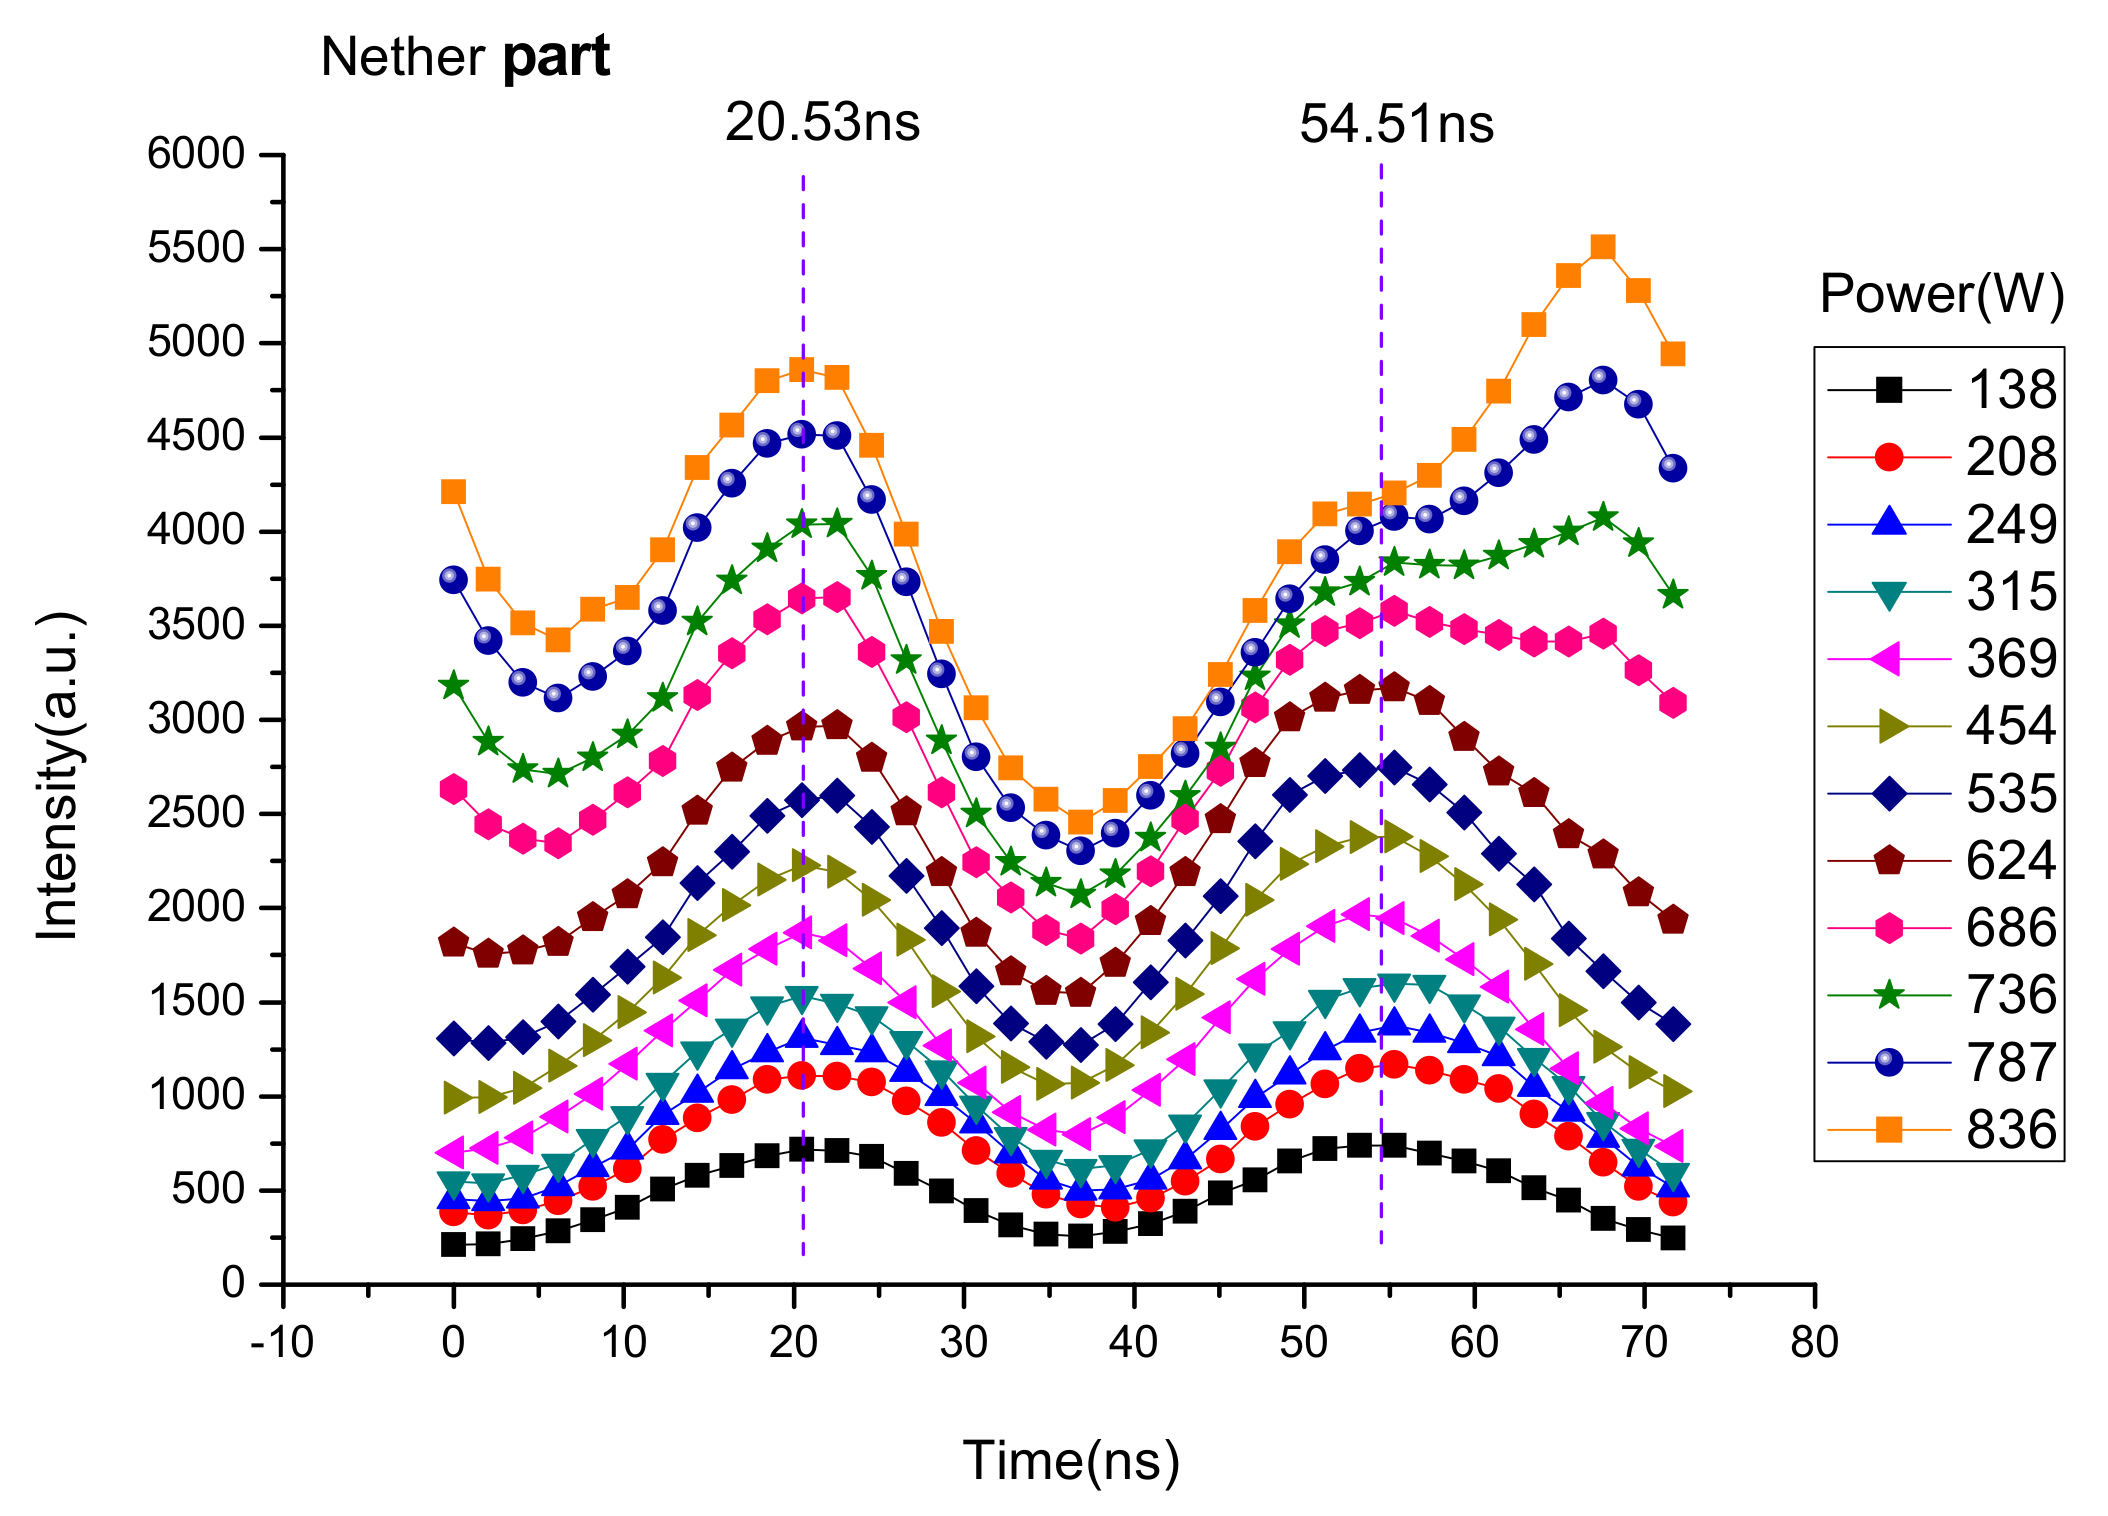
3.2. ICCD Diagnostics of Plasma in One Cycle with Exposure Time of 2 ns

In total, 36 photos were captured with a single exposure time of 2 ns within a current cycle of 73.7 ns, each photo was spaced 2 ns apart. As the existence of negative glow, we analyzed the average intensity of 8 lines of pixels (basically covering the negative glow region) at the top, the middle 8 lines of pixels at the middle and 8 lines of pixels at the bottom of plasma region (952 × 44 pixels) (952 × 44 pixels). Therefore, the relation curves represent the average emission intensity of different longitudinal positions varies with time in one cycle were obtained. The results are shown in Figure 5, Figure 6, Figure 7.
As we can see from Figure 5, Figure 6, Figure 7 the luminous intensity increases with the power at all times and all positions in one cycle, the 12 curves from bottom to top correspond to points 1–12 in Figure 2. At the power of the point 1 to point 8 (138–624 W) in Figure 2, the intensity of the three longitudinal positions of the plasma has two peaks in one cycle, which match the two peaks of the current. However, it can be seen from Figure 5, Figure 6, Figure 7 that the three peaks are different in time. The first peak of intensity appears first on the dielectric surface of the upper electrode (cathode), the following is the middle position, and finally, the dielectric surface of the lower electrode. Three peaks from top to bottom appeared at 17.7 ± 1 ns, 20.1 ± 1 ns and 20.5 ± 1 ns, respectively. In the second half of the cycle, the second peak appears first on the dielectric surface of the lower electrode (cathode), followed by the middle position, and finally on the dielectric surface of the upper electrode. Three peaks from bottom to top were 54.5 ± 1 ns, 56.9 ± 1 ns and 57.3 ± 1 ns, respectively, which means the generation of electron avalanche on anode surface is about 3 ns later than that on cathode surface. The time intervals reflect the process of electron avalanche from cathode to anode in every half cycle.
It can be seen from the curves at the four maximal powers in Figure 5, Figure 6, Figure 7 (686–836 W) that a third peak appears obviously on the upper electrode surface in the first half cycle and the lower electrode surface in the second half cycle, and the intensity increases rapidly with power (686–836 W). In Figure 8, voltage and current waveforms are shown with emission intensity curves from Figure 5, Figure 6 and Figure 7 (836 W), from which we can see the upper electrode in the first half is cathode, same as the lower electrode in the second half cycle, the new peak is identified as cathode luminescence caused by secondary electrons, which is an important characteristic of γ mode. Thus, it can be judged that the discharge has changed from α mode (624 W, point 8 in Figure 2) to γ mode (686 W, point 9 in Figure 2) [6,13].

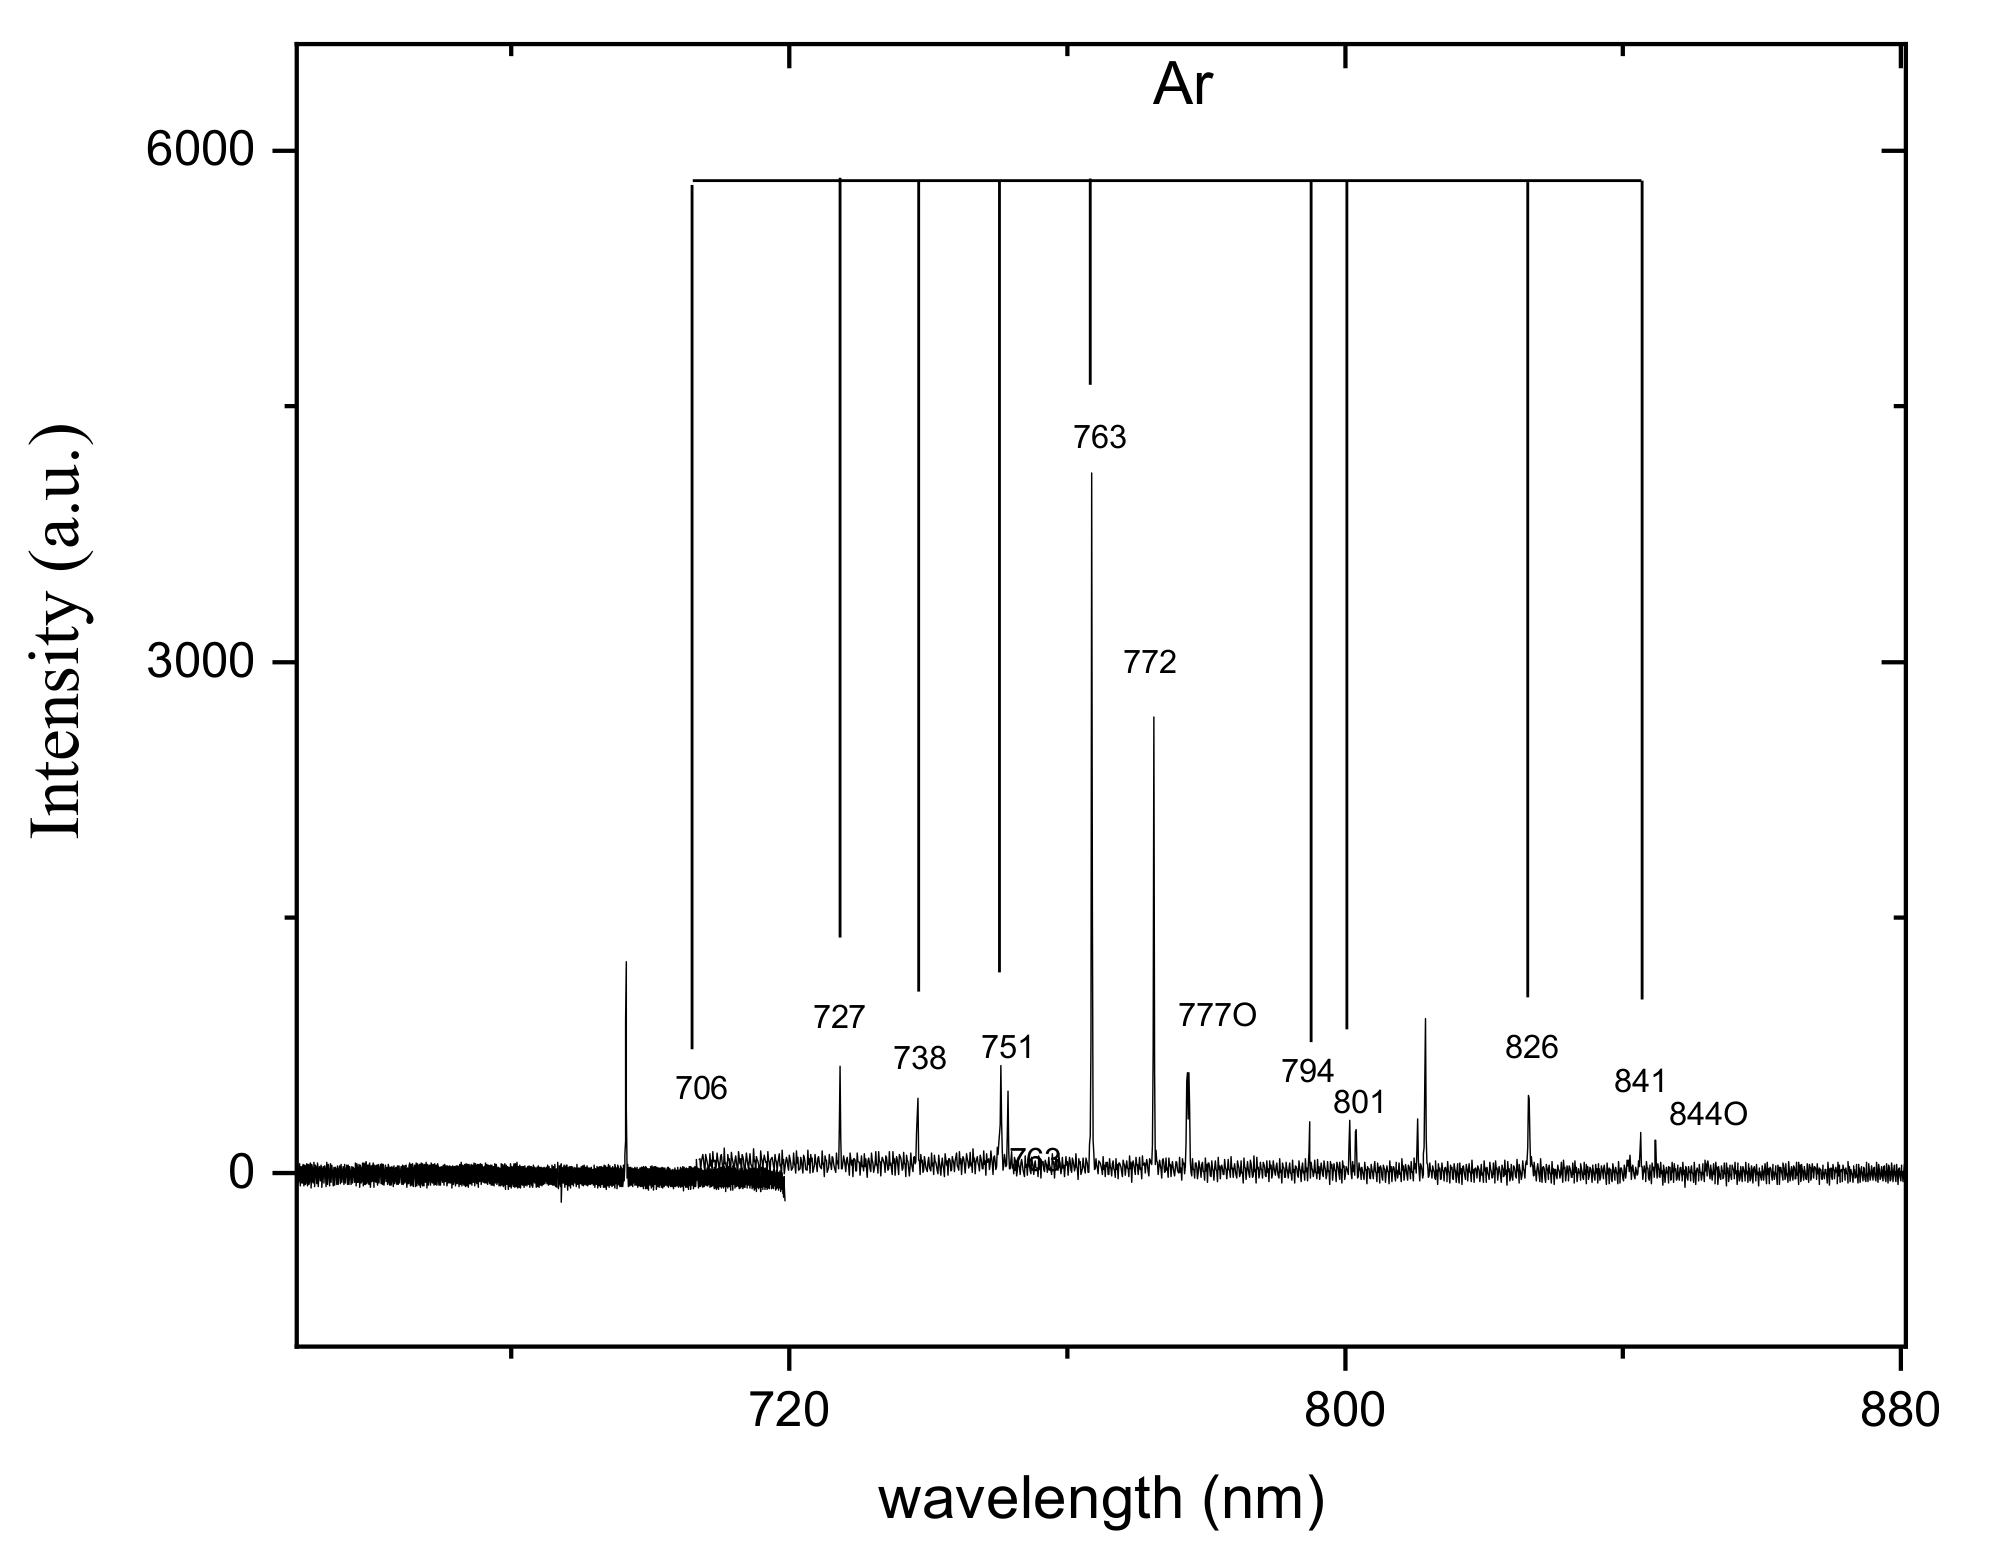
3.3. Optical Emission Spectroscopy Diagnostics and the Charge Dynamics

The optical emission spectra were measured at each power in Figure 2. Figure 9 shows the emission spectra at 138 W, corresponding to the first point in Figure 2, Figure 10 and Table 1 show the spectral lines and parameters of the argon we studied. The variation of atomic argon lines at 706, 738, 751, 794 nm with power is shown in Figure 11.
Variation of intensities of each spectral line in Table 1 with power are shown in Figure 11. The first 8 points of each line (138–624 W) represent discharge in α mode, and the last 4 points (686–836 W) represent discharge in γ mode. It can be seen that the intensities of each curve increase with power, and after the mode transformation, the intensities of each spectral line increase quicker with power obviously. Among them, turning points (624–686 W) could be found from curves of 751 nm and 794 nm. This is considered to be caused by the apparent increase in electron density after the mode shift, which makes the concentration of various active species increase more rapidly with power.
In every half cycle, electrons and argon ions were accelerated at the same time. Electrons were accelerated from cathode to anode and the avalanche happened, which leads to the first peak. In γ mode, positively charged argon ions were accelerated from anode to cathode. When the argon ions achieved a certain speed to break the sheath and bombarded the surface of the medium directly, a large number of secondary electrons yielded [6,7,8,10,11], which leads to the second peak on cathode surface.
Additionally, we can see, in the every half cycle, the luminescence caused by the secondary electrons on the cathode surface is obviously later than the volume ionization, and the time interval between the peaks is 13 ± 1 ns, which is thought to be caused by two reasons. The first is that argon ions are much heavier than electrons. The other reason is that the ions move farther than the electrons. In Figure 5, the value of the middle peak-valley and the third peak increased significantly, and the position of the peak-valley shift to the right. This is due to the large number of secondary electrons.
Comparing Figure 5 and Figure 7, it can be seen that the waveforms are essentially the same with interval of exactly half cycle, so the discharge characteristics on the surface of the two dielectrics are consistent. Although in Figure 6, there are always two peaks in the waveforms, the interval of which is about 36.7 ± 1 ns, very close to half cycle of the current which is 36.87 ns.

4. Conclusions

The study based on ICCD camera shows that there are two discharge modes in 4.4 mm argon double dielectric barrier discharge (13.56 MHz) at atmospheric pressure. In α mode, electron avalanche occurs from cathode to anode. After the discharge turned into γ mode, negative glow appeared, and the intensity of negative glow increased significantly with the power. On the surface of cathode, the emergence of negative glow and the electron avalanche have a certain interval, which is 13 ± 1 ns estimated by the positions of two peaks. It must be added that error may exists in relationship between curves and time due to the calculation of the circuit and the ICCD shooting distance, but this error is all the same to the curves in Figure 5, Figure 6 and Figure 7, which does not influence the results of temporal relations between electron avalanche and negative glow.

Author Contributions

S.L. and J.S. conceived and designed the experiment; Q.C. and Z.L. reviewed the manuscript technically and grammatically; R.S., J.P., L.W., and C.C. conducted the experiment and analyzed the data; S.L. and J.S. performed the experiments and wrote the manuscript. All authors have read and agreed to the published version of the manuscript.

Funding

This research was funded by the Dawnlight Program of Shanghai Municipal Education Commission and Shanghai Educational development Foundation of China, grant number 16CGB10.

Institutional Review Board Statement

Not applicable.

Informed Consent Statement

Not applicable.

Data Availability Statement

The authors confirm the date available in this article.

Conflicts of Interest

The authors declare no conflict of interest.

References

  1. Roth, J.R. Industrial Plasma Engineering; IOP: Philadelphia, PA, USA, 1995. [Google Scholar]
  2. Moisan, M.; Barbeau, J.; Moreau, S.; Pelletier, J.; Tabrizian, M.; Yahia, L. Low-temperature sterilization using gas plasmas: A review of the experiments and an analysis of the inactivation mechanisms. Int. J. Pharm. 2001, 226, 1–21. [Google Scholar] [CrossRef]
  3. Arkhipenko, V.; Callegari, T.; Safronau, Y.; Simonchik, L. Atmospheric-Pressure Air Glow Discharge in a Three-Electrode Configuration. IEEE Trans. Plasma Sci. 2009, 37, 1297–1304. [Google Scholar] [CrossRef]
  4. Bruggeman, P.; Liu, J.; Degroote, J.; Kong, M.G.; Vierendeels, J.; Leys, C. Dc excited glow discharges in atmospheric pressure air in pin-to-water electrode systems. J. Phys. D Appl. Phys. 2008, 41, 215201. [Google Scholar] [CrossRef]
  5. Muñoz, J.; Calzada, M.D. Experimental research on surface wave Ar–He discharges at atmospheric pressure. J. Phys. D Appl. Phys. 2008, 41, 135203. [Google Scholar] [CrossRef]
  6. Shi, J.J.; Liu, D.W.; Kong, M.G. Effects of Dielectric Barriers in Radio-Frequency Atmospheric Glow Discharges. IEEE Trans. Plasma Sci. 2007, 35, 137–142. [Google Scholar] [CrossRef] [Green Version]
  7. Li, G.; Li, H.-P.; Sun, W.-T.; Wang, S.; Tian, Z.; Bao, C.-Y. Discharge features of radio-frequency, atmospheric-pressure cold plasmas under an intensified local electric field. J. Phys. D: Appl. Phys. 2008, 41, 202001. [Google Scholar] [CrossRef]
  8. Shi, J.J.; Kong, M. Expansion of the plasma stability range in radio-frequency atmospheric-pressure glow discharges. Appl. Phys. Lett. 2005, 87, 201501. [Google Scholar] [CrossRef] [Green Version]
  9. Walsh, J.; Cao, Z.; Kong, M. Atmospheric Dielectric-Barrier Discharges Scalable From 1 mm to 1 m. IEEE Trans. Plasma Sci. 2008, 36, 1314–1315. [Google Scholar] [CrossRef]
  10. Shi, J.J.; Kong, M. Radio-frequency dielectric-barrier glow discharges in atmospheric argon. Appl. Phys. Lett. 2007, 90, 111502. [Google Scholar] [CrossRef] [Green Version]
  11. Walsh, J.; Iza, F.; Kong, M. Atmospheric glow discharges from the high-frequency to very high-frequency bands. Appl. Phys. Lett. 2008, 93, 251502. [Google Scholar] [CrossRef] [Green Version]
  12. Li, S.; Liu, Z.W.; Cai, H.P.; Chen, Q. Restraint effect of filaments on applied voltage in atmospheric pressure glow discharge. Plasma Sci. Technol. 2011, 14, 28–31. [Google Scholar] [CrossRef]
  13. Iza, F.; Lee, J.K.; Kong, M. Electron Kinetics in Radio-Frequency Atmospheric-Pressure Microplasmas. Phys. Rev. Lett. 2007, 99, 075004. [Google Scholar] [CrossRef] [Green Version]
  14. Gandhiraman, R.P.; Singh, E.; Diaz-Cartagena, D.C.; Nordlund, D.; Koehne, J.; Meyyappan, M. Plasma jet printing for flexible substrates. Appl. Phys. Lett. 2016, 108, 123103. [Google Scholar] [CrossRef]
  15. Qazi, H.I.A.; Nie, Q.-Y.; Li, H.-P.; Zhang, X.-F.; Bao, C.-Y. Comparison of electrical and optical characteristics in gas-phase and gas-liquid phase discharges. Phys. Plasmas 2015, 22, 123512. [Google Scholar] [CrossRef]
  16. Tatarova, E.; Bundaleska, N.; Sarrette, J.P.; Ferreira, C.M. Plasmas for environmental issues: From hydrogen production to 2D materials assembly. Plasma Sources Sci. Technol. 2014, 23, 063002. [Google Scholar] [CrossRef]
  17. Hussain, S.; Qazi, H.I.A.; Malik, A.A.; Badar, M.A. Glow modes in radio frequency atmospheric discharge operating with and without anodized electrodes. IEEE Trans. Plasma Sci. 2014, 42, 2410–2411. [Google Scholar] [CrossRef]
  18. Shi, J.J.; Liu, D.W.; Kong, M. Mitigating plasma constriction using dielectric barriers in radio-frequency atmospheric pressure glow discharges. Appl. Phys. Lett. 2007, 90, 31505. [Google Scholar] [CrossRef] [Green Version]
  19. Kunhardt, E.E. Generation of large-volume, atmospheric-pressure, nonequilibrium plasmas. IEEE Trans. Plasma Sci. 2000, 28, 189–200. [Google Scholar] [CrossRef]
  20. Li, B.; Chen, Q.; Liu, Z.W. A large gap of radio frequency dielectric barrier atmospheric pressure glow discharge. Appl. Phys. Lett. 2010, 96. [Google Scholar] [CrossRef]
  21. Li, X.; LIU, R.; Gong, D.; Li, X.; Ren, C.; Jia, P. Influence of external parameters on nonlinear behaviors in a helium dielectric-barrier discharge excited by a modulated voltage. Phys. Plasmas 2019, 26, 23514. [Google Scholar] [CrossRef]
  22. Luo, L.; Wang, Q.; Dai, D.; Zhang, Y.; Li, L. A practical method for controlling the asymmetric mode of atmospheric dielectric barrier discharges. Appl. Sci. 2020, 10, 1341. [Google Scholar] [CrossRef] [Green Version]
  23. Nishime, T.M.C.; Wannicke, N.; Horn, S.; Weltmann, K.-D.; Brust, H. A Coaxial dielectric barrier discharge reactor for treatment of sinter sheat seeds. Appl. Sci. 2020, 10, 7133. [Google Scholar] [CrossRef]
Figure 1. Schematic diagram of experimental set-up.
Applsci 11 08430 g001
Figure 2. IV curve of 4.4 mm DBD.
Applsci 11 08430 g002
Figure 3. ICCD photos: (a) and (b) correspond to point 1 and point 12 in Figure 2 (exposure time: 100 μs).
Applsci 11 08430 g003
Figure 4. Three-dimensional view of the emission intensity vary with gap position and power of 4.4 mm argon DBD.
Applsci 11 08430 g004
Figure 5. The curves of luminescence intensity on surface of the upper electrode in 4.4 mm argon DBD in one current cycle at different power.
Applsci 11 08430 g005
Figure 6. The curves of luminescence intensity of middle part in 4.4 mm argon DBD in one current cycle at different power.
Applsci 11 08430 g006
Figure 7. The curves of luminescence intensity on surface of the nether electrode in 4.4 mm argon DBD in one current cycle at different power.
Applsci 11 08430 g007
Figure 8. The voltage and current waveforms with emission intensities curves from Figure 5, Figure 6, Figure 7 (836 W).
Applsci 11 08430 g008
Figure 9. Emission spectra of plasma at 138 W.
Applsci 11 08430 g009
Figure 10. Species calibration of emission spectra in Figure 9.
Applsci 11 08430 g010
Figure 11. Variation of intensities of each spectral line in Table 1 with power.
Applsci 11 08430 g011
Table 1. Parameters of Ar spectrum lines studied in the experiment.
λ/nmConfigurationsAki/107s−1EiEk (cm−1)
ArⅠ7063s23p5(23/2)4s-3s23p5(21/2)4p0.3893,143.7600–107,289.7001
ArⅠ7383s23p5(23/2)4s-3s23p5(21/2)4p0.84793,750.5978–107,289.7001
ArⅠ7513s23p5(23/2)4s-3s23p5(23/2)4p 4.0293,750–107,054.2720
ArⅠ7943s23p5(21/2)4s-3s23p5(21/2)4p1.8694,553.6652–107,131.7086
Publisher’s Note: MDPI stays neutral with regard to jurisdictional claims in published maps and institutional affiliations.

