1. Introduction
The production of Virgin Olive Oil (VOO) is a food transformation activity that encompasses the extraction of the oil out of the raw incoming olives using exclusively mechanical means. The ripeness and sanitary state of these olives is a key factor in the final quality of the VOO obtained [
1,
2], as the technological variables of the process have only limited authority to influence the final features of the produced VOO, and can only preserve the potential quality offered by the fruit. Therefore, from a practical point of view, the properties of the incoming olives set an upper bound on the VOO quality, as the process cannot compensate for poor olive conditions. Under these circumstances, a proper characterization of the incoming olives emerges as a key step when the objective is to produce a consistent quality level of the final product. There is well known trade-off between quality and extraction yield [
3,
4], so it is important to only employ a high quality configuration of the process for those olives that could actually provide such quality, since using that configuration for other types of olives would simply result in a diminished extraction yield without the desired higher quality.
Separating the olives according to whether they were collected from the tree canopy or from the ground is a widespread practice in the VOO production industry. When this classification is carried out, olive growers are typically paid according to this factor, with olives coming from the tree receiving a higher remuneration. The classification of the batches between olives coming from the trees or from the ground is usually carried out by operators of the reception area of the factory. Consequently, these assessments can be affected by the subjectivity and the fatigue of the operators. Another important drawback of the manual inspection of the batches is the fact that the operator typically needs to perform some other actions in the reception area, so the inspection is carried out only on a subset of the received olives.
The different remuneration for the olives coming from the tree canopy and coming from the ground provides an economic motivation for growers to try to present ground olives as canopy olives, or to mix small amounts of ground olives in a batch of canopy olives. Sometimes, a preliminary cleaning process is carried out in the orchards in order to complicate the classification of ground olives as such.
Besides these considerations, canopy olives may have different quality levels, depending on whether they have suffered plagues or hail. The detection of these olives is of great interest, since even a small number of these may significantly impact the final quality of the produced VOO.
Different aspects of the determination of the quality level of olives using computer vision have been addressed in previous scientific publications. The first contributions were focused on the detection of bruises on table olives and the classification of these into different classes according to the presence of these defects [
5,
6]. These works reported that the best results were obtained using artificial neural networks (ANN). A posterior work [
7] introduced the use of the Lab and HSV color spaces, and showed their applicability for the classification of table olives into different classes according to the type of defect present in them. In turn, [
8] proposed using a ANN for the prediction of the ripeness of olives bound for the production of virgin olive oil (VOO). All of these contributions employ images that were taken in structured environments that avoided the superposition of olives and enhanced the difference between the olives and the background.
The first contributions that try to segment olives in unstructured conditions were [
9,
10]. These works, which are very similar, tackle the segmentation of olives from the olive branch, using the correlation of the image with an olive prototype and the application of the Chan-Vese algorithm in the surrounding area of the seeds detected by the correlation algorithm.
The use of cameras with spectra other than the visible band started with [
11,
12], where the authors show the ability of infrared cameras to capture defects in the olives that are not perceptible in the visible band. In these contributions, the layout of the olives in the images is similar to those found in the conveyor belts of the reception area of a olive oil mill; however, these contributions do not detail how to perform the olive segmentation automatically in these conditions.
In turn, in [
13], the authors propose the classification of complete olive batches, assigning the same class to all the olives in the image. This work compares the results obtained using Fisher Linear Discriminant and ANN, reporting success rates above 90% in both cases, and slightly better for ANN. The authors continued the batch classification approach in [
14], where the images employed were taken from the conveyor belt in the reception area of an olive oil mill. In this contribution, the authors employ a methodology similar to their previous paper and report success rates over 95% in all the cases.
The same batch analysis approach, without individually segmenting olives, can be found in [
15], where olive images were used to predict the quality level of the VOO obtained from them. In this work, the features used were Haralick descriptors computed from the whole image removing the background. The prediction models were built using partial least squares regression and offered good results for different VOO quality parameters.
The individual olive segmentation approach can be found again in [
16], where the authors employ structured images to estimate the size and weight of olives. Ref. [
17] is a continuation of the work, showing less strict requirements regarding the disposition of the olives in the images, but still avoiding the superposition of olives for the segementation. A third related article by the same authors is [
18], where the objective is to segment olives directly from the olive branch. For this, the authors employ convolutional neural networks (CNN) and compare the results obtained using different CNN described in the literature, reporting sensitivity values around 80% and precision values between 84.4% and 88.8%.
A different approach for the evaluation of the properties of olives in the groves can be found in [
19]. In this work, the authors propose a method consisting of sampling the olives and presenting them in structured conditions to obtain color, ripeness and detection of bruises.
Finally, two works that employ computer vision on olives with objectives other than the determination of their quality are [
20], where the cultivar variety of the olives is determined based on images from their pit; and [
21], where the position of table olives is detected using ANN for the pit-removal processing. Other interesting applications of computer vision for quality control in other industries can be found in [
22,
23].
The main technological challenge that this paper addresses is the use of images of the olives that are acquired under regular operating conditions of an olive oil mill for the detection of defects on indiviual olives. This way, this work proposes and validates an automatic defect detection system based on the extraction of information from olive images acquired with a infrared camera installed in the reception yard of the mill. The main contributions of this work are:
Development of a non-invasive industrial monitorization system that allows us to capture data without interfering with the regular productive process of the mill.
Development of an iterative process that employs active contours combined with mathematical morphology for the detection of individual olives after the washing process, using images that were acquired during the regular operation of the mill.
Development of a segmentation algorithm for the detection of defects in olives.
The rest of the paper is organized as follows:
Section 2 presents the equipment design, image acquisition and image processing; while
Section 3 introduces and discusses the obtained results. Finally
Section 4 presents the conclusions of the work.
2. Materials and Methods
The next Sections detail the equipment design, the image acquisition and the image processing and classification steps.
2.1. Equipment Design and Image Acquisition
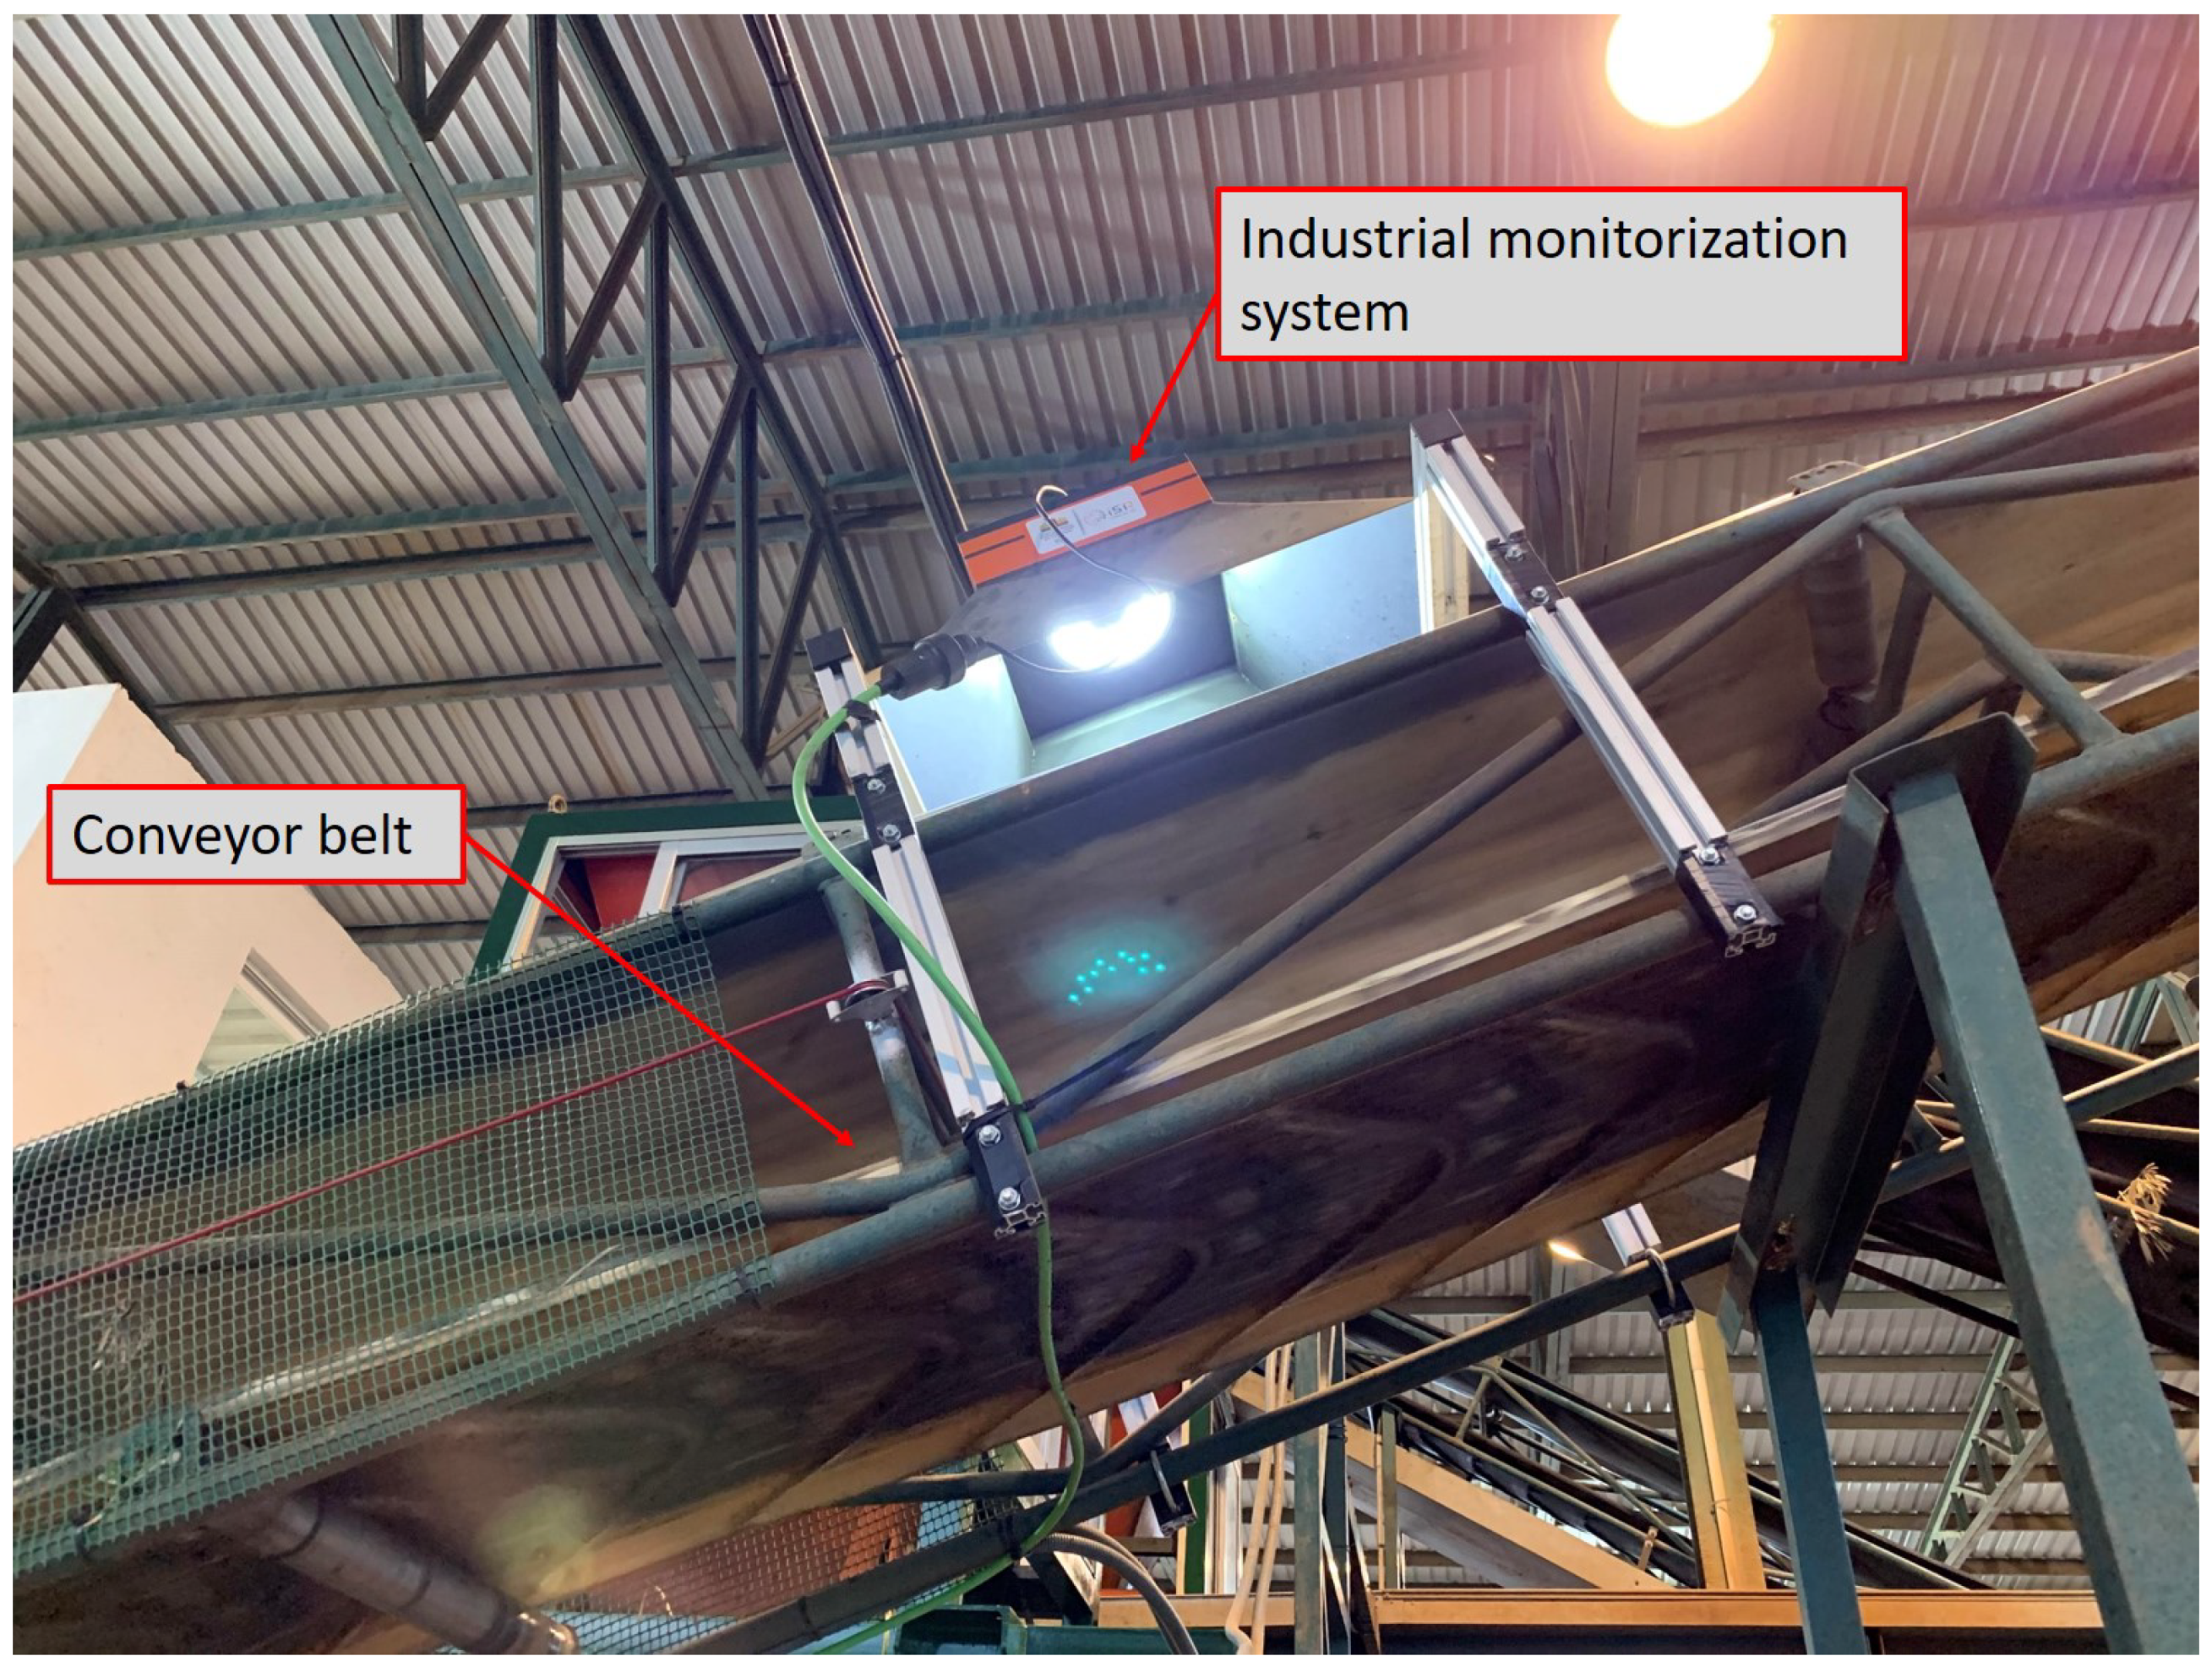
The first step for using images acquired in industrial conditions for the determination of defects in olives is to design an acquisition system capable of obtaining good quality images, coping with the challenges imposed by these conditions. On the one hand, the speed of the conveyor imposes the use of very short acquisition times, which implies demanding requirements for the lighting system; on the other, the height of the olives in the conveyor varies in a sufficiently broad range as to influence the required depth of field and the focal distance of the lenses.
For this, an image acquisition system was designed for its installation on the conveyors typically employed in the olive oil mill yard for the movement of the olives in the reception, washing and storage processes previous to the milling. The acquisition system was composed of a lighting system, a camera, electronic components to manage the acquisition of the images and their transference to external servers, and mechanical elements to protect the different components and fix the system to the conveyor. For this work, an infrared Dalsa Genie NANO M2590-NIR and a visible spectra Nano C242 with 25 mm optics, along with a 500 W stroboscopic halogen lighting system, were employed. These components were protected by chamber designed in collaboration with ISR, a spin-off company from the University of Jaén. The chamber contained a holder for the camera that located it at approximately 50 cm from the conveyor and prevented its movement, providing a spatial resolution of 10 pixel/mm.
Figure 1 shows the system installed in the conveyor of the factory.
The image acquisition system can be located before or after the fruit cleaning process, since conveyors are used in both stages. The decision to situate it before or after this cleaning process is influenced by the conveyor configuration of the factory. Depending on this configuration, it could be possible to store the fruit in hoppers according to its quality level. In many factories, the storage hopper is determined by the reception line employed, without the possibility of changing it afterwards; however, some other factory configurations do allow to choose the storage hopper independently of the recepction line. In this case, the information obtained from the images could be used to define which hopper should store the olives, which would recommend installing the system before the switch point where the olives are actually routed to one hopper or another. If there is no such possibility, then the detection of defects can be used to penalize the grower that provides a batch with a sub-standard quality level, which would leave the question of whether to install the system before of after the cleaning process open to other considerations.
For this work, the images employed were acquired in the olive oil factory Industria San Pedro, S.L., located in Jaén, during the season 2020–21. Since the system was not to be used for deciding which hopper the olives should be routed to, considerations related with the simplicity of installation motivated the location of the system in the conveyor that moves the fruit from the washer to the storage hopper. This way, an average of 200 daily images, taken every 10 s and covering the reception of several batches of olives, were taken from 11 January until 26 January.
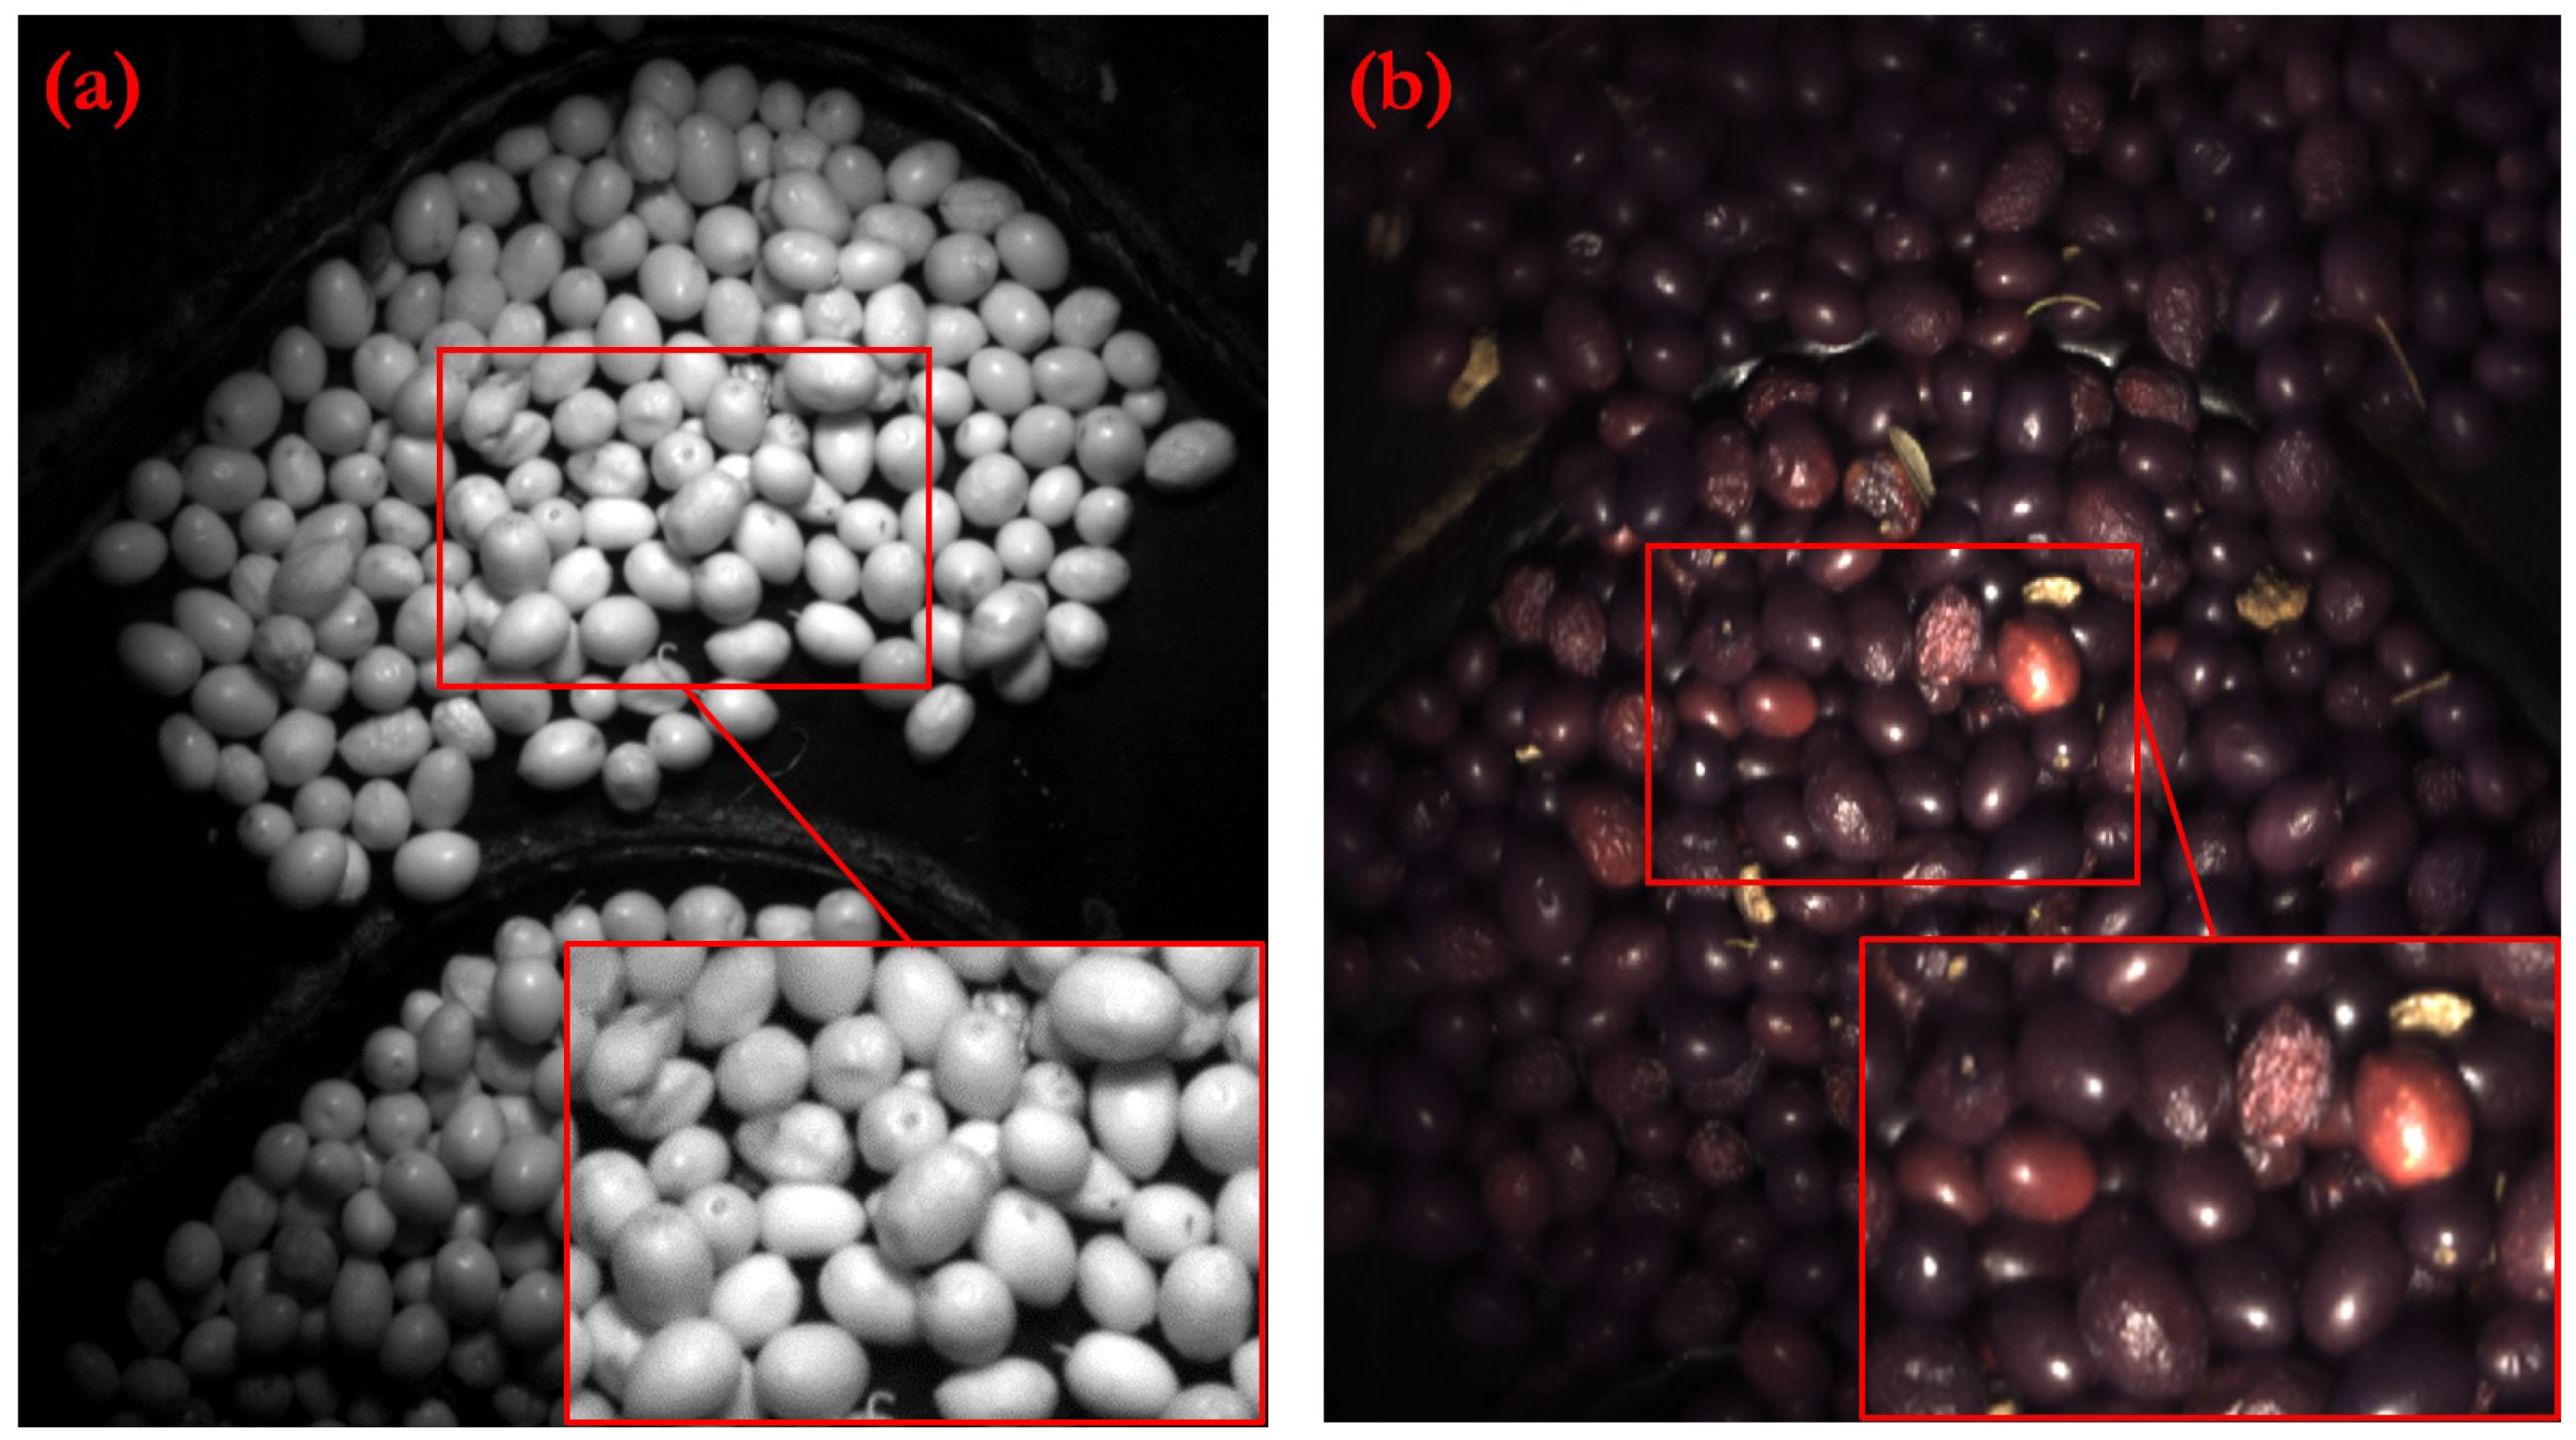
Figure 2 shows some examples of the acquired images using the cameras with different spectra installed on the conveyor. As can be seen in
Figure 2a, the infrared camera is a better choice to detect damaged olives. The fruits damaged by insects show stains with a lower gray level that the rest of the surface of the fruit. These stains would not be visible in the images of the color camera shown in
Figure 2b.
2.2. Image Processing
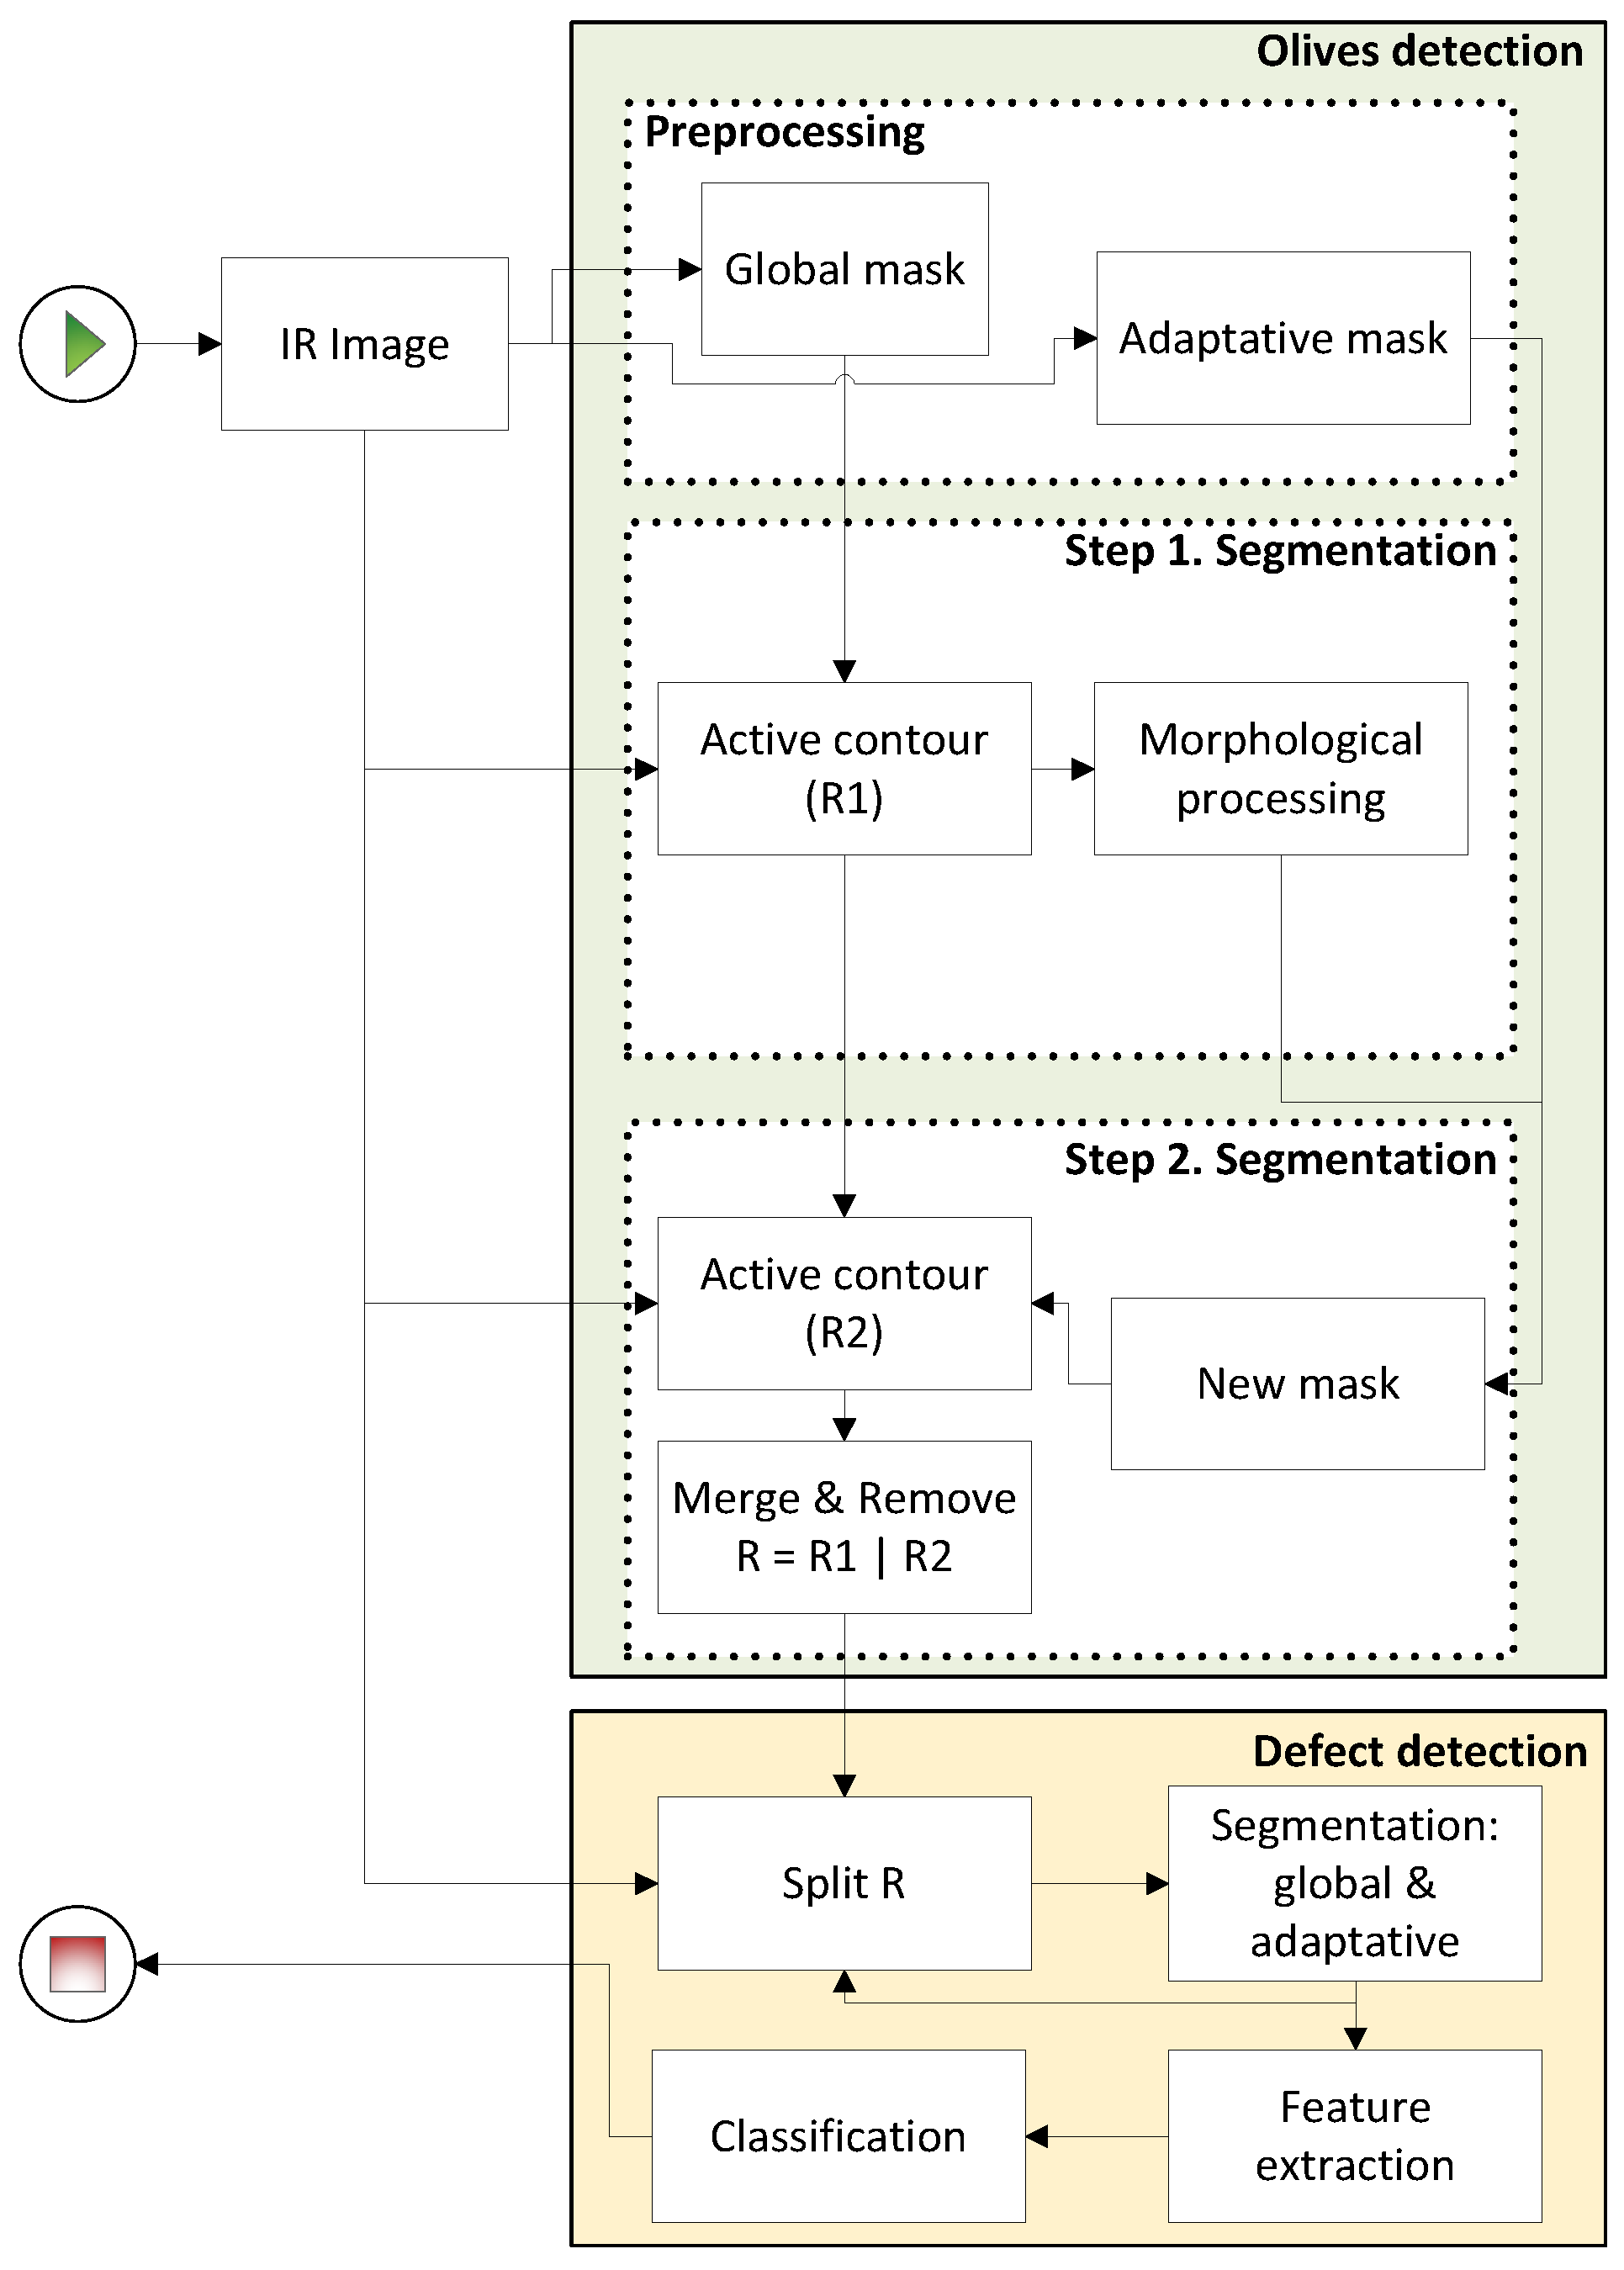
Figure 3 shows the general block diagram designed for processing the infrared images acquired after the cleaning of the fruit. As can be observed, the process is structured in two main blocks: olive detection and defect detection. The average computation time of the complete algorithm was around 100 s for each image.
The olive detection block is composed of a preprocessing stage and two segmentation steps. From a global point of view, this block is based on the iterative application of the active contours technique [
24] assisted with mathematical morphology operations. The type of images to be analysed render classical segmentation techniques inapplicable. This way, the applied techniques should be robust to the presence of noise and other spurious elements, and should be able to extract objects even when the boundary between them and the background is not clear.
The active contour technique allows us to segment objects based on models that use a priori information about the shape of these objects. If the model is adequate, the presence of false positives or negatives is expected to be low. These models are the result of the preprocessing stage, where two type of masks are obtained: global and adaptative. The active contour segmentation is carried out in two steps, using a global mask for the first, and an adaptative masks for the latter. The mathematical morphologic operations are a required step to adjust the models between steps.
The detection of the defects is performed individually, evaluating each of the objects or olive contours found in the previous stage. The intersection of the results obtained using the global and adaptative segmentation techniques allows to detect the defects of the olives, minimizing the false positives produced mainly by glows, changes in the intensity level of the olive borders or occlusions with other olives. The extracted regions of each olive are evaluated to decide in the classification stage whether they are considered as defective or not. The classification is performed using a decision tree that evaluates descriptors of the regions such as circularity, elongation and area.
2.2.1. Detection of Olives
As a previous step to the iterative application of the active contours technique for the detection of the olives, it is necessary to have the models that should be adjusted to the image data for the global contour. These models are obtained in the preprocessing step using classical segmentation procedures based on global and locally adaptative thresholding. The obtainment of these models and the olive contours are presented next.
The second term of the external energy, i.e., the restrictive energy (
), can be expressed as:
where
k is a constant and
and
are points of the snake and the image, respectively.
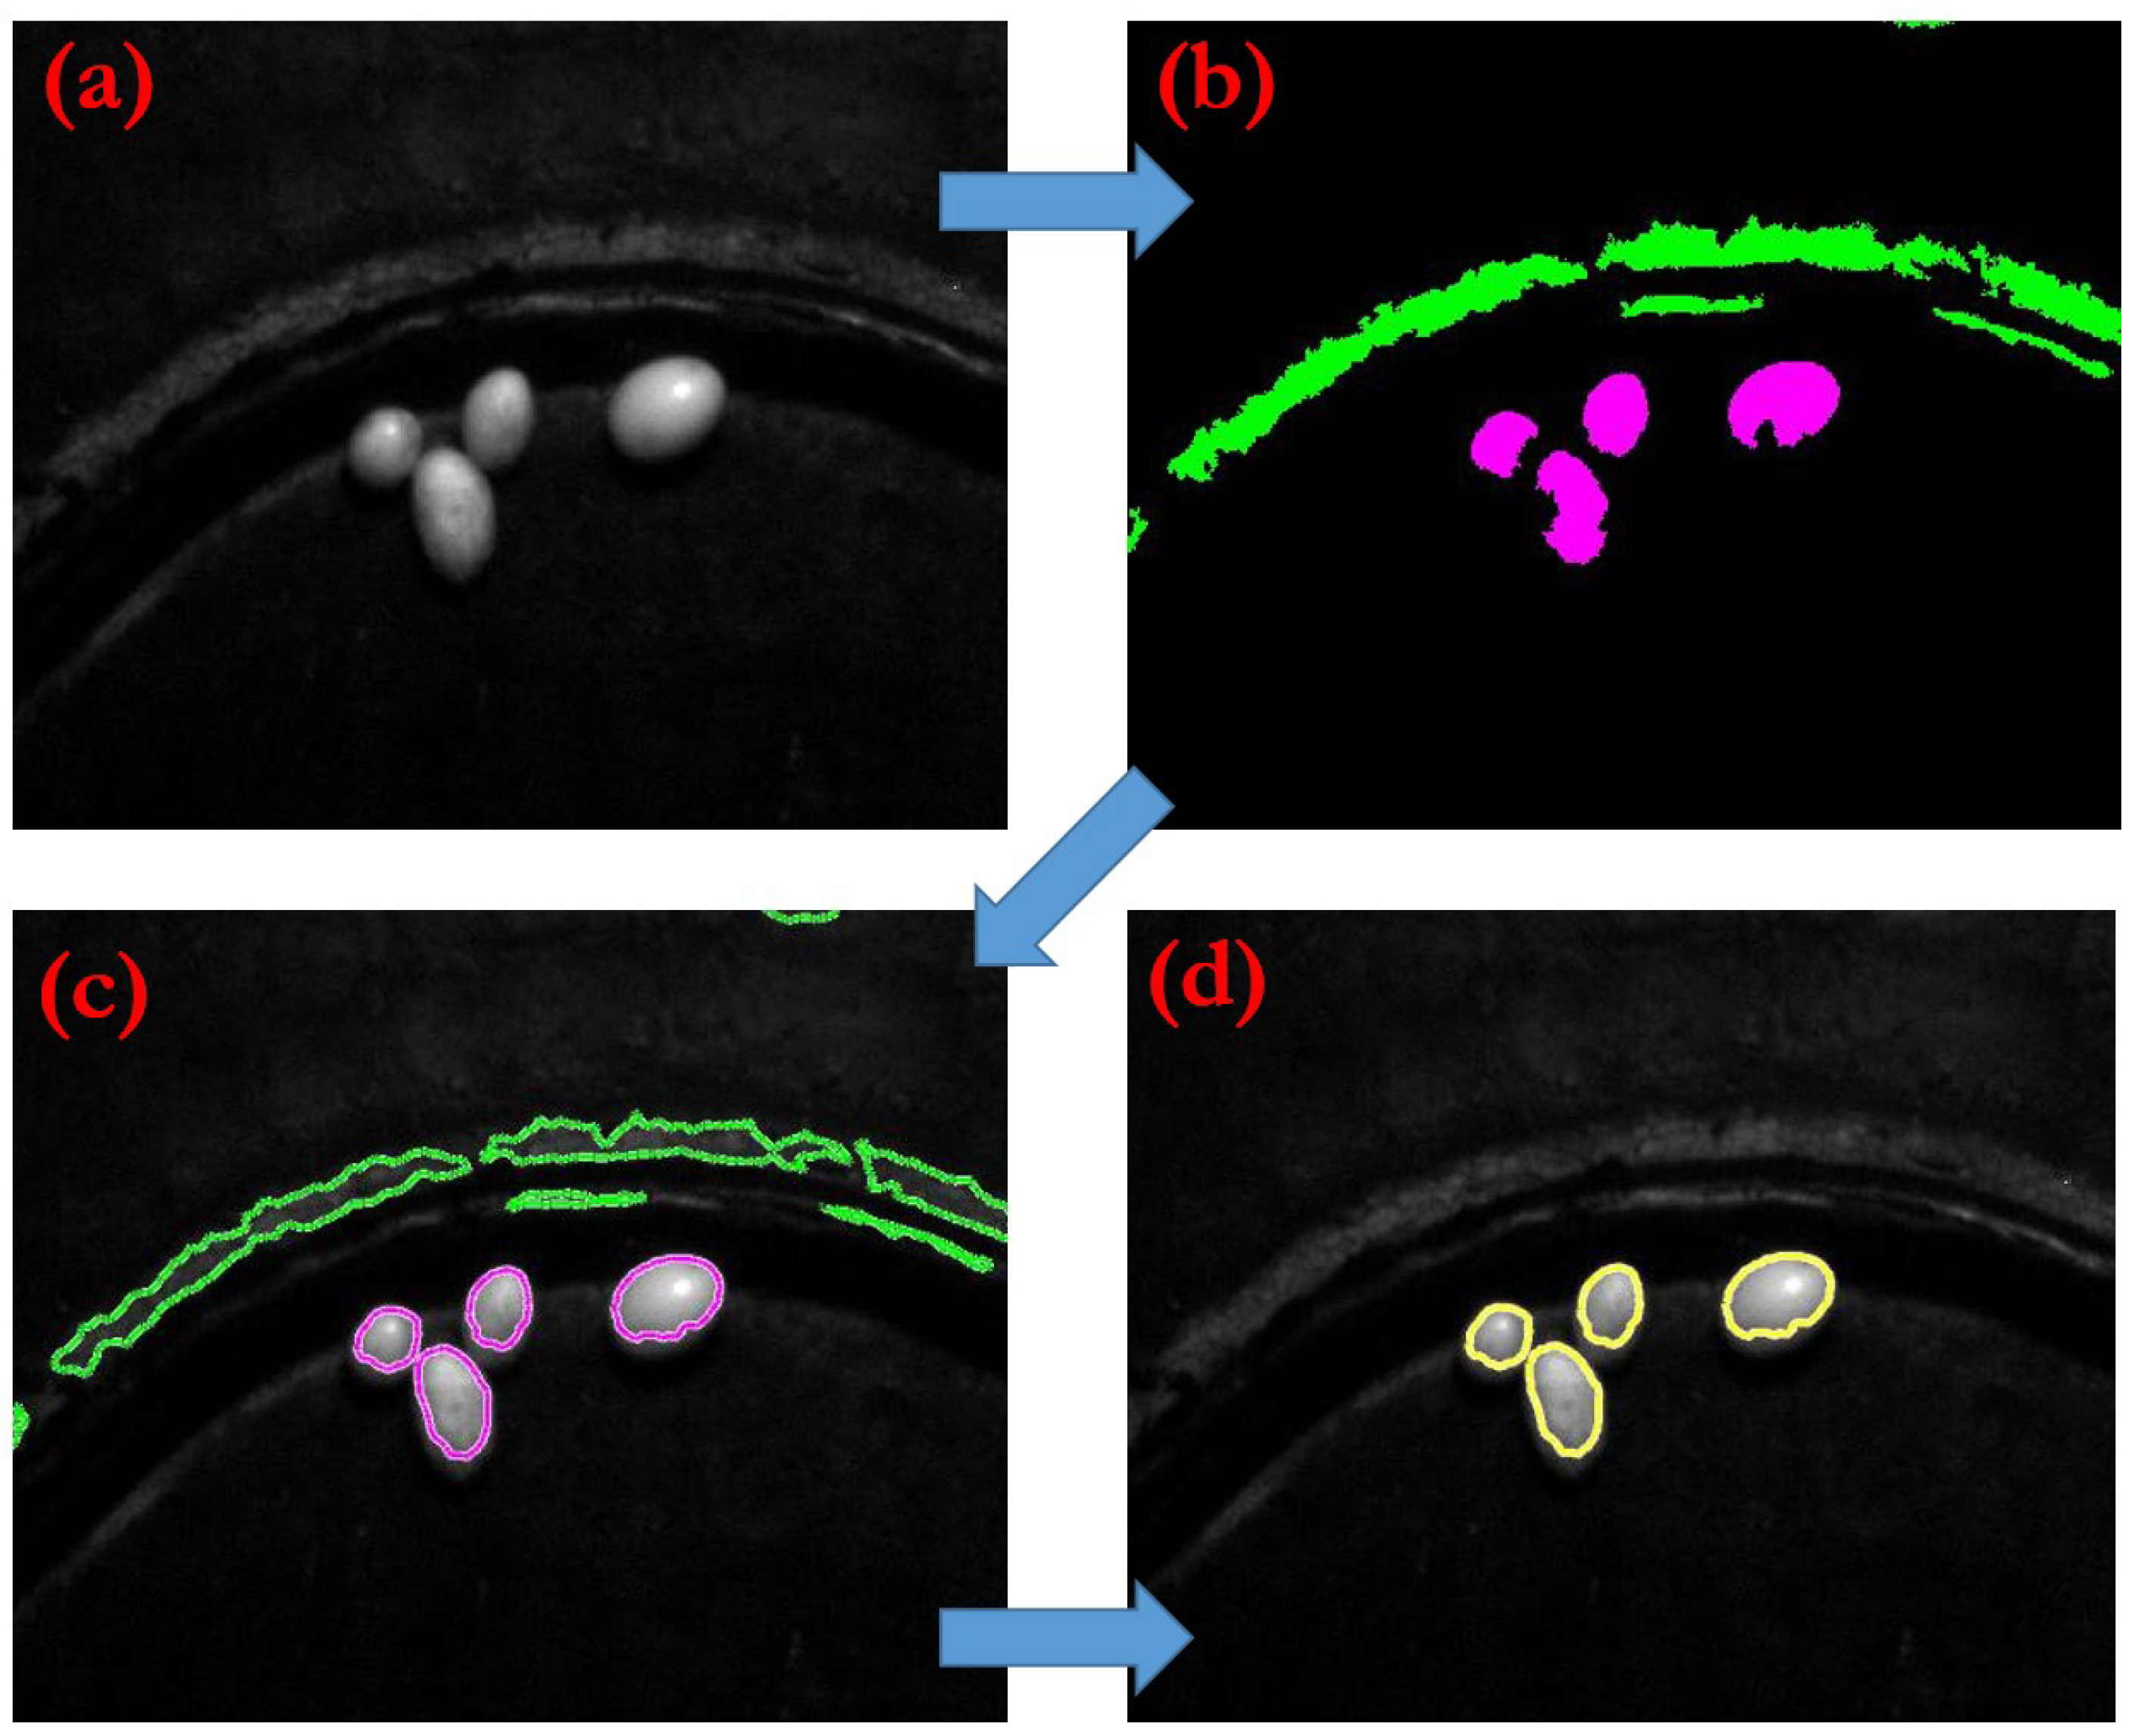
Figure 4 shows an example of the image processing obtained in each of the main stages of the method for the detection of the olives, as detailed in
Figure 3.
Figure 4a shows the original infrared image, while
Figure 4b depicts the result of the preprocessing stage, which is the mask to be used for the application of active contours in the different levels. The result of the step 1 segmentation, which employs the global masks, is shown in magenta in
Figure 4c. As can be seen, the contours of the olives are perfectly defined although three of these olives are very close together. The result of the step 2 segmentation, which uses the adaptive masks, is shown in green in
Figure 4c. In this case, the mask detects the protrusions of the conveyor and the active contours adapt themselves to these masks. The final result of the composition of both contours, including the decision whether each region should be considered valid, is shown in
Figure 4d. This decision is based on the elongation of the contour (
), obtained from:
where
y
represent, respectively, the height and the width of the minimum bounding box of the contour.
2.2.2. Detection of Defects
The detection of defects is based on an iterative process that sequentially applies the segmentation algorithms previously presented (Kapur and Bernsen) to each of the olive contours found in the previous step.
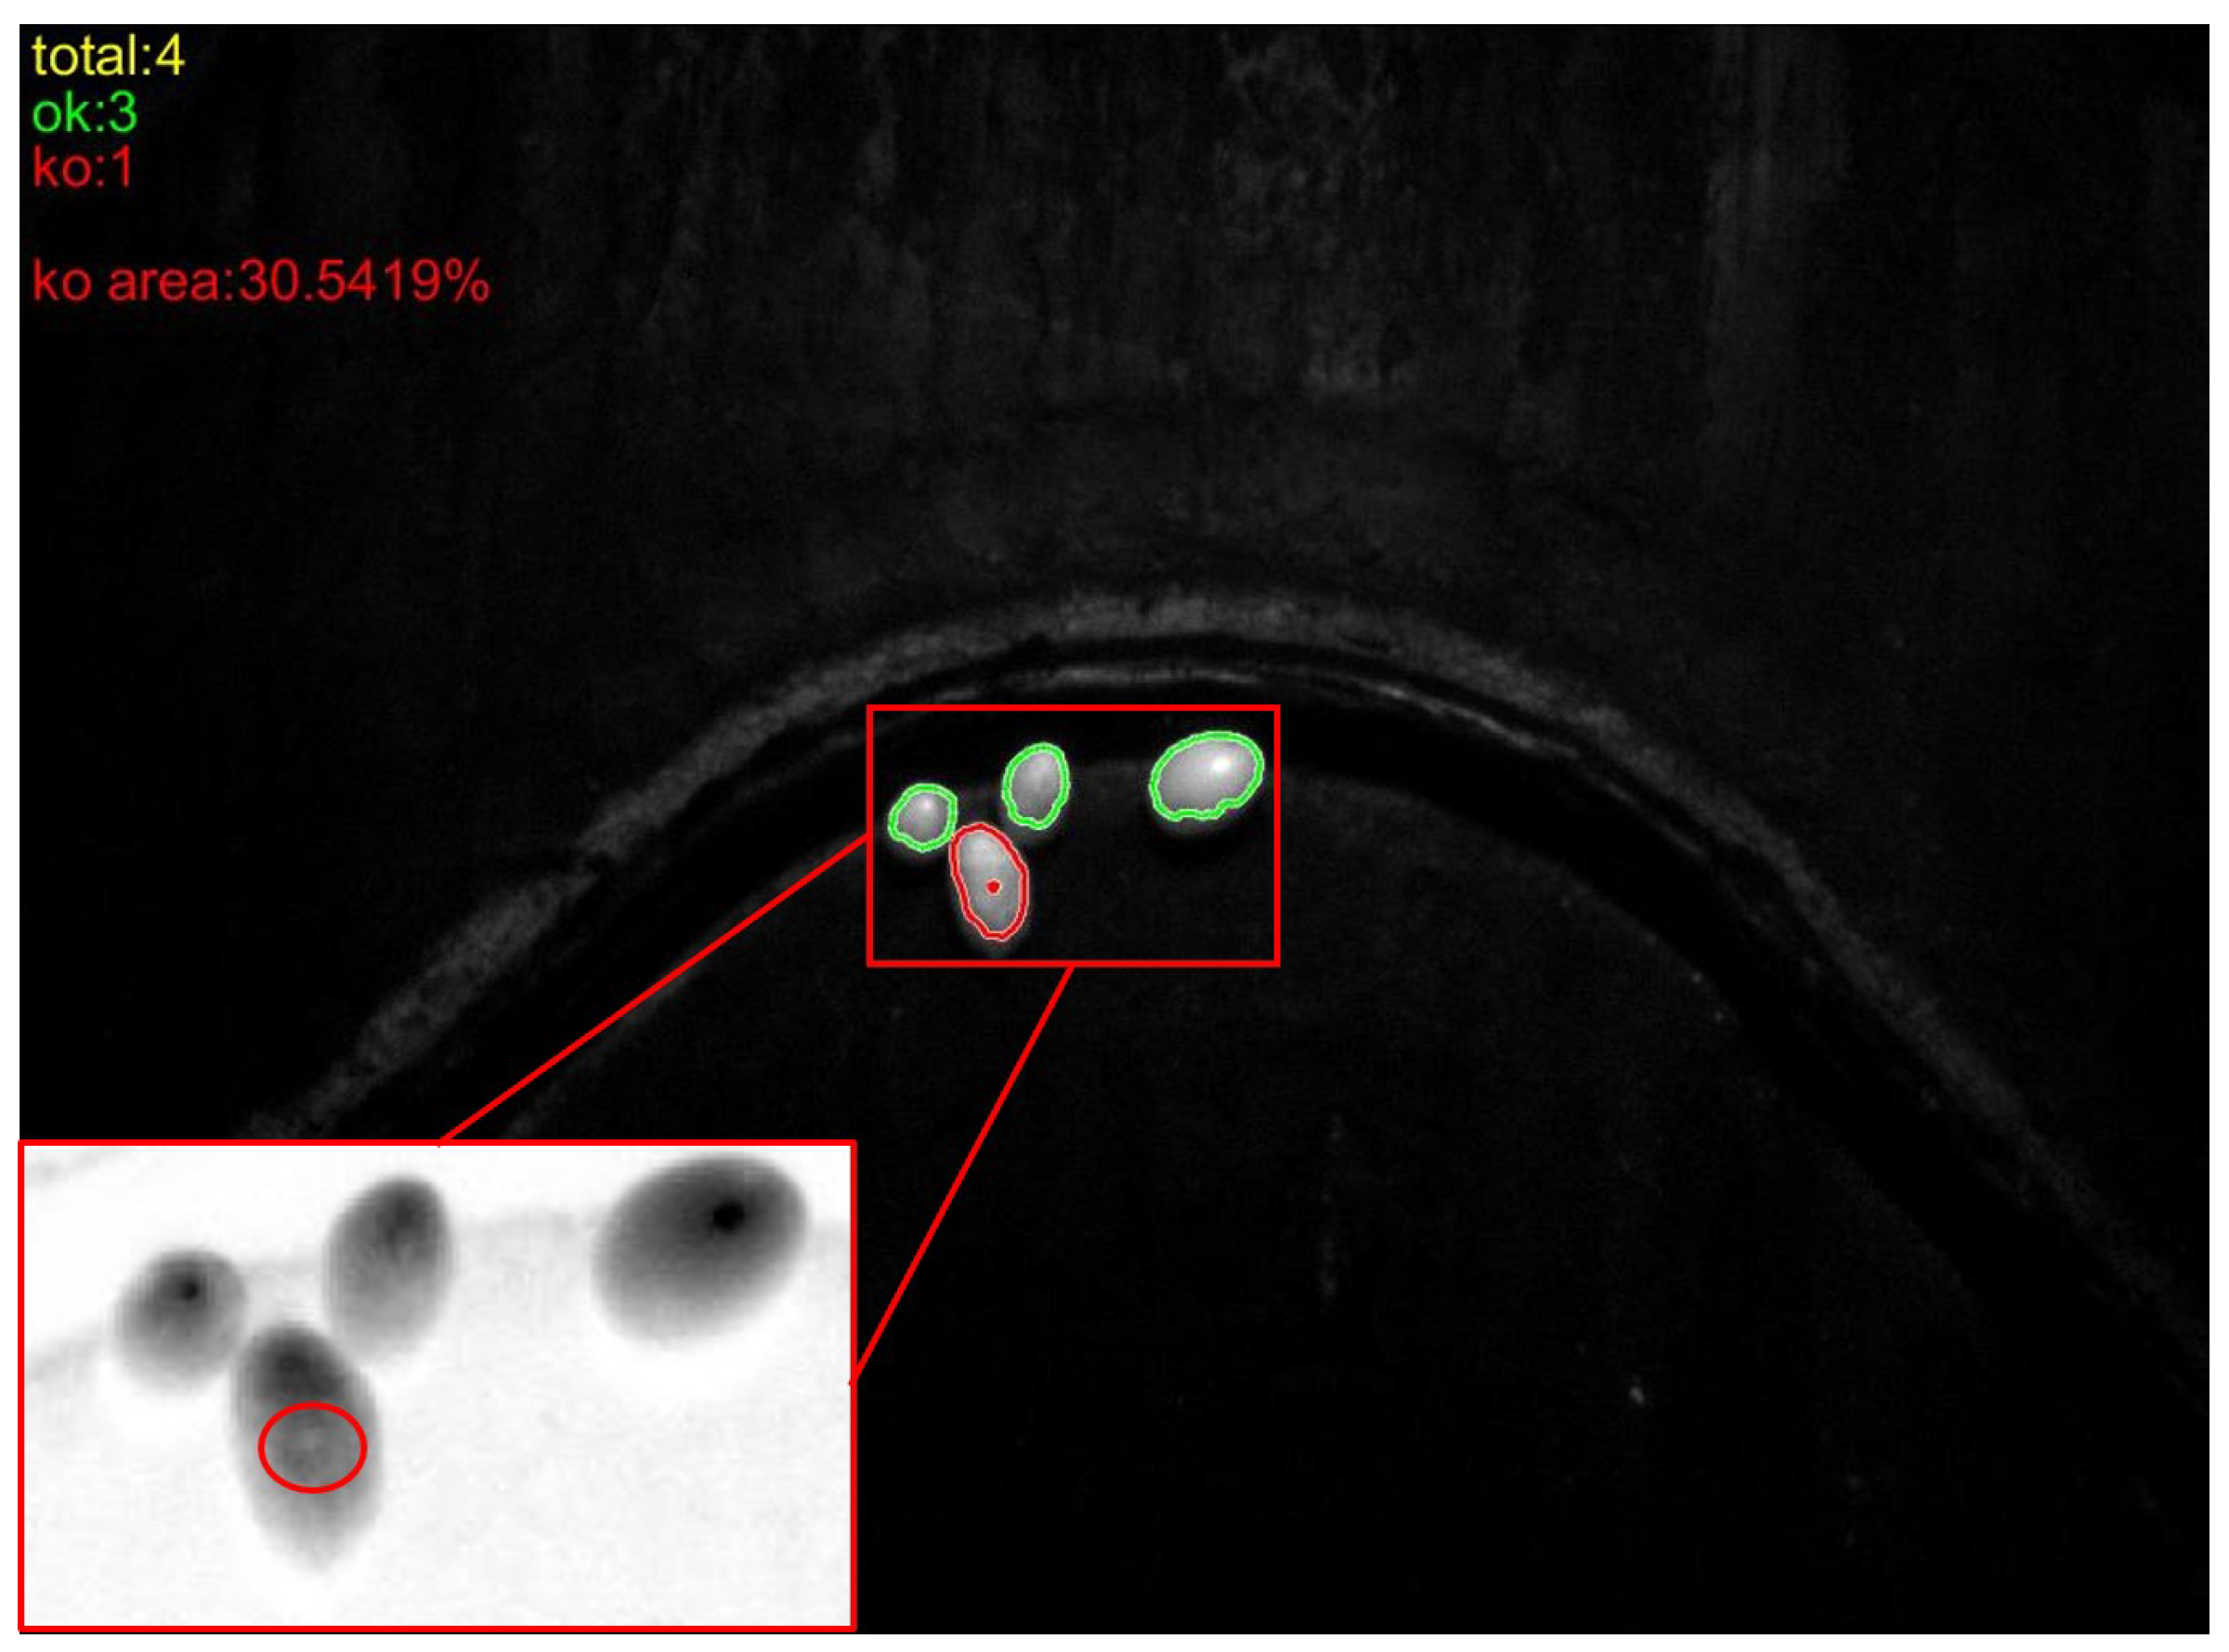
Figure 5 shows the detection of defects in the image previously used to illustrate the detection of olives. In order to avoid glows in the olives and enhance potential defects, a preprocessing step, consisting of the inversion of the pixel intensity values with respect to the maximum possible gray level (255), is required. This way, given an image
I defined in the interval
, the inverted image
is obtained with the operation
. The bottom-left area of
Figure 5 shows the image after this transformation.
The extracted features of the regions obtained after applying the segmentation procedures are area, elongation and circularity (
cir), obtained as:
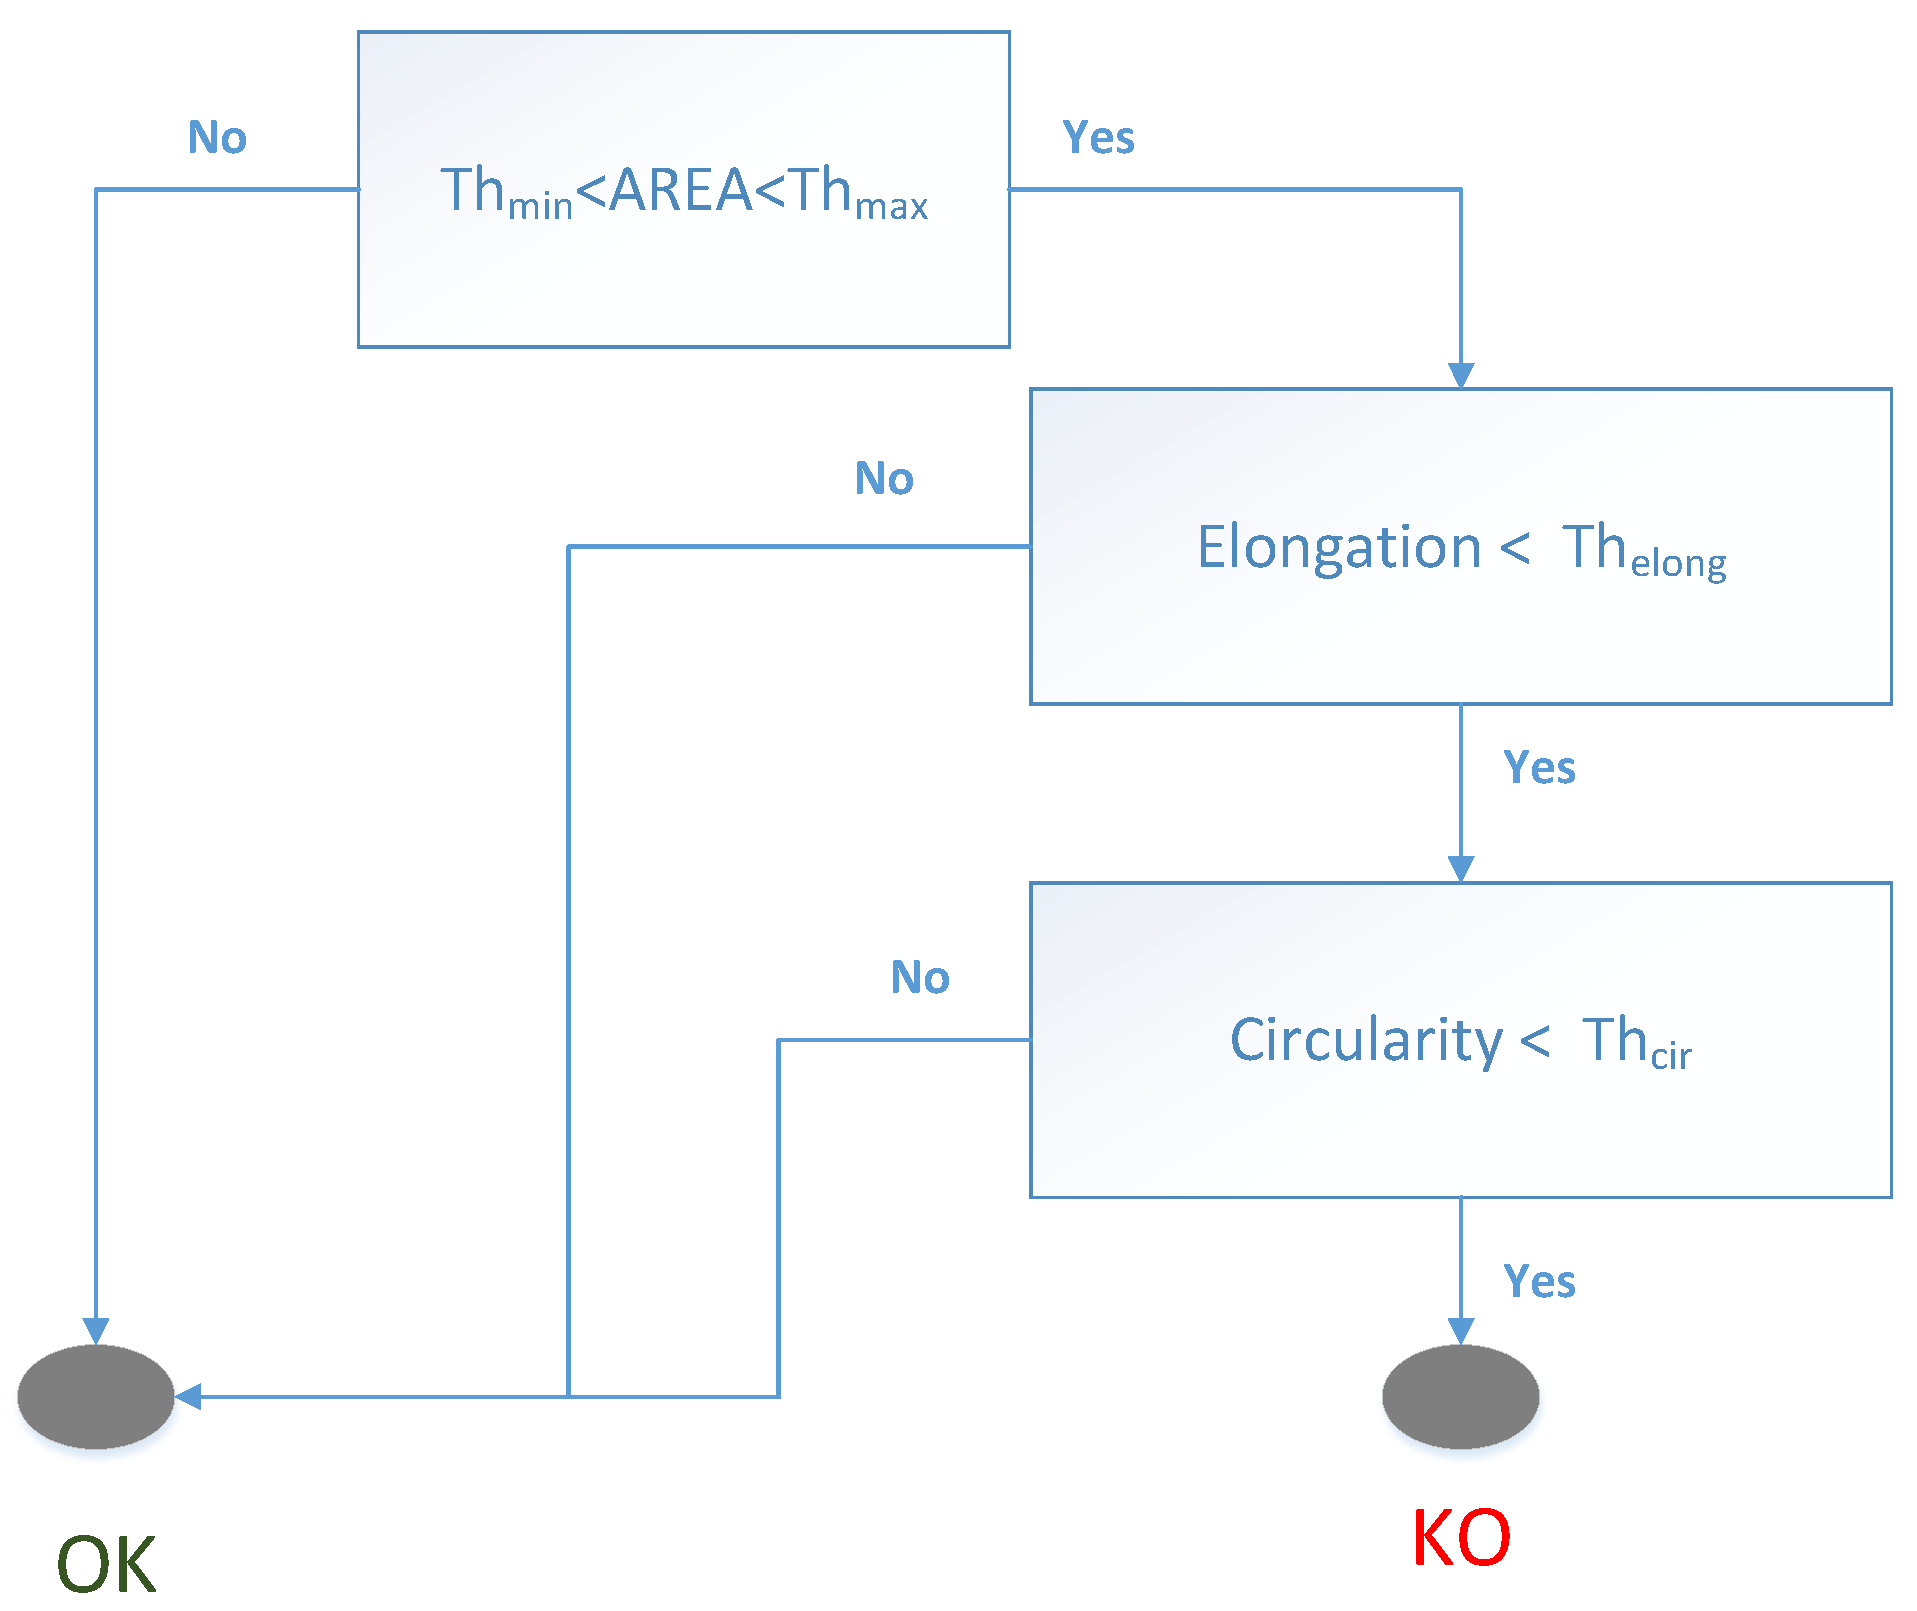
In general, the defects that identify an olive as defective are expected to be small, circular and with a gray level in the inverted image that is larger than the rest of the pixels in the olive surface. With these features, and applying the decision tree of
Figure 6, it is possible to discern between acceptable and defective regions. The area, elongation and circularity thresholds have been set heuristically after the analysis of the
of the images acquired the first day. The elongation and circularity, since they are rations, are quite insensitive to small variations in the distance between the camera and the conveyor, which might affect the spatial resolution of the system. The area, on the other hand, is directly impacted by these variations. However, the design of the chamber includes a holder for the camera that prevents its movement. The installation of the system at a different distance from the conveyor would require a recalibration of the system and the definition of new thresholds. An olive is considered acceptable if there is no defective area in its contour.
Figure 5 shows the result of the classification where only one defective olive is found.
In addition, the percentage of defective olives is also given and it is obtained from:
3. Results and Discussion
In this section, the details of the image processing algorithm performance, along with their discussion, are presented in two parts. In the first part, the evaluation procedure designed for the image processing algorithm is described. In the second part, the results of the inspections using the former procedure on images acquired during the 2020–2021 harvest period are presented and analysed.
3.1. Evaluation Procedure for the Image Processing Algorithm
The image processing goal is to detect the percentage of defective olives from the images acquired using the infrared camera (Nano M2590-NIR) placed over the conveyor belt after the washing stage. For this, olives are segmented and then every segmented region is independently processed in order to extract defects.
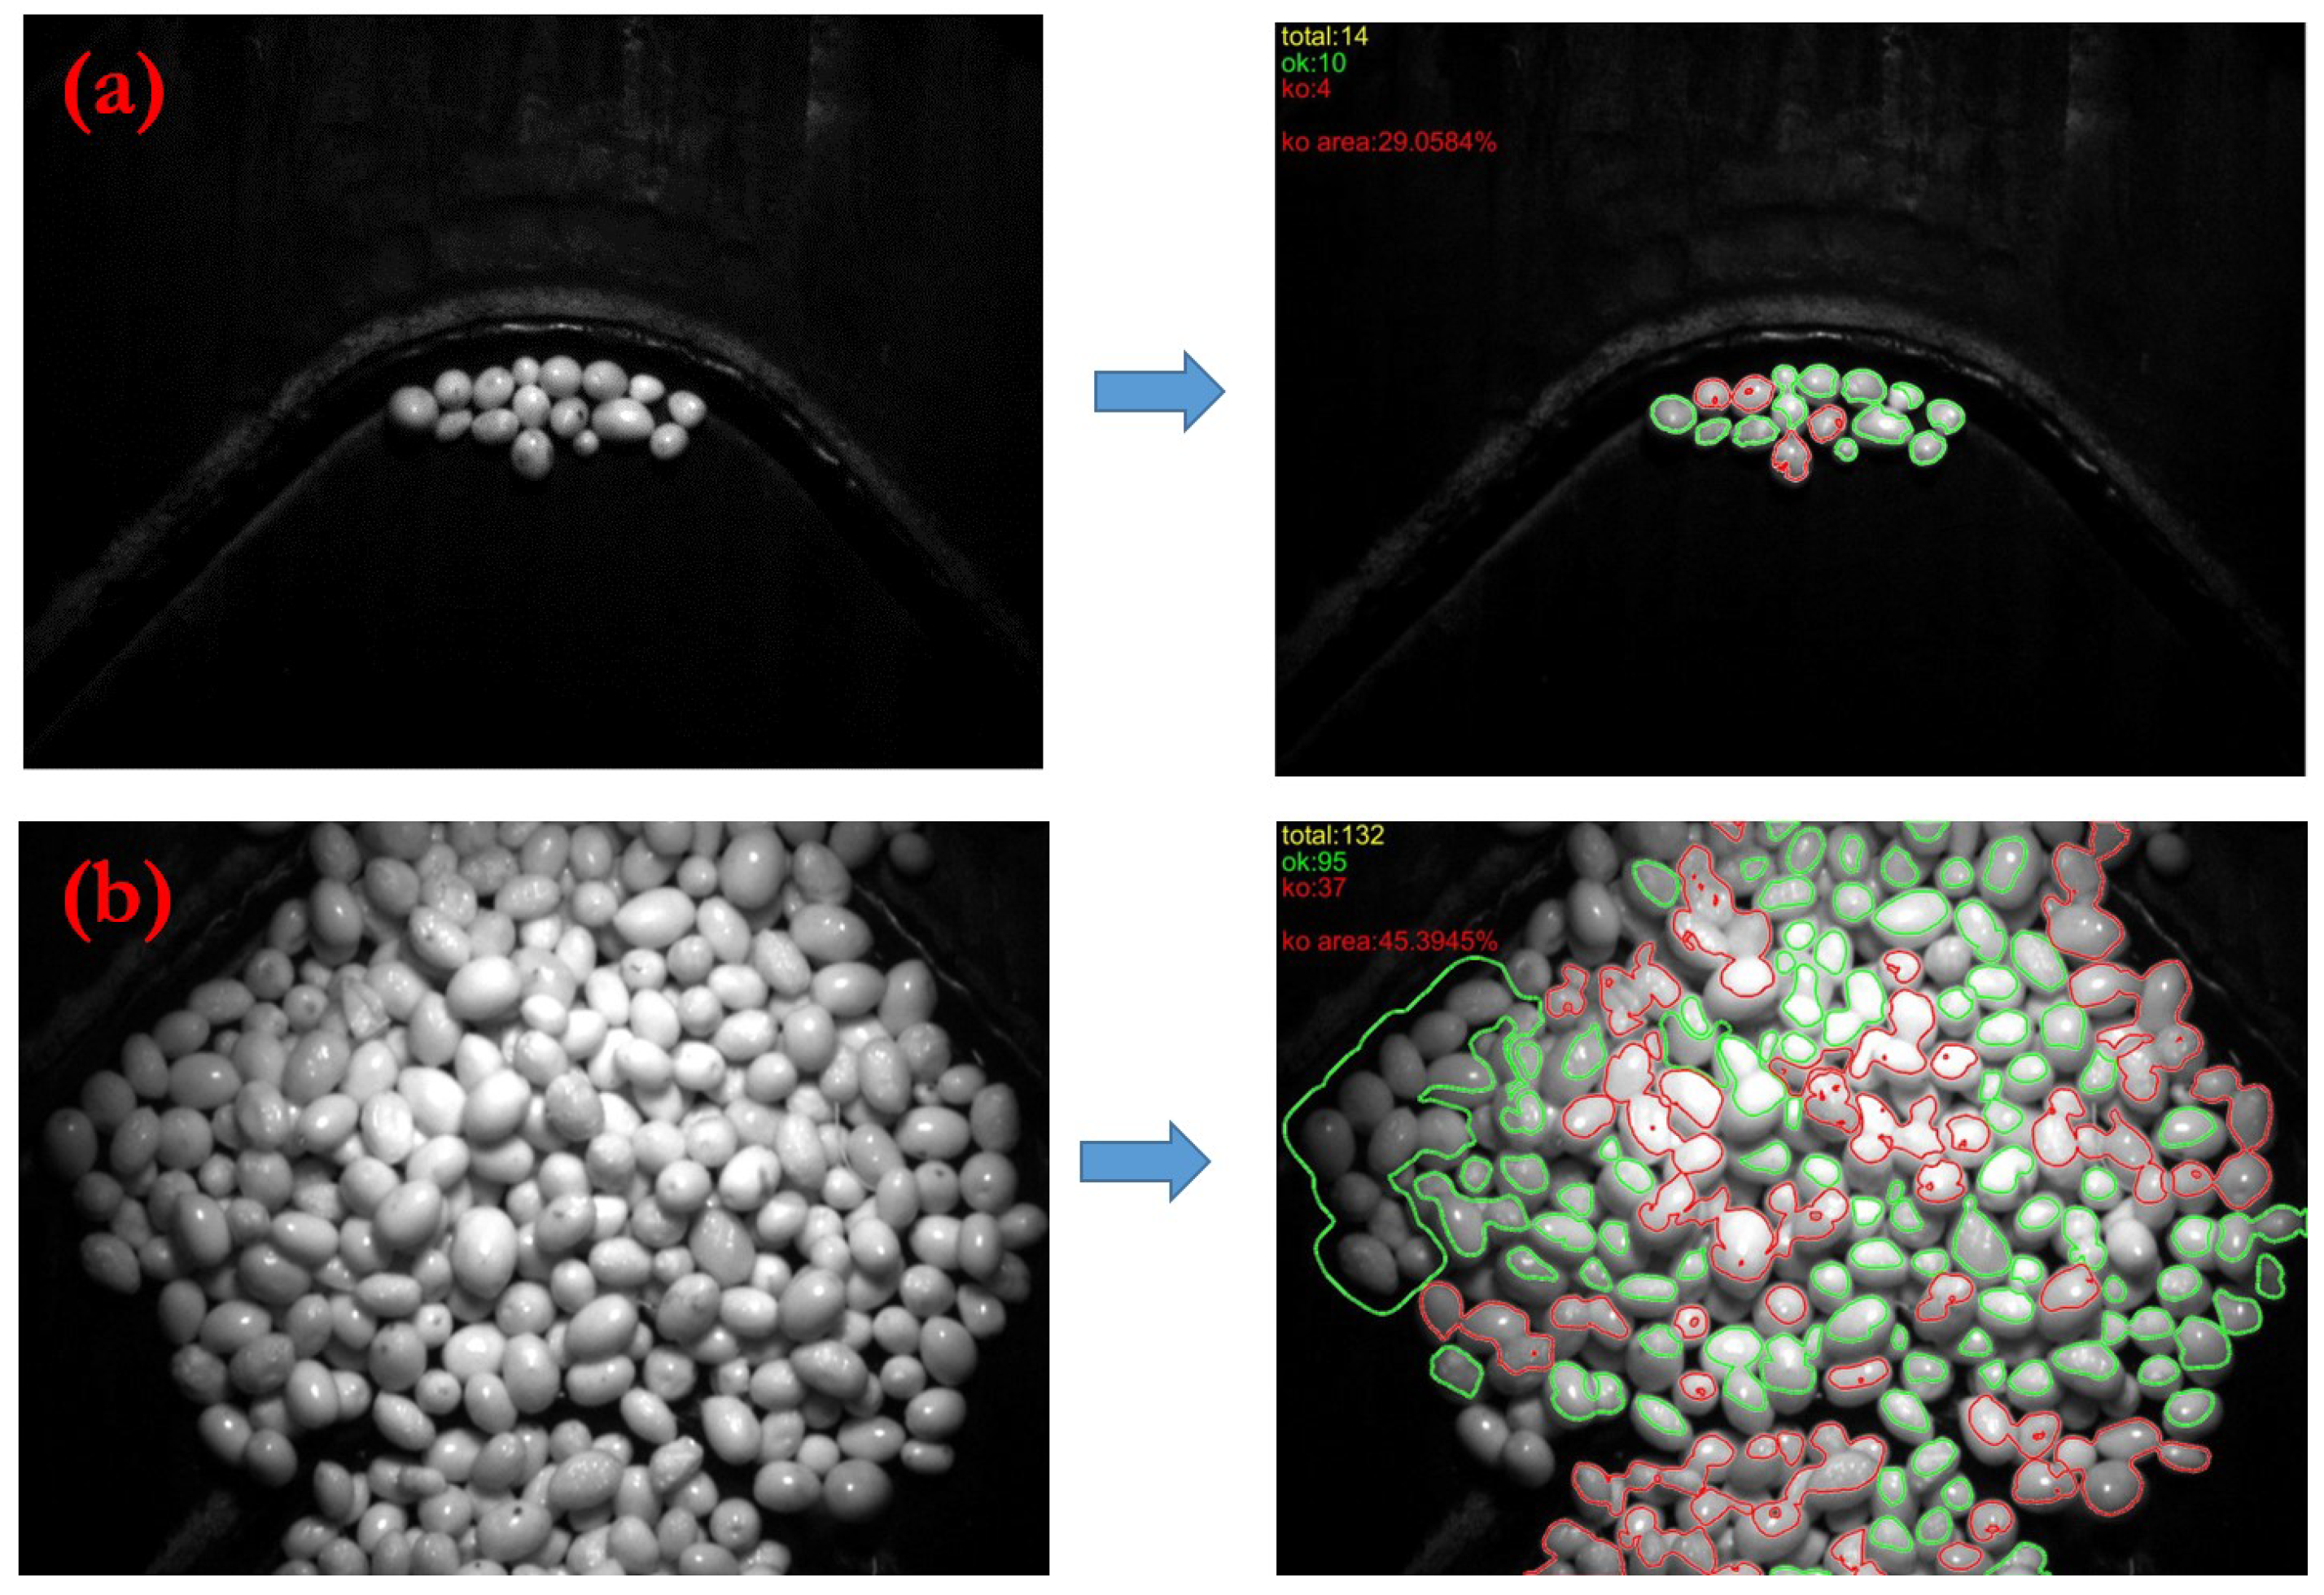
Figure 7 and
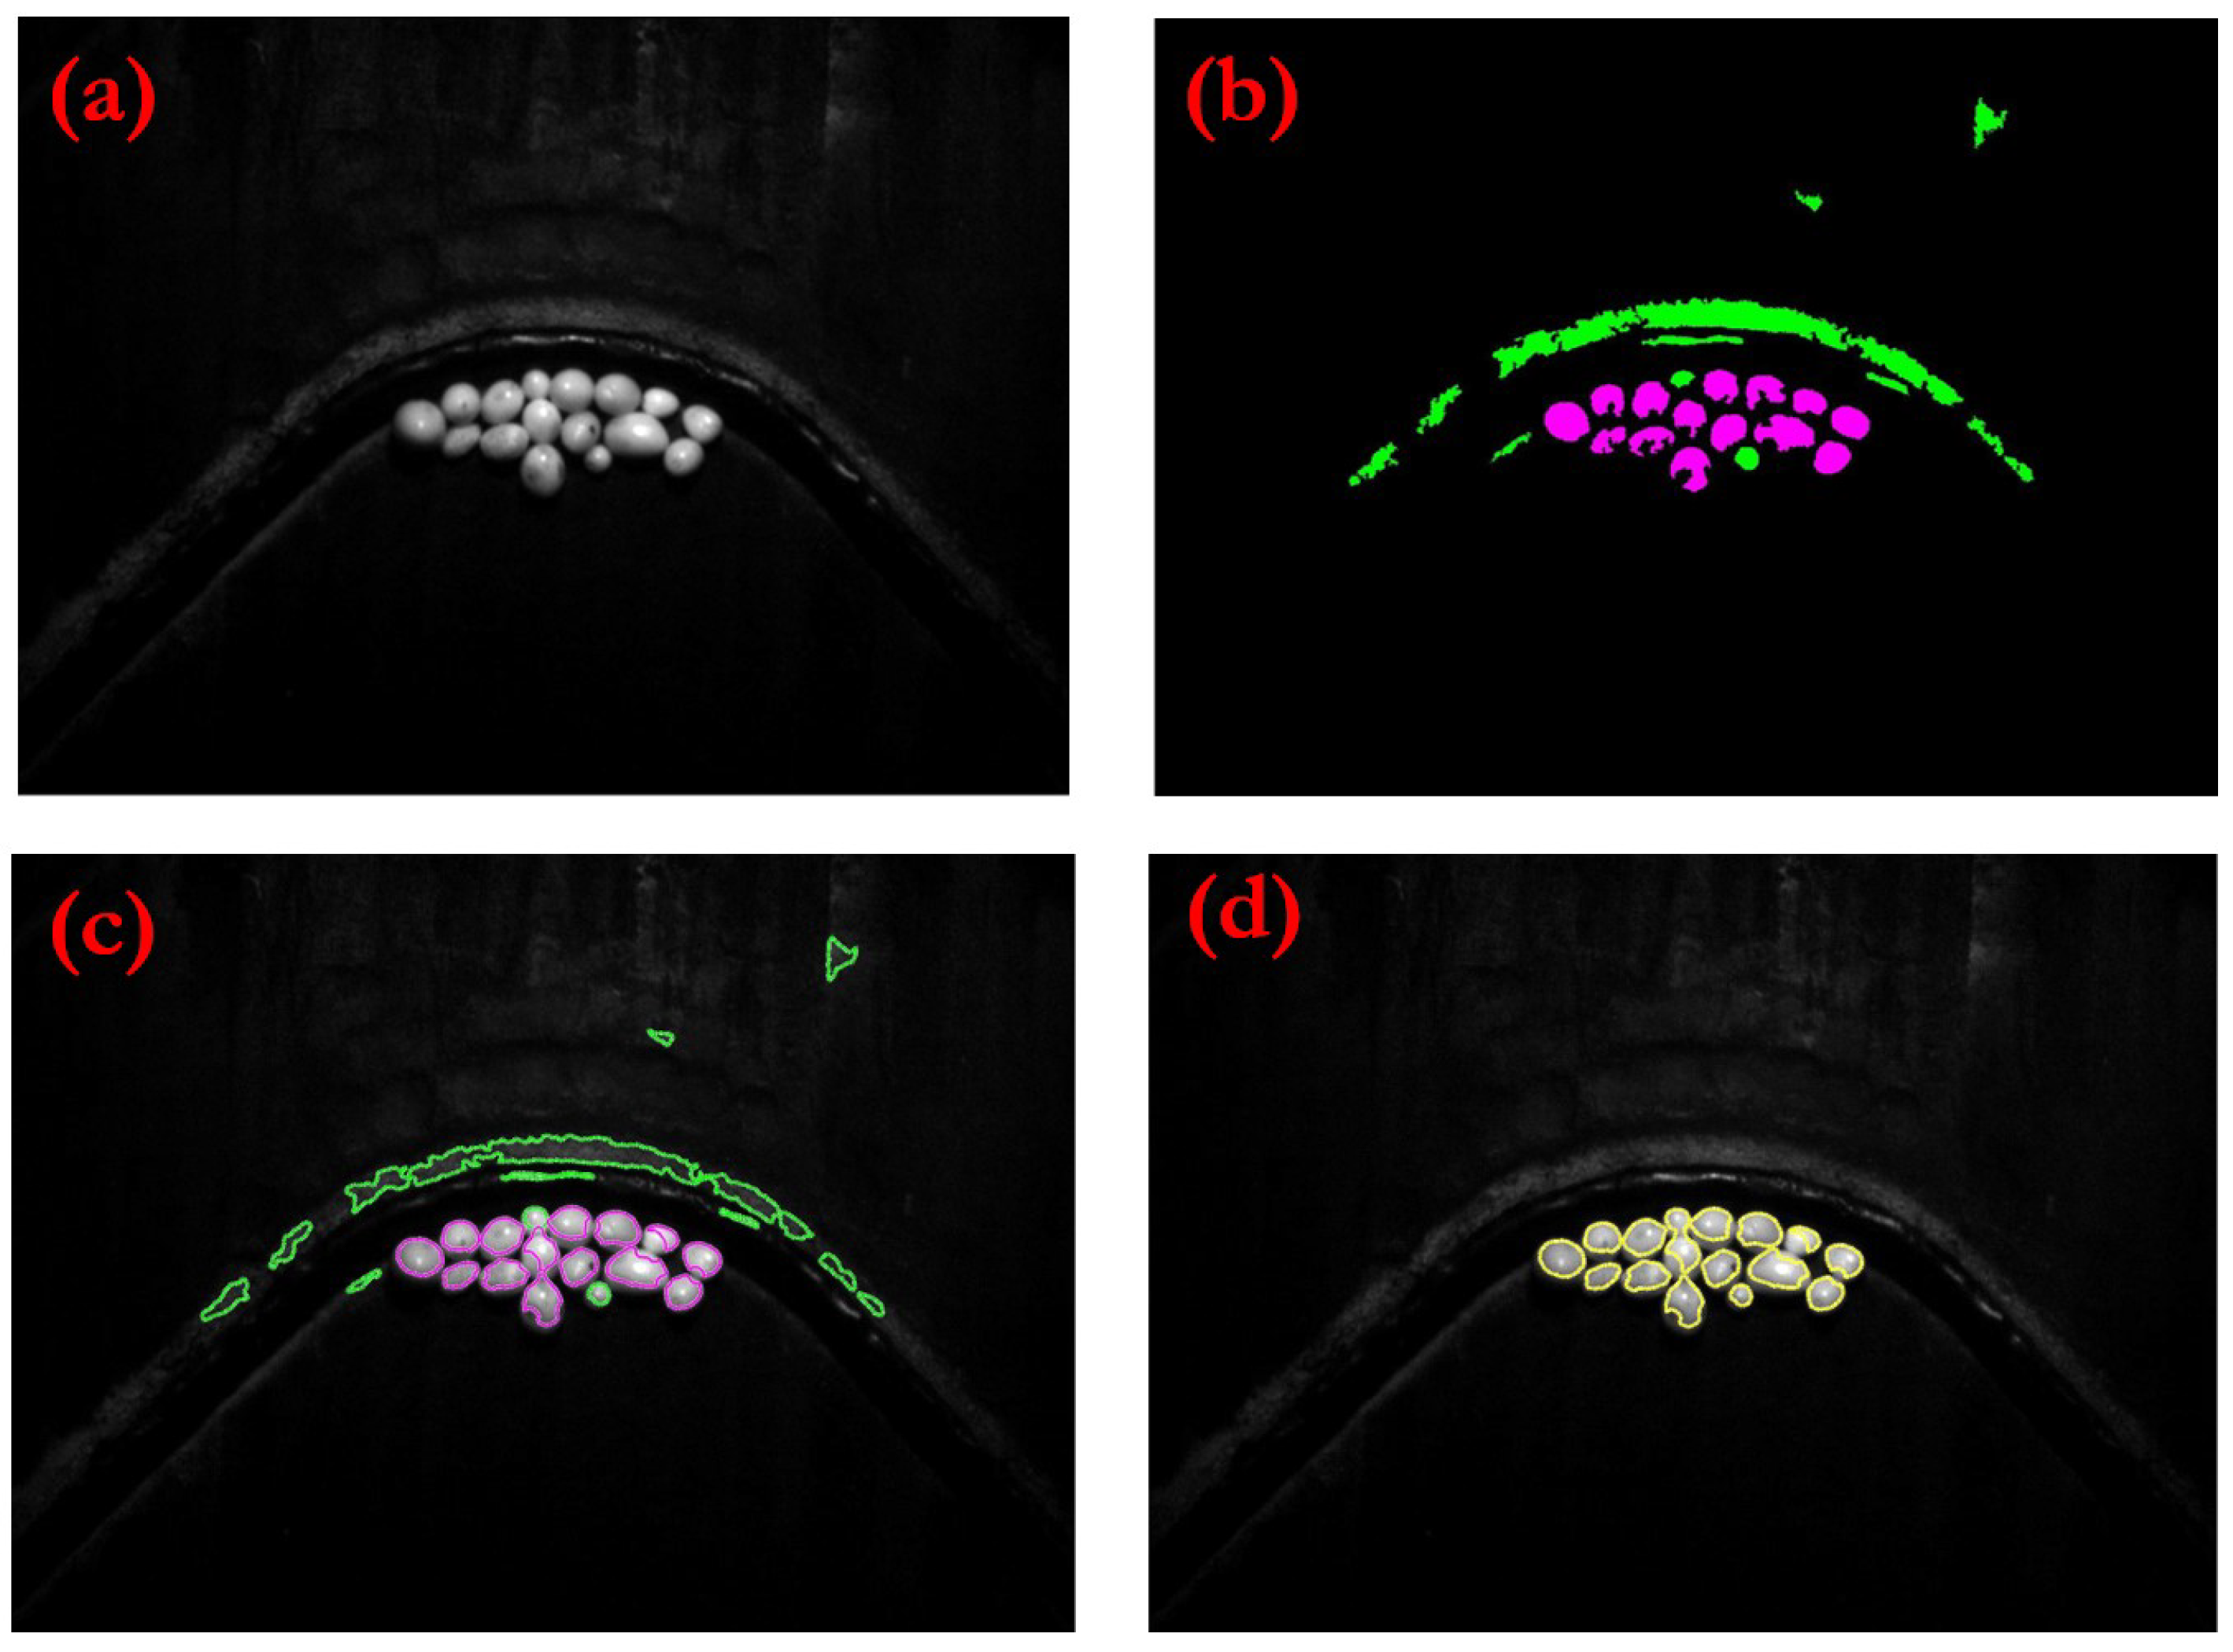
Figure 8 show the results of the olive segmentation step for two different types of images. As can be seen, the quantity of olives on the conveyor belt has an influence in the segmentation results. When the conveyor is not completely full (
Figure 7a) olives are successfully extracted even though they touch each other. The application of the two segmentations steps presented in the previous Section manages to extract all the fruits, along with part of the conveyor belt (
Figure 7b,c). The regions that belong to the conveyor belt have a significantly different shape than those from the fruits. These regions can be removed from the final result using the region elongation as decision feature, (
Figure 7d).
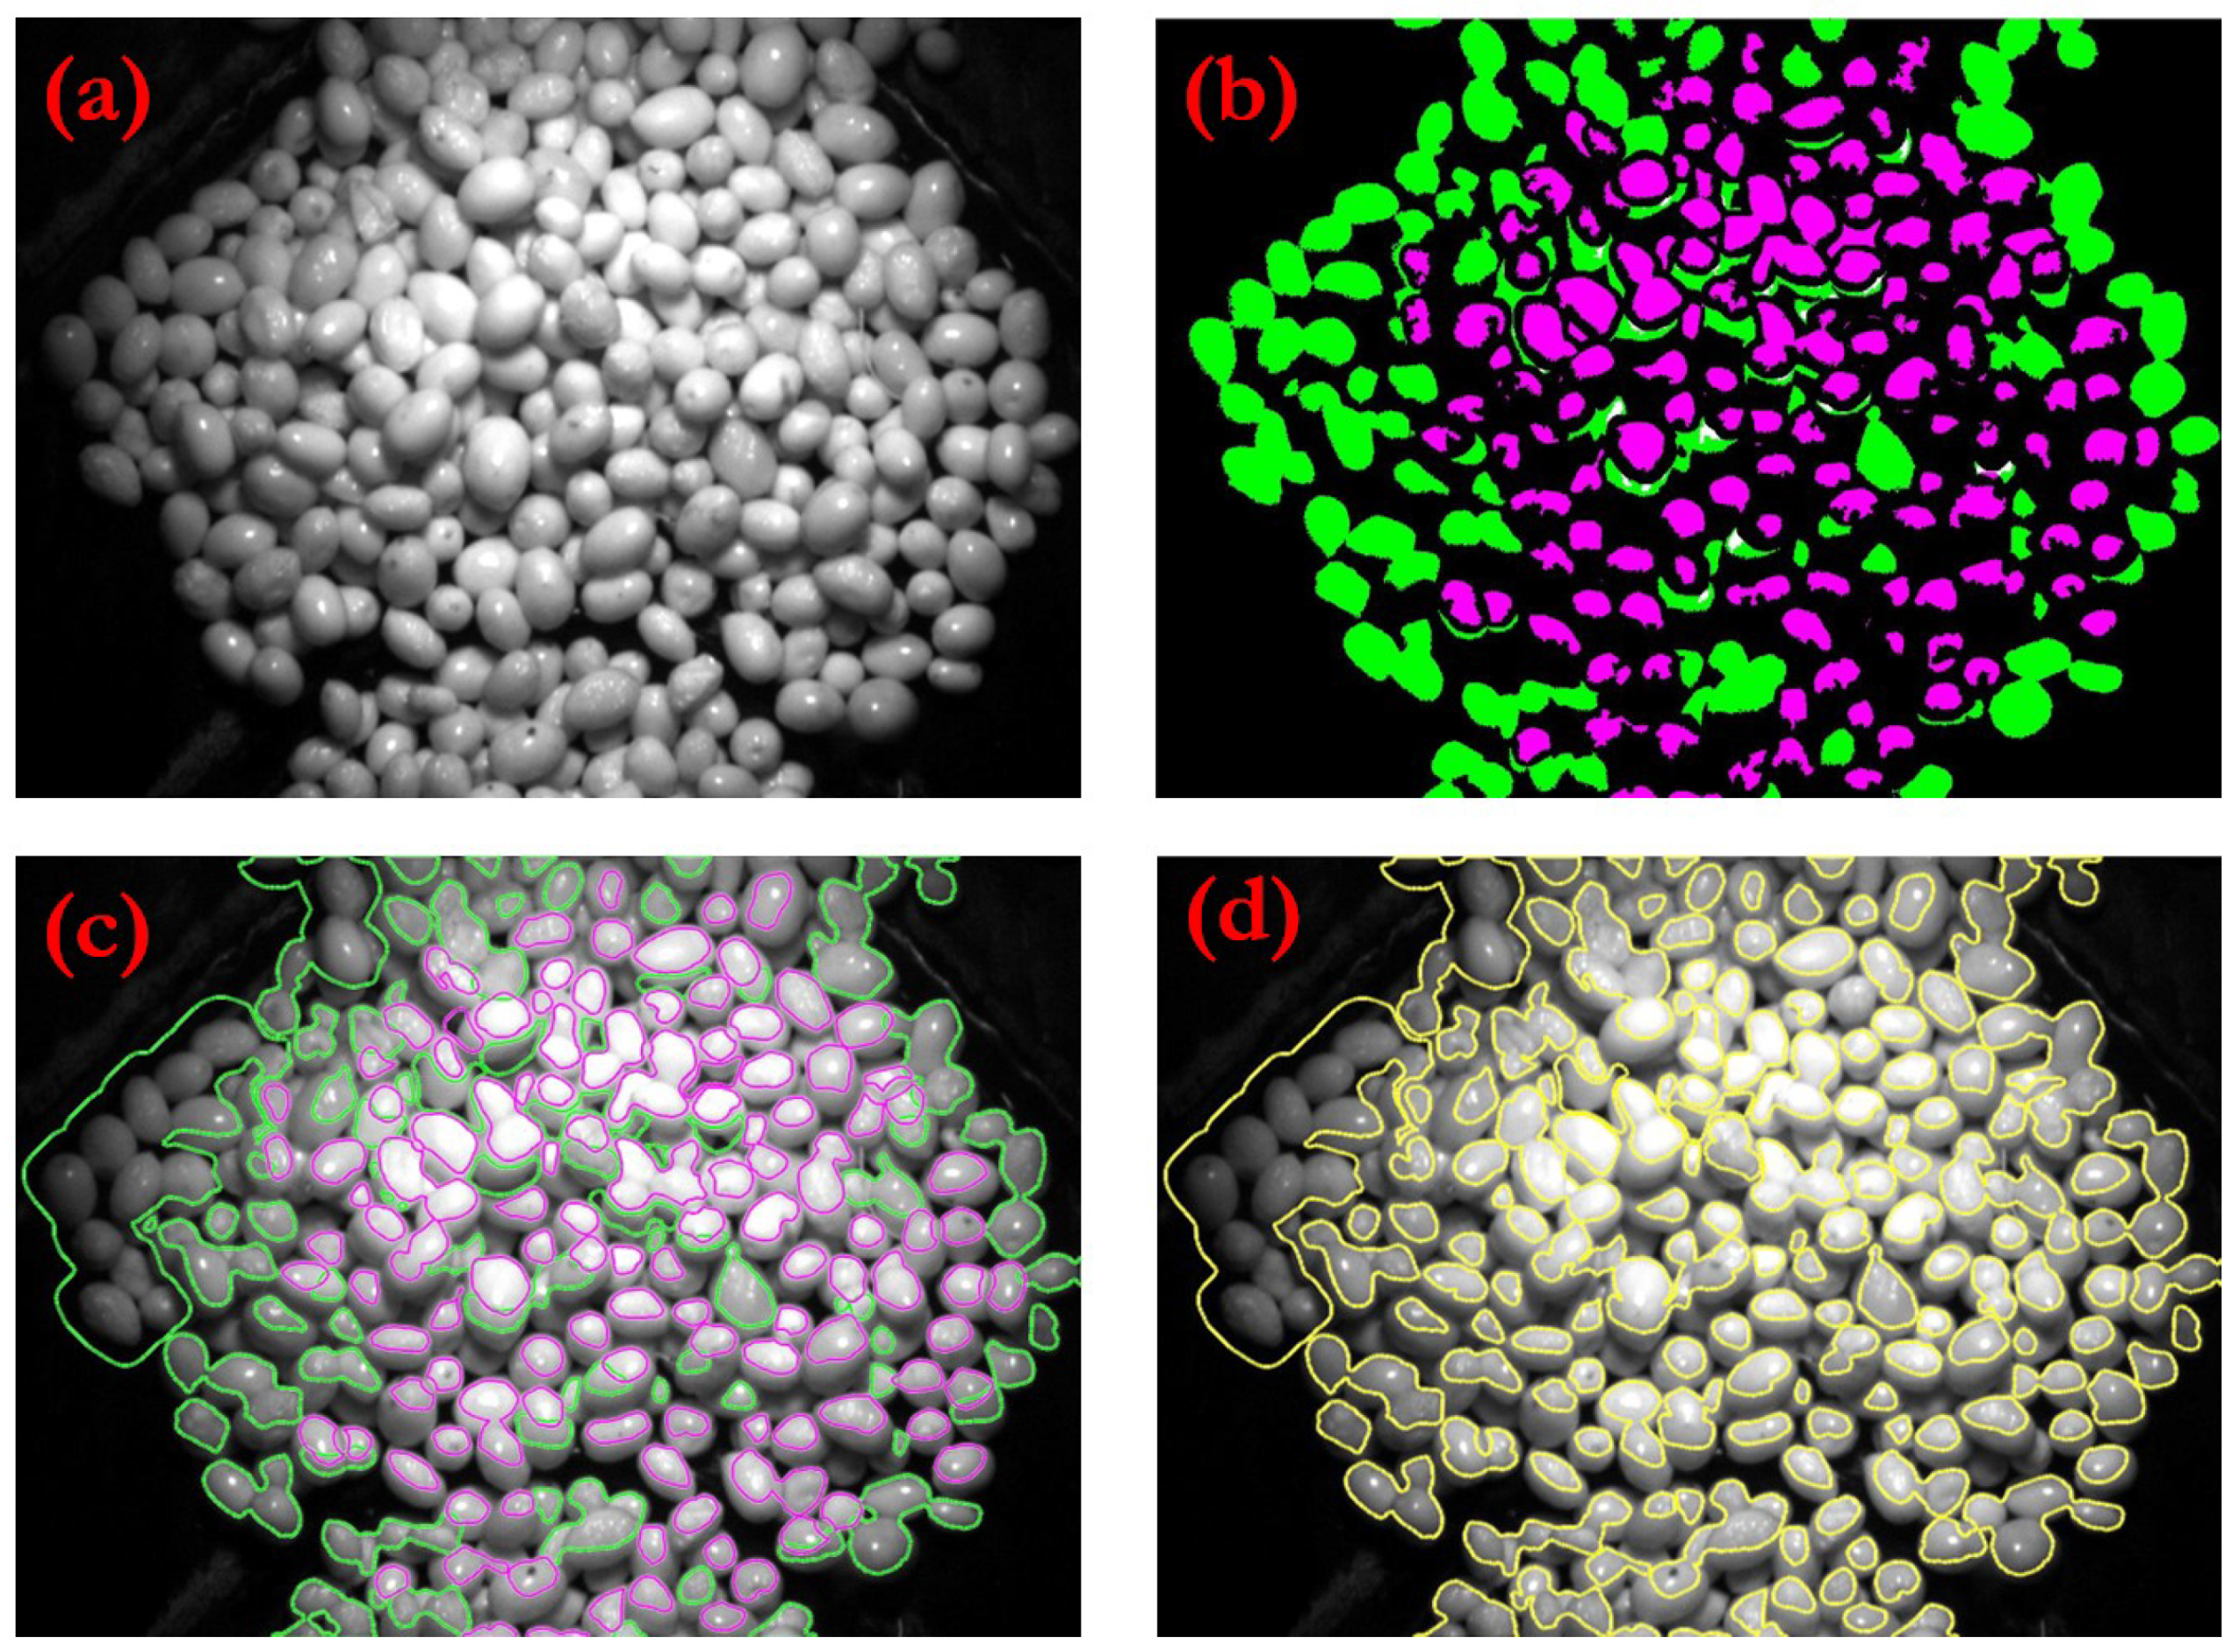
When the conveyor belt is completely full, some fruits are included in the same region (
Figure 8d). This issue mainly occurs when the image is not properly lighted (left side of the conveyor belt) or when there is too much overlap among fruits. Despite this drawback, most of the fruits can be analysed, as they are extracted from the background.
Figure 8b shows the preprocessing stage, while
Figure 8c depicts the result of the two level segmentation process.
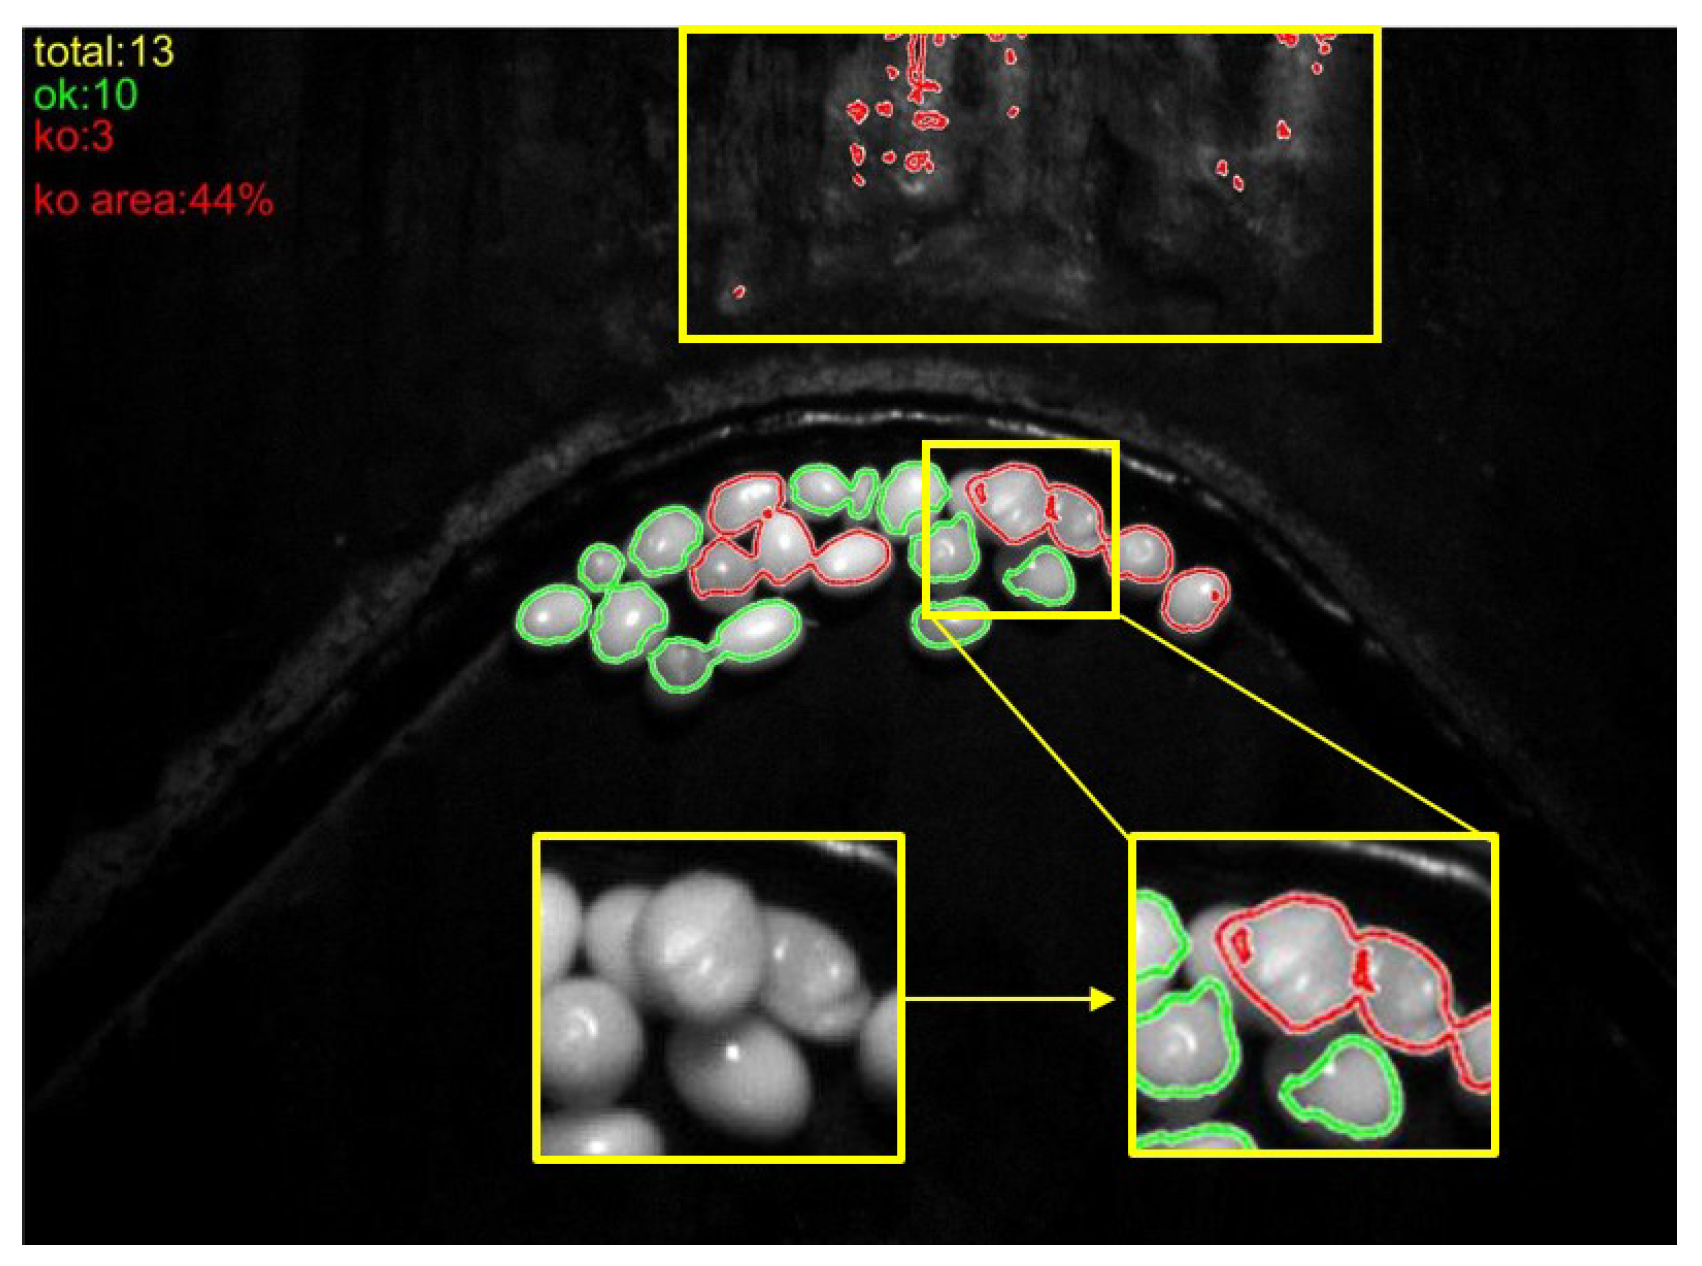
The results of the olive inspection procedure for the former examples are shown in
Figure 9. The regions extracted from the segmented olives are labelled as defective or non-defective by the classification algorithm detailed in
Figure 6. A segmented olive is labelled as defective when at least one region inside it is detected as defective.
In order to assess the algorithm performance, a set of five images per day were manually labelled, using a graphic editor, with the oil mill expert assistance.
Figure 10 shows an example of these images that were utilized as ground-truth. Then, the same set of images were analysed by the image processing algorithm, and the results of region comparisons were categorized and annotated according to the following definitions:
TP (true positive): olives or set of olives labelled and detected as defective.
FN (false negative): olives or set of olives labelled as defective but classified as non-defective.
FP (false positive): olives or set of olives labelled as non-defective but classified as defective.
TN (true negative): olives or set of olives labelled and detected as non-defective.
This way, true positive and false positive rates (TPR, FPR) were computed as:
Thus, the detection rate is given by , while provides the rate of non-defective olives wrongly categorized as defective.
3.2. Results of the Image Processing Algorithm
As mentioned previously, the validity of the image processing algorithm was tested through ground-truth image comparison. The values of the measures proposed to evaluate the algorithm performance are included in
Table 1.
The first data column of the above table shows the harvesting date. An example of three days within the assessed period (from 11 to 26 January 2021) have been chosen for the discussion of the results obtained. In addition, data from the whole period is also presented. The second column classifies images, according the number of olives or set of olives extracted from the background, into the three following levels: low, medium and high. Images containing a number of regions below 30 are labelled as low, whereas the number of regions is between 30 and 100 are considered as medium; finally, if the number of regions included in an image is more than 100, this image is labelled as high. The last two columns give the detection rate (TPR) and the olives wrongly classified (FPR). In all cases, TPR and FPR rates are the average of the set of images analysed by the expert in the corresponding harvest date (5 images per day).
As expected, the quantity of fruits on the conveyor belt has an influence on the algorithm performance. Detection rate is always higher for images labelled as low, while there is no significant difference between images designated as medium or high. The TPR is more reliable if olives are not overlapped, as the whole fruit can be analysed.
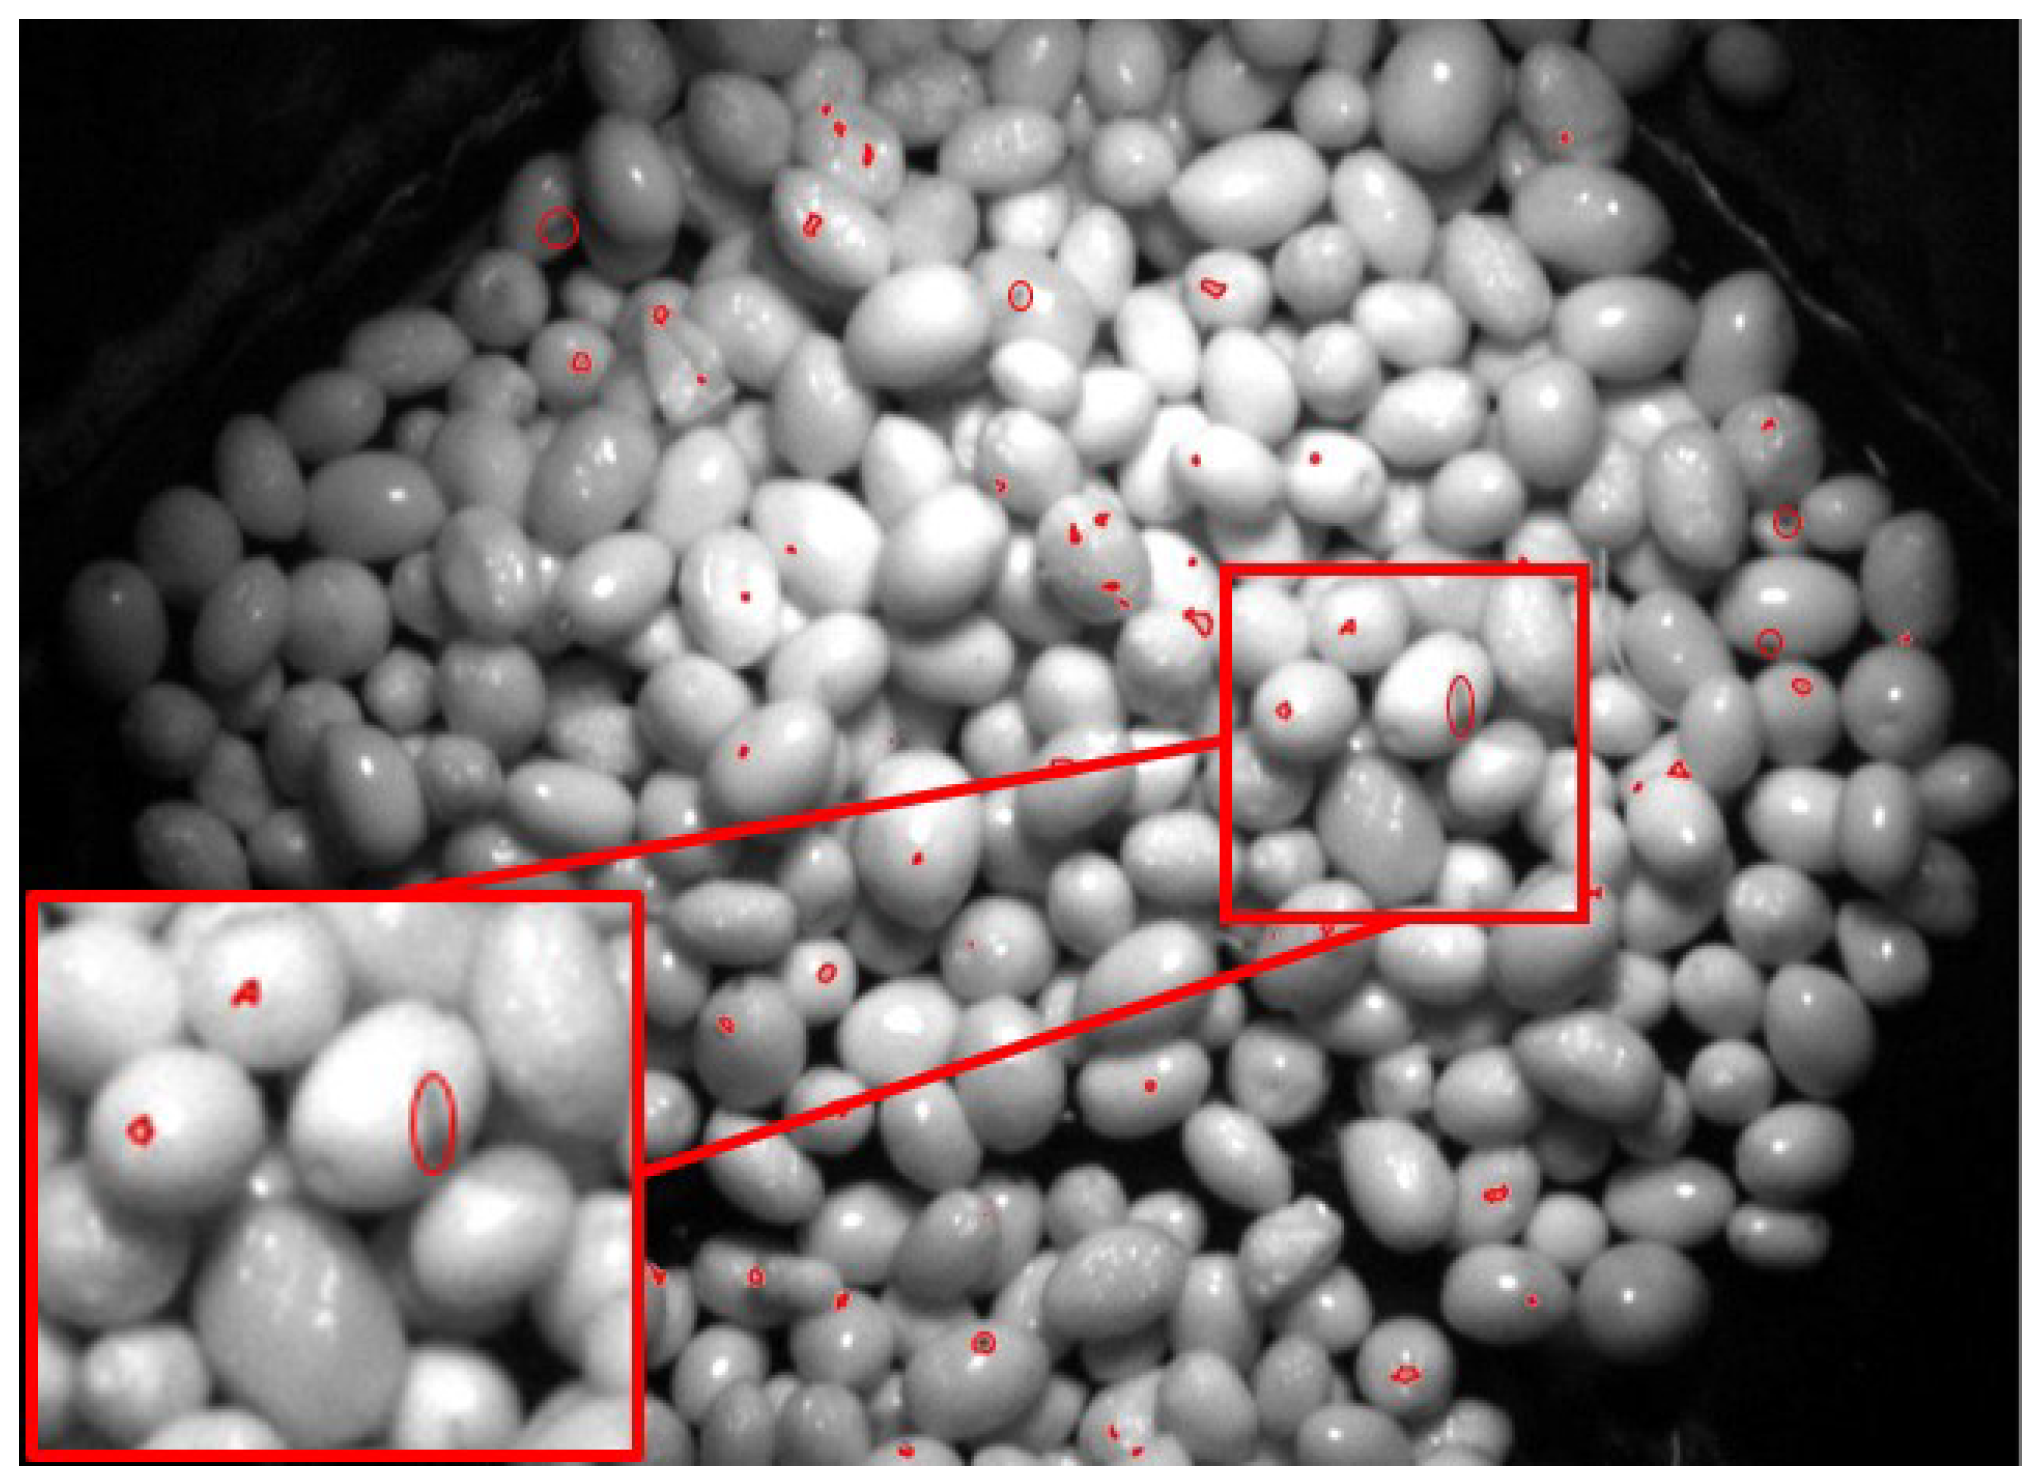
Olives can also be wrongly classified if several of them are included in the same region and disturbances, such as the olive edge or part of the background visible among them, appear. This issue increases the number of FP, i.e., olives labelled as non-defective but classified as defective, which has a direct correlation with the FPR. Images labelled as medium or high are more likely to suffer this effect, but it can also occur in images labelled as low. An example of this is shown in
Table 1. In both harvesting dates, 15 and 26 of January, the FPR for images considered as low is slightly higher than those labelled as high.
The conveyor belt can also be a source of mistakes, and images considered as low are prone to this type of error.
Figure 11 shows an example of these two types of false positive sources: the conveyor belt and the overlap among several olives, both labelled as defects.
The final assessment of the image processing algorithm was done analysing a total of 80 images. As shown in the last row of the
Table 1, the TPR was
and the FPR was
. The detection rate is expected to be higher than what is achieved in a manual inspection, since the current inspection process is performed by sampling a subset of olives of each batch, with the frequency of inspection and the number of olives to be inspected based on the oil-mill expert indications. The capacity to analyse the whole batch of incoming olives is already a substantial improvement on the current practice. Although TPR and FPR rates are not yet established for this industrial sector, the results achieved during the assessment are quite close to what it is normally demanded for industrial applications in the automotive sector (
) [
27].
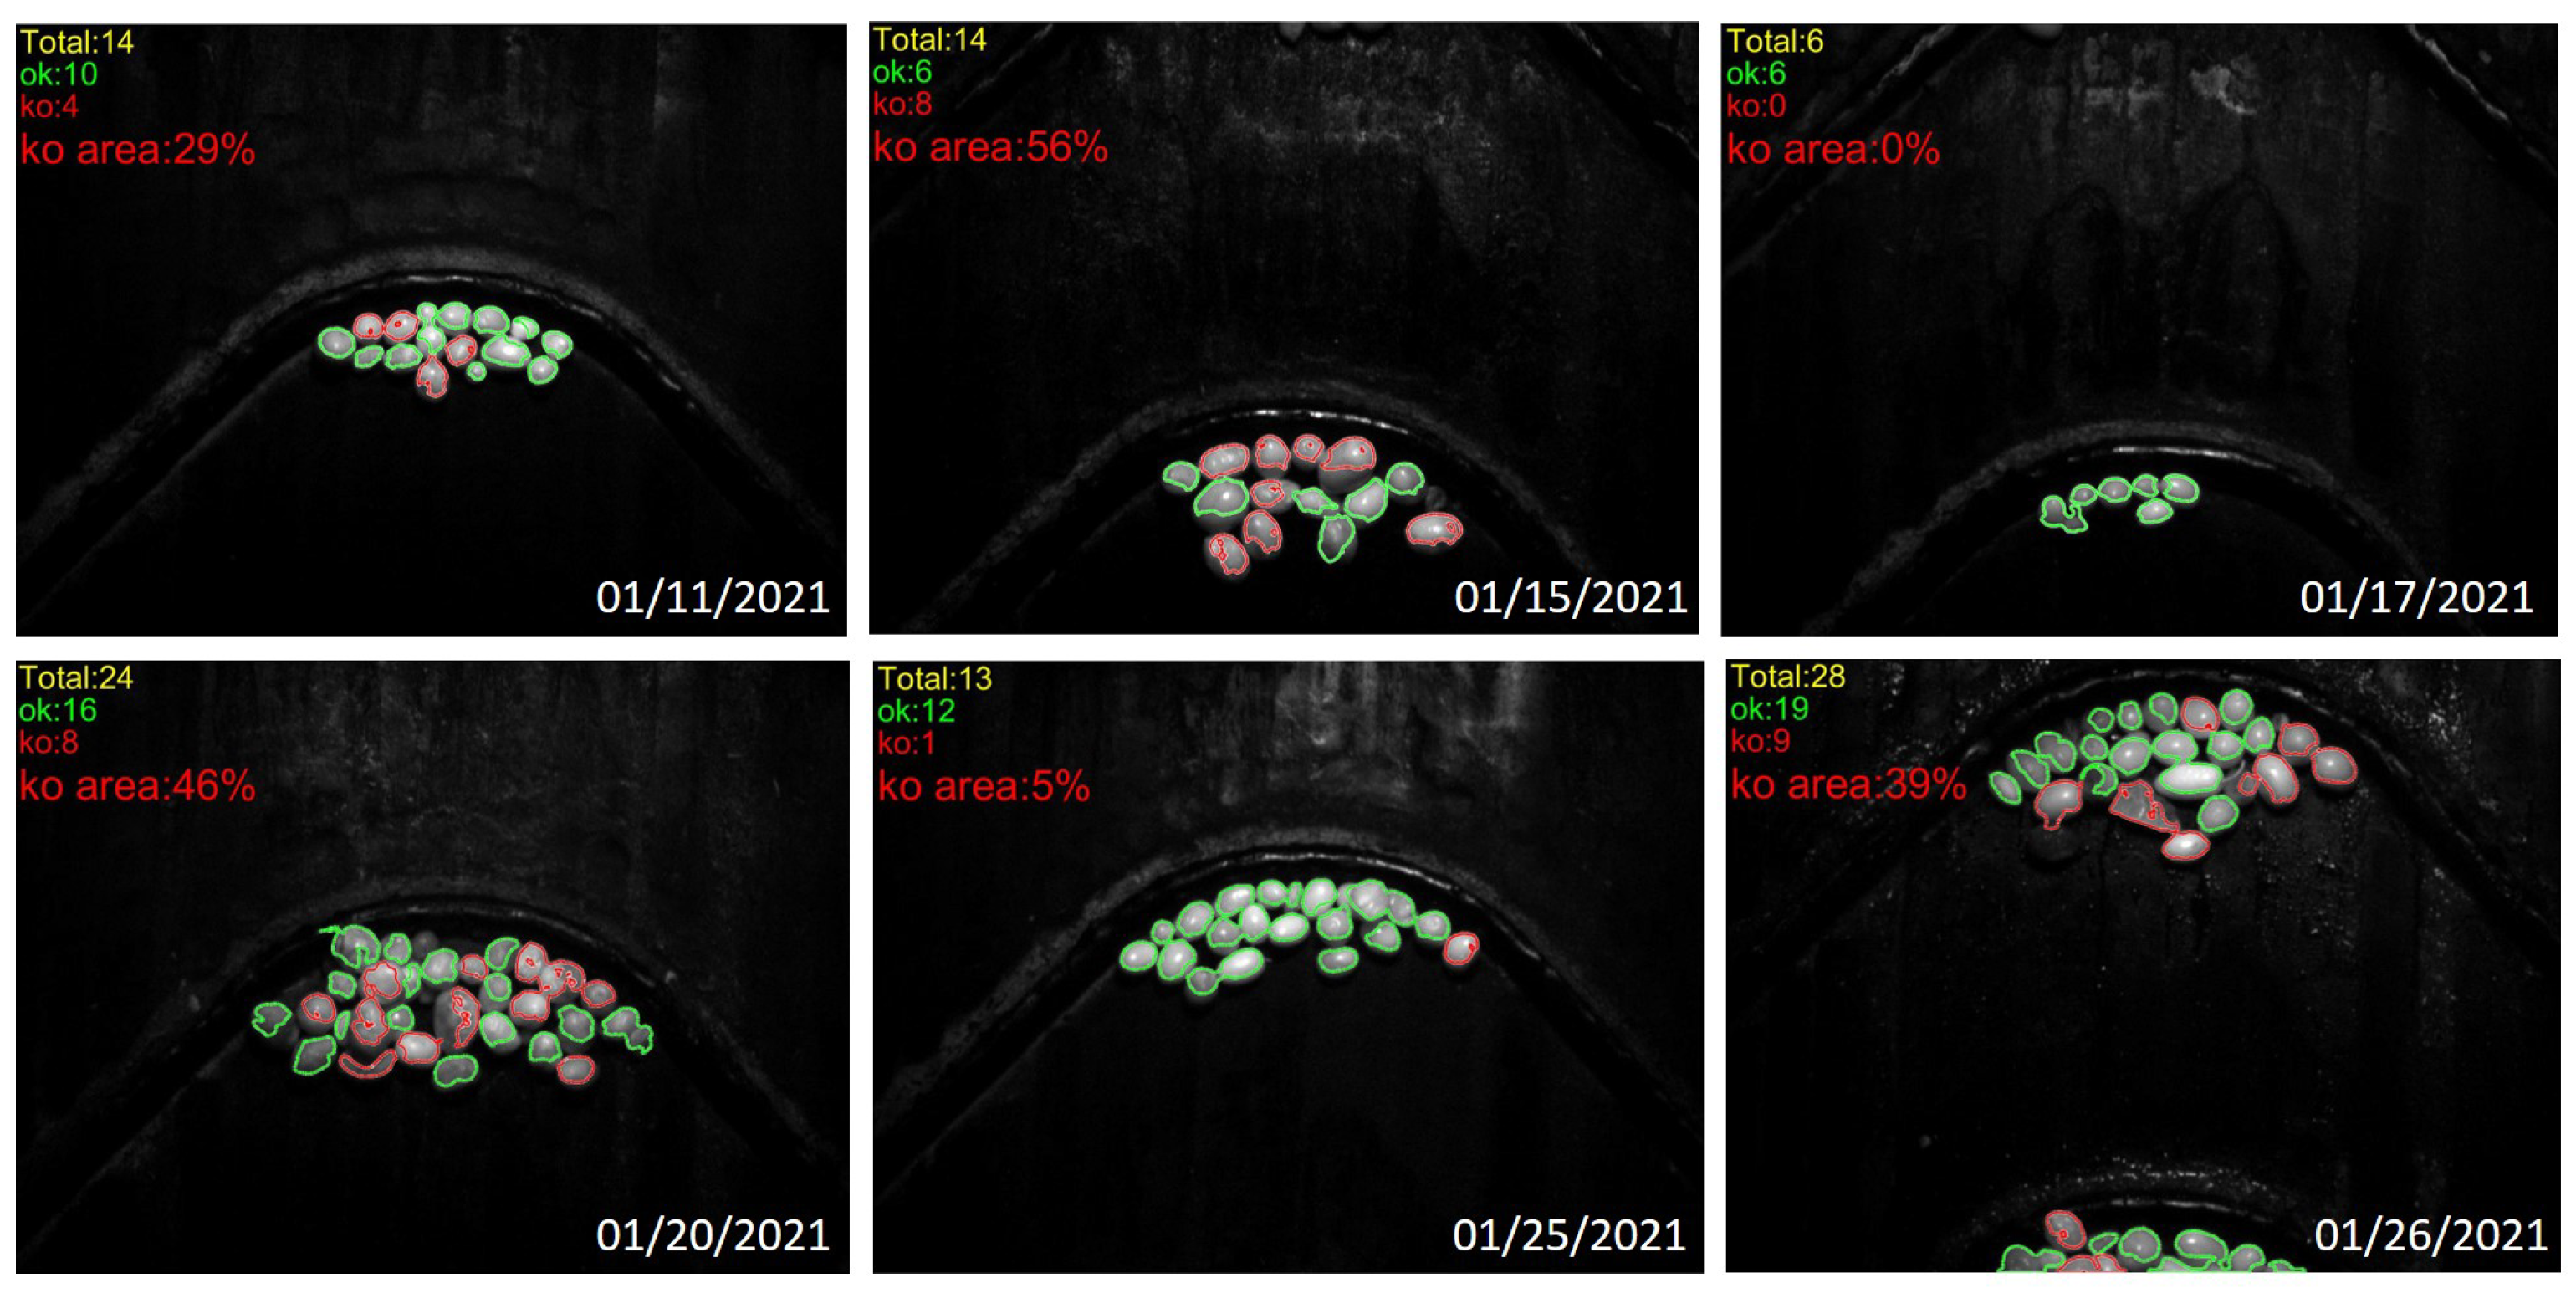
Finally,
Figure 12 shows the results of the inspection of several images acquired at different dates during the period of evaluation. The general condition of the olives did not worsen as the time passed in this period, as evidenced by the fact that the “ko area” data did not follow a clear upwards trend. A plausible explanation for this is that the temporal period covered by the analysis is relatively small compared to the timescale required to appreciate an general evolution in the overall state of the olives.
4. Conclusions
This paper was concerned with the automated detection of defects on olive fruits for the production of VOO. The early detection of fruits affected by plagues or hail is of great interest, since even a small amount of them may significantly impact the final quality of the produced VOO. As most of these defects are not perceptible in the visible band, this work has proposed a non-invasive industrial monitorization system based on an infrared camera. The image acquisition system was placed over the conveyor belt after the cleaning process and without interfering the regular productive process of the mill. Although images were acquired under controlled conditions, they were not free from glows or shadows due to fruits overlap.
To extract information from these type of images, a two stages image processing algorithm was designed. First, olives were segmented from the conveyor belt by an iterative application of the active contour technique assisted with mathematical morphology operations. Second, the detection of defect was performed individually evaluating each of the segmented regions extracted from the previous stage.
The proposal was validated by comparison between the automated and manual inspections, considered as ground-truth. In the course of more than a fortnight of January 2021, a total of 5 images per day were manually inspected and then compared with the automated inspections. Two rates were computed for this comparison: the detection rate, obtained from the True Positive Rate (TPR), and the olives wrongly classified estimated by the False Positive Rate (FPR). The results underscore the robustness and accuracy of the algorithm as they are in line with what it is demanded in industry.
Because of this, the presented solution comprises a promising starting point to inspect most of the incoming fruits without interfering with the normal daily oil mill functioning. It represents a considerable improvement to the current inspection process, which is based on a sampling scheme carried out by the oil mill expert.
The image acquistion time of 10 s was chosen to reduce the number of files and allow to have a more representative sample of olives for the same number of images. However, both the camera and the stroboscopic halogen used allow to significantly increase the capture rate, allowing to practically constantly capture images of the olives being processed on the factory. On the other hand, the average image processing time of 100 s per image is currently too high for making decisions in real time. This computation time, however, allows to perform a quality assurance process on the olive batches, enabling the detection of faulty batches and carrying out the subsquent actions regarding the remuneration of the farmer.
Further research effort will be devoted to optimizing the implementation of the different steps in order to reduce this computation time, as well as exploring the enhancement of the olive segmentation step with the application of deep learning methods instead of traditional image processing algorithms. In addition, it is expected to increase the number of image acquisitions as the industrial monitorization system will be installed during the whole next season.


