Article

A Prediction Model for Additive Manufacturing of Inconel 718 Superalloy

by
Bharath Bhushan Ravichander
1,
Atabak Rahimzadeh
2,
Behzad Farhang
1,
Narges Shayesteh Moghaddam
1,
Amirhesam Amerinatanzi
1,3 and
Mehrshad Mehrpouya
4,*
1
Mechanical and Aerospace Engineering, University of Texas at Arlington, Arlington, TX 76019, USA
2
Department of Mechanical Engineering, Girne American University, Karmi Campus, Karaoglanoglu, Kyrenia 99428, Cyprus
3
Materials Science and Engineering, University of Texas at Arlington, Arlington, TX 76019, USA
4
Faculty of Engineering Technology, University of Twente, P.O. Box 217, 7500 AE Enschede, The Netherlands
*
Author to whom correspondence should be addressed.
Appl. Sci. 2021, 11(17), 8010; https://doi.org/10.3390/app11178010
Submission received: 27 July 2021 / Revised: 23 August 2021 / Accepted: 26 August 2021 / Published: 30 August 2021
(This article belongs to the Special Issue Advances in Additive Manufacturing Technology)

Abstract

:
Inconel 718 is a nickel-based superalloy and an excellent candidate for the aerospace, oil, and gas industries due to its high strength and corrosion resistance properties. The machining of IN718 is very challenging; therefore, the application of additive manufacturing (AM) technology is an effective approach to overcoming these difficulties and for the fabrication of complex geometries that cannot be manufactured by the traditional techniques. Selective laser melting (SLM), which is a laser powder bed fusion method, can be applied for the fabrication of IN718 samples with high accuracy. However, the process parameters have a high impact on the properties of the manufactured samples. In this study, a prediction model is developed for obtaining the optimal process parameters, including laser power, hatch spacing, and scanning speed, in the SLM process of the IN718 alloy. For this purpose, artificial neural network (ANN) modeling with various algorithms is employed to estimate the process outputs, namely, sample height and surface hardness. The modeling results fit perfectly with the experimental output, and this consequently proves the benefit of ANN modeling for predicting the optimal process parameters.

1. Introduction

Inconel 718 (IN718) is one of the age-hardenable superalloys which is well-known for its outstanding chemical and mechanical properties at elevated temperatures [1,2,3]. This alloy has a wide range of working temperatures up to 650 °C [4]. IN718 also shows excellent corrosion and creep resistance behavior and provides high strength [5,6]. Insensitivity to strain-age cracking and good weldability behavior are the other desirable features of IN718 [7]. This superalloy is formed of several elements, such as chromium, niobium, aluminum, and titanium, but nickel is the main contributor with a range of 50–55 weight percentage [4,8,9]. These elements are designed to form different phases that can be adjusted to bring about desired properties based on the application requirements. Because of all these features, IN718 has been employed in various industries, such as gas turbines, aircraft engines, power plants, and combustion chambers components [10,11,12,13,14]. However, when it comes to the machinability, the high mechanical strength of IN718 can be a drawback. The machining operation of this alloy is a time-consuming and costly process [15], which is a big hindrance to forming the complex geometry components needed in the aforementioned industries. This limitation has led to the inability of traditional manufacturing techniques in the fabrication of IN718 parts with complicated geometries. That is why additive manufacturing (AM) technology has drawn the attention of manufacturers to fabricate high-demand IN718 components while the geometry requirements can be satisfied [16].
Laser powder bed fusion (LPBF) is one of the widely-used AM techniques which is capable of fabrication of highly complex geometry products with an excellent precision level [17]. There are numerous studies focused on the manufacturing of IN718 components through LPBF, as this technique provides a powerful industrial prototyping tool, cost-effective components with complicated shapes, great freedom in fabrication, high surface quality, and relatively high density values [18,19,20,21,22,23,24,25]. However, it has been determined that the quality of parts is highly dependent on the process parameters employed in the LPBF process [26,27,28,29,30]. Considering the complexity of the LPBF process and numerous factors involved (including chemical and physical phenomena), performing a statistical study seemed necessary to reveal a strong correlation between process parameters and quality, and properties of the end products.
Various studies have investigated the process parameters in LPBF-processed IN718 in terms of microstructure, mechanical response, and dimensional accuracy. Several studies analyzed the microstructure change of LPBF-fabricated IN718 parts as a response to the different processing parameters. Balbaa et al. [31] studied the effect of different laser powers and scan speeds on the stability of melt pools of IN718. They found equiaxed grains at the lowest scanning speed of 600 mm/s, whereas increasing the speed to 800 mm/s revealed columnar grain structure. They also reported that at the scanning speed of 800 mm/s, reducing the hatch spacing changed the grain structure from mixed to columnar grains. In a similar study [32], it was reported that an increase in the energy density formed a microstructure with longer and more tightly bound dendrites, with fine columnar dendrites being observed due to the higher thermal gradient. It was also concluded that there was a strong correlation between the energy density and the formation of pores, as employing the higher energy density reduced the level of porosity. A detailed study by Kumar et al. [33] showed that the laser power and scan speed have different influences on the formation of pores in the IN718 LPBF-fabricated samples. The authors observed a rapid decrease in the level of porosity with an increase in laser power, whereas a linear trend was found by reducing the scan speed. Consequently, a proper combination of laser power and scanning speed was recommended for obtaining a fully dense part.
The laser process parameters have an influence on the density and mechanical properties of as-fabricated LPBF samples [34]. In a statistical study performed on LPBF, the laser power values were varied at three different levels to fabricate IN718 samples. It was revealed that increasing the laser power to a specific value (200 W) brings about parts with a lower porosity level. Additionally, in terms of mechanical properties, the highest yield strength of 775 MPa, the ultimate strength of 1055 MPa, and elongation of about 30% were obtained [35]. Lower surface quality and a higher porosity level in the LPBF-processed IN718 samples were observed when the scanning speed was increased [32,36].
One of the drawbacks of the LPBF process is the relatively poor surface finish and dimensional accuracy of the final parts. Although LPBF is widely utilized for the fabrication of components in aerospace and biomedical industries, it is still challenging to achieve the high level of precision required for some critical parts. Achieving a level of accuracy of up to ±20–50 μm is difficult for the 3D printing components [37]. For this reason, many studies considered dimensional accuracy as one of the main outputs in the optimization of processing parameters [28,38,39,40,41,42]. Nguyen et al. [43] concluded that lowering the layer thickness results in denser parts with higher dimensional accuracy and minor improvements in mechanical properties and microhardness. In another study, the effect of hatch distance on the density of LPBF-fabricated IN718 was revealed. It was found that a higher level of densification occurs by reducing the hatch spacing [44]. Yi et al. [45] investigated the impact of laser power and scanning speed on the geometrical accuracy of the fabricated samples. They found that a lower speed and higher laser power significantly reduced the geometrical accuracy of the fabricated IN718 samples. Similar observations were reported in another study by Sadowski et al. In another study performed by Huo et al. [46], the effect of process parameters on the distortion of the LPBF-fabricated IN718 samples was investigated through simulation analysis. Using Simufact Additive (SA), a simulation software, it was found that each set of process parameters have a different effect on the quality of the part. For example, it was seen that as the laser power increased, the distortion effects increased and that the distortion could be reduced by increasing the scan speed. However, no experimental measurements were used in this study to evaluate the output of the simulation model. The distortion analysis and the dimensional accuracy can also be evaluated by investigation of the variation in size of the sample height, as the most affected dimension fabricated along the building direction. The importance of this parameter can be attributed to the fact that the deviation in height of the sample can prevent uniform spreading of the powder, leading to failure in fabrication due to the collision between a part and the recoater. In this case, several studies investigated the effect of processing parameters on the dimensional accuracy; the height of the sample was considered as an important criterion [24,47,48,49]. Similarly, in this study the sample height was selected as an output to represent the dimensional accuracy and the deviation from the designed value. The studies reviewed above focused on statistical models to find the exact correlation between the LPBF process parameters and the quality of parts. While there are many archived data in the literature, there is still a gap to be filled for finding a fast and reliable model to provide a strong relationship between LPBF parameters and the properties of fabricated products.
Artificial neural network (ANN) is a rapid and reliable method that is broadly used for solving complex problems using various algorithm architectures. Therefore, ANN modeling can be applied as a prediction tool for finding a nonlinear relationship between input and output results for various manufacturing processes and, consequently, discovering the optimal processing parameters [50]. Some studies took advantage of ANN modeling for predicting the optimal parameters in AM processes. For example, Kwon et al. [51] employed an ANN model to study the influence of laser power on microstructural properties on the LPBF-fabricated parts. For this purpose, they utilized 13,200 images of the melting pool area in order to recognize crack formation and the density of the fabricated parts. Khorasani et al. [52] also applied the ANN model to predict the surface roughness and investigate the effect of process parameters on the LPBF Ti-6Al-4V alloy. The results showed that heat treatment and laser power were two main parameters with a high influence on surface quality. In another study, Zhang et al. [53] applied a combination of the ANN technique and fuzzy logic, which is called a neuro-fuzzy inference system (ANFIS), to predict the fatigue life of LPBF-based fabricated stainless steel 316L samples. The model was able to produce an accurate prediction of the fracture mechanism and fatigue life of the samples based on various process and post-processing parameters. Mehrpouya et al. [54,55] showed that ANN modeling can be used to optimize the process parameters in LPBF fabricating NiTi alloys. Laser power, hatch spacing, and scanning speed were considered as the principal parameters in this process and the prediction model successfully found the optimum set of parameters for the manufacturing process.
This work aims to show the potential of the ANN model for predicting the optimal process parameters in a LPBF-processed IN718 alloy and, in particular, investigates the impact of input parameters, including laser power, hatching space, and scanning space, on sample dimension and surface quality of the fabricated parts.

2. Experimental Setup

2.1. Materials and Equipment

All samples were fabricated by an EOS SLM 3D printer (EOS GmbH, M290, Germany) which has a build volume of 250 × 250 × 325 mm and an ytterbium fiber laser of 400 W. IN718 powder was also provided by the EOS company with an average particle size of 12 microns. The powder composition was reported here [24]. The samples for this study were designed and fabricated in the dimensions of 5 × 5 × 6 mm (length × width × height). For measuring the dimensions of the samples, the FAROARM® EDGE and Laser Scan arm (Faro, Lake Mary, FL, USA) coordinate measurement system was applied in this study. Cloud data points were obtained from the FAROARM® EDGE scanner and these data points were then converted into CAD models. These CAD models were measured using Polyworks Inspector software (Innovmetric, Novi, MI, USA). Additionally, a Vickers hardness tester, LECO (LECO, LM 300 AT, Saint Joseph, MI, USA), was employed to analyze the microhardness of each sample on the top surface of the sample. A load of 500 g was applied for 10 s and a minimum of four indentations were made and reported.

2.2. Design of Experiments

The process parameters in this study were generated based on the DOE approach, in particular the RSM technique, using Minitab software (Minitab Inc., Version 19, Philadelphia, PA, USA). The energy density of the process parameters was calculated using the following equation [24,56,57]:
E v = P v × h × t
where Ev (J/mm3) is energy input, P (W) is laser power, v (mm/s) is scanning speed, h (μm) is hatch distance, and t (μm) is layer thickness.
The layer thickness was constant (40 μ m ) in order to simplify the experimental process; however, a range of various operational parameters was considered in this study, as shown in Table 1.

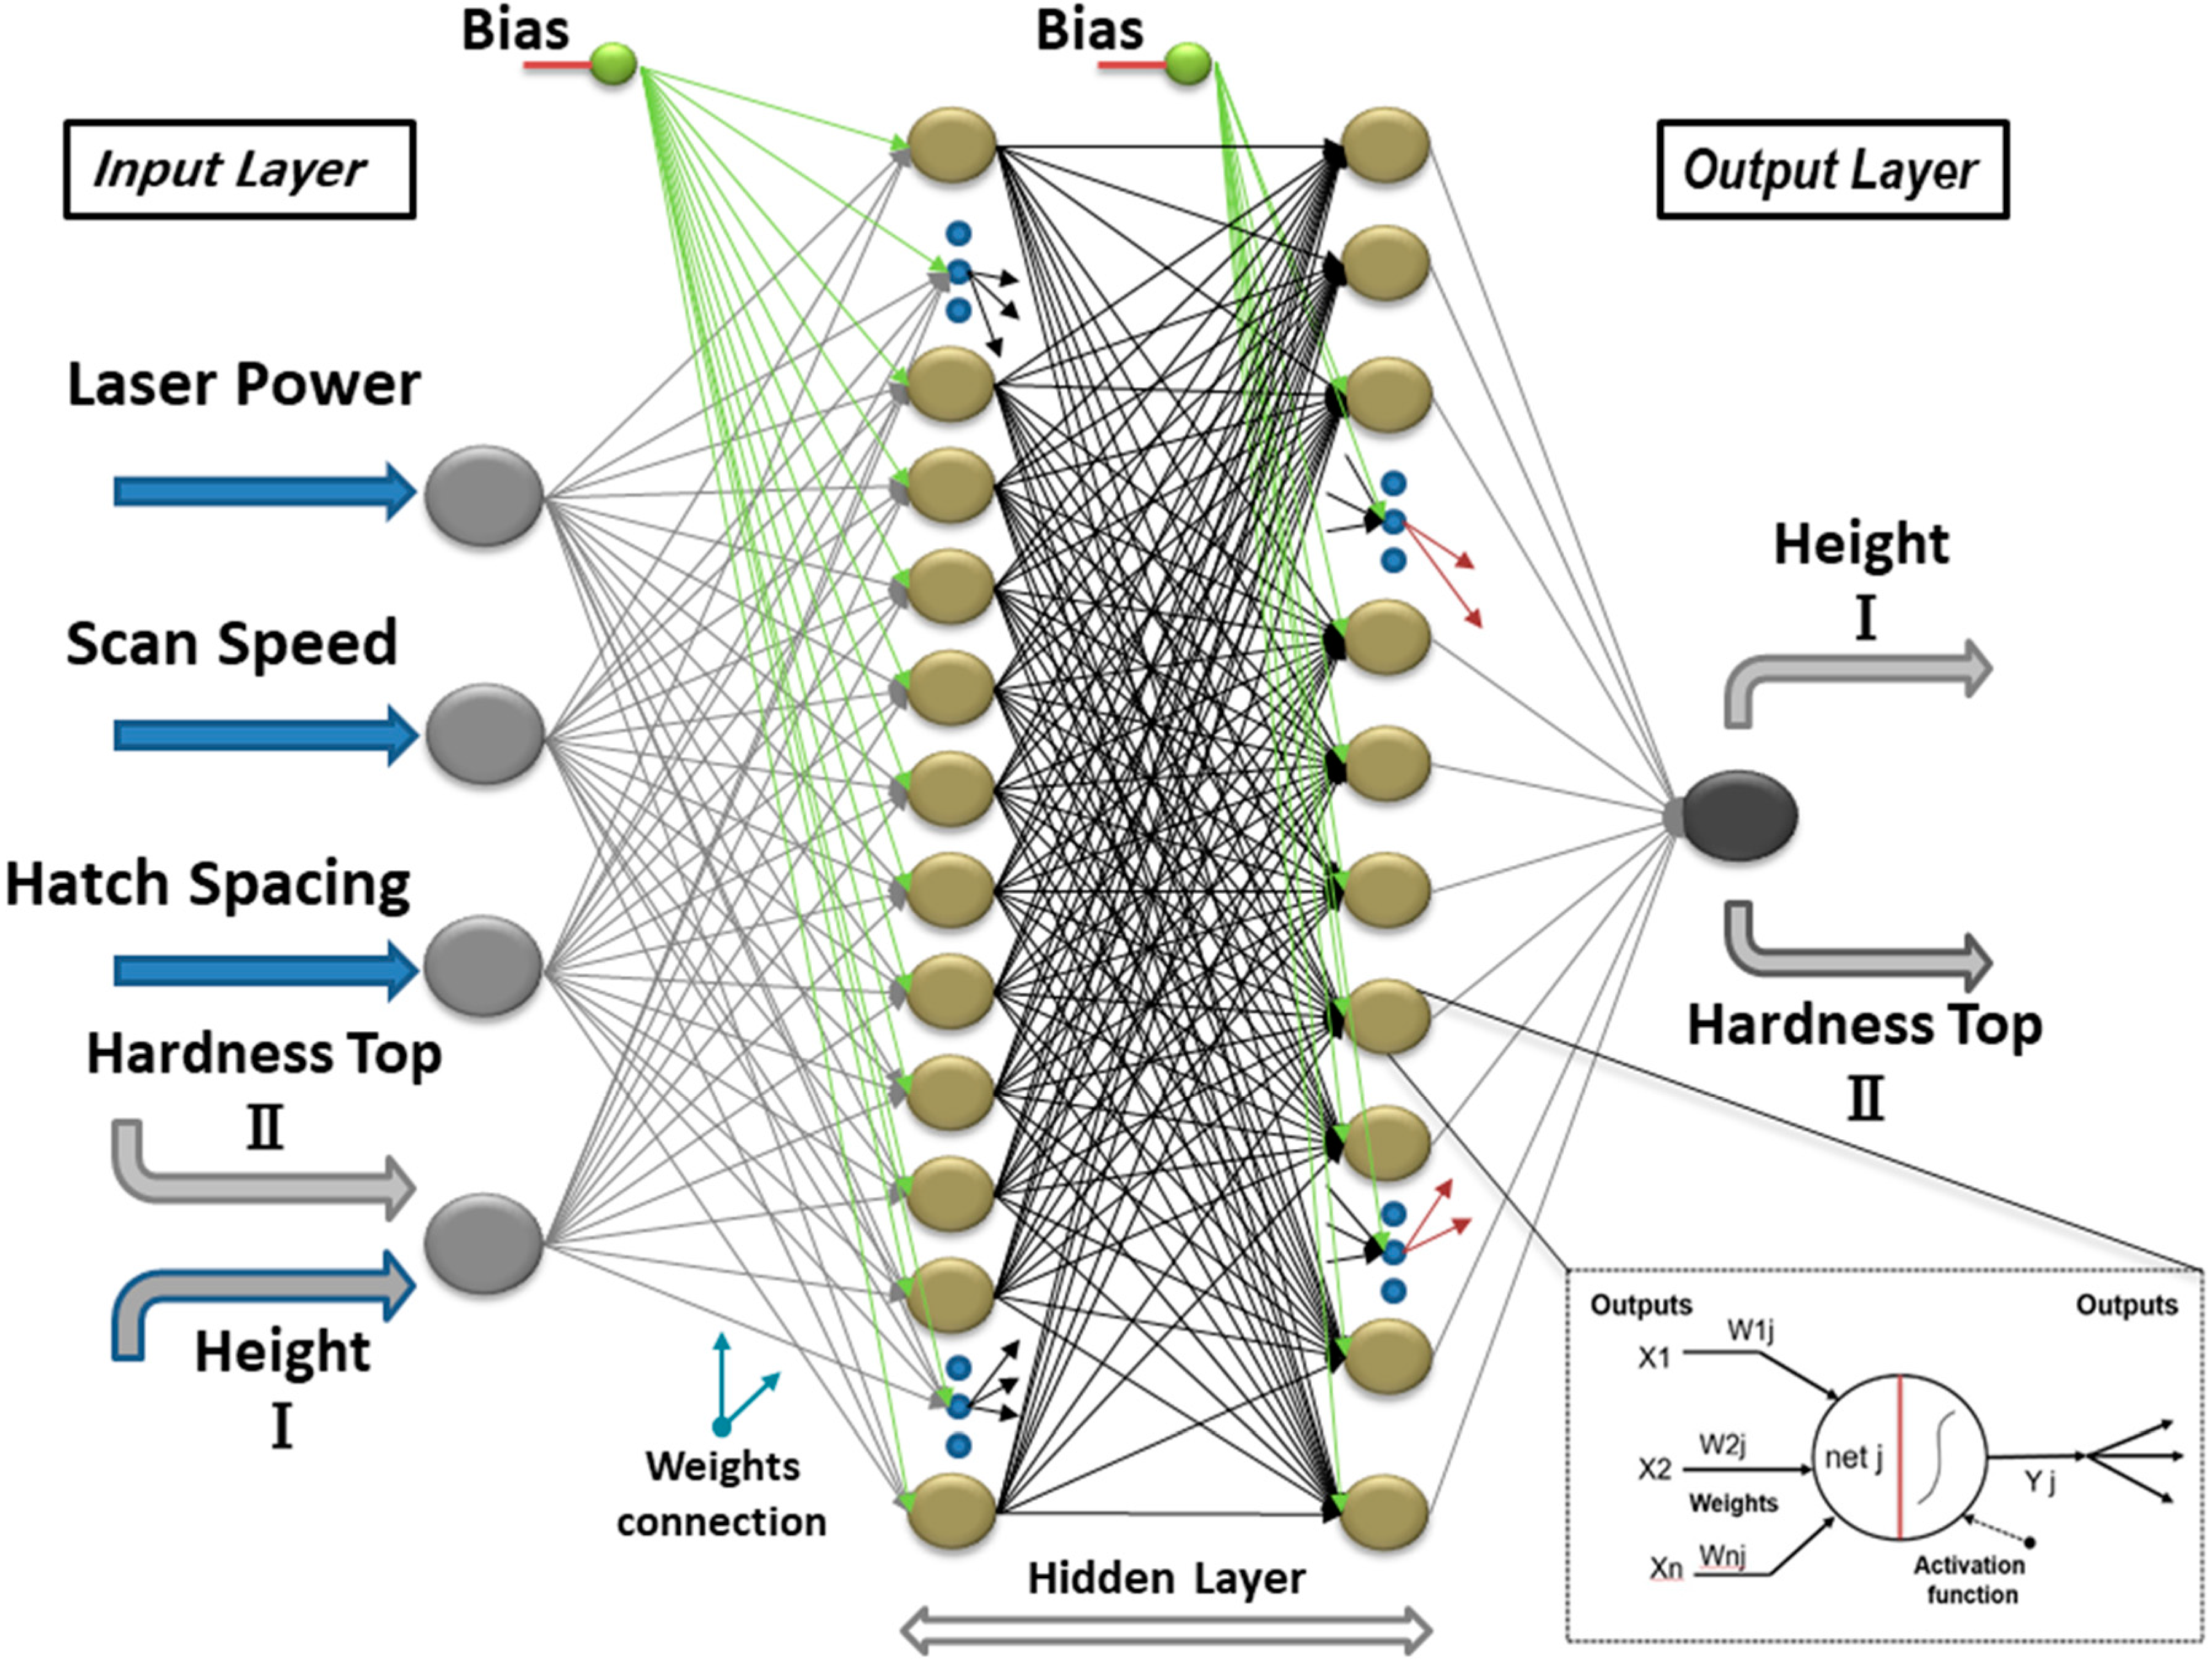
3. Neural Network Setup

ANN modeling is a collection of interconnected neurons that can learn and adapt themselves to the environment. There are normally two steps in this method—one for the learning process and the other one for recall. The recall phase works based on different weight rates obtained from input and output data in the learning phase [54,58]. In this study, the optimal ANN model was achieved based on a logsig transfer function in the multilayer perceptron (MLP) network [59]. In particular, Levenberg–Marquardt (LM) and Back-Propagation (BP) algorithms were applied to train the MLP network using MATLAB software [50]. Table 2 shows a summary of the characteristics of the selected network in this study.
The LM algorithm can effectively perform a faster training process; thus, it is widely used for optimizing problems, specifically for small networks, since it requires a large memory for a multitude of computations. The LM algorithm has the capability to minimize training error and, consequently, to increase the model accuracy [60]. The BP algorithm contains forward computing and also a backward learning cycle. It was applied in this study in order to improve the efficiency of the computation for weights and to reduce the mapping errors for the neurons in the network [61].
Moreover, different indicators, including the coefficient of correlation (R), the coefficient of determination (R2), and root mean square error (RMSE), were considered in order to evaluate the predictability of this network. Accordingly, the best fit was considered based on the desired and predicted values (RMSE = 0 and R = 1). All experimental data are divided into three groups in this modeling:
  • 60% training;
  • 20% cross-validation;
  • 20% testing.
As shown in Figure 1, this model consists of three inputs (LP, SS, HS), two hidden layers, and two outputs (sample height and surface hardness). It should be mentioned that the sample height and hardness are considered as the input subset in order to increase the accuracy of the network. In other words, as shown in Figure 1, in order to predict one of the outputs (hardness or height), the other one can be considered as the input in the modeling process. In this way, the number of input data is increased and this can provide a higher prediction rate [50,54,55,62].

4. Results and Discussion

4.1. Experimental Results

The process parameters have a direct impact on geometric accuracy. Therefore, the geometry of the fabricated IN718 samples was analyzed by a coordinate measuring machine (CMM) in this study. In order to simplify the measurement process, the sample height dimension was selected to investigate the effect of process parameters on dimensional accuracy. The average, standard deviation, and uncertainty of the measurements were calculated for the sample height. According to the results extracted for the sample height, the average value was between 5.971 and 6.018 mm. The standard deviation varied from 0.77% to 1.82% and the estimated standard measurement uncertainty was between 0.17% and 0.41%. In this case, the source of uncertainty can be associated with the coordinate measuring machine (CMM) system, including variation in a workpiece, variation in the fixture, workpiece form error, sampling strategy, thermal condition, dirt, coolant, dynamic effects, and the operator [63].
Figure 2 illustrates the influence of operational parameters (LP, SS, and HS) on the height of the fabricated samples. As shown, scanning speed plays a significant role in the dimension accuracy, particularly sample height. The results show that the sample heights decreased significantly to lower than 5.98 mm when the scanning speed was in the range of 900 to 1050 mm/s. This can be observed in both SS–LP and HS–SS diagrams. Conversely, it can be observed that the sample heights increased to over 6.03 mm when the hatch spacing was below 100 µm. This also happened when laser power was below 260 W or scanning speed was over 1050 mm/s.
This variation in the height of the samples can be attributed to the level of energy density used during the fabrication process. A higher level of energy density will result in the formation of deeper pools, which facilitates epitaxial solidification [24,64]. This, in turn, leads to the elongation of grains parallel to the building direction and the formation of columnar structures [24,64]. This condition affects the dimensions of the parts, particularly the sample height. On the other hand, the formation of shallower melt pools results from a lower level of energy density, leading to lower height values for the as-fabricated samples [42]. As the relationship between scanning speed and energy density is inverse, a higher scanning speed (lower energy density) results in a lower sample height. The same thing is valid for the hatch spacing, as it follows a similar relationship with energy density.
According to the results obtained for the hardness, the average value ranged from 260.28 to 308.58 HV. In this case, the standard deviation was between 1.36% and 16.14% and the standard measurement uncertainty varied from 0.30% to 3.61%. For the hardness measurements, the source of uncertainty can be categorized as test specimen (preparation, parallelism, and surface aspect), testing means (measurement for the diagonal of indentation), test environment (temperature and dirt), and the operator [65].
Figure 3 demonstrates that hatch spacing had a substantial impact on determining the surface hardness of the fabricated IN718 samples. As can be seen, the sample hardness decreased considerably from 270 to 260 HV when the hatch spacing increased from 110 to 125 µm. This occurred when both laser power and scanning speed were considered constant (960 mm/s and 285 W respectively). Additionally, Figure 3 reveals that the surface hardness can increase sharply to around 300 HV when the laser power is over 300 W and the scanning speed is below 850 mm/s, as shown in the LP–SS diagram. The same result can be observed in the LP–HS diagram when the laser power is over 300 W and the hatch spacing is less than 95 µm. In addition, the HS–SS diagram demonstrates that by increasing the scanning speed and the hatch spacing values, the surface hardness declines significantly to the range of 260–266 HV. Contrarily, the hardness can rise to over 300 HV when the scanning speed and the hatch spacing are less than 850 mm/s and 95 µm, respectively.
The hardness value, which can be a good representative of mechanical properties, has been reported to have a strong correlation with the energy density level [66,67]. Based on the results, there was a drop in the hardness value with an increase in hatch spacing. This can be explained by the relationship between the energy density and the adhesion of fabricated layers. Increasing the space between the laser tracks (hatch spacing) reduces the energy density and, thereby, affects the epitaxial solidification. With a lower level of epitaxial bonding, the probability of weak adhesion between the layers is higher. Consequently, this prevents the formation of columnar structures [68]. It has been revealed that there is a strong correlation between the formation of columnar grains and the hardness value [69]. Therefore, a lower hardness value is expected for the sample fabricated with higher hatch spacing. In terms of scanning speed, as an increase in this parameter decreases the energy density, the same logic discussed before can be used. A higher scanning speed value (lower energy density) results in the formation of shallower pools, and shallower pools, in turn, lead to weaker epitaxial solidification. Thus, a weak adhesion between layers leads to a lower hardness value. Since the relationship between laser power and energy density is linear, the opposite is true for the effect of laser power, as observed in the results.

4.2. Modeling of Experimental Data and Results

The input data were collected from the previous experimental study [24], which investigated the impact of processing parameters (LP, SS, HS) on the surface quality of the printed samples. Therefore, this part discusses the results of the ANN modeling process as a prediction tool, estimating two outputs—sample height and surface hardness. The archived results are based on the MLP neural model, in particular with the application of the BP and LM algorithms for the modeling of both input and output data in the experimental study. The modeling results were obtained based on the coefficient of determination (R2) assessment, so that they demonstrated the linear correlation between the calculated and the observed data based on a statistical approach.
Figure 4 illustrates a comparison between the measured and predicted sample heights in both training and testing phases. As can be seen, these graphs depict the best fitting line for the desired and calculated data sets based on the predefined network model and hidden layers.
In the following, Table 3 demonstrates the statistical report of the linear regression related to sample height. As shown, the lowest R2 values are 0.97912 and 0.97525 for the training and testing phases, respectively. These values are very close to 1, which shows that the correlation of determination for the testing set proves the accuracy of the achieved results and the capability of the applied algorithms in this study.
The same model was applied for predicting the hardness (top) value of the printed IN718 samples. Linear regression analysis was employed to determine the R2 value for the ANN model. Figure 5 illustrates the relationship between the experimental and predicted data and, as can be seen, the R2 value is close to unity, which, therefore, proves the capability of this model for predicting the output data set in this study. The statistical report of these graphs is in Table 4, and it shows that the R2 values for the training and testing phases are 0.96246 and 0.95839, respectively. Accordingly, the MLP model indicates a very good fitting with the experimental results for each training and testing phase.
The scatter diagrams in Figure 6 demonstrate the trends of sample height (left) and surface hardness (right) related to the testing samples. It is obvious that the correlation between the measured and predicted results is very close, and the statistical reports also proved this previously.

5. Conclusions

The potential of the neural network model for predicting the output data in the LPBF of an IN718 superalloy was studied. The samples were fabricated by different process parameters, designed based on the DOE approach. Analysis of the sample height and surface hardness of the printed IN718 samples led to the following observations:
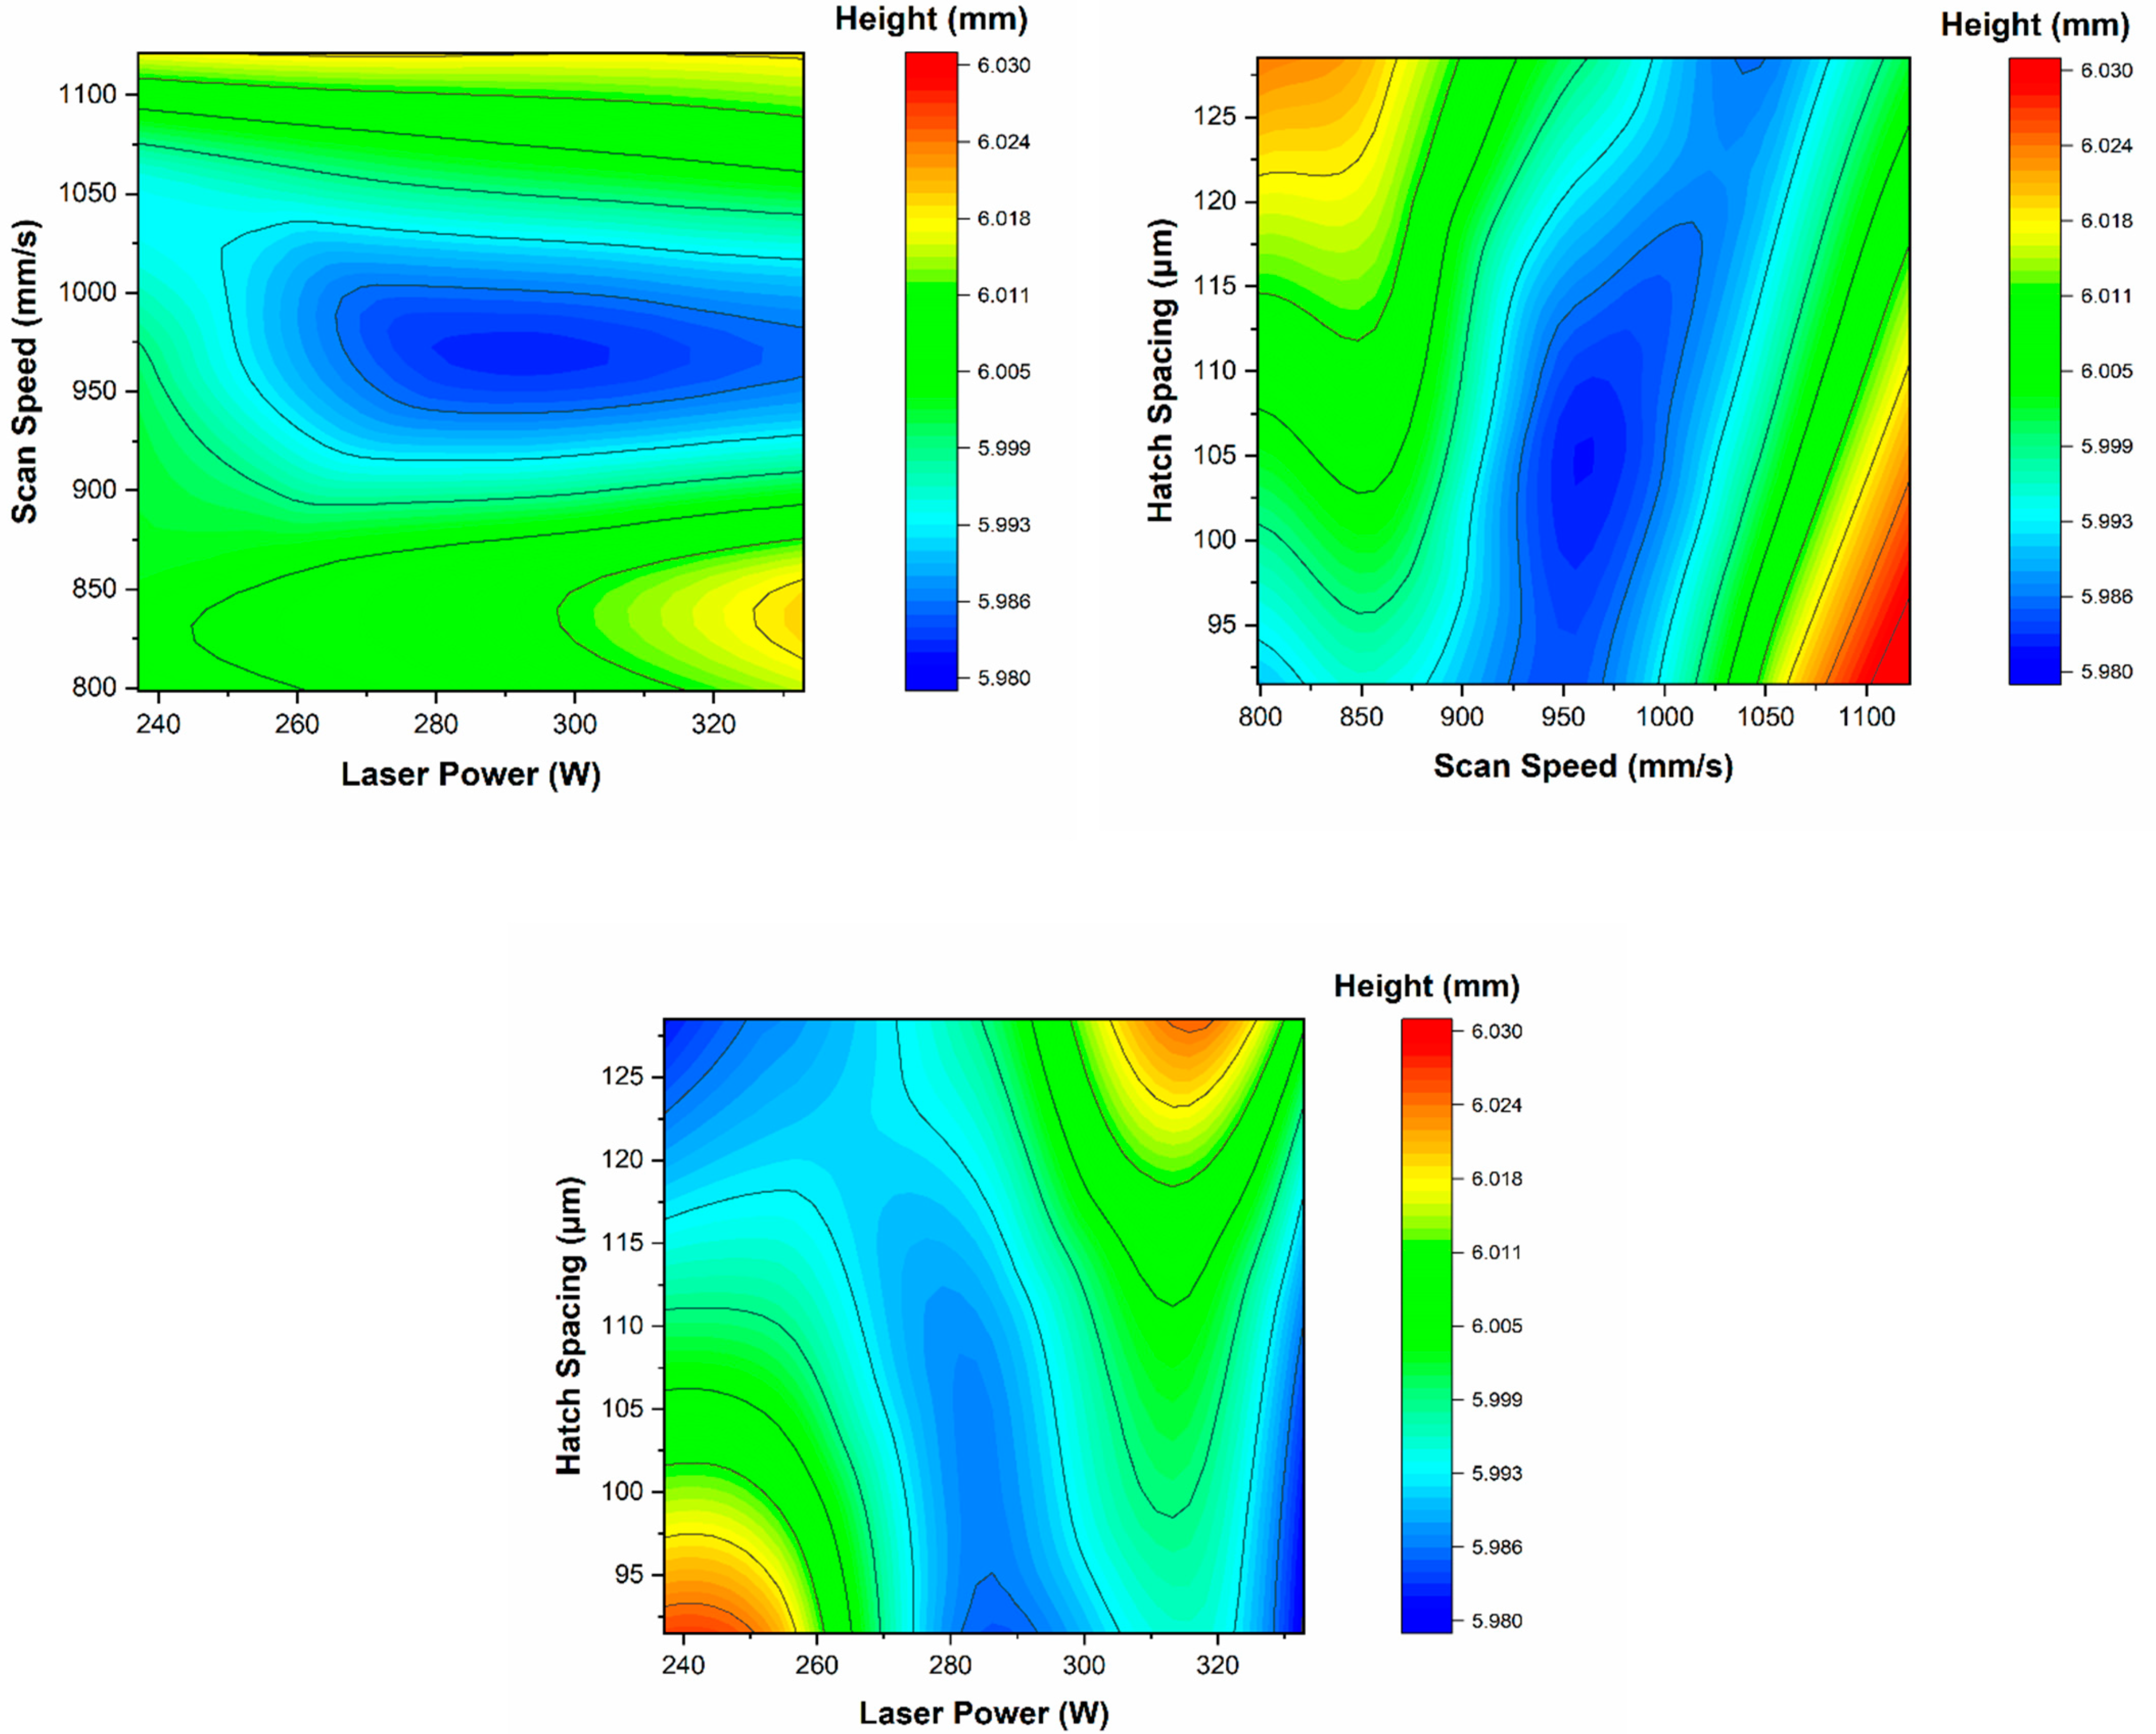
  • As observed in both SS–LP and HS–SS diagrams, the scanning speed played a significant role in the accuracy of the sample height dimension, with a higher scanning speed (lower energy density) resulting in a lower sample height.
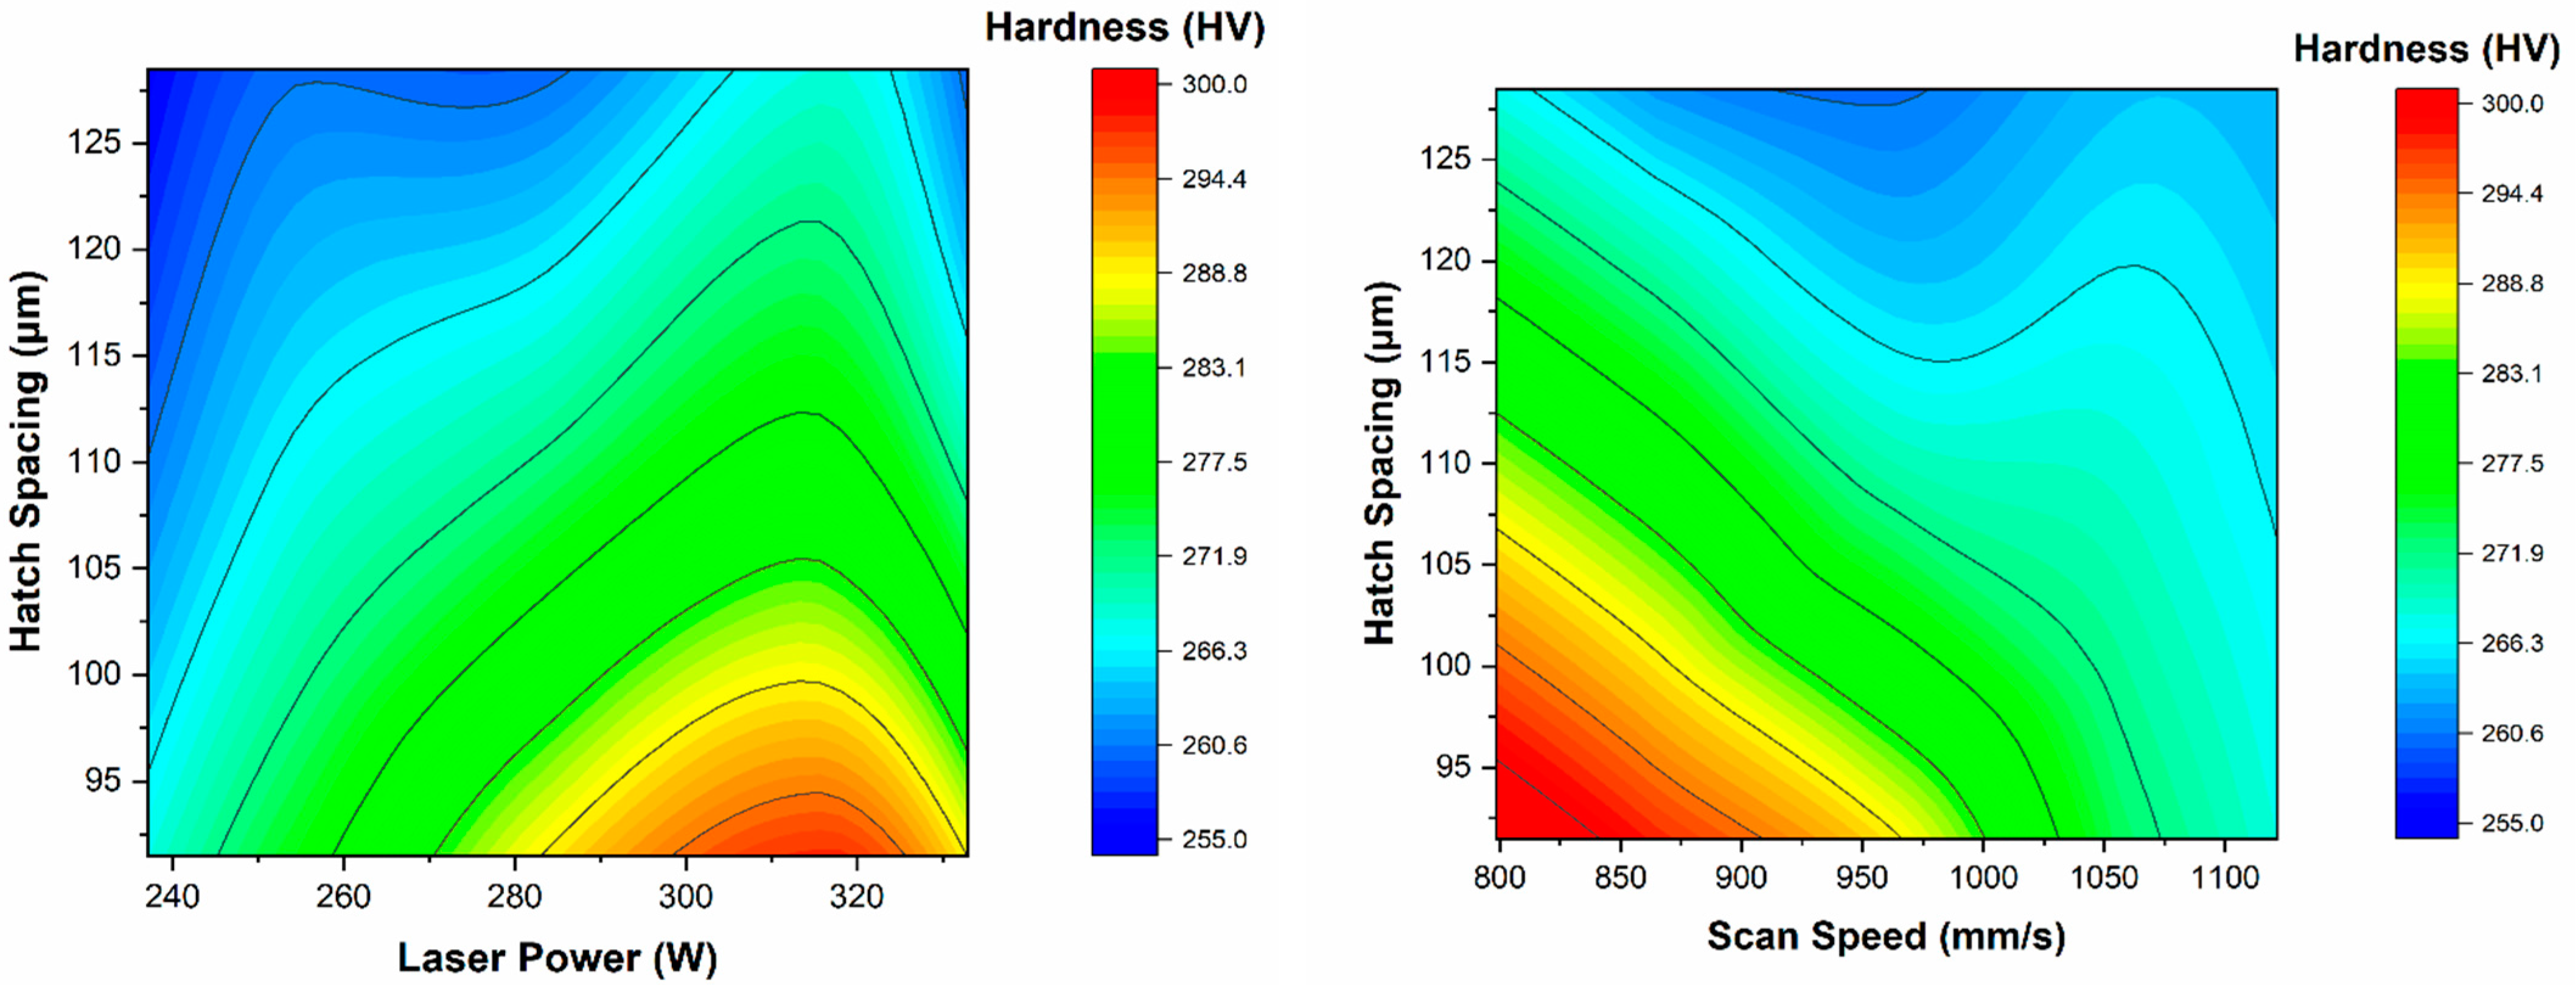
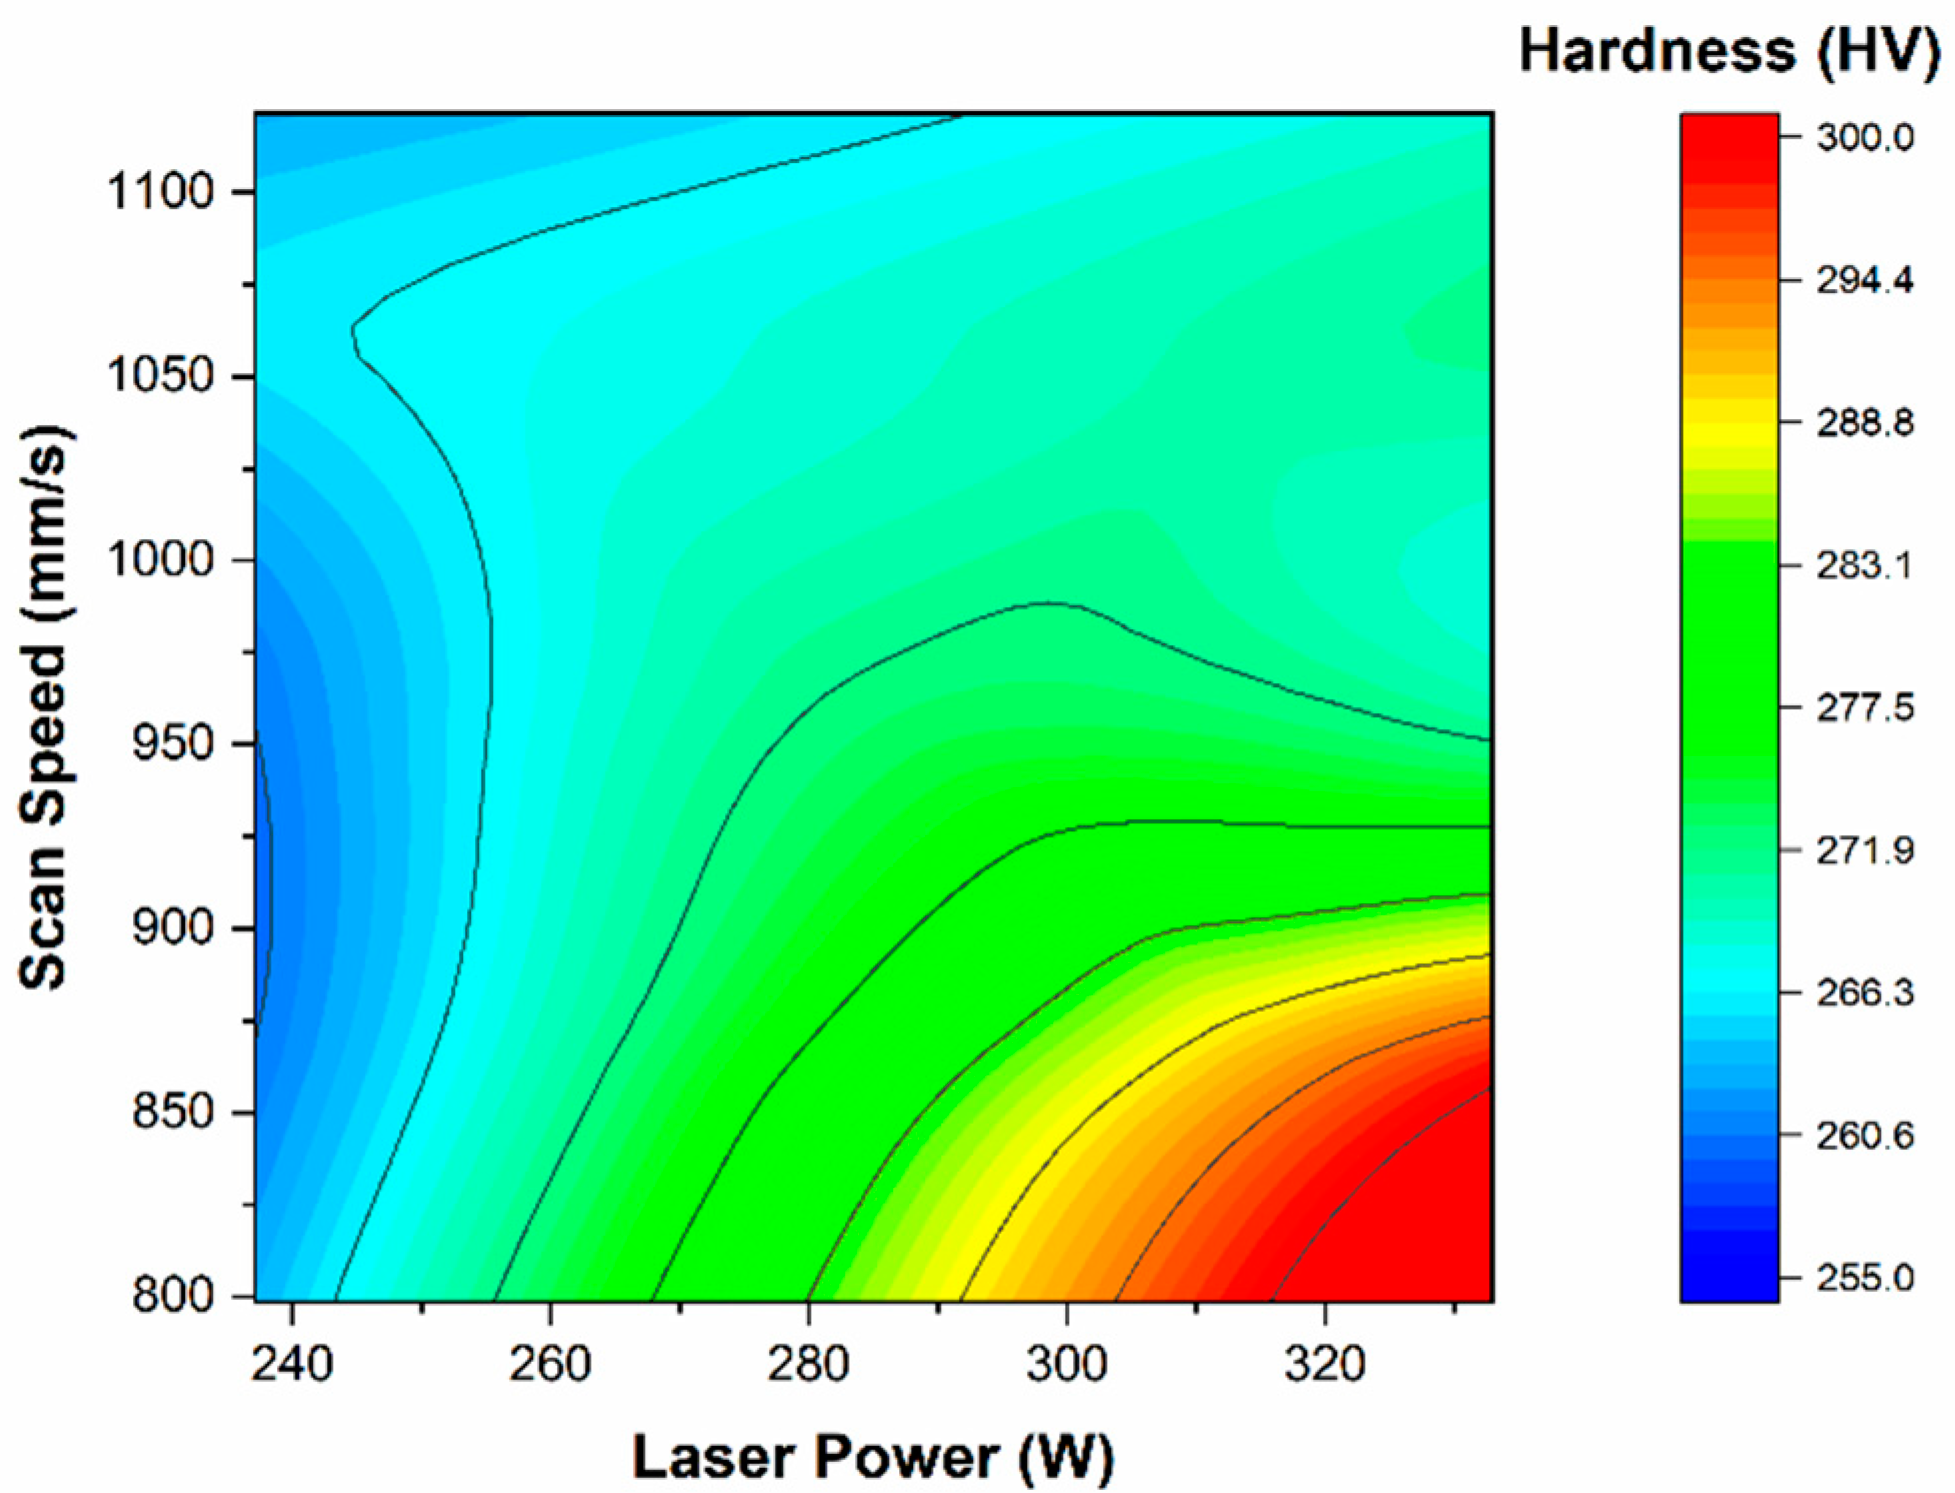
  • Hatch spacing had a substantial impact on the surface hardness of the samples, with an inverse relationship being found for these parameters.
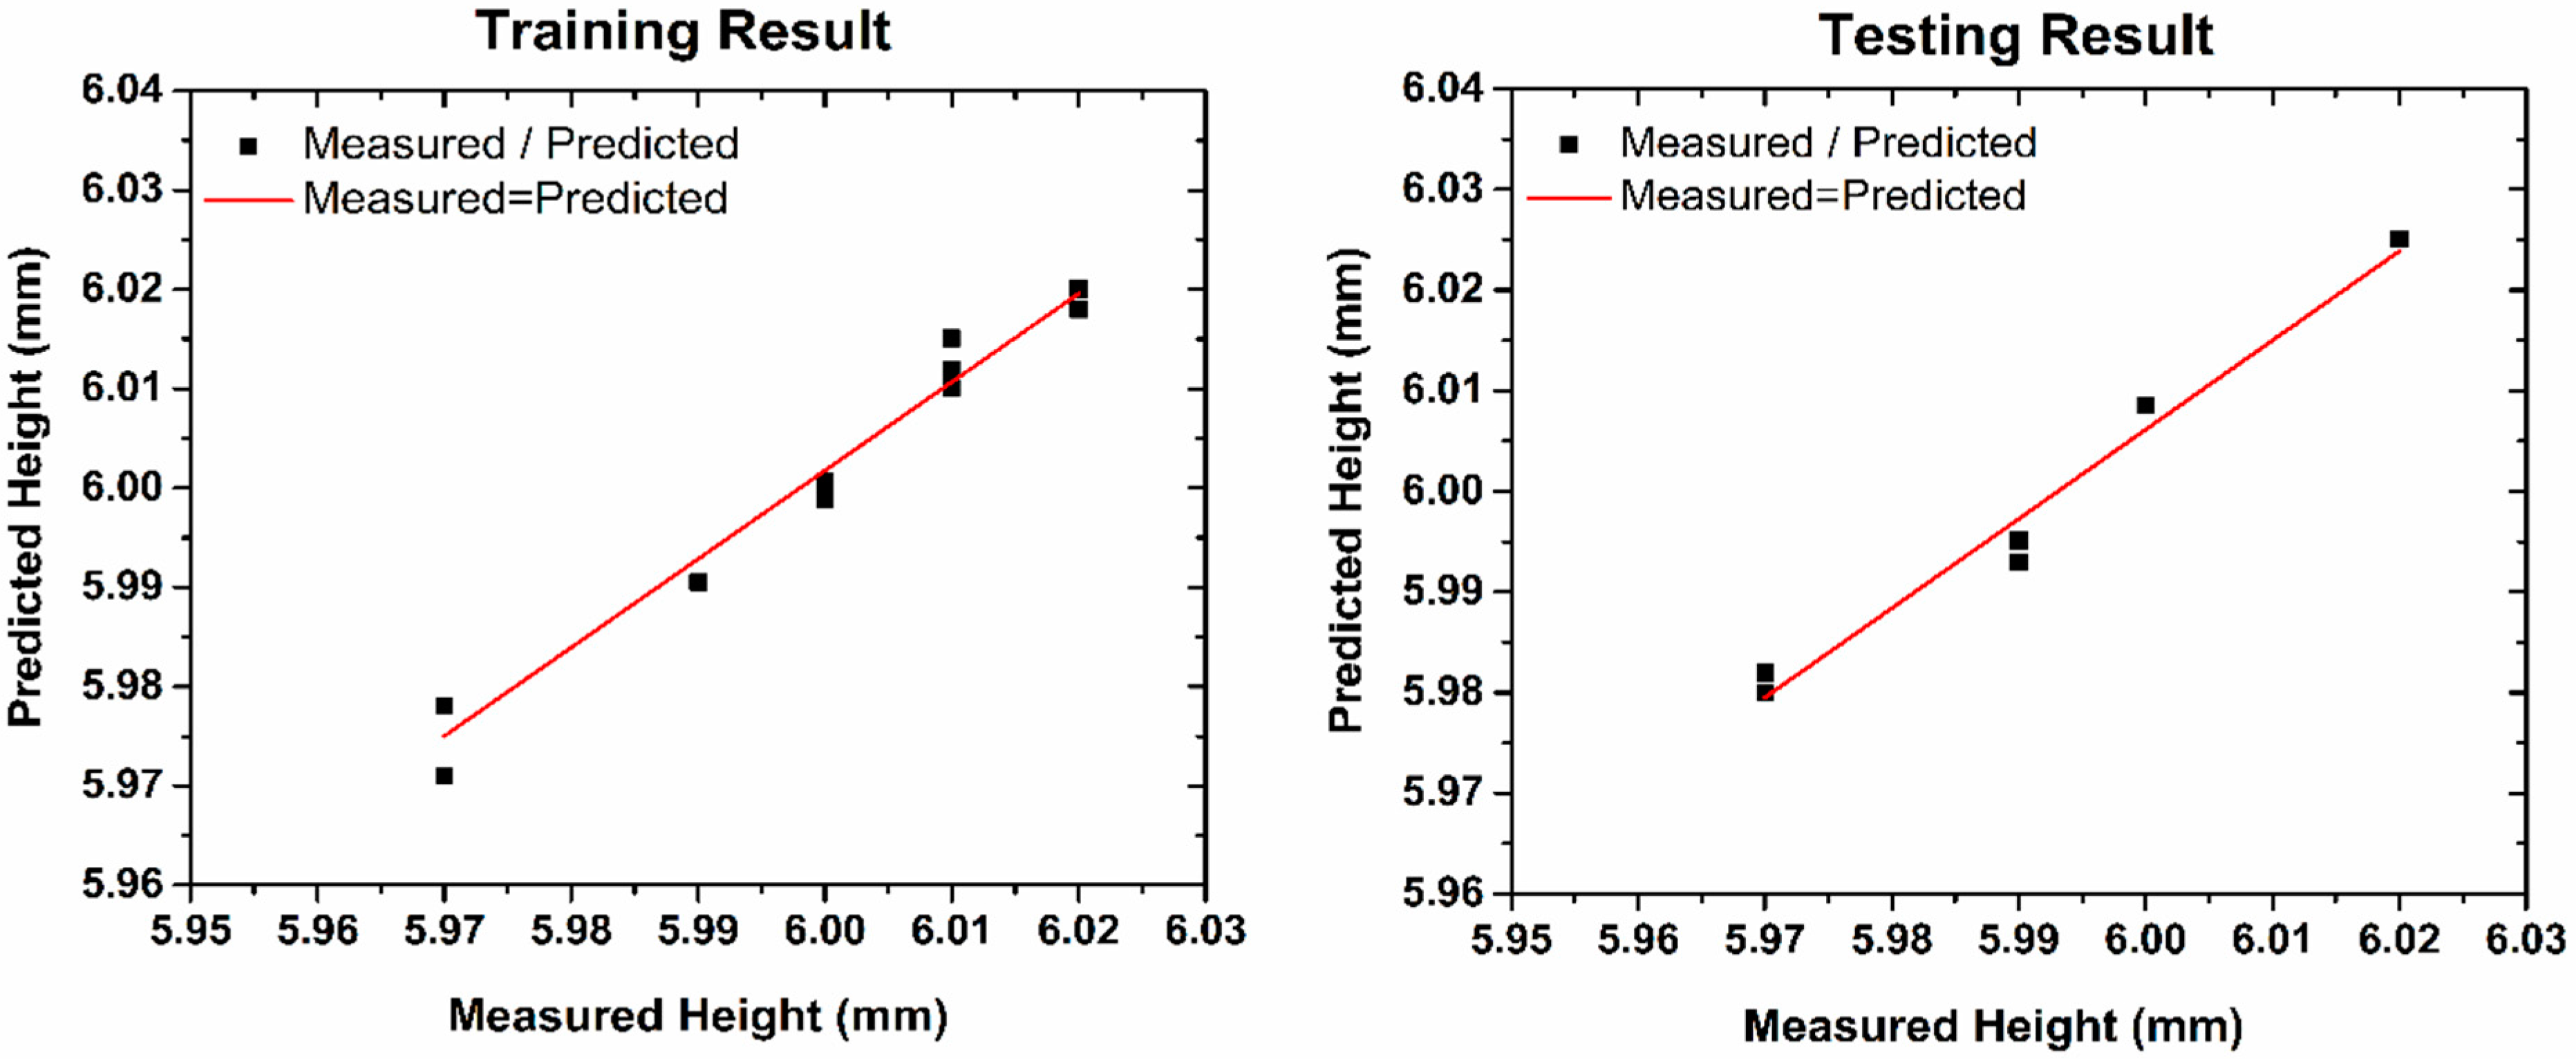
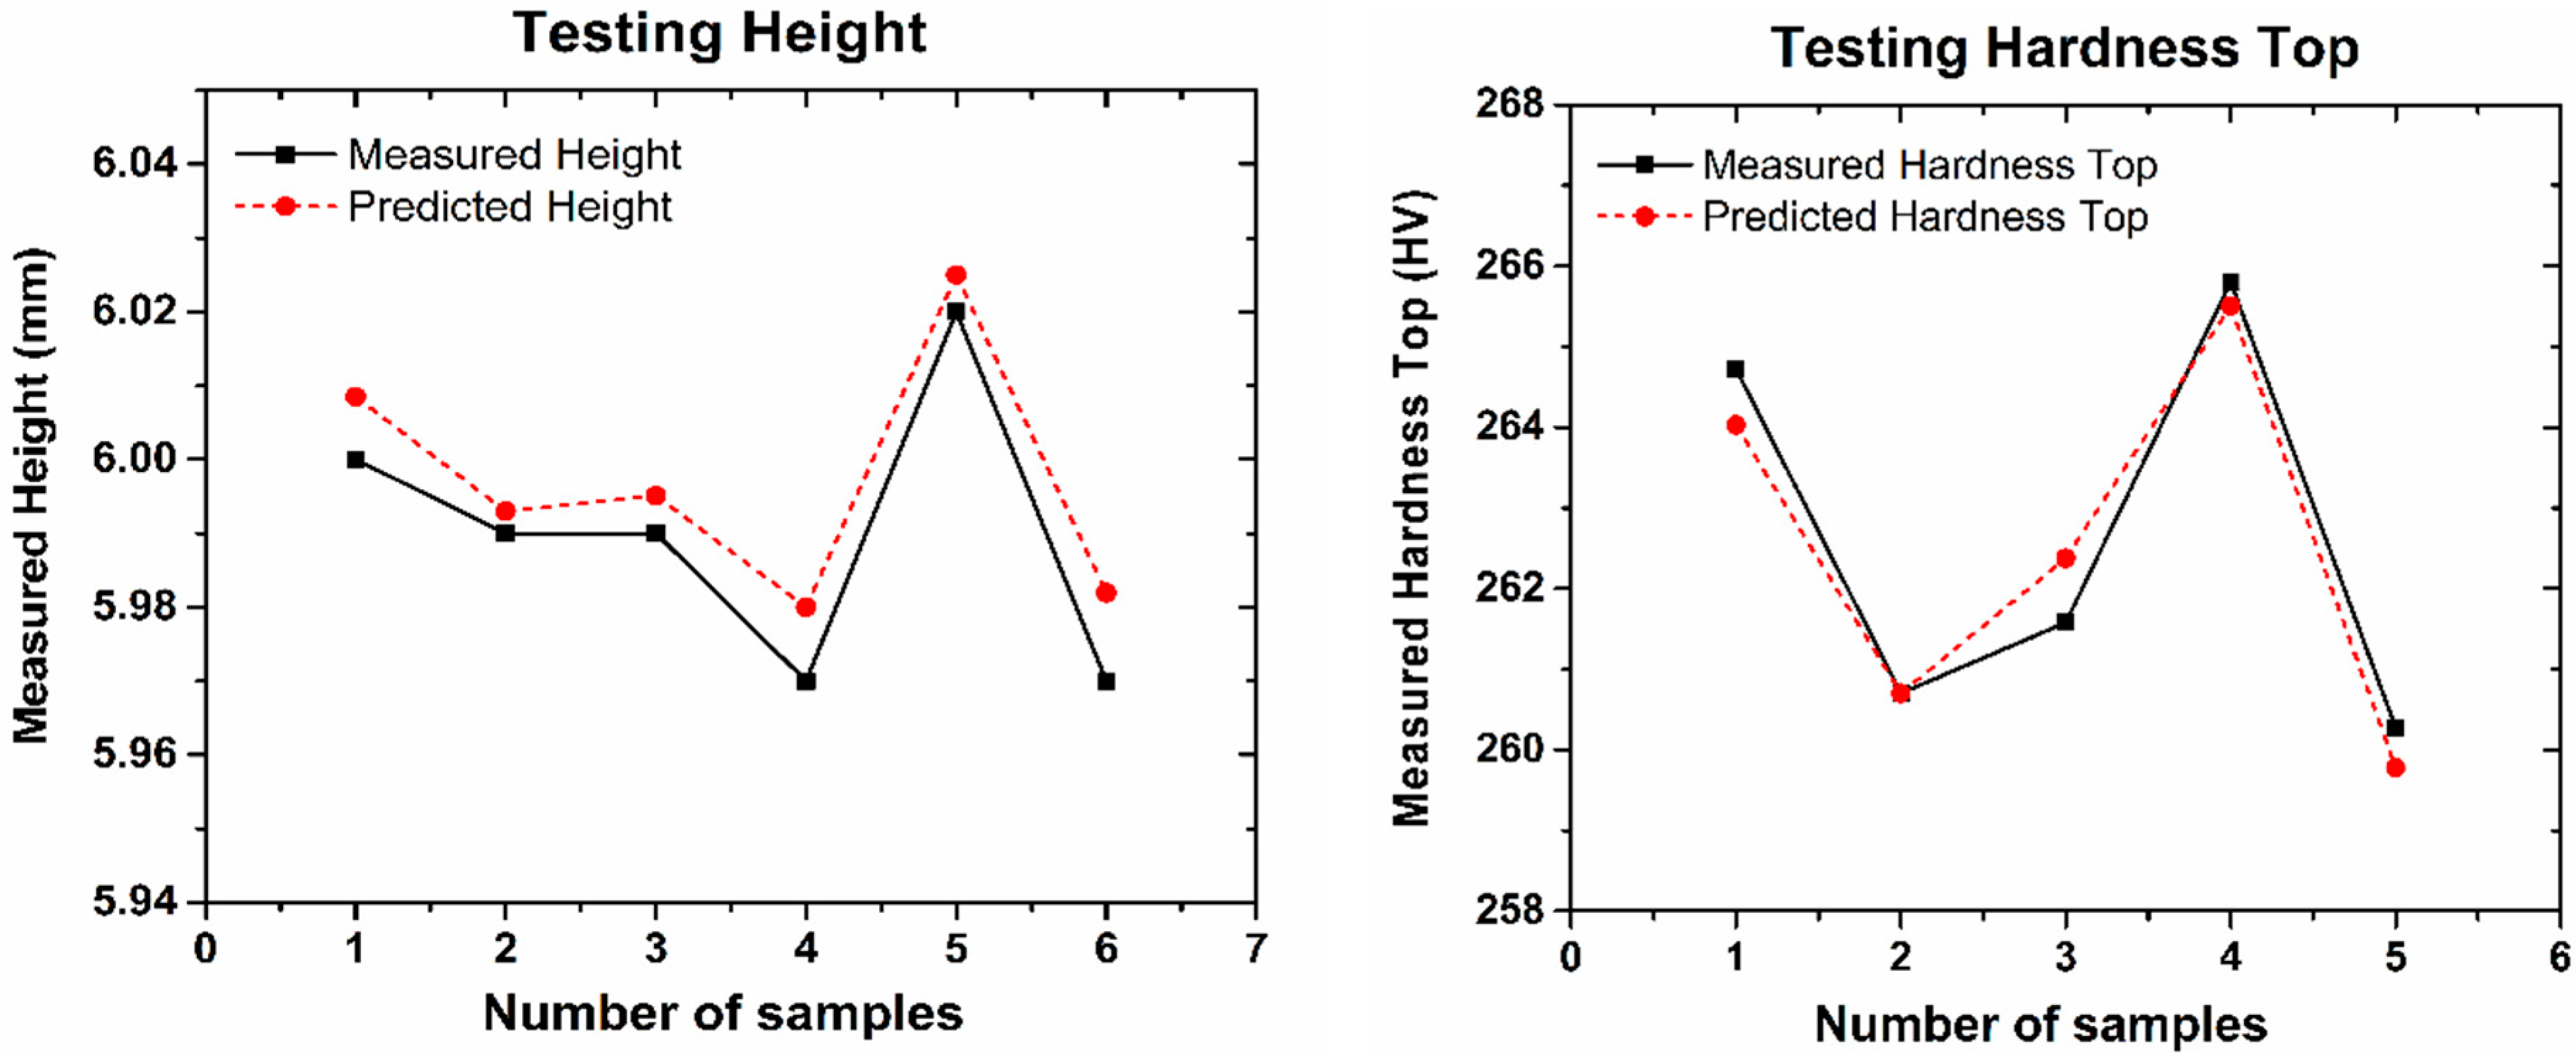
  • The ANN model, consisting of three inputs (LP, SS, HS) and two hidden layers, was employed to predict the height of the samples. Comparison between the measured and predicted sample heights in both training and testing phases proved the accuracy and capability of the applied algorithms in this study.
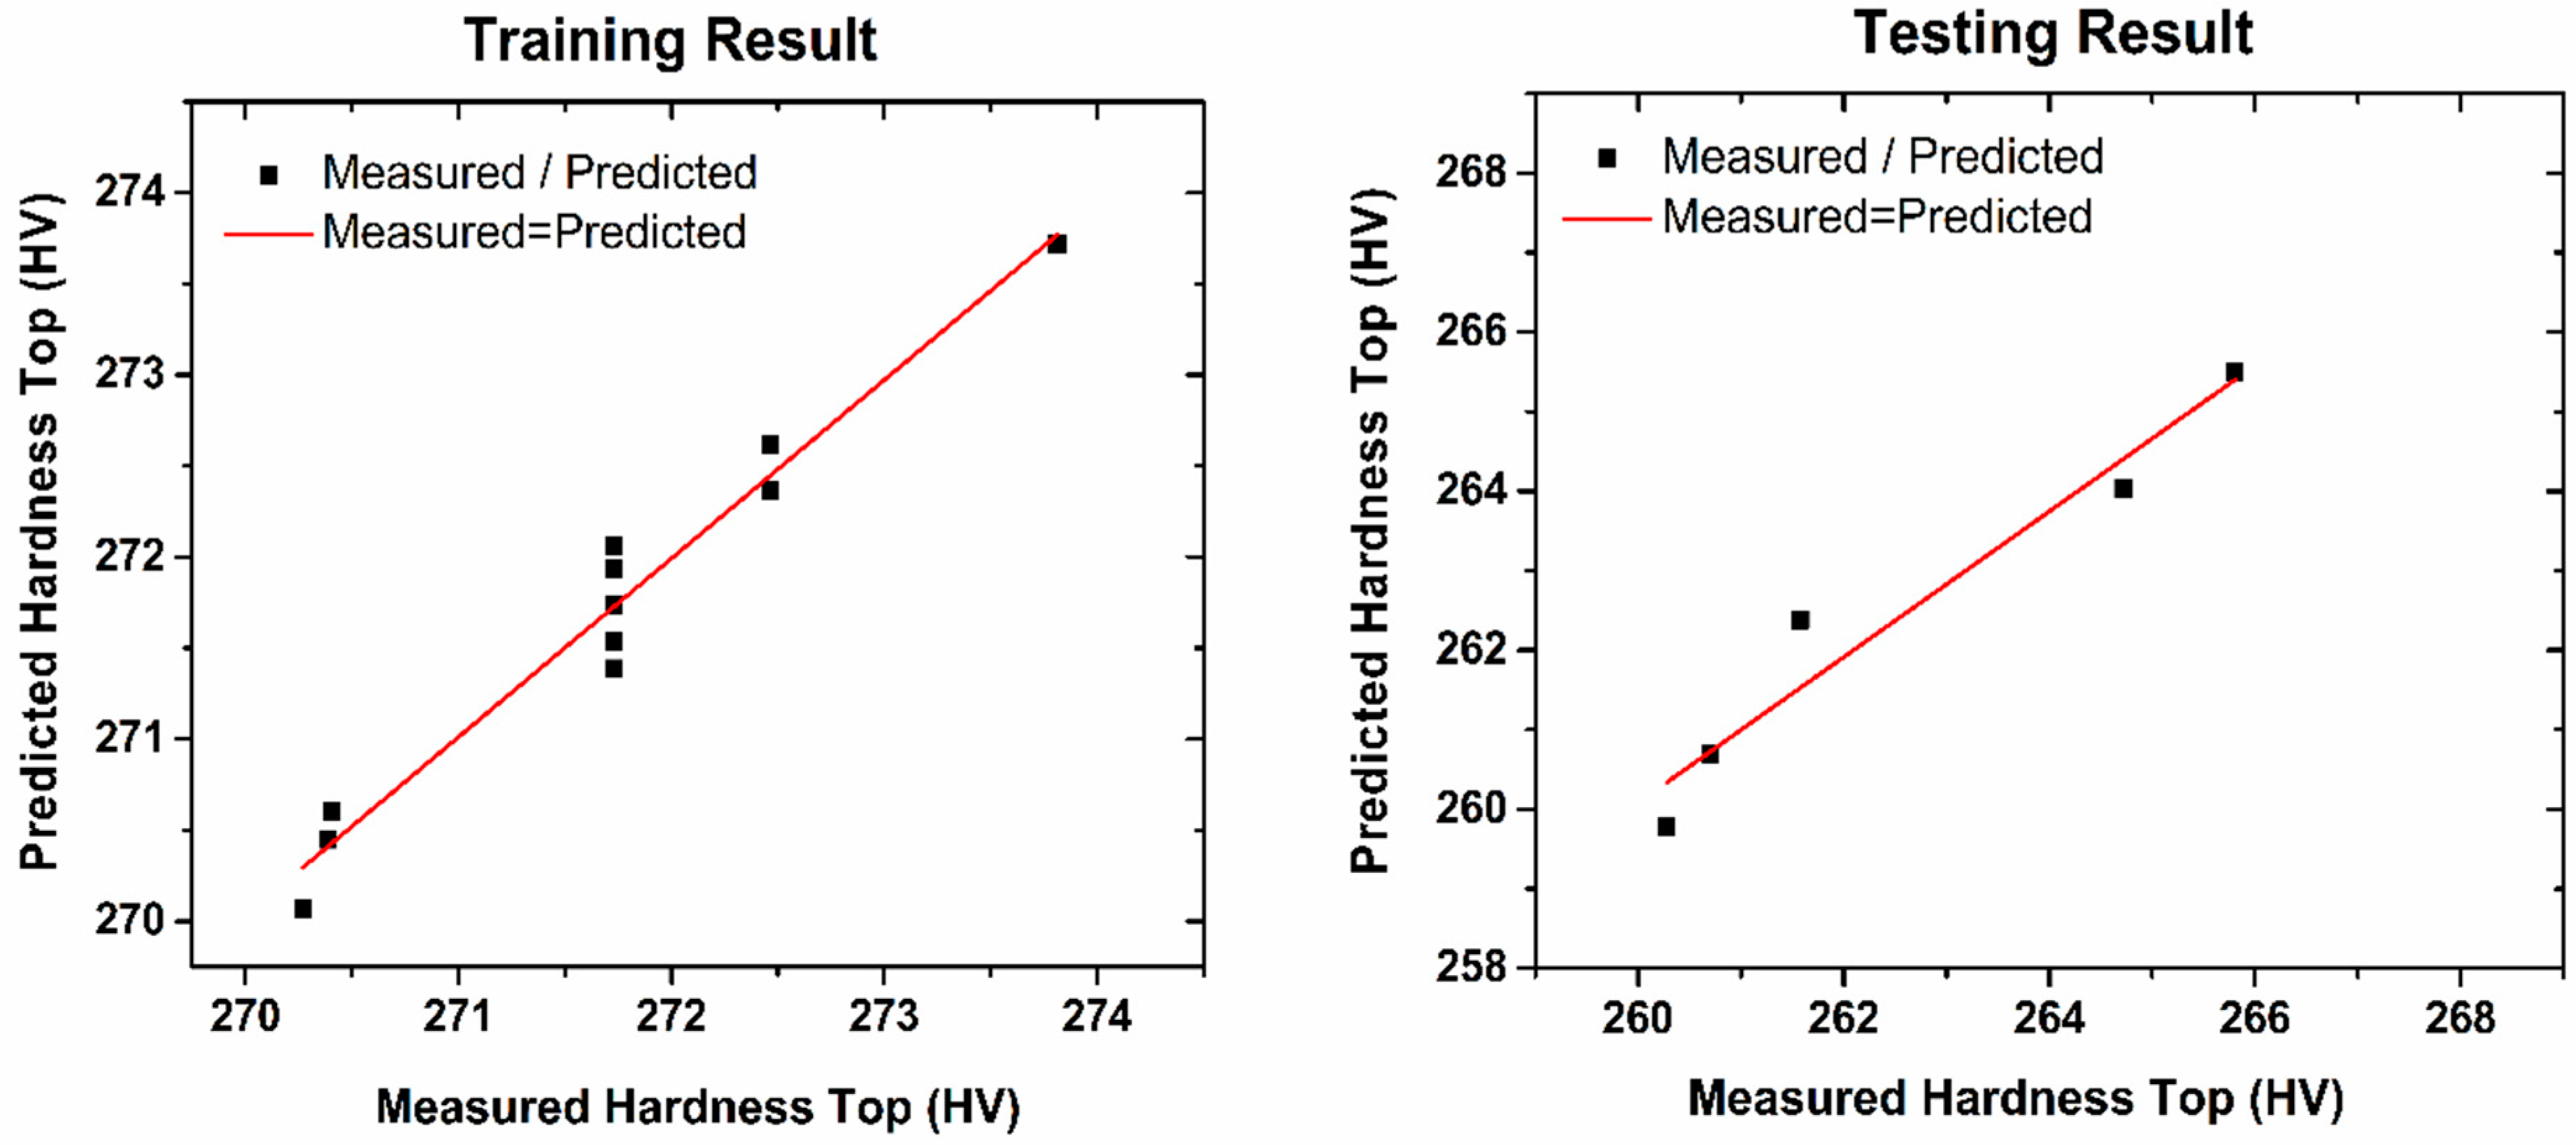
  • By comparing the measured and predicted hardness results, the ability of the proposed model to predict the output data was confirmed.
  • Overall, the results demonstrated a perfect fit between the measured and predicted data extracted by the model used in this study. The R2 index around 96–97%, achieved for both sample height and surface hardness, proved the reliability of the proposed ANN model.
The motivation of this study was to reveal the potential of the neural network model for predicting the output data in SLM manufacturing of the IN718 superalloy. This approach can be applied as an effective solution for predicting, controlling, and managing the input parameters—laser power, scanning speed, and hatch spacing—and can be a proper alternative to analytical and numerical models. This study employed, in particular, LM and BP algorithms in order to estimate the sample height and surface hardness of the printed IN718 samples. The ANN model was trained based on the experimental data, including both input and output data sets. The predicted parameters were evaluated based on the mean error approach and, in particular, the coefficient of determination. The results demonstrated a perfect fit between the measured and predicted data, which proved the reliability of this ANN model as the R2 index was about 96–97% for both sample height and surface hardness.

Author Contributions

Conceptualization, N.S.M., A.A. and M.M.; methodology, M.M.; software, M.M., A.R.; validation, B.B.R., A.R. and B.F.; formal analysis, B.B.R., A.R. and B.F.; investigation, B.B.R., A.R. and B.F.; resources, N.S.M., A.A. and M.M.; data curation, B.B.R. and A.R.; writing—original draft preparation, A.A. and M.M.; writing—review and editing, B.B.R., A.R. and B.F.; visualization, B.B.R., A.R. and B.F.; supervision, N.S.M., A.A. and M.M.; project administration, M.M.; funding acquisition, N.S.M. All authors have read and agreed to the published version of the manuscript.

Funding

This research was funded by University of Texas System STARs award.

Institutional Review Board Statement

Not applicable.

Informed Consent Statement

Not applicable.

Data Availability Statement

Not applicable.

Acknowledgments

This work was supported by a University of Texas System STARs award.

Conflicts of Interest

The authors declare no conflict of interest.

References

  1. Calandri, M.; Yin, S.; Aldwell, B.; Calignano, F.; Lupoi, R.; Ugues, D. Texture and Microstructural Features at Different Length Scales in Inconel 718 Produced by Selective Laser Melting. Materials 2019, 12, 1293. [Google Scholar] [CrossRef] [Green Version]
  2. Thomas, A.; El-Wahabi, M.; Cabrera, J.M.; Prado, J. High temperature deformation of Inconel 718. J. Mater. Process. Technol. 2006, 177, 469–472. [Google Scholar] [CrossRef]
  3. Pieraggi, B.; Uginet, J.F. Fatigue and creep properties in relation with alloy 718 microstructure. Superalloys 1998, 718, 535–544. [Google Scholar]
  4. Mostafa, A.; Rubio, I.P.; Brailovski, V.; Jahazi, M.; Medraj, M. Structure, Texture and Phases in 3D Printed IN718 Alloy Subjected to Homogenization and HIP Treatments. Metals 2017, 7, 196. [Google Scholar] [CrossRef] [Green Version]
  5. Ardila, L.; Garciandia, F.; González-Díaz, J.; Álvarez, P.; Echeverria, A.; Petite, M.; Deffley, R.; Ochoa, J. Effect of IN718 Recycled Powder Reuse on Properties of Parts Manufactured by Means of Selective Laser Melting. Phys. Procedia 2014, 56, 99–107. [Google Scholar] [CrossRef] [Green Version]
  6. Reed, R.C. The Superalloys: Fundamentals and Applications; Cambridge University Press: London, UK, 2009. [Google Scholar]
  7. Manikandan, S.; Sivakumar, D.; Kamaraj, M. Welding the Inconel 718 Superalloy; Elsevier Science: Amsterdam, The Netherlands, 2019; pp. 1–19. [Google Scholar]
  8. Deng, D. Additively Manufactured Inconel 718 Microstructures and Mechanical Properties; Linköping University Electronic Press: Linköping, Sweden, 2018. [Google Scholar]
  9. Cao, M.; Zhang, D.; Gao, Y.; Chen, R.; Huang, G.; Feng, Z.; Poprawe, R.; Schleifenbaum, J.H.; Ziegler, S. The effect of homogenization temperature on the microstructure and high temperature mechanical performance of SLM-fabricated IN718 alloy. Mater. Sci. Eng. A 2021, 801, 140427. [Google Scholar] [CrossRef]
  10. Gao, Y.; Zhang, D.; Cao, M.; Chen, R.; Feng, Z.; Poprawe, R.; Schleifenbaum, J.H.; Ziegler, S. Effect of δ phase on high temperature mechanical performances of Inconel 718 fabricated with SLM process. Mater. Sci. Eng. A 2019, 767, 138327. [Google Scholar] [CrossRef]
  11. Wang, Z.; Guan, K.; Gao, M.; Li, X.; Chen, X.; Zeng, X. The microstructure and mechanical properties of deposited-IN718 by selective laser melting. J. Alloys Compd. 2012, 513, 518–523. [Google Scholar] [CrossRef]
  12. Baicheng, Z.; Xiaohua, L.; Jiaming, B.; Junfeng, G.; Pan, W.; Chen-Nan, S.; Muiling, N.; Guojun, Q.; Jun, W. Study of selective laser melting (SLM) Inconel 718 part surface improvement by electrochemical polishing. Mater. Des. 2017, 116, 531–537. [Google Scholar] [CrossRef]
  13. Ni, M.; Chen, C.; Wang, X.; Wang, P.; Li, R.; Zhang, X.; Zhou, K. Anisotropic tensile behavior of in situ precipitation strengthened Inconel 718 fabricated by additive manufacturing. Mater. Sci. Eng. A 2017, 701, 344–351. [Google Scholar] [CrossRef]
  14. Tucho, W.; Cuvillier, P.; Sjolyst-Kverneland, A.; Hansen, V. Microstructure and hardness studies of Inconel 718 manufactured by selective laser melting before and after solution heat treatment. Mater. Sci. Eng. A 2017, 689, 220–232. [Google Scholar] [CrossRef]
  15. Yong, C.; Gibbons, G.; Wong, C.; West, G. A Critical Review of the Material Characteristics of Additive Manufactured IN718 for High-Temperature Application. Metals 2020, 10, 1576. [Google Scholar] [CrossRef]
  16. Wen, Y.; Xun, S.; Haoye, M.; Baichuan, S.; Peng, C.; Xuejian, L.; Kaihong, Z.; Xuan, Y.; Jiang, P.; Shibi, L. 3D printed porous ceramic scaffolds for bone tissue engineering: A review. Biomater. Sci. 2017, 5, 1690–1698. [Google Scholar] [CrossRef] [PubMed]
  17. Leary, M. Powder Bed Fusion. In Design for Additive Manufacturing; Leary, M., Ed.; Elsevier: Amsterdam, The Netherlands, 2020; Chapter 11; pp. 295–319. [Google Scholar]
  18. Caiazzo, F.; Alfieri, V.; Corrado, G.; Argenio, P. Laser powder-bed fusion of Inconel 718 to manufacture turbine blades. Int. J. Adv. Manuf. Technol. 2017, 93, 4023–4031. [Google Scholar] [CrossRef] [Green Version]
  19. Varela, J.; Merino, J.; Pickett, C.; Abu-Issa, A.; Arrieta, E.; Murr, L.E.; Wicker, R.B.; Ahlfors, M.; Godfrey, D.; Medina, F. Performance Characterization of Laser Powder Bed Fusion Fabricated Inconel 718 Treated with Experimental Hot Isostatic Processing Cycles. J. Manuf. Mater. Process. 2020, 4, 73. [Google Scholar] [CrossRef]
  20. Li, J.; Zhao, Z.; Bai, P.; Qu, H.; Liu, B.; Li, L.; Wu, L.; Guan, R.; Liu, H.; Guo, Z. Microstructural evolution and mechanical properties of IN718 alloy fabricated by selective laser melting following different heat treatments. J. Alloys Compd. 2019, 772, 861–870. [Google Scholar] [CrossRef]
  21. Mehrpouya, M.; Vosooghnia, A.; Dehghanghadikolaei, A.; Fotovvati, B. The benefits of additive manufacturing for sustainable design and production. In Sustainable Manufacturing; Gupta, K., Salonitis, K., Eds.; Elsevier: Amsterdam, The Netherlands, 2021; Chapter 2; pp. 29–59. [Google Scholar]
  22. Stender, M.E.; Beghini, L.L.; Sugar, J.D.; Veilleux, M.G.; Subia, S.R.; Smith, T.; Marchi, C.W.S.; Brown, A.A.; Dagel, D.J. A thermal-mechanical finite element workflow for directed energy deposition additive manacturing process modeling. Addit. Manuf. 2018, 21, 556–566. [Google Scholar] [CrossRef] [Green Version]
  23. Hovig, E.W.; Azar, A.S.; Grytten, F.; Sørby, K.; Andreassen, E. Determination of Anisotropic Mechanical Properties for Materials Processed by Laser Powder Bed Fusion. Adv. Mater. Sci. Eng. 2018, 2018, 7650303. [Google Scholar] [CrossRef] [Green Version]
  24. Ravichander, B.B.; Amerinatanzi, A.; Moghaddam, N.S. Study on the Effect of Powder-Bed Fusion Process Parameters on the Quality of as-Built IN718 Parts Using Response Surface Methodology. Metals 2020, 10, 1180. [Google Scholar] [CrossRef]
  25. Mehrpouya, M.; Dehghanghadikolaei, A.; Fotovvati, B.; Vosooghnia, A.; Emamian, S.S.; Gisario, A. The Potential of Additive Manufacturing in the Smart Factory Industrial 4.0: A Review. Appl. Sci. 2019, 9, 3865. [Google Scholar] [CrossRef] [Green Version]
  26. Arasu, I.; Chockalingam, K.; Kailasanathan, C.; Sivabharathy, M. Optimization of surface roughness in selective laser sintered stainless steel parts. Int. J. ChemTech Res. 2014, 6, 2993–2999. [Google Scholar]
  27. Goyal, B.; Goyal, B. A Review on Effect of Process Parameters on Surface Quality and Properties of Parts Realized by Selective Laser Sintering Process. In Proceedings of the International Conference on Ideas Impact and Innovation in Mechanical Engineering, Pune, India, 1–2 June 2017; pp. 45–51. [Google Scholar]
  28. Calignano, F.; Manfredi, D.; Ambrosio, E.P.; Iuliano, L.; Fino, P. Influence of process parameters on surface roughness of aluminum parts produced by DMLS. Int. J. Adv. Manuf. Technol. 2013, 67, 2743–2751. [Google Scholar] [CrossRef] [Green Version]
  29. Gong, H.; Rafi, H.K.; Karthik, N.V. Defect Morphology in Ti-6Al-4V Parts Fabricated by Selective Laser Melting and Electron Beam Melting. Mater. Eng. Perform 2013, 22, 3872–3883. [Google Scholar]
  30. Gisario, A.; Kazarian, M.; Martina, F.; Mehrpouya, M. Metal additive manufacturing in the commercial aviation industry: A review. J. Manuf. Syst. 2019, 53, 124–149. [Google Scholar] [CrossRef]
  31. Balbaa, M.; Mekhiel, S.; Elbestawi, M.; McIsaac, J. On selective laser melting of Inconel 718: Densification, surface roughness, and residual stresses. Mater. Des. 2020, 193, 108818. [Google Scholar] [CrossRef]
  32. Moussaoui, K.; Rubio, W.; Mousseigne, M.; Sultan, T.; Rezai, F. Effects of Selective Laser Melting additive manufacturing parameters of Inconel 718 on porosity, microstructure and mechanical properties. Mater. Sci. Eng. A 2018, 735, 182–190. [Google Scholar] [CrossRef] [Green Version]
  33. Kumar, P.; Farah, J.; Akram, J.; Teng, C.; Ginn, J.; Misra, M. Influence of laser processing parameters on porosity in Inconel 718 during additive manufacturing. Int. J. Adv. Manuf. Technol. 2019, 103, 1497–1507. [Google Scholar] [CrossRef]
  34. Mehrpouya, M.; Lavvafi, H.; Darafsheh, A. Microstructural Characterization and Mechanical Reliability of Laser-Machined Structures. Adv. Laser Mater. Process. 2018, 731–761. [Google Scholar] [CrossRef]
  35. Kang, J. Effect of laser power and scanning speed on the microstructure and mechanical properties of SLM fabricated Inconel 718 specimens. Mater. Sci. Eng. Int. J. 2019, 3, 3. [Google Scholar] [CrossRef] [Green Version]
  36. Amirjan, M.; Sakiani, H. Effect of scanning strategy and speed on the microstructure and mechanical properties of selective laser melted IN718 nickel-based superalloy. Int. J. Adv. Manuf. Technol. 2019, 103, 1769–1780. [Google Scholar] [CrossRef]
  37. Zhang, L.; Zhang, S.; Zhu, H.; Hu, Z.; Wang, G.; Zeng, X. Horizontal dimensional accuracy prediction of selective laser melting. Mater. Des. 2018, 160, 9–20. [Google Scholar] [CrossRef]
  38. Yang, K.V.; Rometsch, P.; Jarvis, T.; Rao, J.; Cao, S.; Davies, C.; Wu, X. Porosity formation mechanisms and fatigue response in Al-Si-Mg alloys made by selective laser melting. Mater. Sci. Eng. A 2017, 712, 166–174. [Google Scholar] [CrossRef]
  39. Read, N.; Wang, W.; Essa, K.; Attallah, M. Selective laser melting of AlSi10Mg alloy: Process optimisation and mechanical properties development. Mater. Des. 2015, 65, 417–424. [Google Scholar] [CrossRef] [Green Version]
  40. Aboulkhair, N.T.; Everitt, N.; Ashcroft, I.; Tuck, C. Reducing porosity in AlSi10Mg parts processed by selective laser melting. Addit. Manuf. 2014, 1–4, 77–86. [Google Scholar] [CrossRef]
  41. Hitzler, L.; Hirsch, J.; Merkel, M.; Hall, W.; Öchsner, A. Position dependent surface quality in selective laser melting. Mater. Werkst. 2017, 48, 327–334. [Google Scholar] [CrossRef] [Green Version]
  42. Maamoun, A.H.; Xue, Y.F.; Elbestawi, M.A.; Veldhuis, S.C. Effect of Selective Laser Melting Process Parameters on the Quality of Al Alloy Parts: Powder Characterization, Density, Surface Roughness, and Dimensional Accuracy. Materials 2018, 11, 2343. [Google Scholar] [CrossRef] [PubMed] [Green Version]
  43. Nguyen, Q.; Luu, D.; Nai, S.; Zhu, Z.; Chen, Z.; Wei, J. The role of powder layer thickness on the quality of SLM printed parts. Arch. Civ. Mech. Eng. 2018, 18, 948–955. [Google Scholar] [CrossRef]
  44. Prater, T. Prediction of Material Consolidation in In718 Produced Using Selective Laser Melting in the Higher Throughput Parameter Regime. In Proceedings of the Engineering Mechanics Institute Conference, the Université de Lorraine, Ile du Saulcy, Metz, France, 22–25 May 2016. [Google Scholar]
  45. Yi, J.; Kang, J.; Wang, T.; Wang, X.; Hu, Y.; Feng, T.; Feng, Y.; Wu, P. Effect of laser energy density on the microstructure, mechanical properties, and deformation of Inconel 718 samples fabricated by selective laser melting. J. Alloys Compd. 2019, 786, 481–488. [Google Scholar] [CrossRef]
  46. Huo, Y.-S.; Hong, C.; Li, H.-X.; Liu, P. Influence of different Processing Parameter on distortion and Residual Stress of Inconel 718 Alloys Fabricated by Selective Laser Melting (SLM). Mater. Res. 2020, 23. [Google Scholar] [CrossRef]
  47. Kuo, C.; Chen, Y.; Nien, Y. Effects of Energy Parameters on Dimensional Accuracy When Joining Stainless-Steel Powders with Heterogeneous Metal Substrates. Materials 2021, 14, 320. [Google Scholar] [CrossRef]
  48. Cao, L.; Li, J.; Hu, J.; Liu, H.; Wu, Y.; Zhou, Q. Optimization of surface roughness and dimensional accuracy in LPBF additive manufacturing. Opt. Laser Technol. 2021, 142, 107246. [Google Scholar] [CrossRef]
  49. Zhang, L.; Zhu, H.; Zhang, S.; Wang, G.; Zeng, X. Fabricating high dimensional accuracy LPBFed Ti6Al4V part by using bi-parameter method. Opt. Laser Technol. 2019, 117, 79–86. [Google Scholar] [CrossRef]
  50. Gisario, A.; Mehrpouya, M.; Rahimzadeh, A.; De Bartolomeis, A.; Barletta, M. Prediction model for determining the optimum operational parameters in laser forming of fiber-reinforced composites. Adv. Manuf. 2020, 8, 242–251. [Google Scholar] [CrossRef]
  51. Kwon, O.; Kim, H.G.; Ham, M.J.; Kim, W.; Kim, G.-H.; Cho, J.-H.; Kim, N.I.; Kim, K. A deep neural network for classification of melt-pool images in metal additive manufacturing. J. Intell. Manuf. 2020, 31, 375–386. [Google Scholar] [CrossRef]
  52. Khorasani, A.M.; Gibson, I.; Ghasemi, A.; Ghaderi, A. Modelling of laser powder bed fusion process and analysing the effective parameters on surface characteristics of Ti-6Al-4V. Int. J. Mech. Sci. 2020, 168, 105299. [Google Scholar] [CrossRef]
  53. Zhang, M.; Sun, C.-N.; Zhang, X.; Goh, P.C.; Wei, J.; Hardacre, D.; Li, H. High cycle fatigue life prediction of laser additive manufactured stainless steel: A machine learning approach. Int. J. Fatigue 2019, 128, 105194. [Google Scholar] [CrossRef]
  54. Mehrpouya, M.; Gisario, A.; Rahimzadeh, A.; Nematollahi, M.; Baghbaderani, K.S.; Elahinia, M. A prediction model for finding the optimal laser parameters in additive manufacturing of NiTi shape memory alloy. Int. J. Adv. Manuf. Technol. 2019, 105, 4691–4699. [Google Scholar] [CrossRef]
  55. Mehrpouya, M.; Gisario, A.; Nematollahi, M.; Rahimzadeh, A.; Baghbaderani, K.S.; Elahinia, M. The prediction model for additively manufacturing of NiTiHf high-temperature shape memory alloy. Mater. Today Commun. 2021, 26, 102022. [Google Scholar] [CrossRef]
  56. Ravichander, B.B.; Farhang, B.; Swails, N.; Amerinatanzi, A.; Moghaddam, N.S. Analysis of the deviation in properties of selective laser melted samples fabricated by varying process parameters. In Behavior and Mechanics of Multifunctional Materials IX; SPIE: Bellingham, DC, USA, 2020; Volume 11377, p. 113771A. [Google Scholar]
  57. Ravichander, B.B.; Favela, C.; Amerinatanzi, A.; Moghaddam, N.S. A framework for the optimization of powder-bed fusion process. In Behavior and Mechanics of Multifunctional Materials, SPIE, XV; SPIE: Bellingham, DC, USA, 2021; p. 11589. [Google Scholar] [CrossRef]
  58. Mirjalili, S.; Mirjalili, S.M.; Lewis, A. Let a biogeography-based optimizer train your multi-layer perceptron. Inf. Sci. 2014, 269, 188–209. [Google Scholar] [CrossRef]
  59. Hajian, A.; Styles, P. Application of Soft Computing and Intelligent Methods in Geophysics; Springer Science and Business Media LLC: Berlin/Heidelberg, Germany, 2018; pp. 71–198. [Google Scholar]
  60. Lourakis, M.; Argyros, A. The Design and Implementation of a Generic Sparse Bundle Adjustment Software Package Based on the Levenberg-Marquardt Algorithm; Technical Report 340; Institute of Computer Science-FORTH: Heraklion, Crete, Greece, 2004. [Google Scholar]
  61. Mehrpouya, M.; Gisario, A.; Huang, H.; Rahimzadeh, A.; Elahinia, M. Numerical study for prediction of optimum operational parameters in laser welding of NiTi alloy. Opt. Laser Technol. 2019, 118, 159–169. [Google Scholar] [CrossRef]
  62. Akbari, M.; Saedodin, S.; Panjehpour, A.; Hassani, M.; Afrand, M.; Torkamany, M.J. Numerical simulation and designing artificial neural network for estimating melt pool geometry and temperature distribution in laser welding of Ti6Al4V alloy. Optik 2016, 127, 11161–11172. [Google Scholar] [CrossRef]
  63. Mian, S.H.; Al-Ahmari, A. New developments in coordinate measuring machines for manufacturing industries. Int. J. Metrol. Qual. Eng. 2014, 5, 101. [Google Scholar] [CrossRef] [Green Version]
  64. Farhang, B.; Ravichander, B.B.; Venturi, F.; Amerinatanzi, A.; Moghaddam, N.S. Study on variations of microstructure and metallurgical properties in various heat-affected zones of SLM fabricated Nickel–Titanium alloy. Mater. Sci. Eng. A 2020, 774, 138919. [Google Scholar] [CrossRef]
  65. Dijmărescu, M.C. Estimation of Vickers hardness uncertainty for a heterogeneous welded joint (S235JR+AR and X2CrNiMo17-12-2). IOP Conf. Ser. Mater. Sci. Eng. 2017, 227, 012035. [Google Scholar] [CrossRef] [Green Version]
  66. Khorasani, A.M.; Gibson, I.; Awan, U.S.; Ghaderi, A. The effect of SLM process parameters on density, hardness, tensile strength and surface quality of Ti-6Al-4V. Addit. Manuf. 2019, 25, 176–186. [Google Scholar] [CrossRef]
  67. Pekok, M.A.; Setchi, R.; Ryan, M.; Han, Q.; Gu, D. Effect of process parameters on the microstructure and mechanical properties of AA2024 fabricated using selective laser melting. Int. J. Adv. Manuf. Technol. 2021, 112, 175–192. [Google Scholar] [CrossRef]
  68. Takaichi, A.; Suyalatu; Nakamoto, T.; Joko, N.; Nomura, N.; Tsutsumi, Y.; Migita, S.; Doi, H.; Kurosu, S.; Chiba, A.; et al. Microstructures and mechanical properties of Co–29Cr–6Mo alloy fabricated by selective laser melting process for dental applications. J. Mech. Behav. Biomed. Mater. 2013, 21, 67–76. [Google Scholar] [CrossRef]
  69. Seede, R.; Mostafa, A.; Brailovski, V.; Jahazi, M.; Medraj, M. Microstructural and Microhardness Evolution from Homogenization and Hot Isostatic Pressing on Selective Laser Melted Inconel 718: Structure, Texture, and Phases. J. Manuf. Mater. Process. 2018, 2, 30. [Google Scholar] [CrossRef] [Green Version]
Figure 1. Schematic of the neural network model.
Applsci 11 08010 g001
Figure 2. The influence of processing parameters on the height of the SLM-fabricated IN718 samples.
Applsci 11 08010 g002
Figure 3. The influence of processing parameters on the surface hardness of the SLM-fabricated IN718 samples.
Applsci 11 08010 g003aApplsci 11 08010 g003b
Figure 4. Comparison between the measured and the predicted heights in the training/testing phases.
Applsci 11 08010 g004
Figure 5. Comparison between the measured and the predicted hardness tops in the training/testing phases.
Applsci 11 08010 g005
Figure 6. The trends of testing samples for height (left) and hardness top (right).
Applsci 11 08010 g006
Table 1. Values of the process parameters used in this study.
Laser Power (W)Scan Speed (mm/s)Hatch Spacing (µm)Energy Density (J/mm3)
256.5864.099.075.0
256.5864.0121.061.3
313.5864.0121.075.0
237.1960.0110.056.1
285.0960.0110.067.5
313.5864.099.091.6
256.51056.0121.050.2
285.0960.091.581.1
285.0960.0110.067.5
332.9960.0110.078.8
313.51056.0121.061.3
285.0798.5110.081.1
285.0960.0110.067.5
285.01121.5110.057.8
285.0960.0110.067.5
285.0960.0110.067.5
313.51056.099.075.0
285.0960.0128.557.8
256.51056.099.061.3
285.0960.0110.067.5
Table 2. Characteristics of the selected network.
ElementValue
Activation functionsigmoid-sigmoid
Number of layers2
Number of neurons10-10
Data Davison percentage70-15-15
Number of epoch 1000
Type of learning ruleLM & BP
Type of codeMATLAB code
Software requirementMATLAB
Table 3. The statistical report of the linear regression in the training and testing phases (height).
Statistical ParametersTrainingTesting
Residual sum of squares7.267323.59455
Pearson’s r0.989510.98755
Coefficient of determination (R2)0.979120.97525
Adj. R-squared0.977040.96907
Table 4. The statistical report of linear regression in the training and testing phases (hardness top).
Statistical ParametersTrainingTesting
Residual sum of squares0.415910.96734
Pearson’s r0.981020.97897
Coefficient of determination (R2)0.962410.95839
Adj. R-squared0.958650.94452
Publisher’s Note: MDPI stays neutral with regard to jurisdictional claims in published maps and institutional affiliations.

