Article

Evaluation of Tribological Properties of Bearing Materials for Marine Diesel Engines Utilising the Contact Voltage Method

1
College of Energy and Power Engineering, Wuhan University of Technology, Wuhan 430063, China
2
National Engineering Laboratory for Power System of Marine & Ocean Engineering, Wuhan 430063, China
3
Key Laboratory of Marine Power Engineering and Technology, Ministry of Communication PRC, Wuhan 430063, China
*
Authors to whom correspondence should be addressed.
Appl. Sci. 2021, 11(17), 7811; https://doi.org/10.3390/app11177811
Submission received: 25 July 2021 / Revised: 23 August 2021 / Accepted: 24 August 2021 / Published: 25 August 2021

Abstract

:
The contact voltage (CV) method, which can detect miniature failures, has been tested under laboratory conditions to monitor the condition of bearings. In this study, the bearing materials for marine diesel engines, aluminium and copper alloy, were tested on a bearing fatigue wear test bench in the boundary lubrication state, which was found through tests of the different parameters. The frictional torque, the oil film thickness and the bearing temperature were measured, as well as the CV signals. The possibility of using the CV technique to monitor the condition of the bearings was also assessed by evaluating the tribological properties. After 10 h of the test, the aluminium alloy bearing was worn to the alloy layer. Then, the wear-reducing layer on the surface of the bearing slowly peeled off, and the wear was intensified. Due to its higher wear-resisting property, the amount of wear on the copper alloy bearing increased slowly. After 20 h of the fatigue wear test, the aluminium alloy bearing became severely worn, the CV characteristic was up to 81% of the initial value, the bearing temperature increased by 6.3%, and the torque value increased by 32%. This indicates that the CV method is more sensitive to wear failure. Due to better wear resistance, the copper alloy bearing showed only slightly wear and a small increase in its CV value. The main contribution is that the CV method is useful for monitoring the lubricated condition and for evaluating the tribological properties of bearings. This research has laid technical foundations for the engineering of the sliding bearing wear monitoring system based on the CV method.

1. Introduction

Marine diesel engines must endure continuously heavy loads; therefore, it is inevitable that they will experience increased frictional power consumption and wear. The frictional power loss caused by the bearing account for about 25% of total friction loss [1]. The main bearing of a marine diesel engine is subjected to cyclical alternating loads, and the main bearing is prone to excessive wear and axle holding failures, which seriously affect the safe operation of a vessel. On-line monitoring of wear on the main bearing of the engine would greatly improve reliability for a vessel.
Current methods for on-line monitoring include temperature monitoring, oil mist detection, the vibration method and oil analysis. The temperature method needs to perforate the back of the bearing [2,3]; the oil mist detection [4] and vibration methods [5,6,7,8,9] are not sensitive to failures; and the oil analysis technology [10] can only be used for monitoring the overall wear of the engine, but it cannot determine the specific worn part. Recently, more and more attention has been paid to deep-learning-based approaches with automatic feature learning capability. Shao, H. et al. built a new framework for rotor-bearing system fault diagnosis by using CNN with transfer learning [11]. Yu Zhang et al. built a data-driven model by Grey-box modelling, for studying the swirl characteristics in a gas turbine combustion system [12].
Sugumaran, V. et al. used PSVM to build a fault diagnosis system. The results show the effectiveness of the extracted features from the acquired signals in the diagnosis of the machine condition [13]. However, this approach needs to be based on sensitive signals. Therefore, these methods have certain limitations.
The CV methods are used to monitor the CV potential between the main bearing and the crankshaft. The main bearing and the main journal generate frictional heat due to hydrodynamic lubrication, and the generated heat makes more active free electrons on the main journal flow to the ground by the tunnel effect [14]. Therefore, there is a voltage between the crankshaft and the ground. A CV sensor is used to measure CV signals caused by wear of the main bearing, and this is analysed by extract characteristics to support on-line monitoring of the wear status of the main bearing. James et al. compared the calculated oil film thickness with the test CV signal and proposed that the CV signal can reflect the oil film thickness of the bearing [15]. Suzuki et al. took a four-cylinder diesel engine and tested the relationship between the bearing temperature, the axis orbit, and the contact potential, then verified the effectiveness of the contact potential for monitoring the bearing wear status [16]. Zhu Jun et al. designed a CV sensor and verified its potential contact signal with good repeatability, and then confirmed the effectiveness of the pyroelectric method in monitoring wear of the main bearing in marine diesel engines [17]. The wear characteristics of the main bearings of marine diesel engines are not only related to the inherent characteristics of the materials, but also relate to the characteristics of the mechanical system. This involves many factors, such as mechanical load, speed, working environment and properties of the materials. Therefore, a single factor friction test is required to analyse the influence of different working conditions on the characteristics of the bearing wear. Tadashi et al. used a rotor test bench to verify whether the CV methods could be used to evaluate the impact of bearing coatings on the performance of bearing lubrication, and proposed that the contact potential was more sensitive to changes in bearing lubrication performance than the friction coefficient [18]. Ohta et al. used acoustic emission, vibration, temperature and the CV signals to evaluate the state of the different bearing conditions and analysed the relationship between the various signals [19]. C. Priestner and Allmaier H. researched the fatigue wear test bed of the “sapphire” bearing bench and established an elastodynamic model (EHD) while considering the micro-bump model [20,21]. The bearing temperature parameters verified the accuracy of the model. They then analysed the influence of the load and the lubricating oil on the friction power consumption, the maximum peak pressure, and the minimum oil film thickness. The previous work proved that asperity contact could be accurately monitored using the contact potential, and the feasibility of using the contact potential to monitor the lubrication condition of a bearing was verified [22]. However, the relationship between the friction mechanism and the CV characteristic value has not been extracted and the relationship between the amount of wear and the CV signal has not been determined.
The three main contributions of this paper are:
(i).
The boundary lubrication state of aluminium and copper alloy bearings on the fatigue wear test bench were found through tests of the different parameters;
(ii).
The relationship between the CV signal of the different bearing materials and their friction characteristics was established;
(iii).
Compared with the torque and temperature, the CV potential was more sensitive to wear fault.
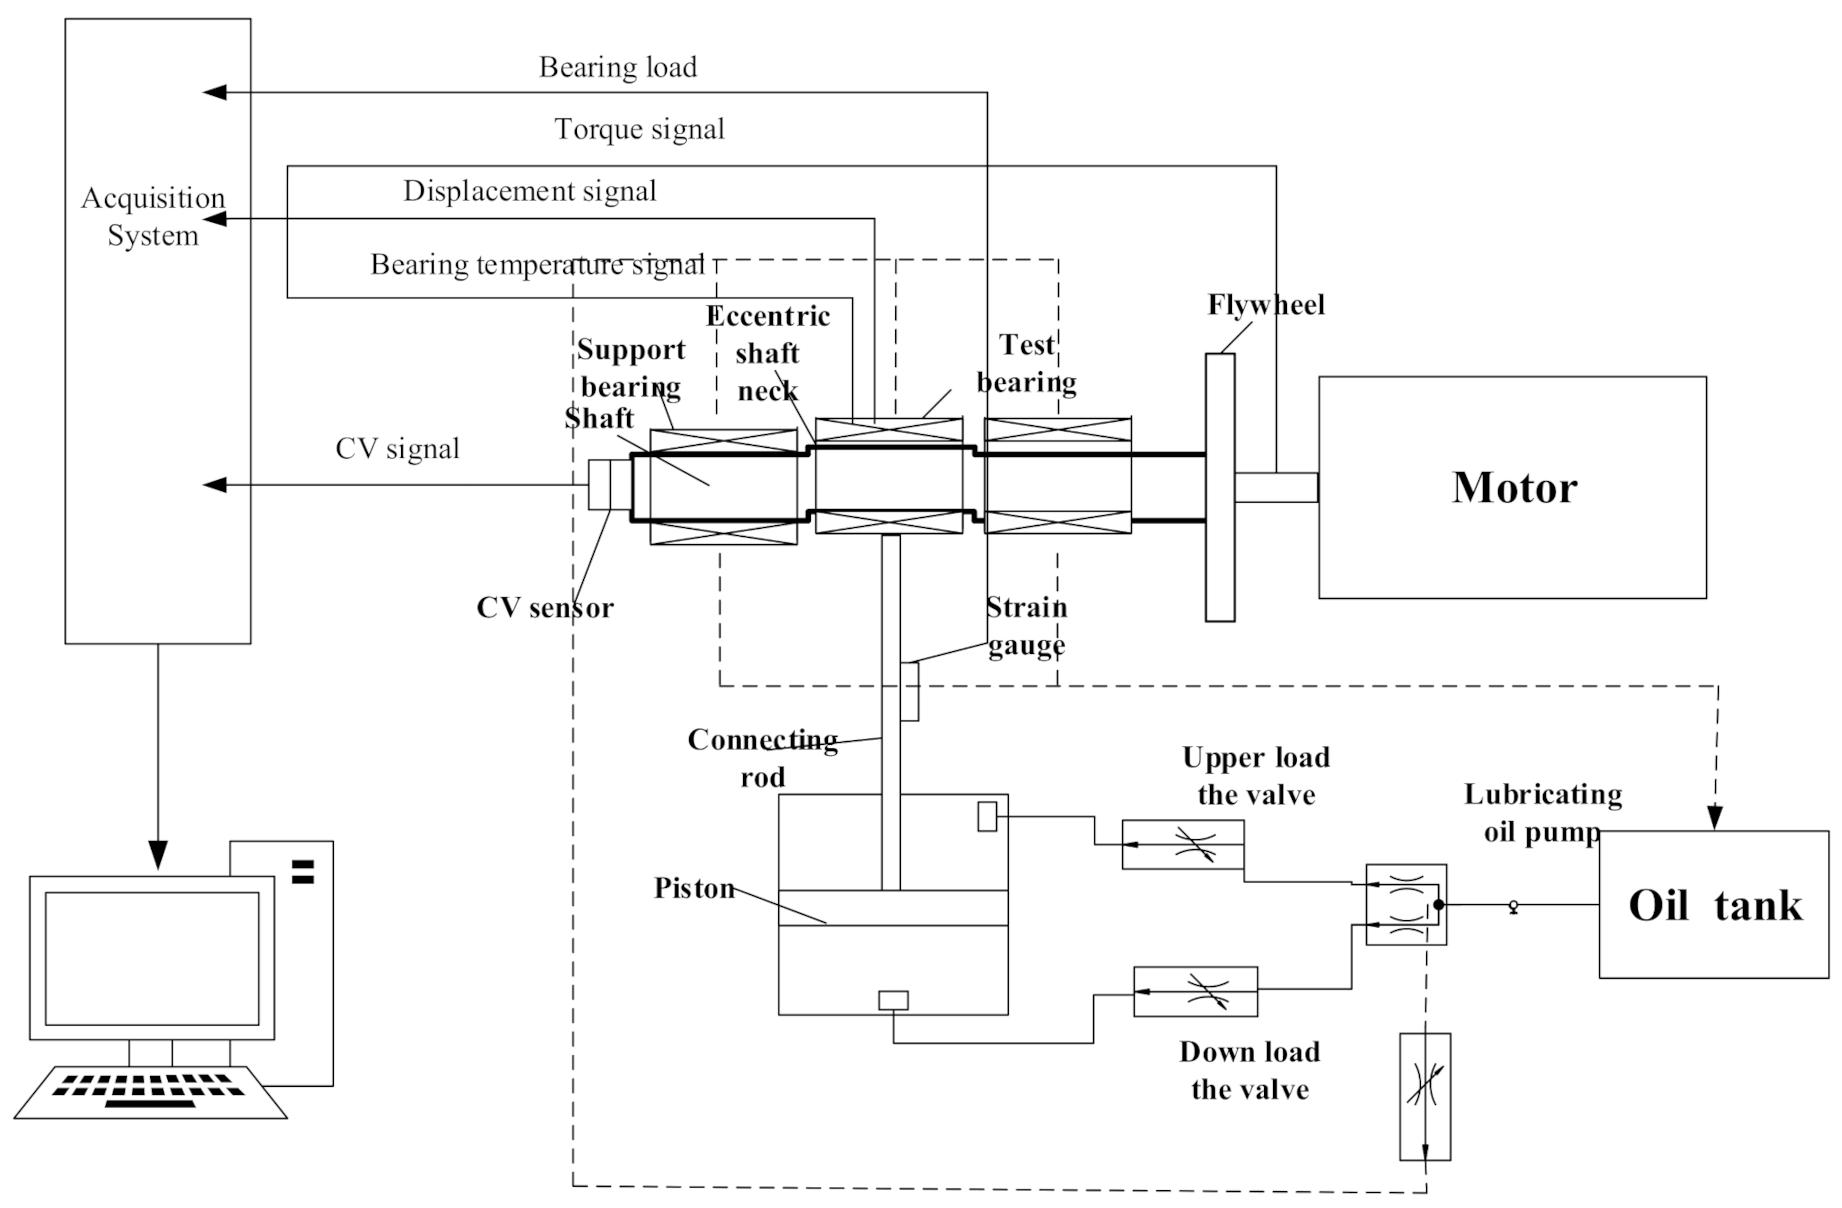
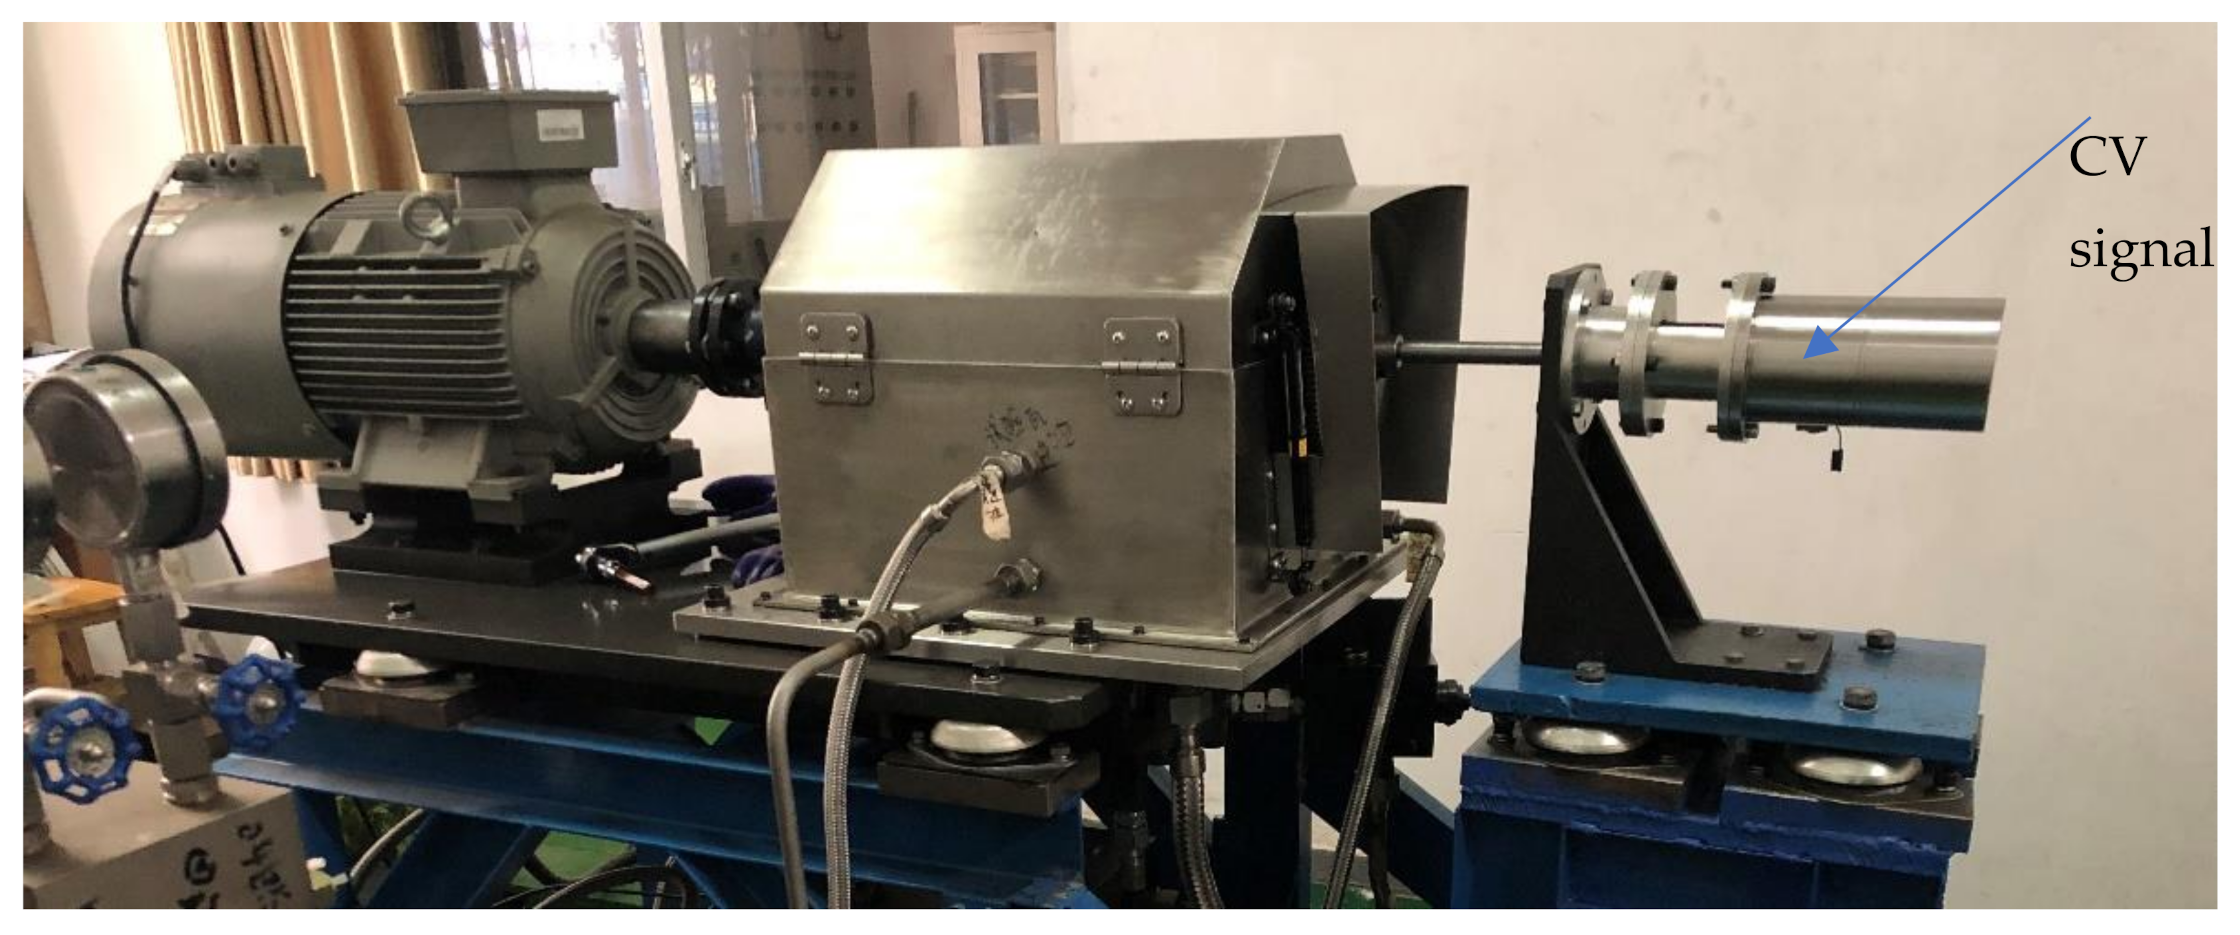
2. Experimental

The bearing fatigue test bench integrated the hydraulic lubrication system and the CV measurement system into a comprehensive performance test bench that could perform the tribology test and CV wear monitoring of the bearing. The test system schematic and an image are shown below, in Figure 1 and Figure 2, respectively.
A crank and connecting rod mechanism were used to simulate the working condition of the bearing on the test bench. This included the main motor, the coupling, the support and the test bearing seats, the eccentric crankshaft, the connecting rod, and the support and test bearings. The maximum speed of the shaft could be up to 3000 r/min, and the highest pressure of the test bearing was 150 MPa. The K-type armoured thermocouple was used to measure the temperature of the tile back. A pair of the eddy current displacement sensors, with a ±45° distribution, were used to measure the axis trajectory and the minimum oil film thickness [23]. The CV sensor measured the CV signals. Shell 10 w-30 Oil was used in the experiment.
Currently, copper and aluminium alloy bearings are mostly used in medium- and high-speed marine diesel engines. To consider the influence of metal materials on the CV characteristics of the bearing, the copper and aluminium alloy bearings were selected as test objects, the parameters for which are shown in Table 1.

3. Lubrication Characteristics Test

In actual working conditions, the internal flow field of the bearing is in a state of coupling of viscous dissipation (heat generated by friction), viscosity temperature of lubricating oil and lubricating oil flow. The bearing achieved thermal equilibrium in the coupling of various parameters, whereas the tribological and CV characteristics of the bearing varied in different states of thermal equilibrium.
Different working condition parameters correspond with the varying lubrication states of the bearing. A bearing in the boundary lubrication state is more prone to wear. Therefore, the lubrication test with the different parameters was conducted to discover the boundary lubrication state. This was followed by fatigue wear tests to study the relationship between wear and CV signals.
Related studies have shown that bearing lubrication is affected by many factors, such as thickness of the pad, load, speed, bearing alloy thickness, the inlet oil temperature, the initial load, and the feed oil pressure, where the inlet oil temperature and the load lubrication of the bearing have the greatest impact [24]. Boundary lubrication is a friction state between oil lubrication and dry friction [25]. A sudden change in the temperature of the bearing indicates that the bearing starts to enter the boundary state. With further increases in bearing load and oil inlet temperature, the bearing temperature will increase sharply. When the increasing speed of the bearing temperature decreases, the bearing is finished and leaves the boundary state, which could be considered as it entering the dry friction state. In order to create fatigue wear failure, the finishing point of boundary lubrication was taken to be the experimental state.

3.1. Variable Load Test

3.1.1. Test Programme

The load of the bearing determines the carrying capacity. The greater the load, the worse the lubrication state of the bearing. Considering the poor wear resistance of the aluminium alloy bearing, the initial load of the bearing was set to 10 MPa, and the load increased by 5 MPa until entering the boundary lubrication state for the test. When the bearing temperature of each load was found to be stable for 10 min, experimental data were recorded.

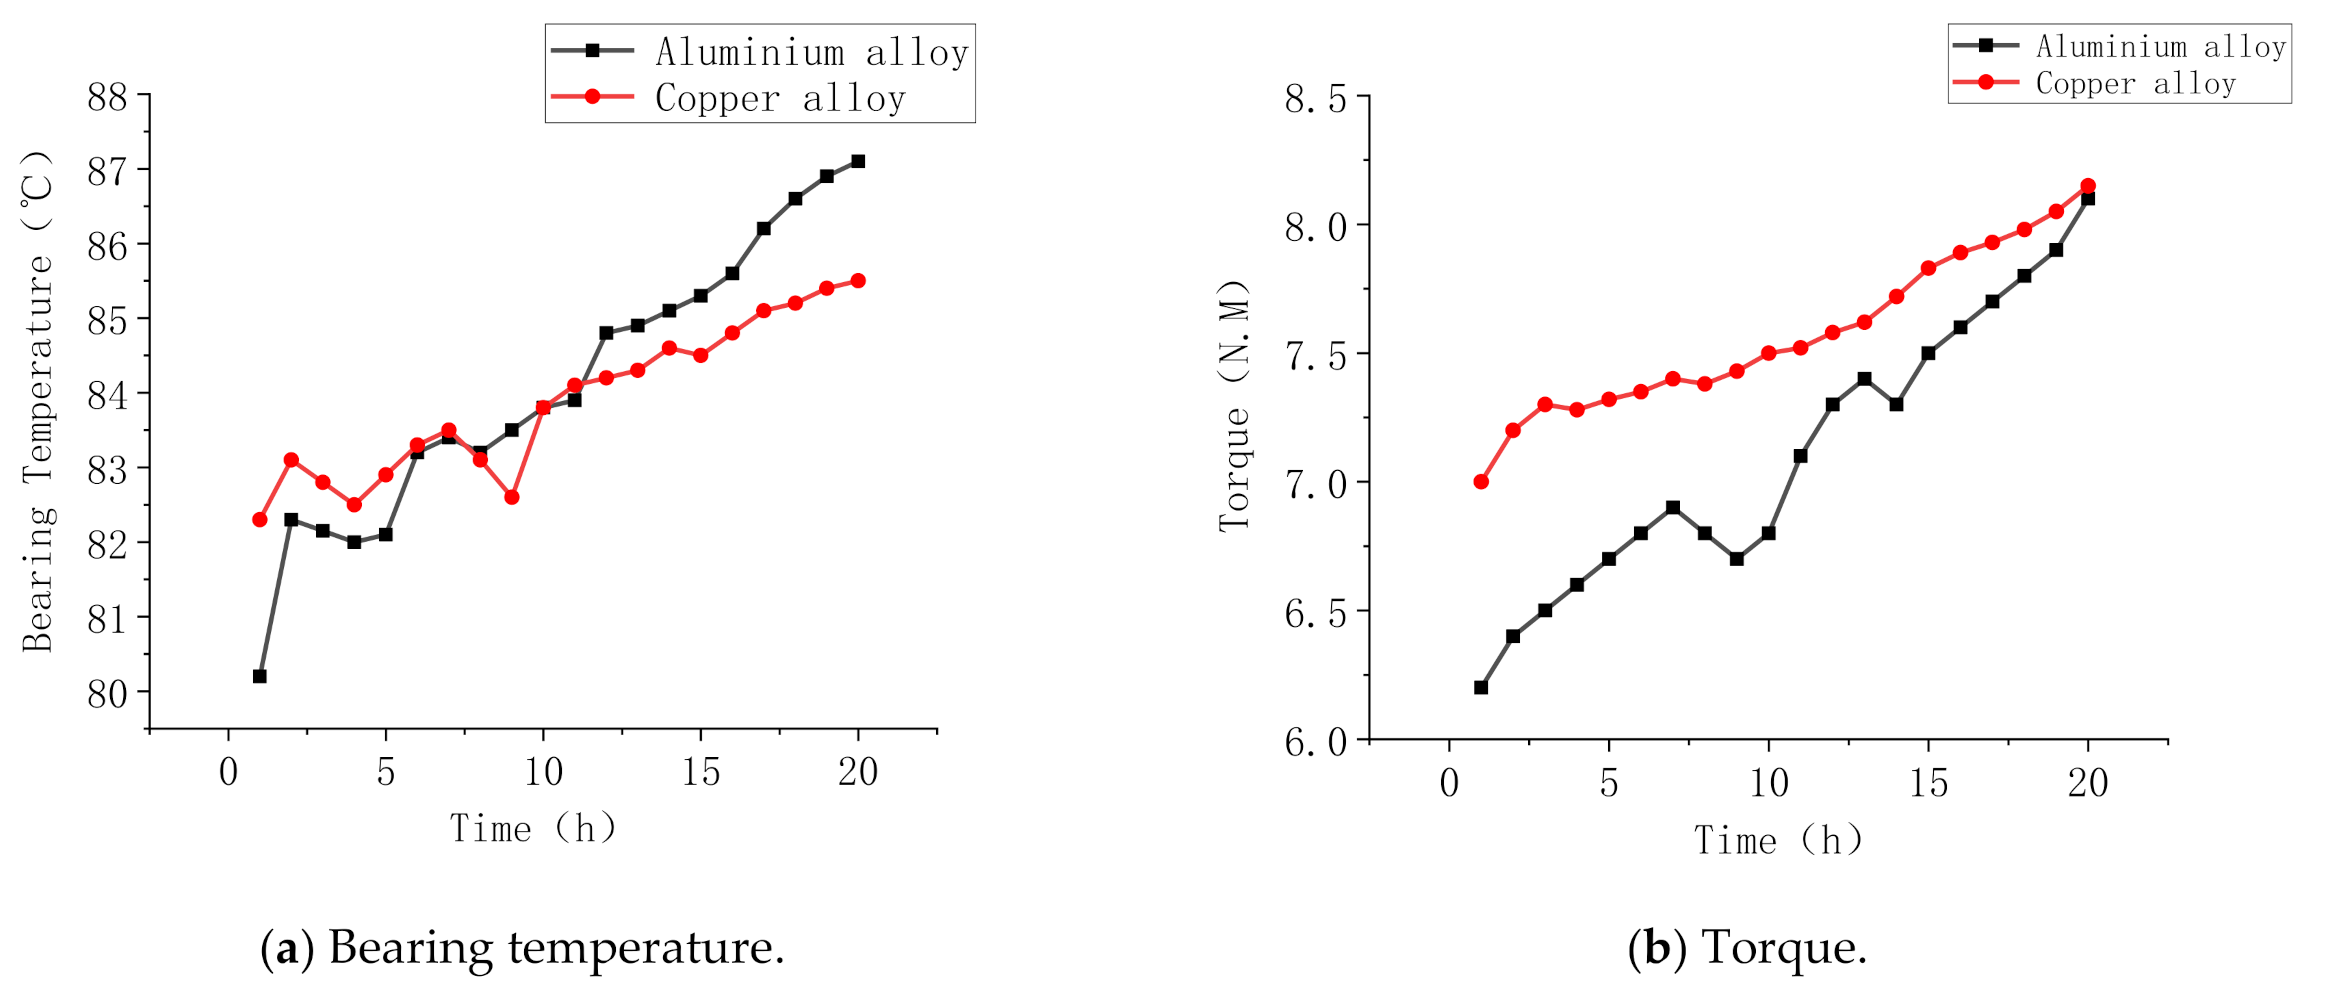
3.1.2. Lubrication Status Parameter Analysis

Figure 3 presents a comparison of the bearing temperature and torque of the two bearings in different loads. It shows that the bearing temperature of the materials rises with the increased bearing load. The bearing temperature of the aluminium alloy bearing began rising at 20 MPa, and it rose slowly with the increase in the load after the bearing load reached 35 MPa. The aluminium alloy bearing was at its boundary lubricating point when the bearing load was 35 MPa. This is because the temperature signal had a certain degree of thermal inertia; the torque signal is more sensitive to changes in bearing load; it rises with the increasing bearing load; and its increment slows down after reaching the boundary lubrication state.
The variations in the bearing temperature and the torque of the copper alloy bearing are basically the same as the aluminium alloy bearing. Due to the better wear performance of the copper alloy, the load of the boundary lubrication point reached 50 MPa. Aluminium alloy bearing shells have better thermal conductivity; therefore, more heat is transferred to the bearing seat through heat conduction. The torque and bearing temperature of the copper–lead alloy were higher in the boundary lubrication state, with the torque reaching up to 7.02 N·m, and the bearing temperature reaching 82.3 °C.

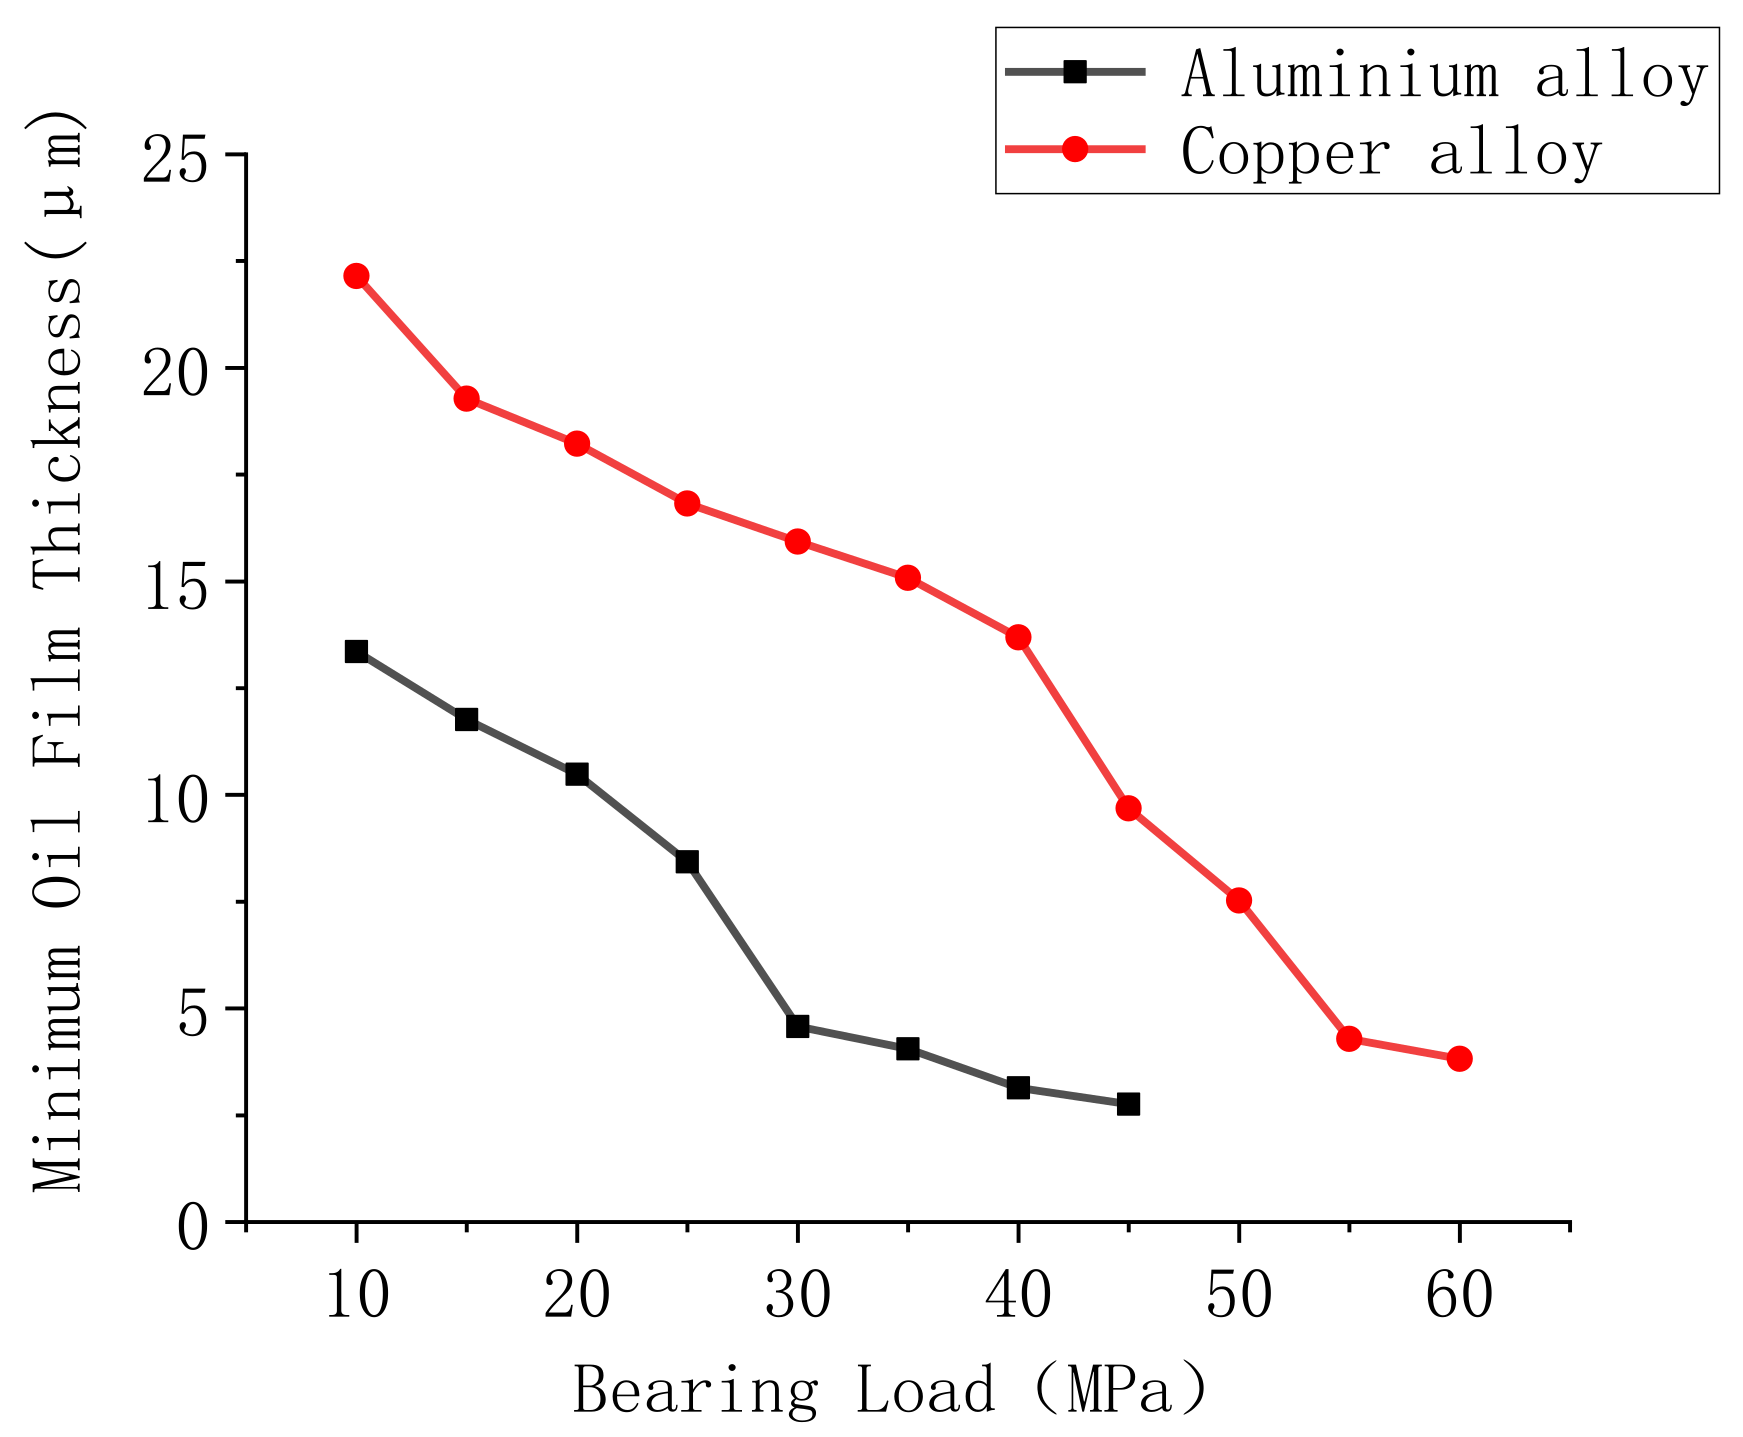
3.1.3. Minimum Oil Film Thickness Analysis

Figure 4 shows the curve of the oil film thickness of the two bearings at different bearing loads. It demonstrates that the oil film thickness was relatively stable. There are two peaks and valleys in the range of the 360° crank angle (CA), which are related to tension and compression pressure of the load.
Figure 5 displays the curve of the minimum oil film thickness of the two bearings. It shows that when the load of the bearing increased, the movement range of the shaft expanded, and the minimum oil film thickness became thinner. The minimum oil film thickness of the aluminium alloy bearing was reduced to less than 5 μm to reach the boundary lubrication state, whereas the minimum oil film thickness of the copper alloy bearing was reduced to less than 7 μm to reach the boundary lubrication state.

3.2. Variable Inlet Oil Temperature Test

3.2.1. Test Programme

Oil viscosity was lower when the temperature was rising, and this led to less bearing ability to carry the dynamic pressure of the oil film. Hence, the initial temperature of the lubricating oil was 50 °C, which kept the bearing at its optimum performance.
The test ran with a 10 °C increment each time, and the load was increased by 5 MPa until entering the boundary lubrication state for the test. Experimental data were recorded when the bearing temperature of bearing was stable for 10 min.
Based on the data provided by the variable load test, two materials were determined to be used in the variable inlet oil temperature test—the aluminium alloy bearing, set to 35 MP, and the copper alloy bearing, set to 50 MPa.

3.2.2. Lubrication Status Parameter Analysis

Figure 6 shows a comparison of the bearing temperature and the torque of the different oil inlet temperatures. It demonstrates that the bearing temperature and the torque of the bearing both increase when the inlet oil temperature rises. Due to the viscosity temperature effect of the lubricating oil, the frictional power consumption and the torque increased with the temperature of the inlet oil. The bearing temperature was more sensitive to the change in temperature than to the change in load. Due to the heat conduction effect, the bearing temperature increased sharply with the rise in the oil inlet temperature.
The copper alloy bearing had better wear resistance. Lead in the copper alloy increased its resistance to adhesion and resulted in better compliance and embeddedness. Therefore, its torque increased gently after entering the boundary lubrication state (70 °C).

3.2.3. Minimum Oil Film Thickness Analysis

Figure 7 shows that the bearing with an inlet oil temperature of 50 °C was in a good state of lubrication, and the fluctuation of its oil film thickness was small, which indicated the narrow movement of its axis. As the oil inlet temperature increased, the viscosity of the lubricating oil decreased, and the bearing capacity of the bearing reduced, which allowed it to fluctuate easily with the thickness of the oil film at the different crank angles.
Figure 8 shows that with the increase in the oil inlet temperature, the minimum oil film thickness of the two bearings decreased, and the minimum oil film thickness decreased slowly after reaching the boundary lubrication state.

4. Fatigue Wear Test

The oil inlet temperature and the bearing load in the boundary lubrication state were determined by the lubrication characteristic test. First, the lubricating oil pump and heater heated the lubricating oil to the specified temperature. The motor speed was then adjusted to 1500 r/min. Next, the bearing load was adjusted to the boundary lubrication load. The amount of bearing wear after the bench operated was measured every five hours. This step was repeated four times during the 20 h fatigue wear test.

4.1. Wear Evaluation Method

The worn surface morphology also varied with the different surface roughness of the bearing. In this study, the wear amount was evaluated by bearing thickness, clearance and roughness. A nine-point average method was used to evaluate the change in bearing wear. Considering the small radius of the curvature of the bearing, the thickness of the bearing was measured with a double-pointed micrometer. The clearance of the bearing was measured by the lead pressure method, whereas the surface roughness of the bearing was measured with a SJ-210 roughness meter (Mitutoyo, Kanagawa prefecture, Japan).

4.2. CV Signal Analysis Method

4.2.1. Repeatability Analysis of CV Signals

The CV signal is a weak electric signal with a strong background noise. It needs to be analysed and processed by signal filtering and equalising the crank angle. For example, take the instantaneous CV signal of a copper alloy bearing under 1500 r/min, 10 MPa working conditions to analyse the stability of measurement data. Figure 9 presents a continuous measurement of the CV signal for five cycles, the peak positions of which are the same, and the correlation coefficient of the pyroelectric signal is above 0.955, indicating that the pyroelectric signal has a good repeatability.

4.2.2. Extraction of CV Eigenvalues

Figure 10a shows the CV and bearing load signals. It can be seen from the bearing load signal that the bearing had an alternating load. In addition, the compression peaks and the tensile troughs appeared at 45° CA to 135° CA and 225° CA to 315° CA, respectively, which corresponded with the maximum compressive load and maximum tensile load of the connecting rod. Several studies have shown that the area where the bearing load is heavier is the easily wear-prone area [26], and the CV signal is more sensitive to the wear area of the bearing [27]. Figure 10b shows the CV signal and the oil film thickness signal. The moment when the oil film thickness is smaller corresponds with the peak value of the CV signal. When the oil film thickness is small, there is asperity contact between the bearing and the shaft, which leads to an increase in the CV signal.
Therefore, it can be considered that the CV value increases at the time when the bearing wears out. Considering that the average value reduces the contingency of the peak value, the average values of 45° CA to 135° CA and 225° CA to 315° CA are extracted as the characteristic value CV signals, which are the tensile eigenvalues and the compression eigenvalues, respectively.

4.3. Analysis of Fatigue Test Results

4.3.1. Analysis of Bearing Wear

Figure 11 shows images of the bearing with the different wear times. Following the fatigue wear test, the bearing surface is shown to have different degrees of wear. The wear resistance of the aluminium alloy bearing was poor, and the surface was badly worn. The bearing displayed severe strain and burn marks after 10 h of testing. The surface of the copper alloy bearing was ternary electroplated; therefore, the nickel alloy wear-reducing layer was formed, which had better wear resistance. There was no obvious alloy exposure phenomenon on the surface of the copper alloy bearing after the 20 h test.
Table 2 shows the results of the surface condition of the aluminium alloy bearing measured at different times. As the wearing time increased, the wear of the bearing increased. In Figure 12, the thickness of the bearing decreased by 0.11 mm, and the bearing gap increased by 0.10 mm in the first 10 h. The thickness decreased by 0.09 mm from hours 10 to 15, and the bearing gap increased by 0.08 mm. The thickness decreased by 0.14 mm from hours 15 to 20, and the bearing clearance increased by 0.14 mm. The image of the aluminium alloy bearing showed that following the 10 h fatigue wear test, the wear-reducing layer of the bearing was slowly peeling off. After the bearing was worn to the alloy layer, the wear amount increased more obviously, and severe wear of the bearing could be determined.
Table 3 shows the results of the surface condition of the copper alloy bearing measured at different times. As the fatigue wear test time increased, the wear of the copper alloy bearing also increased. Figure 12 shows how the wear amount of the copper alloy increased slowly. With better wear resistance, the wear-reducing layer of the copper alloy bearing was still there, and there was no peeling of the alloy layer. After 20 h of the wear test, the bearing clearance only increased by 0.012 mm, and the thickness of the lower was reduced by 0.010 mm. The hardness of the copper alloy was lower, and its surface roughness increased by 1.545 μm.

4.3.2. Analysis of Bearing Lubrication Parameters

Figure 13 presents a comparison of the bearing lubrication parameters for the different bearings with varying wear test durations. As the wear time increases, the torque and the bearing temperature signals show an upward trend. Combined with the measurements of wear amount, it can be seen that the wear amount of the aluminium alloy bearing increased in the third and fourth hours of the five-hours wear test. This is because the poor lubrication state increased friction power consumption, and the corresponding bearing temperature and torque increased significantly. However, the torque and bearing temperature of the copper alloy bearing increased slightly, indicating its good abrasion resistance.
Figure 14 shows a comparison of the oil film thickness of the different bearings. With the extension of the fatigue wear test time, the oil film thickness of the aluminium alloy bearing varied greatly, in the range of 5~160 μm. The copper alloy had the better wear resistance, and its oil film thickness was relatively stable, with small fluctuations in the range of 5~98 μm.
Figure 15 presents a comparison of the minimum oil film thickness of the different wear test durations. As the fatigue wear test progressed, the minimum oil film thickness of the two bearings decreased. When the bearing was severely worn, the minimum oil film thickness was below 5 μm.

4.3.3. CV Signals

It can be seen in Figure 16 that the CV of the copper alloy bearing was relatively high. This was due to the Seebeck coefficient of the copper alloy being positive, whereas the Seebeck coefficient of the aluminium alloy is negative. However, because the material of the main shaft was mainly steel—the Seebeck coefficient of steel is also negative—therefore, the Cu–Fe CV potential was more active than the Al–Fe CV potential, resulting in the copper alloy bearing having a higher CV potential. With the extension of the fatigue wear test time, the CV characteristic value of the aluminium alloy bearing rose, and when the aluminium alloy bearing was seriously worn out, the average values of the CV signals increased as a whole. Not only did the bearing load increase at the time when the bearing load was at its maximum, but the CV signals at other times also increased. Due to the better wear resistance of the copper alloy bearing, its CV amplitude increased less.
It can be seen from Figure 17 that with the extension of the bearing wear time, the CV characteristic values show an upward trend. Due to the larger wear amount of the aluminium alloy bearing, the CV characteristic value of this bearing increased significantly, from around 2.25 mv at the beginning to around 4.1 mv. The CV characteristic value of the aluminium alloy bearing increased by 95%, whereas the CV characteristic value of the copper alloy bearing only rose by 50%.
From Figure 18, it can be observed that with the increase in the bearing clearance, the increase in CV signal, bearing temperature and torque showed an upward trend. For the aluminium alloy bearing, when the clearance increased by 0.010 mm, the aluminium alloy bearing began to wear out. The CV characteristic value increased by 46.3%, whereas the temperature signal and torque signal only increased by 5.1% and 11%, respectively. Along with the progress of the test, the wear amount further increased because the bearing was in the boundary lubrication state. When the wear amount reached 0.20 mm, the CV characteristic value increased by 63.6%, the torque signal increased by 20%, but the temperature signal did not increase significantly. When the test reached the end, the clearance increased by 0.035 mm and the CV characteristic value of the aluminium alloy increased significantly, up to 81%, whereas the bearing temperature rose by 6.3% and the torque value increased by 32%. However, for the copper alloy bearing with better wear resistance, the CV characteristic value increased by 50%, the bearing temperature of the aluminium alloy increased by 3.8%, and the torque value rose by 16%. This shows that the CV tensile characteristic value increase is more sensitive than the bearing temperature and the torque increase.

5. Conclusions

In this study, bearings of different materials were used as research objects. The boundary lubrication states of the aluminium alloy and the copper alloy bearings were determined through lubrication characteristic tests. This was followed by a 20 h boundary lubrication state bearing fatigue wear test to establish the relationship between the CV signal characteristics and the friction characteristics. The following conclusions are obtained from the research:
  • The lubrication state of the bearing is mainly affected by the lubricating oil inlet temperature and the load. The temperature and the torque of the bearing increase with an increase in the bearing load. However, the increasing rate of the bearing temperature is lower due to the influence of thermal inertia. The load of the aluminium alloy bearing and the copper alloy bearing reached 35 MPa and 50 MPa, respectively, the lubricating oil inlet temperature was 70 °C, and the bearing entered the boundary lubrication state;
  • A 20 h bearing fatigue wear test conducted in the boundary lubrication state demonstrated that the amount of wear increased with an extension of the bearing wear test time, and the wear amount of the aluminium alloy bearing was greater after 10 h. The wear-reducing layer on the surface of the bearing gradually peeled off, and the wear on the bearing was intensified. The wear on the copper alloy bearing increased slowly, and its wear resistance was better than the aluminium alloy bearing;
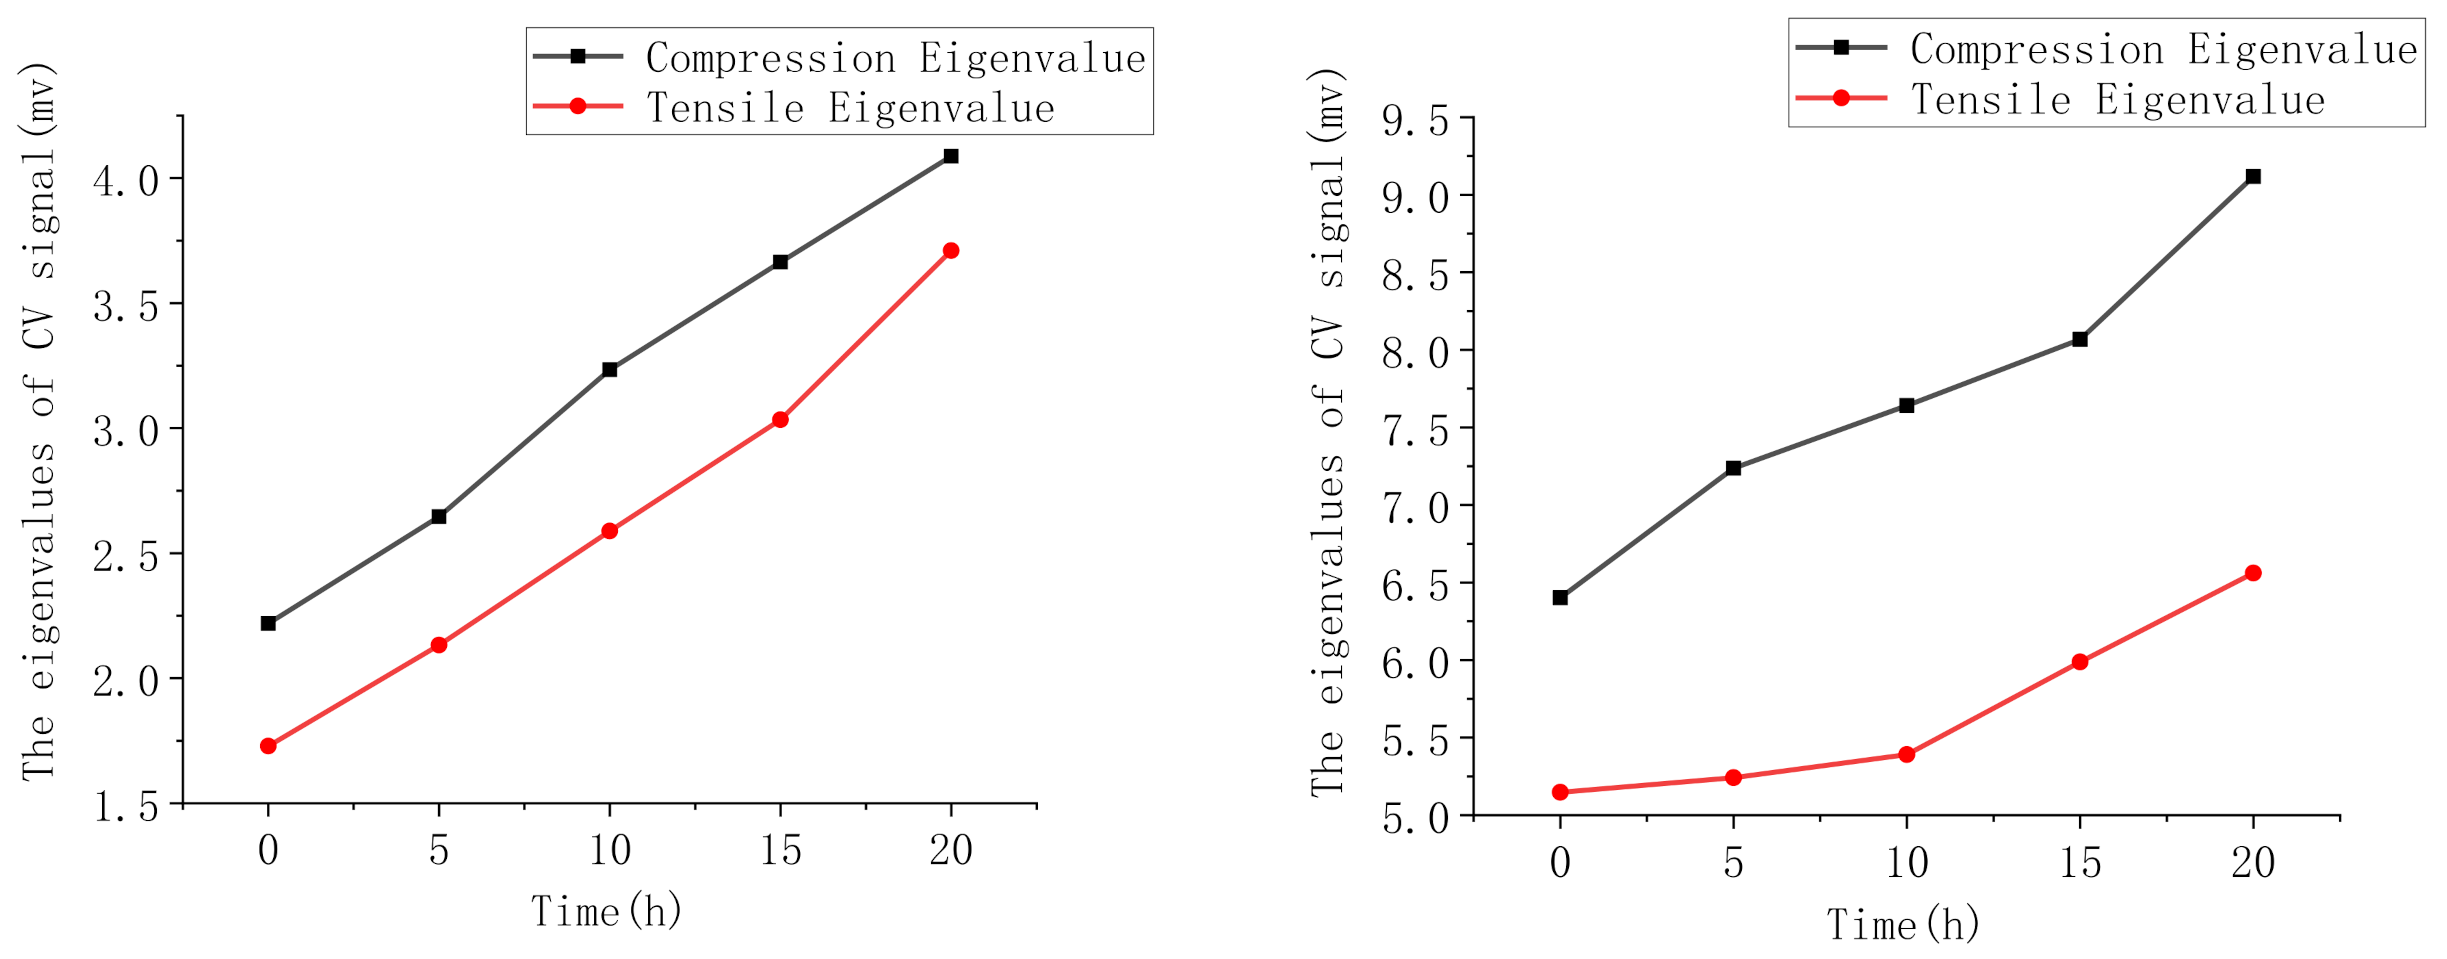
  • There was a strong correlation between the wear of the bearing and the characteristic value of the CV signals. As the wear of the bearing increased, the characteristic value of the CV signal showed an upward trend. After 20 h, the CV characteristic value of the aluminium alloy bearing wear test increased to 195% of the initial value, whereas due to the good wear resistance of the copper alloy bearing, only slight wearing was observed, and its CV amplitude increase was relatively small. Different bearing materials responded differently with the CV signals;
  • Compared with the torque and temperature, the CV potential is more sensitive to the amount of wear, and the online monitoring of the main bearing wear could be realised by using the CV method.
Further work that may be undertaken in this area includes: (i) completing tests of bearings in different fault states, including without lubricating oil, bearing eccentricity, etc.; (ii) deep-learning-based approaches should be used to analyse the cv signal to identify bearing fault modes, such as conventional neural network (CNN) Grey-box modelling and SVM; (iii) employing optimal algorithms, which improve the accuracy of deep-learning-based methods.

Author Contributions

Conceptualisation, writing—reviewing and editing, B.W.; data curation and funding acquisition, J.Y.; formal analysis, Q.W. All authors have read and agreed to the published version of the manuscript.

Funding

This research received no external funding.

Institutional Review Board Statement

Not applicable.

Informed Consent Statement

Not applicable.

Data Availability Statement

The data presented in this study are available on request from the corresponding author. The data are not publicly available due to privacy.

Acknowledgments

The authors are grateful to the Wuhan University of Technology for providing experimental facilities. We also appreciate all the teachers and postgraduate students who made great contributions to this project. This work was supported by the Ministry of Industry and Information Technology of the People’s Republic of China via the project grant number 2019-360.

Conflicts of Interest

The authors declare no conflict of interest. The funders had no role in the design of the study; in the collection, analyses, or interpretation of data; in the writing of the manuscript, or in the decision to publish the results.

References

  1. Coy, R. Practical Applications of Lubrication Models in Engines. Tribol. Int. 1998, 31, 563–571. [Google Scholar] [CrossRef]
  2. Wei, Z.; Habetler, T.G.; Harley, R.G. Stator Current-Based Bearing Fault Detection Techniques: A General review. In Proceedings of the 2007 IEEE International Symposium on Diagnostics for Electric Machines, Power Electronics and Drives, IEEE 2007, Cracow, Poland, 6–8 September 2007. [Google Scholar]
  3. Glavatskih, S. A Method of Temperature Monitoring in Fluid Film Bearings. Tribol. Int. 2003, 37, 143–148. [Google Scholar] [CrossRef]
  4. Wang, H.-J.; Zhang, R.-S.; Hua, L. Oil Mist Detector Design of Diesel Engine Crankcase. Diesel Engine 2009, 31. [Google Scholar]
  5. Swedish Standard Institution. Mechanical Vibration-Evaluation of Machine Vibration by Measurements on Non-Rotating Parts-Part 1: General Guidelines, ISO 10816-1:1995; Swedish Standard Institution: Stockholm, Sweden, 1995. [Google Scholar]
  6. ISO 10816-3. Mechanical Vibration-Evaluation of Machine Vibration by Measurements on Non-Rotating Parts-Part 3: General Guidelines, ISO 10816-3:1998(E); ISO: Geneva, Switzerland, 1998. [Google Scholar]
  7. Yu, Y.; Dejie, Y.; Junsheng, C. A Roller Bearing Fault Diagnosis Method Based on EMD Energy Entropy and ANN. J. Sound Vib. 2006, 294, 269–277. [Google Scholar] [CrossRef]
  8. Liu, Z.; Cao, H.; Chen, X.; He, Z.; Shen, Z. Multi-Fault Classification Based on Wavelet SVM With PSO Algorithm to Analyze Vibration Signals from Rolling Element Bearings. Neurocomputing 2013, 99, 399–410. [Google Scholar] [CrossRef]
  9. Al-Raheem, K.F.; Abdul-Karem, W. Rolling Bearing Fault Diagnostics Using Artificial Neural Networks Based on Laplace Wavelet Analysis. Int. J. Eng. Sci. Technol. 2011, 2. [Google Scholar] [CrossRef]
  10. Kucinschi, B.; Fillon, M. An Experimental Study of Transient Thermal Effects in a Plain Journal Bearing. J. Tribol. 1999, 121, 327–332. [Google Scholar] [CrossRef]
  11. Haidong, S.; Xia, M.; Han, G.; Zhang, Y.; Wan, J. Intelligent fault diagnosis of rotor-bearing system under varying working conditions with modified transfer convolutional neural network and thermal images. IEEE Trans. Ind. Inform. 2020, 17, 3488–3496. [Google Scholar]
  12. Yu, Z.; Martínez-García, M.; Kalawsky, R.S.; Latimer, A. Grey-Box Modelling of the Swirl Characteristics in Gas Turbine Combustion system. Measurement 2020, 151, 107266. [Google Scholar]
  13. Sugumaran, V.; Ramachandran, K. Effect of Number of Features on Classification of Roller Bearing Faults Using SVM and PSVM. Expert Syst. Appl. 2011, 38, 4088–4096. [Google Scholar] [CrossRef]
  14. Peng, Z.; Kessissoglou, N.J.; Cox, M. A Study of the Effect of Contaminant Particles in Lubricants Using Wear De-Bris and Vibration Condition Monitoring techniques. Wear 2005, 258, 1651–1662. [Google Scholar] [CrossRef]
  15. Spearot, J.A.; Murphy, C.K. A Comparison of the Total Capacitance and Total Resistance Techniques for Measuring the Thickness of Journal Bearing Oil Films in an Operating engine. SAE Trans. 1988, 97, 321–334. [Google Scholar]
  16. Suzuki, S.; Ozasa, T.; Noda, T.; Konomi, T. Analysis of Con-Rod Big-End Bearing Lubrication on the Basis of Oil Supply Rate. No. 982439; SAE International: Warrendale, PA, USA, 1998. [Google Scholar]
  17. Jun, Z.; Yang, J.G. Development Trends of Research on Monitoring Wear of Sliding Main Bearing for Diesel engine. Adv. Mater. Res. 2012, 472, 1702–1706. [Google Scholar]
  18. Katafuchi, T.; Kasai, M. Effect of Base Stocks on the Automobile Engine Bearing. Tribol. Int. 2009, 42, 548–553. [Google Scholar] [CrossRef]
  19. Hiroyuki, O.; Nakajima, Y.; Kato, S.; Tajimi, H. Vibration and Acoustic Emission Measurements Evaluating the Separation of the Balls and Raceways with Lubricating Film in a Linear Bearing under Grease lubrication. J. Tribol. 2013, 135, 041104. [Google Scholar]
  20. Hannes, A.; Priestner, C.; Six, C.; Priebsch, H.H.; Forstner, C.; Novotny-Farkas, F. Predicting Friction Reliably and Accurately in Journal bearings—A Systematic Validation of Simulation Results with Experimental measurements. Tribol. Int. 2011, 44, 1151–1160. [Google Scholar]
  21. Priestner, C.; Allmaier, H.; Priebsch, H.; Forstner, C. Refined Simulation of Friction Power Loss in Crank Shaft Slider Bearings Considering Wear in the Mixed Lubrication Regime. Tribol. Int. 2012, 46, 200–207. [Google Scholar] [CrossRef]
  22. Wan, B.; Yang, J.; Sun, S. A Method for Monitoring Lubrication Conditions of Journal Bearings in a Diesel Engine Based on Contact Potential. Appl. Sci. 2020, 10, 5199. [Google Scholar] [CrossRef]
  23. Bo, S. Calculation and Test on the Monitoring of Diesel Engine Main Bearing Wear Using Thermoelectric Power Method. Master’s Thesis, Wuhan University of Technology, Wuhan, China, April 2014. [Google Scholar]
  24. Lin, C. Investigation on Static Performance of Hydrodynamics Bearing. Ph.D. Thesis, Harbin Engineering University, Harbin, China, April 2012. [Google Scholar]
  25. Bo, H. Preparation and Tribological Properties of Metal-Ceramic Composite Coating on the Inner Surface of Diesel Engine Cylinder Liner. Master’s Thesis, Yangzhou University, Yangzhou, China, June 2020. [Google Scholar]
  26. Jie, Z.; Luxian, Z. Selection of Engineering Abrasion Reduction Material Based on Bearing. Mod. Manuf. Technol. Equip. 2007, 34–44. [Google Scholar]
  27. He, Z.; Zhang, J.; Zhang, G.; Li, Z.; Xie, W. Crankshaft-Bearing Evolution Indexes Investigation and Asperity Contact Identification Based on Neural Network. Appl. Math. Model. 2014, 38, 506–523. [Google Scholar] [CrossRef]
Figure 1. Bearing fatigue test bench testing system schematic.
Applsci 11 07811 g001
Figure 2. The fatigue test bench.
Applsci 11 07811 g002
Figure 3. Comparison of bearing temperature and torque at different bearing loads.
Applsci 11 07811 g003
Figure 4. Comparison of oil film thicknesses of different bearing loads.
Applsci 11 07811 g004
Figure 5. The minimum oil film thickness curves of the two bearings.
Applsci 11 07811 g005
Figure 6. Comparison of bearing temperature and torque at different inlet oil temperatures.
Applsci 11 07811 g006
Figure 7. Comparison of the oil film thickness of the bearing with the different oil inlet temperatures.
Applsci 11 07811 g007
Figure 8. Curves of minimum oil film thickness of the two bearings.
Applsci 11 07811 g008
Figure 9. CV signal of copper alloy bearing (1500 r/min, 10 MPa).
Applsci 11 07811 g009
Figure 10. Comparison of different signals of copper alloy (1500 r/min, 10 MPa).
Applsci 11 07811 g010
Figure 11. The bearing pictures after the test.
Applsci 11 07811 g011
Figure 12. Bearing wear at different wear test times.
Applsci 11 07811 g012
Figure 13. Comparison of bearing lubrication parameters of different bearing shells with different wear test durations.
Applsci 11 07811 g013
Figure 14. Comparison of oil film thickness of different bearings with different times.
Applsci 11 07811 g014
Figure 15. Comparison of minimum oil film thickness for different wear test durations.
Applsci 11 07811 g015
Figure 16. CV signals of the different wear times.
Applsci 11 07811 g016
Figure 17. Comparison of CV characteristic values of different wear test durations.
Applsci 11 07811 g017
Figure 18. The relationship between wear and thermoelectricity.
Applsci 11 07811 g018
Table 1. Frictional accessory material.
Bearing Material 1
(Copper Alloy)
Bearing Material 2
(Aluminium Alloy)
SS400 + CuPb24SnSPHC + AlSn20Cu
Table 2. The measurement results of the surface condition of the aluminium alloy bearing at different times.
Time (h)Bearing Clearance (mm)Lower Bearing Thickness (mm)Lower Bearing Roughness (μm)
00.1411.8180.707
50.1461.8120.778
100.1481.8080.882
150.1541.7981.232
200.1621.7882.332
Table 3. Measurement results of the surface state of the copper alloy bearing at different times.
Time (h)Bearing Clearance (mm)Lower Bearing Thickness (mm)Lower Bearing Roughness (μm)
00.1401.8200.787
50.1451.8160.812
100.1491.8130.982
150.1511.8121.232
200.1521.8102.332
Publisher’s Note: MDPI stays neutral with regard to jurisdictional claims in published maps and institutional affiliations.

