Article

Evaluation of the Nomological Validity of Cognitive, Emotional, and Behavioral Factors for the Measurement of Developer Experience

Department of Smart Experience Design, Kookmin University, Seoul 02707, Korea
*
Author to whom correspondence should be addressed.
Appl. Sci. 2021, 11(17), 7805; https://doi.org/10.3390/app11177805
Submission received: 15 July 2021 / Revised: 20 August 2021 / Accepted: 23 August 2021 / Published: 25 August 2021
(This article belongs to the Special Issue State-of-the-Art in Human Factors and Interaction Design)

Abstract

:
Background: Developer experience should be considered a key factor from the beginning of the use of development platform, but it has not been received much attention in literature. Research Goals: The present study aimed to identify and validate the sub-constructs and item measures in the evaluation of developer experience toward the use of a deep learning platform. Research Methods: A Delphi study as well as a series of statistical methodologies including the assessment of data normality, common method bias, and exploratory and confirmatory factor analysis were utilized to determine the reliability and validity of a measurement model proposed in the present work. Results: The results indicate that the measurement model proposed in this work successfully ensures the nomological validity of the three second-order constructs of cognitive, affective, and behavioral components to explain the second-order construct of developer experience at p < 0.5 Conclusions: The measurement instrument developed from the current work should be used to measure the developer experience during the use of a deep learning platform. Implication: The results of the current work provide important insights into the academia and practitioners for the understanding of developer experience.

1. Introduction

1.1. Study Background and Purpose

Developer experience (DX) refers to the overall experience of developers while they develop systems, products, or services. The concept also includes the developer’s feelings, motivations, characteristics, and activities [1]. DX is a special case of user experience (UX), which has been studied extensively. DX shares both the idea and philosophy of the UX design. However, the main actor of DX is dualistic—the developer is a tool user who enables the system use and a producer who develops the tool [2]. DX may have a similar meaning to UX, but the former is limited only to developers responsible for designing or developing the system for the end-user. The developer should have interest in and passion for the values of the application created for the user and should motivate interest in its development.
In contrast with the past, current developers are considered key participants or stakeholders in various business environments. Furthermore, because they are decision-makers, much attention has been paid to the developer’s experience [3]. For example, the success of the Apple App Store and Google Play—which transformed the mobile market ecosystem—was due to the vast development ecosystem or DX in which developers can actively develop and register apps with interest.

1.2. Research Goal

This study aims to derive sub-factors and assessment questions to evaluate DX perceived by developers who use a deep-learning (DL) platform. DL refers to a set of machine-learning (ML) algorithms that attempt high-level abstraction by combining various non-linear transformation techniques [4]. It also refers to the framework that assists in developing a DL model faster. DL platforms, which can implement DL technology, are expected to receive significant attention from developers considering the advancement potential of related industries with DL-based technologies. It is essential to use a DL-based platform to develop voice recognition, pattern recognition, and computer vision systems based on DL technology, which is considered the core technology of the Fourth Industrial Revolution.
For example, major information technology companies including Netflix, Uber, and Airbnb, use DL platforms to analyze big data collected from consumers [5]. Developers must implement DX at a high level to provide UX at a high level for software users [6]. If DX can be evaluated using a systematic methodology, it can help improve development tools and environments and provide users with excellent UX [7]. This study extracted the sub-factors and assessment questions that can monitor DX as a benchmark tool to evaluate the performance of the DL platform. It also evaluated the nomological validity concerning whether the benchmark tool can explain DX (the single concept) at the level of statistical significance. Figure 1 illustrates the research flow for the present work.

2. Literature Review

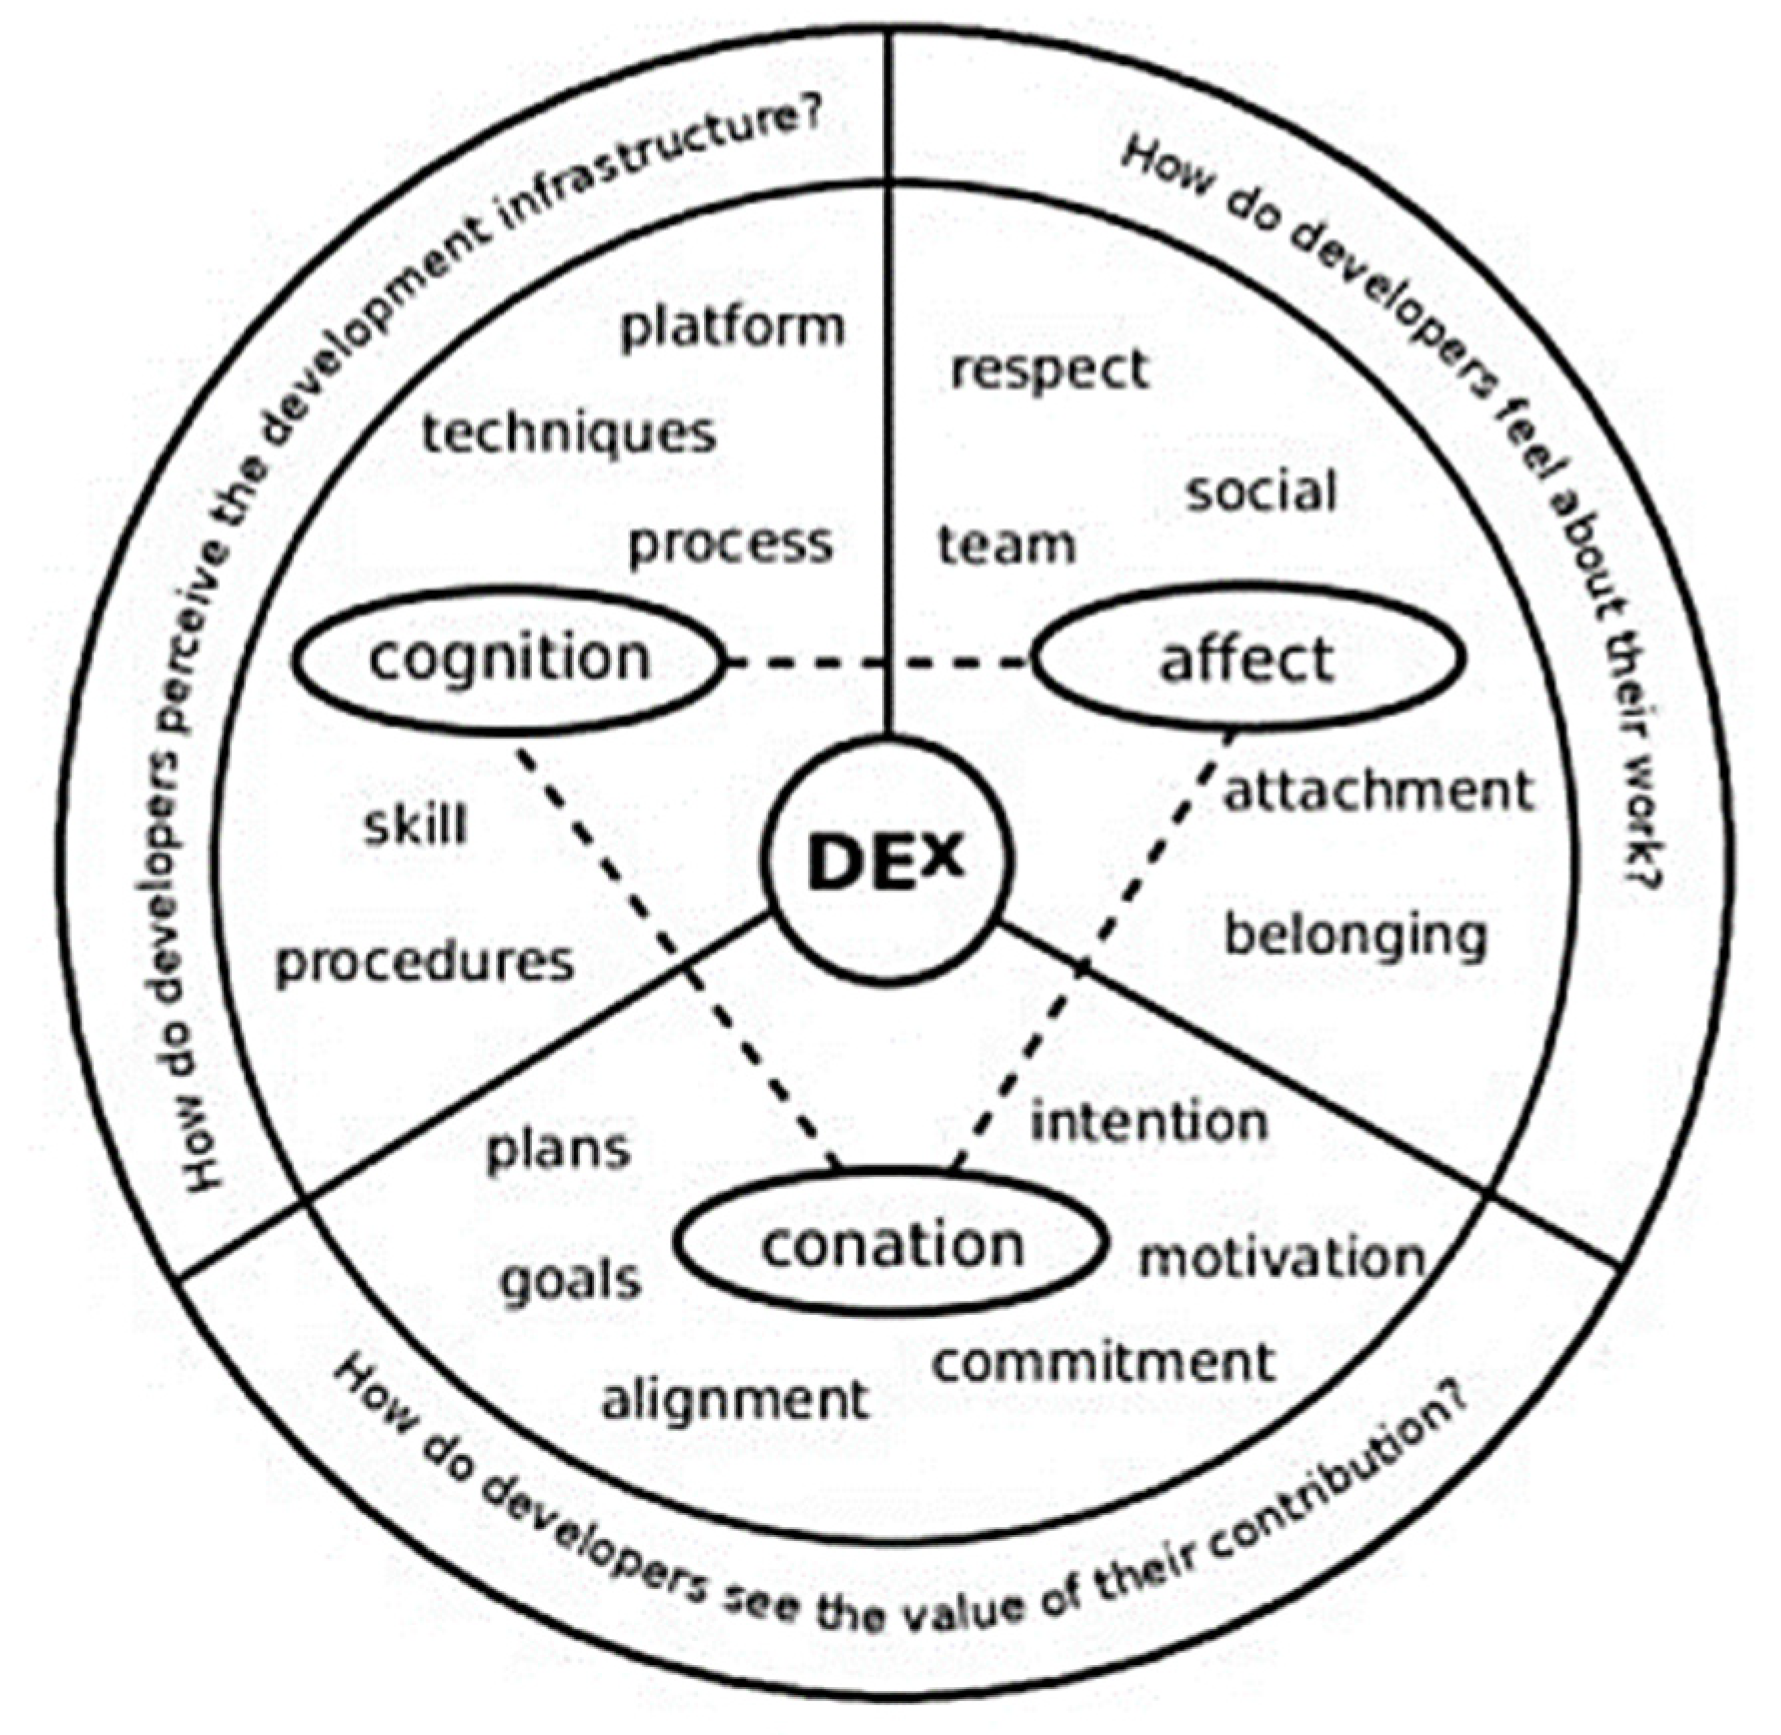
2.1. Developer Experience (DX)

DX refers to the experience involving the interaction between development tools and developers in the software development process [8]. A complete understanding of DX can facilitate an understanding of the expectation, perceptions, and feelings of developers who participate in development tools. Furthermore, DX has a dualistic nature of UX-based DX, in which the developer is both a system tool user and a system producer who predicts the UX [2]. Understanding the relationship between the developer and the platform that a developer uses is essential because we can thereby predict whether the platform can satisfy developers and ensure usability and functionality.
Fontão et al. (2017) [9] claimed that factors that affected DX could be identified from three types of information. They included the factor that affected the developer’s cognition toward the software development infrastructure, the developer’s perceptions or emotions of the contribution to the ecosystem, and the value recognized by the developer’s contribution. They claimed that if the effect on DX was analyzed from these three viewpoints, it could help to maintain organizational strategy and raise the quality of the goal pursued by the organization and the framework that supported developers [9].
Parviainen et al. (2015) [10] argued that because software developments were conducted through collaboration with team members, the DX perceived by team members would affect the integrated development environment. They classified the factors that consisted of DX into development rules and policies, dynamic work division according to circumstantial roles, and collaboration mode between communities. For example, they suggested that DX may change depending on whether team members who developed software agreed on the coding style. Furthermore, they discussed whether assigning a clear role for software development (e.g., manager, user interface developer, and backend developer) affected the perceived experience.

2.2. Deep-Learning (DL) Platform

The demand for ML-based artificial intelligence (AI) has increased. ML is an algorithm that self-learns from data and can execute work without relying on a programmed code [11]. The ML technique has been established as an essential tool to process complex data and predict patterns in all sectors, including medicine, finance, environment, military, and science [12,13] DL refers to an ML technique that performs tasks including image classification, voice recognition, and natural language processing [14,15].
A DL platform is a development environment provided to developers to build a DL model. Because potential business success can be obtained using DL techniques in various areas where logic and inference, prediction, or cognition function processing are required, investment in and development of the DL platform have increased, predominantly in global companies and academia [16]. The use of DL technology has increased in various sectors. Thus, case studies on developing and improving DL platforms toward developing and supporting new algorithms have also increased [17].
For example, studies on DL platform development combined with parallel processing technology, cloud computing power, and distributed storage technology have been conducted in recent years [18,19]. Nonetheless, no studies have been conducted on the experience of developers who use DL platforms concerning platform processes or tools or an evaluation of those experiences. A DL platform should provide the perception to developers that it can create unique value and user-friendly platform functions. Developers should fully understand the value of the DL platform and perceive that the deliverables provided by the platform are critical to value creation and the tool’s value in improving productivity.

3. Research Methods

3.1. Sub-Constructs of DX

Fagerholm and Münch (2012) [1] proposed a conceptual framework to evaluate DX (Figure 2). They showed that because software development requires creative characteristics, developers specifically consider infrastructure and perspectives on work, feeling, and value created when achieving goals. The DX framework proposed by the researchers consisted of cognition, affection, and intention or conation aspects of experience. Cognition includes attention, memory, and problem-solving ability. Affection includes the developer’s feelings or emotions, such as positive emotion or pleasure. Finally, intention, or conation, includes impulse, motivation, and desire required for software development. Inspired by the work of Fagerholm and Münch et al. (2012), the present study explores the research question of “three sub-constructs of cognitive, affective, and conative factor consist of developer experience toward the DL platform”.

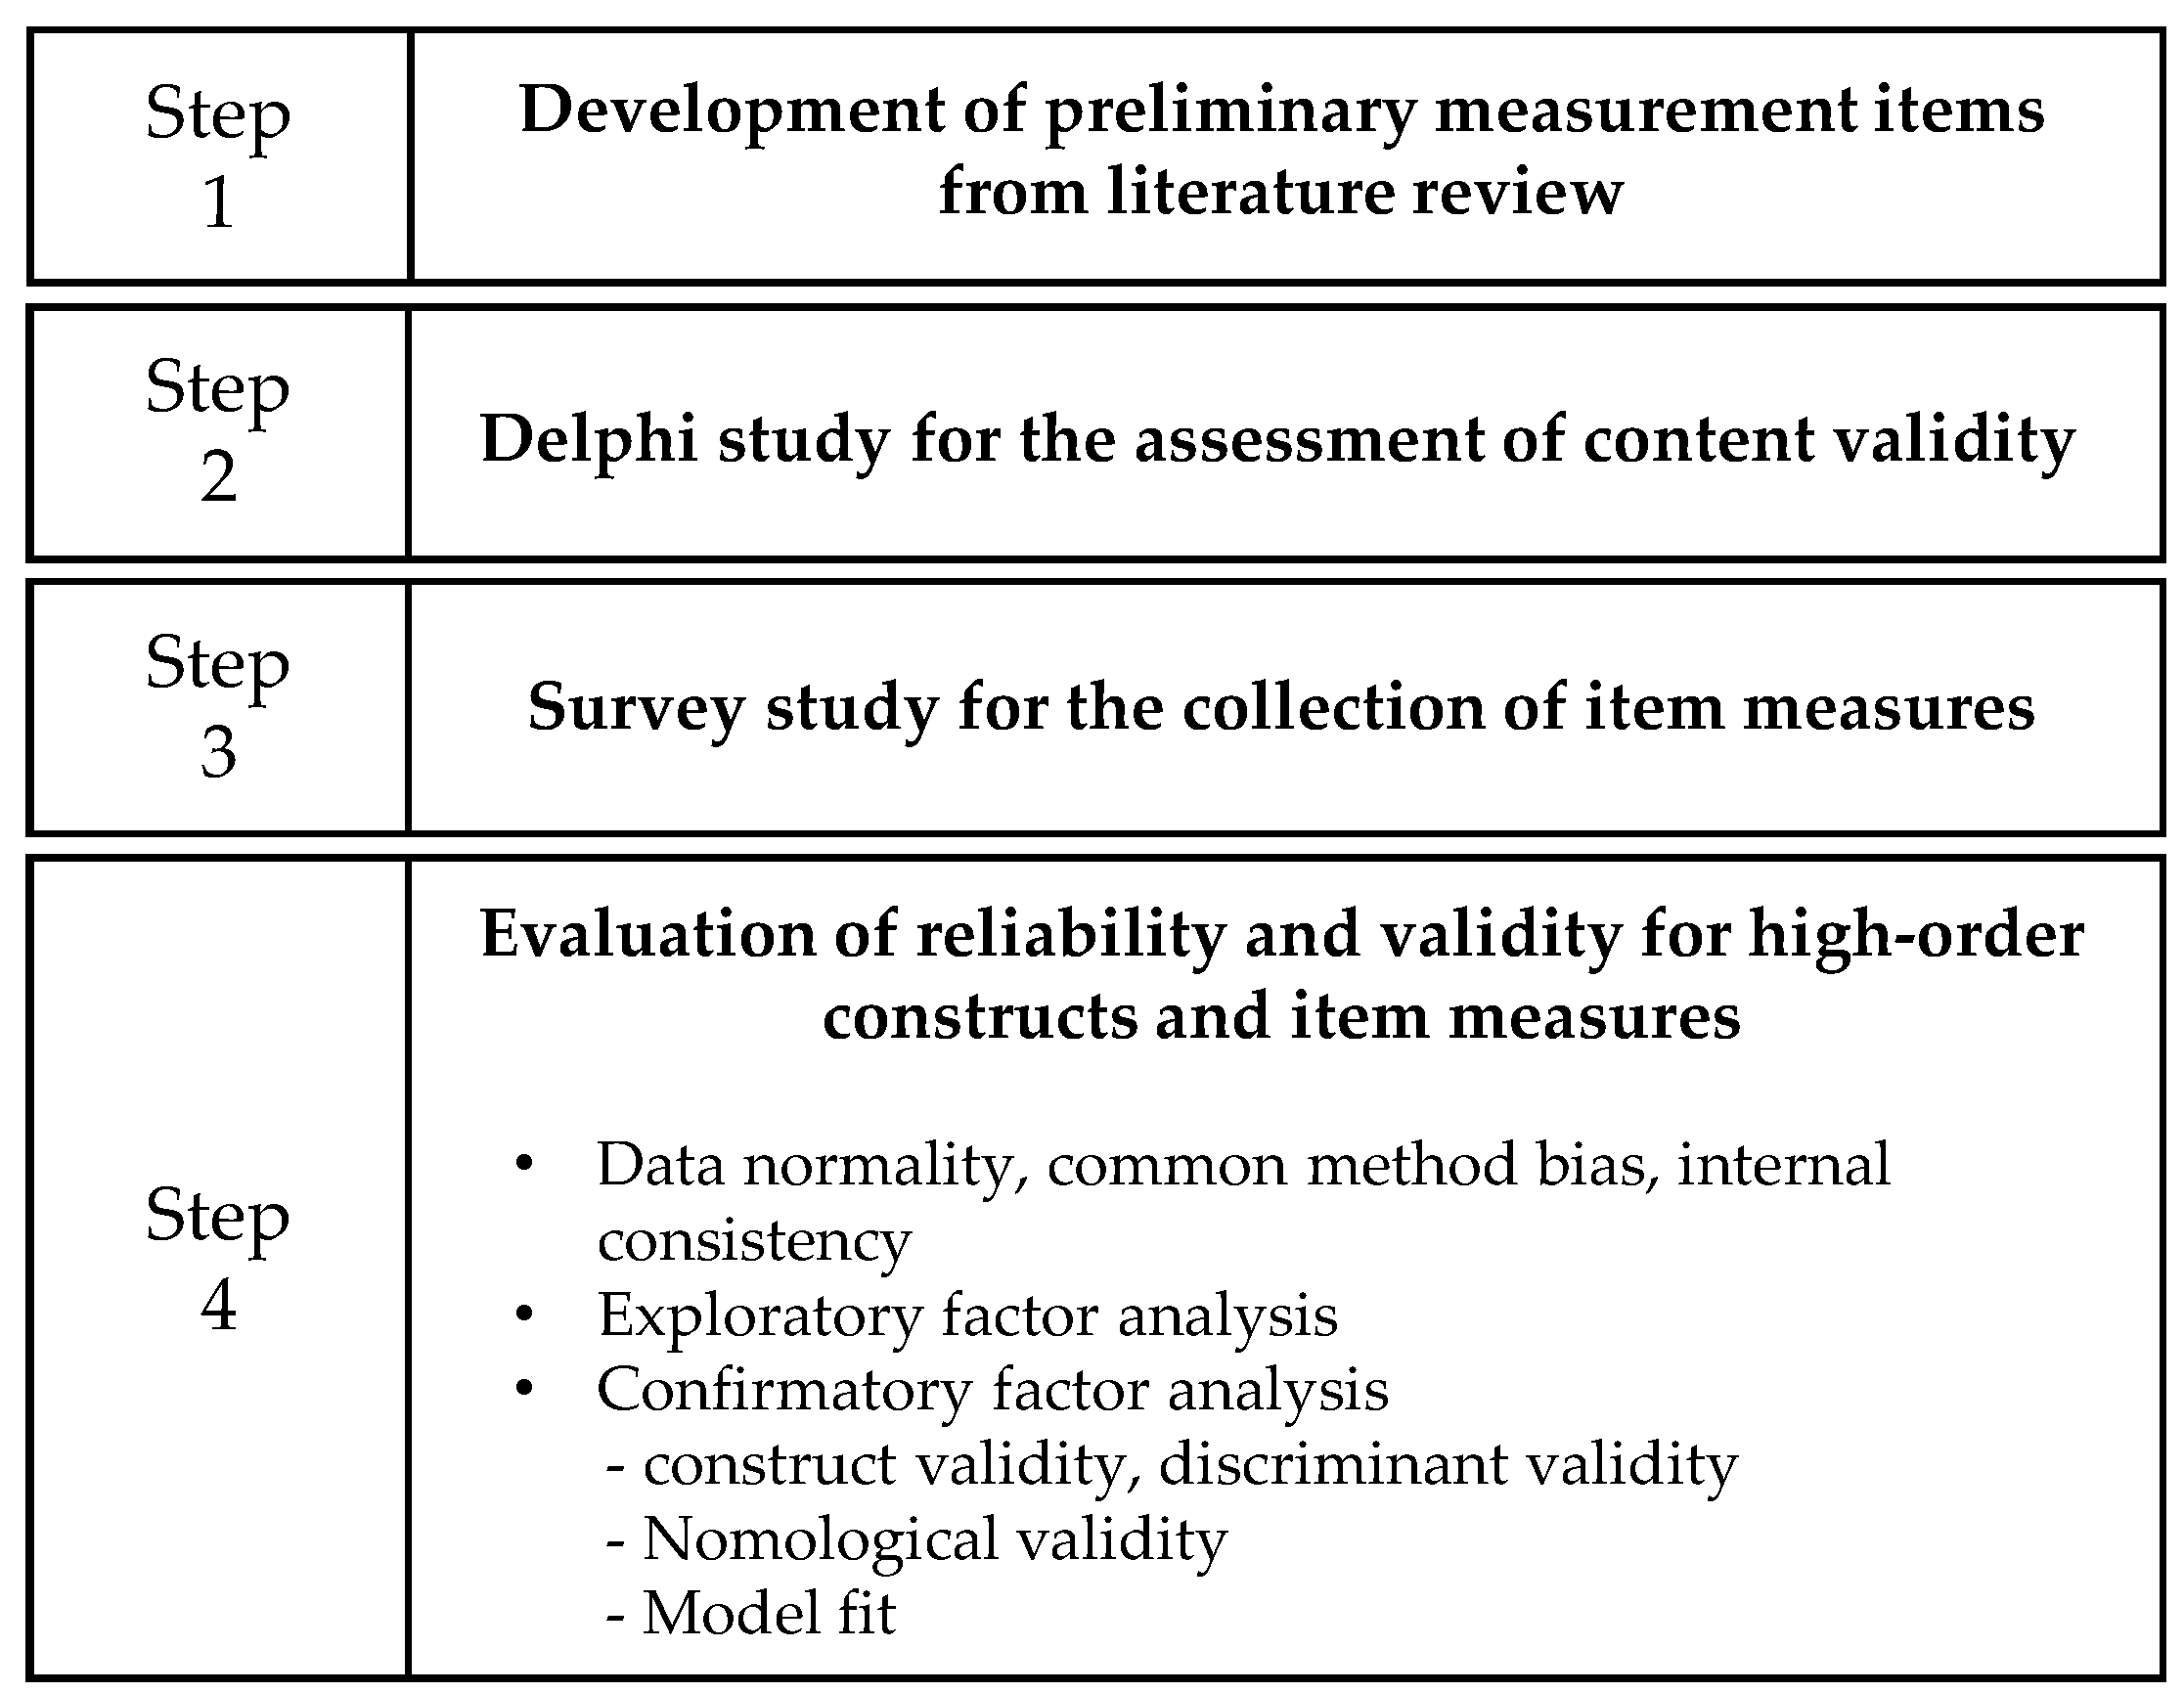
3.2. Evaluation Tool

3.2.1. Development of Preliminary Survey Questionnaire

Based on the studies by Ahn and Back (2018) [20], Back and Parks (2003) [21], Chowdhury and Salam (2015) [22], Khanal (2018) [23], Venkatesh, Speier, and Morris (2002) [24], and Venkatesh and Davis (2000) [25], this study constructed a preliminary questionnaire to evaluate the sub-constructs of DX. The operational definition of “cognition” in this study refers to the rational basis providing competitiveness, efficacy, value, or motivation for developers to use the DL platform. “Affection” is an emotional state that developers expect from the use of the DL platform. Finally, “conation” refers to the developer’s will or desire to use the DL platform autonomously under volitional control.

3.2.2. Delphi Survey

This study conducted a Delphi survey with a panel of experts to evaluate the content validity of the preliminary survey questionnaire [26]. The Delphi survey was conducted between 4 January and 23 January 2021. Lynn (1986) [27] suggested that 3 to 10 expert panelists are sufficient for evaluating content validity. In this study, four experts who have been in academia and industries related to DL technology and development for at least 10 years participated in the panel. Of the four experts participated in the Delphi, two respondents were classified as having a master’s degree, and the remaining two as having a doctoral degree. In addition, they consist of one four-year university faculty, one principal researcher in a research institute, and two project managers with 15 years of industry and practice experience.
The Delphi evaluation tool was constructed based on closed-ended questions using a 7-point Likert scale (e.g., one point = “strongly disagree”, and seven points = “strongly agree”) and open-ended questions. The closed-ended questions were created to evaluate whether the preliminary survey questionnaire could assess the sub-constructs that corresponded to each question. Furthermore, free opinions about the suitability, understanding, and consistency of the terms used in the questions were collected through open-ended questions in addition to the question’s appropriateness. In the present work, the one-round Delphi study was conducted by email.
The content validity ratio (CVR) of the response values to the closed-end questions was calculated to verify the degree of agreement of the expert opinion obtained from the Delphi survey. According to Lawshe (1975) [28], the minimum acceptable CVR was 0.99 if the number of panelists was five. Thus, this study selected only the preliminary survey questions whose CVR was 1.0 to develop the questionnaire for the main survey. The excluded questions were not used in the main survey and final analysis. As illustrated in Table 1, for instance, the calculated CVRs for the measurement items of 1, 4, 6, 7, 11 through 14, 20, and 21 are less than 1.0, and these ten items were discarded for the final analysis. With respect to the ten pilot items for affective factors, calculated CVRs for the items of 1 through 4, 9, and 10 are less than 1.0 and again, these six measurement items were eliminated and not included in the final analysis (Table 2). Among the calculated CVRs for the measurement items of behavioral factors, the values for the items of 4 and 6 have CVRs less than 1.0 (Table 3). Thus, a total of nine measurement items for behavioral factors are considered for the final analysis.

4. Study Results

4.1. Study Subjects

For the main survey in this study, a questionnaire was distributed to 260 employees in the industry, including S and L companies in South Korea. Their job description involves DL technology planning, design, and development. In detail, S and L companies are characterized by information technology organization that primarily provides software solutions and service integration service. Their business is highly driven by the use of an AI-based natural language and learning model, smart factory, blockchain technology, and cloud data analysis. The survey was conducted based on an online survey tool from 8 February to 26 March 2021. Insincere responses were excluded, and survey data from 225 employees were used in the final analysis.
Table 4 presents the demographic characteristics of the respondents who evaluated the data used in the final analysis. The proportions of male and female respondents were 79.1% and 20.9%, respectively. The proportion of respondents in their 30s was 53.8 (the largest), followed by those in their 20s (35.1%) and 40s (10.7%). The respondents who graduated from four-year university programs accounted for 84.4%, while those who held Master’s and Ph.D. degrees were 10.7% and 4.9%, respectively.

4.2. Descriptive Statistics

Table 5 presents the calculated mean, standard deviation, skewness, and kurtosis for the collected questionnaire values. For the structural equation model analysis based on the maximum likelihood estimation using IBM® SPSS® Amos, the collected data pattern should have a normal distribution characteristic [29]. In this study, the skewness and kurtosis of each survey question value were calculated to evaluate the normality of the survey data [30]. The absolute values of the calculated skewness and kurtosis were less than 3.0 and 10.0, respectively—the minimum acceptable ranges proposed by Kline (2011) [31]. Consequently, the collected survey data did not violate normality.

4.3. Exploratory Factor Analysis Results

An exploratory factor analysis was performed to verify the latent variable structure for the collected survey questionnaire values. For the fitness test used to perform the factor analysis, Bartlett’s test for sphericity (χ2 = 4296.664 (325), p = 0.000 < 0.05) and the Kaiser–Meyer–Olkin (KMO) measure value (=0.946 > 0.6) were calculated. All values satisfied the minimum acceptable score proposed by Kaiser (1974).
Direct oblimin and principal component analysis were used for factor analysis rotation and factor extraction, respectively, to perform the exploratory factor analysis. The execution results demonstrated that the factor rotation converged in 14 iterations, and three components whose initial eigenvalues were greater than 1.0 were extracted (Table 6). The minimum acceptable score in the factor loading was set to 0.5 in this study [32]. The factor loadings for C1, C9, C12, and C13—survey questions in which cognition was included—were less than 0.5. Accordingly, these four survey questions and their values were excluded from the final analysis.

4.4. Internal Consistency Evaluation Results

Cronbach’s alpha coefficients were calculated to verify the internal consistency of the evaluation tool designed to measure the three sub-constructs. As presented in Table 6, all of the coefficients were greater than 0.7—the minimum acceptable value proposed by Cortina (1993) [33] and DeVellis (2003) [12].

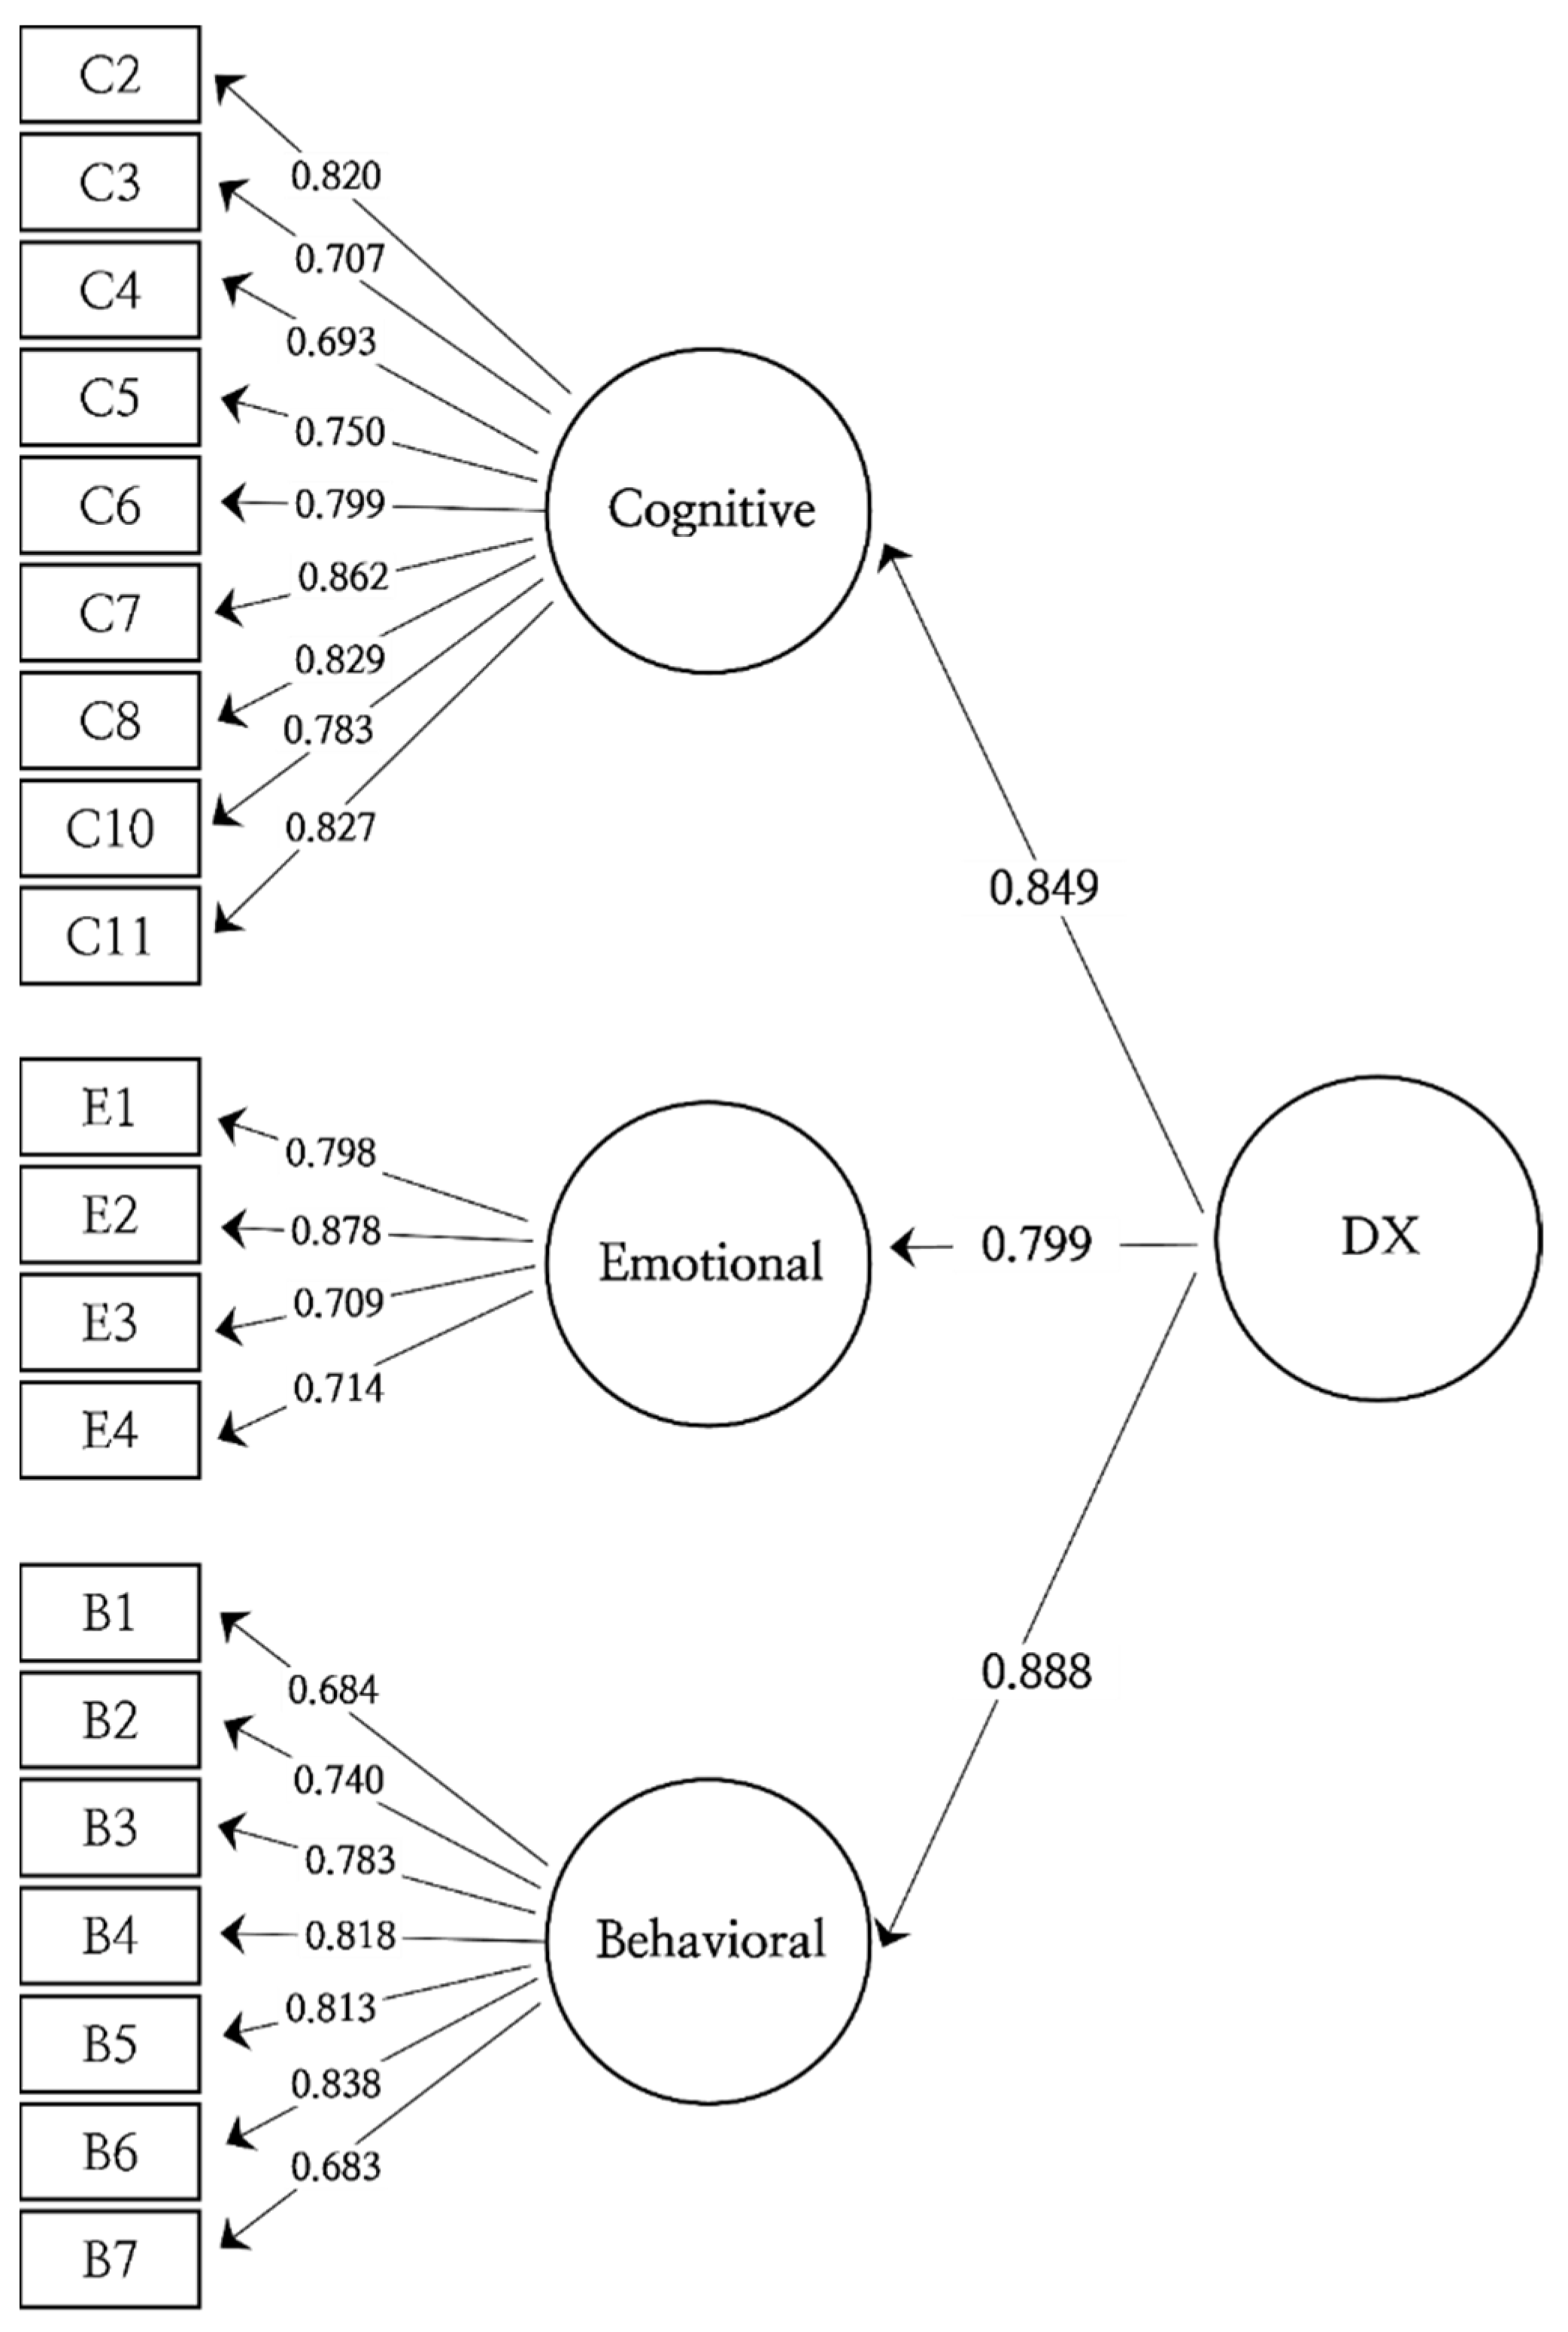
4.5. Confirmatory Factor Analysis Results

A confirmatory factor analysis was performed to evaluate the construct validity, model fit, and nomological validity of the measurement proposed in this study. Convergent validity and discriminant validity were assessed to evaluate construct validity.

4.5.1. Convergent Validity Evaluation Results

The guideline proposed by Fornell and Larcker (1981) [34] was used to evaluate the convergent validity of the measurement. Their guideline suggested that all the standardized factor loadings of the calculated observed variables should be greater than 0.6 at a statistical significance level of p < 0.05, and the average variance extracted (AVE) and composite reliability values should be greater than 0.5 and 0.7, respectively. The calculated standardized factor loadings were observed. B8 (=0.599) and B9 (=0.500), which were used to measure the conation sub-construct, did not satisfy the minimum acceptable score. Furthermore, the root mean square error of approximation (RMSEA) value, one of the goodness of fit indices calculated to evaluate the model fit, was 0.086, which did not satisfy the acceptable score of 0.08 or less [35]. Thus, this study improved the model fit of the measurement by observing the modification indices of the model fit obtained through the confirmatory factor analysis after removing the two observed variables of B8 and B9.
The covariance modification index of the observed variables C4 and C5, C6 and C7, and C6 and C10 were all 20.0 or greater. Thus, covariance was additionally set for each of them [35]. Table 7 displays the confirmatory factor analysis results for the modified measurement. The standardized factor loading of each observed variable was 0.6 or greater, and the AVE and composite reliability values were greater than 0.5 and 0.7, respectively. Thus, the measurement of this study satisfied the appropriate convergent validity.

4.5.2. Discriminant Validity Evaluation Results

The discriminant validity of the measurement was evaluated based on whether the AVE square root of each construct was larger than the estimated correlation coefficient between constructs based on the guideline proposed by Fornell and Larcker (1981) [34].
As presented in Table 8, the AVE square root of the cognition sub-construct was 0.787, which was greater than the estimated correlation coefficient (=0.678) between the cognition and affection sub-constructs and the correlation coefficient (=0.754) between the cognition and conation sub-constructs. The AVE square root of the affection sub-construct was 0.778, which was greater than the correlation coefficient 0.709 between the affection and conation sub-constructs. Thus, the discriminant validity of the measurement satisfied the criterion proposed by Fornell and Larcker (1981) [34].

4.5.3. Model Fit Evaluation Results

In evaluating the model fit of the measurement (Table 9) he chi-square (χ2) statistics and normalized fit index (NFI), comparison fit index (CFI), Tucker–Lewis index (TLI), incremental fit index (IFI), and RMSEA were calculated. All indices satisfied the minimum acceptable values proposed in previous literature [32,36,37].

4.5.4. Nomological Validity Evaluation Results

The nomological validity was measured to evaluate whether the first-order sub-constructs (cognition, affection, and conation) could construct the second-order construct (DX) at a statistical significance level [38]. The confirmatory factor analysis results in Table 7 confirm that the standardized factor loadings of three first-order constructs were all greater than 0.6 at the significance level p < 0.05 (cognition = 0.849; affection = 0.799; and conation = 0.888) (Figure 3). Thus, the nomological validity verified that the three first-order constructs can be constructed as the second-order construct.

4.6. Results Summary

The results of this study verified three factors—cognition, affection, and conation—as critical sub-constructs that can construct the DX of a DL platform at a statistically significant level. Based on a confirmatory factor analysis, the calculated standardized factor loadings of three sub-constructs were observed. The results revealed that the factor loadings of cognition, affection, and conation were 0.849, 0.799, and 0.888, respectively. The standardized factor loading represents the correlation between latent constructs and observed variables. Each of the three sub-constructs had a high level of relatively uniform correlation with DX, a latent construct.
Based on the results of this study, the DX of a DL platform can be a construct that can be evaluated based on the developer’s competitiveness and value perceived from the platform, affection (expressed positively or negatively), and willingness to use the platform.

5. Conclusions

A DL platform is a development environment provided to developers that allows them to build a DL model. Since business success can potentially be obtained using DL techniques in various areas where logic, inference, prediction, or cognition function processing are required, the DL platform has seen an increase in investments and development, predominantly in global companies and academia [17]. The use of DL technology has increased across various sectors. However, no studies have been conducted on the experience of the developers who use DL platforms, in terms of evaluating their experiences with platform processes or tools.
In terms of needing to evaluate and research the experiences of developers, who are the main users of the deep learning platform, this study has interdisciplinary significance by proposing a reflective model for evaluating DX when using a DL platform. Furthermore, the evaluation is verified at a statistically significant level. Future research should use external validity to verify whether the derived evaluation questionnaire and the sub-constructs proposed in this study can explain the DX of other developer platforms, in addition to the DL platform.
It should be acknowledged that the present work did not consider any potential confounding factors or profiles including the type of deep learning platform respondents use in their companies or level of their work experience into the data analysis. These might impact the interpretation of our findings. Future work should replicate our findings with controlling for confounding variables to provide the robust support for the nomological validity of the measurement model proposed in the present work.

Author Contributions

Conceptualization, methodology, formal analysis, data curation, writing—original draft preparation: H.L., writing—review and editing, and funding acquisition: Y.P. All authors have read and agreed to the published version of the manuscript.

Funding

The publication of this paper has been partly supported by Graduate School of Techno, Kookmin University.

Institutional Review Board Statement

Not applicable.

Informed Consent Statement

Informed consent was obtained from all subjects involved in the study.

Data Availability Statement

Not applicable.

Acknowledgments

The authors would like to thank everyone who supported us in this work.

Conflicts of Interest

The authors declare no conflict of interest.

References

  1. Fagerholm, F.; Münch, J. Developer experience: Concept and definition. In Proceedings of the 2012 International Conference on Software and System Process (ICSSP 2012), Zurich, Switzerland, 2–3 June 2012; pp. 73–77. [Google Scholar]
  2. Kuusinen, K. Software Developers as Users: Developer Experience of a Cross-Platform Integrated Development Environment. In Proceedings of the International Conference on Product-Focused Software Process Improvement, Bolzano, Italy, 2–4 December 2015; pp. 546–552. [Google Scholar]
  3. Latorre, R. Effects of developer experience on learning and applying unit test-driven development. IEEE Trans. Softw. Eng. 2014, 40, 381–395. [Google Scholar] [CrossRef]
  4. Bengio, Y.; Courville, A.; Vincent, P. Representation learning: A review and new perspectives. IEEE Trans. Softw. Eng. 2013, 35, 1798–1828. [Google Scholar] [CrossRef]
  5. Heo, S.-B.; Kang, D.-C.; Choi, J.-Y. Hadoop-based deep learning framework technology trends. J. Inf. Sci. 2019, 37, 25–31. [Google Scholar]
  6. Park, J.-G. Development and Validation of Scales for Social Network Service Adoption Factors: Focusing on the College Student Group. Commun. Theory 2011, 7, 22–74. [Google Scholar]
  7. Konsti-Laasko, S.; Pihkala, T.; Kraus, S. Facilitating SME innovation capability through business networking. Creat. Innov. Manag. 2012, 21, 93–105. [Google Scholar] [CrossRef]
  8. Fontão, A.; Pereira, R.; Dias-Neto, A. Research Opportunities for Mobile Software Ecosystems. In Proceedings of the Workshop on Distributed Software Development: Software Ecosystems and Systems-of-Systems, Florence, Italy, 17 May 2015; pp. 4–5. [Google Scholar]
  9. Fontão, A.; Dias-Neto, A.; Viana, D. Investigating Factors that Influence Developers’ Experience in Mobile Software Ecosystems. In Proceedings of the 2017 IEEE/ACM Joint 5th International Workshop on Software Engineering for Systems-of-Systems and 11th Workshop on Distributed Software Development, Software Ecosystems and Systems-of-Systems (JSOS), Cetara, Italy, 11–14 May 2017; pp. 55–58. [Google Scholar]
  10. Palviainen, J.; Kilamo, T.; Koskinen, J.; Lautamäki, J.; Mikkonen, T.; Nieminen, A. Design framework enhancing developer experience in collaborative coding environment. In Proceedings of the 30th Annual ACM Symposium on Applied Computing, Salamanca, Spain, 13–17 April 2015; pp. 149–156. [Google Scholar]
  11. Lepenioti, K.; Bousdekis, A.; Apostolou, D.; Mentzasa, G. Prescriptive analytics: Literature review and research challenges. Int. J. Inf. Manag. 2020, 50, 57–70. [Google Scholar] [CrossRef]
  12. Currie, G.; Hawk, K.E.; Rohren, E.; Vial, A.; Klein, R. Machine learning and deep learning in medical imaging: Intelligent imaging. J. Med. Imaging Radiat. Sci. 2019, 50, 477–487. [Google Scholar] [CrossRef] [Green Version]
  13. Viebig, J. Exuberance in financial markets: Evidence from machine learning algorithms. J. Behav. Financ. 2020, 21, 128–135. [Google Scholar] [CrossRef]
  14. Jeon, J.-H.; Kim, J.-H. Network segmentation-based personal information protection distributed medical big data deep learning platform. J. Korean Telecommun. Soc. 2019, 36, 48–52. [Google Scholar]
  15. Shiu, Y.; Palmer, K.J.; Roch, M.A.; Fleishman, E.; Liu, X.; Nosal, E.M.; Helble, T.; Cholewiak, D.; Gillespie, D.; Klinck, H. Deep neural networks for automated detection of marine mammal species. Sci. Rep. 2020, 10, 1–12. [Google Scholar] [CrossRef] [Green Version]
  16. Choi, G.-L. Artificial Intelligence: Disruptive Innovation and Evolution of Internet Platforms; KISDI Premium Report; Information and Communication Policy Research Institute: Seoul, Korea, 2015; pp. 1–24. [Google Scholar]
  17. Kim, K.-H.; Um, H.-S. A high-performance deep learning system. J. Inf. Sci. 2016, 34, 57–62. [Google Scholar]
  18. Lee, C.; Wang, W.; Zhang, M.; Ooi, B.C. A general distributed deep learning platform. J. Inf. Sci. 2016, 34, 31–34. [Google Scholar]
  19. Lee, M.; Shin, S.; Hong, S.; Song, S.-K. BAIPAS: Distributed Deep Learning Platform with Data Locality and Shuffling. In Proceedings of the 2017 European Conference on Electrical Engineering and Computer Science, Bern, Switzerland, 17–19 November 2017; pp. 5–8. [Google Scholar]
  20. Ahn, J.; Back, K.J. Influence of brand relationship on customer attitude toward integrated resort brands: A cognitive, affective, and conative perspective. J. Travel Tour. Mark. 2018, 35, 449–460. [Google Scholar] [CrossRef]
  21. Back, K.J.; Parks, S.C. A brand loyalty model involving cognitive, affective, and conative brand loyalty and customer satisfaction. J. Hosp. Tour. Res. 2003, 27, 419–435. [Google Scholar] [CrossRef]
  22. Chowdhury, S.K.; Salam, M. Predicting attitude based on cognitive, affective, and conative components: An online shopping perspective. Stamford J. Bus. Stud. 2015, 2, 101–115. [Google Scholar]
  23. Khanal, J. Influence of Affective, Cognitive and Behavioral Intention on Customer Attitude towards Coffee Shops in Norway: Comparative Study of Local and International Branded Coffee Shop. Master’s Thesis, Nord University, Bodø, Norway, 30 November 2018. [Google Scholar]
  24. Venkatesh, V.; Speier, C.; Morris, M.G. User acceptance enablers in individual decision making about technology: Toward an integrated model. Decis. Sci. 2002, 33, 297–301. [Google Scholar] [CrossRef] [Green Version]
  25. Ventatesh, V.; Davis, F.D. A theoretical extension of the technology acceptance model: Four longitudinal field studies. Manag. Sci. 2000, 46, 186–204. [Google Scholar] [CrossRef] [Green Version]
  26. Mead, D.; Moseley, L. The use of the Delphi as a research approach. Nurse Res. 2001, 8, 2–23. [Google Scholar] [CrossRef]
  27. Lynn, M.R. Determination and quantification of content validity. Nurse Res. 1986, 35, 382–385. [Google Scholar] [CrossRef]
  28. Lawshe, C.H. A quantitative approach to content validity. Pers. Psychol. 1975, 28, 563–575. [Google Scholar] [CrossRef]
  29. Olsson, U.H.; Foss, T.; Troye, S.V.; Howell, R.D. The performance of ML, GLS, and WLS estimation in structural equation modeling under conditions of misspecification and nonnormality. Struct. Equ. Model. 2000, 7, 557–595. [Google Scholar] [CrossRef]
  30. Ryu, E. Effects of skewness and kurtosis on normal-theory based maximum likelihood test statistic in multilevel structural equation modeling. Behav. Res. Methods 2011, 43, 1066–1074. [Google Scholar] [CrossRef] [PubMed] [Green Version]
  31. Kline, R.B. Principles and Practice of Structural Equation Modeling; The Guilford Press: New York, NY, USA, 2011. [Google Scholar]
  32. Hair, J.F.; Black, W.C.; Balin, B.J.; Anderson, R.E. Multivariate Data Analysis; Maxwell Macmillan International Editions: New York, NY, USA, 2010. [Google Scholar]
  33. Cortina, J.M. What is coefficient alpha? An examination of theory and applications. J. Appl. Psychol. 1993, 78, 98–104. [Google Scholar] [CrossRef]
  34. Fornell, C.; Larcker, D.F. Evaluating structural equations with unobservable variables and measurement error. J. Mark. Res. 1981, 18, 39–50. [Google Scholar] [CrossRef]
  35. Bentler, P.M. Comparative fit indexes in structural models. Psychol. Bull. 1990, 107, 238–246. [Google Scholar] [CrossRef]
  36. Bentler, P.M.; Bonett, D.G. Significance tests and goodness of fit in the analysis of covariance structures. Psychol. Bull. 1980, 88, 588–606. [Google Scholar] [CrossRef]
  37. Gefen, D.; Straub, D.W.; Boudreau, M. Structural equation modeling and regression: Guidelines for research practice. Commun. Assoc. Inf. Syst. 2000, 4, 1–79. [Google Scholar] [CrossRef] [Green Version]
  38. Bollen, K.A. Structural Equations with Latent Variables; John Wiley & Sons Inc.: New York, NY, USA, 1989. [Google Scholar]
Figure 1. Research flow for the present work.
Applsci 11 07805 g001
Figure 2. Developer Experience: conceptual framework (adapted from Fagerholm and Münch, 2012).
Applsci 11 07805 g002
Figure 3. The results of the test of nomological validity.
Applsci 11 07805 g003
Table 1. Pilot items for the measurement of cognitive factor and calculated CVRs.
ItemsCVRReference
1It provides developers with a superior development environment compared to other platforms.0.5Back and Parks (2003) [21]
2Compared to other platforms, it provides developers with a more stable development environment.1
3It provides convenience to developers.1Chowdhury and Salam (2015) [22]
4It provides developers with a high level of information.0.5
5It provides developers with a variety of add-on options (e.g., apps, resources, etc.).1
6It provides comfort for developers.0.5
7A fair policy applies to developers without exception.−0.5
8It provides developers with high-quality value for information.1Khanal (2018) [23]
9It provides developers with high-quality value for their resources.1
10It provides developers with high-quality value for their technology.1
11It provides developers with a variety of values for information.0
12It provides developers with a variety of values for their resources.0.5
13It provides developers with a variety of values for technology.0
14The price of the platform is reasonable.0.5
15The platform is fast.1
16The interaction between the platform and the developer is clear.1Venkatesh, Speier, and Morris (2002) [24]
17The interaction between the platform and the developer does not require much mental effort.1
18It is easy for developers to use the platform.1
19It is easy to do what the developer wants to do.1
20It evolves the work the developer wants to do.0.5
21It increases the productivity of the developer’s development work.0.5
22It improves the efficiency of the developer’s development work.1
23It increases the usefulness of developer’s development work.1
Table 2. Pilot items for the measurement of affective factor and calculated CVRs.
ItemsCVRReference
1. Developers love to use the platform.0.5Back and Parks (2003) [21]
2. It feels good when developers use the platform.0
3. It’s fun when developers use the platform.0Chowdhury and Salam (2015) [22]
4. It’s fun when developers use the platform.0.5
5. Developers are intrigued when they use the platform.1
6. The platform is attractive.1Ahn and Back (2018) [20]
7. Developers get a positive feeling from the platform.1
8. Developers feel value from the platform.1Khanal (2018) [23]
9. The platform is simple.0
10. Developers feel satisfied with the platform.0.5Venkatesh, Speier, and Morris (2002) [24]
Table 3. Pilot items for the measurement of behavioral factor and calculated CVRs.
ItemsCVRReference
1Even higher prices this platform compared to other platforms, developers are now flat form has the idea that you need to use.1Back and Parks (2003) [21]
2Developers intend to use the platform.1
3Developers have a plan to use the platform.1Ahn and Back (2018) [20]
4Developers have an effort to use the platform.0.5
5Developers have the will to pay additional costs to use the platform.1Khanal (2018) [23]
6Developers think that even if there is a cost to use the platform, it will not significantly affect the use of the platform.0.5
7Developers have a clear idea that they will use the platform again.1
8If a developer has access to the platform, he/she makes the developer intend to use the platform.1Venkatesh, Speier, and Morris (2002) [24]
9If a developer has access to the platform, it gives that developer a willingness to use the platform.1
10It gives developers the idea that the platform can be used voluntarily.1Venkatesh and Davis (2000) [25]
11The developer of superior flat form without the use of force developers had the idea that you can use with the free will of its platform1
Table 4. Demographic profile for respondents (N = 225).
CategoryItemFrequency%
GenderMale17879.1
Female4720.9
Age20s7935.1
30s12153.8
40s2410.7
50s10.4
Last educational backgroundFour-year university program19084.4
Graduate School Master’s Degree (Engineering Major)2410.7
Postgraduate Ph.D.114.9
Sum 225100
Table 5. Descriptive statistics for item measures: Mean, SD, Skewness, Kurtosis.
ItemsMeanS.D.SkewnessKurtosis
C1. Compared to other platforms, it provides developers with a more stable development environment. (2)6.021.161−0.76−0.84
C2. Provides convenience to developers. (3)5.811.207−0.85−0.07
C3. Provides developers with a variety of add-on options (e.g., apps, resources, etc.). (5)5.571.227−0.680.056
C4. It provides developers with high-quality value for information. (8)5.891.267−1.170.9
C5. It provides developers with high-quality value for their resources. (9)6.061.182−1.281.08
C6. It provides developers with high-quality value for technology. (10)6.141.175−1.381.532
C7. The platform is fast. (15) 6.041.213−1.070.066
C8. The interaction between the platform and the developer is clear. (16)5.951.16−1.060.645
C9. The interaction between the platform and the developer does not require much mental effort. (17)5.71.186−0.69−0.27
C10. It is easy for developers to use the platform. (18)6.241.213−1.340.443
C11. It is easy to do what the developer wants to do. (19)5.951.173−0.940.09
C12. Improves the efficiency of the developer’s development work. (22)5.980.984−0.810.291
C13. Increases the usefulness of the developer’s development work. (23)5.851.212−0.6−0.97
E1. Developers are intrigued when they use the platform. (5)5.641.11−0.44−0.53
E2. The platform is attractive. (6)5.751.086−0.53−0.37
E3. Developers get a positive feeling from the platform. (7)5.481.094−0.35−0.25
E4. Developers feel value from the platform. (8)5.650.994−0.21−0.76
D1. Even if the platform price is high compared to other platforms, I think that developers should use the current platform. (1)5.841.053−0.58−0.22
D2. Developers intend to use the platform. (2)5.841.043−0.66−0.05
D3. Developers have a plan to use the platform. (3)5.661.181−0.710.122
D4. Developers have the will to pay additional costs to use the platform. (5)5.841.101−0.76−0.15
D5. Developers have a clear idea that they will use the platform again. (7)5.871.146−0.81−0.03
D6. If a developer has access to the platform, he/she makes the developer intend to use the platform. (8)5.91.095−0.870.118
D7. If a developer has access to the platform, it gives that developer a willingness to use the platform. (9)5.541.138−0.47−0.42
D8. It gives developers the idea that the platform can be used voluntarily. (10)5.521.118−0.56−0.18
D9. Even if the developer’s boss does not force the use of the platform, it makes the developer feel that they can use the platform freely. (11)5.861.187−1.372.713
Note. The value in parenthesis denotes the number of pilot items.
Table 6. The results of the exploratory factor analysis.
ItemComponent
123
C1 *0.4070.2190.29
C20.6710.236−0.038
C30.668−0.1080.283
C40.821−0.0610.005
C50.89−0.068−0.01
C60.822−0.0350.109
C70.8350.040.054
C80.6930.245−0.071
C9 *0.3460.0750.423
C100.7410.0740.07
C110.5990.3410.009
C12 *0.4410.4370.03
C13 *0.4490.37−0.028
E10.157−0.0950.828
E20.2530.0310.717
E3−0.1990.3560.714
E40.1160.0990.676
B10.1490.5890.103
B20.0260.5460.357
B30.0250.7420.084
B40.1070.7530.04
B50.0360.6870.201
B60.1320.6780.119
B7−0.1590.8010.116
B80.0130.732−0.077
B90.170.567−0.174
eigenvalue12.9271.9771.55
%variance49.727.6055.96
Cronbach’s alpha0.9390.8580.905
Note. * Items discarded in the final analysis.
Table 7. The results of the confirmatory factor analysis.
Second-Order ConstructFirst-Order ConstructItemsStandardized Factor LoadingAVEComposite Reliability
DX 0.8490.7160.883
Cognitive
componentC20.820.620.936
C30.707
C40.693
C50.75
C60.799
C70.862
C80.829
C100.783
C110.827
0.799
Affective
componentE10.7980.6050.859
E20.878
E30.709
E40.714
0.888
Behavioral
componentB10.6840.590.909
B20.74
B30.783
B40.818
B50.813
B60.838
B70.683
Table 8. The results of the confirmatory factor analysis.
ConstructAVECognitiveAffectiveBehavioral
Cognitive0.620.787
Affective0.6050.6780.778
Behavioral0.590.7540.7090.768
Table 9. The results of the calculation of model fit indexes.
Model Fit Indexχ2/dfNFICFITLIIFIRMSEA
Measurement model2.4320.8850.9280.9170.9290.08
Minimum criteria(≤3.0)(≥0.8)(≥0.8)(≥0.9)(≥0.9)(≤0.08)
Publisher’s Note: MDPI stays neutral with regard to jurisdictional claims in published maps and institutional affiliations.

