Article

SAET: The Non-Verbal Measurement Tool in User Emotional Experience

1
Car Interaction Design Lab, College of Arts and Media, Tongji University, Shanghai 201804, China
2
College of Design and Innovation, Tongji University, Shanghai 200092, China
*
Authors to whom correspondence should be addressed.
Appl. Sci. 2021, 11(16), 7532; https://doi.org/10.3390/app11167532
Submission received: 28 July 2021 / Revised: 13 August 2021 / Accepted: 14 August 2021 / Published: 17 August 2021
(This article belongs to the Special Issue State-of-the-Art in Human Factors and Interaction Design)

Abstract

:
In this paper, the development process and validation of a self-assessment emotion tool (SAET) is described, which establishes an emotion-assessment method to improve pictorial expression design. The tool is based on an emotion set of emotional-cognition-derived rules obtained from an OCC model proposed by Ortony, Clore, and Collins, and the emotion set and expression design are validated by numerical computation of the dimensional space pleasure–arousal–dominance (PAD) and the cognitive assessment of emotion words. The SAET consists of twenty images that display a cartoon figure expressing ten positive and ten negative emotions. The instrument can be used during interactions with visual interfaces such as websites, posters, cell phones, and vehicles, and allows participants to select interface elements that elicit specific emotions. Experimental results show the validity of this type of tool in terms of both semantic discrimination of emotions and quantitative numerical validation.

1. Introduction

Emotions are essential in life. Everything from our most basic perceptions [1] to our deepest and most heartfelt love [2] is influenced by emotional processes. With respect to product interaction and visual design, etc., users have different emotional experience processes regarding man-made objects carefully constructed by designers. In roughly the last forty years, there has been a considerable amount of research on the experience of human–computer interaction. In the field of user experience research, its main focus is on the emotional response to the human–computer interaction [3,4].
Emotions could exert a broad impact on the formation of human–computer interactions, the communication of the interaction, and the evaluation of the object of the interaction [3,5]. To assess the impact of this important factor, researchers have used a variety of tools in academic and practice-based design research. The methods used for such investigations are usually validated emotion-measurement instruments from the field of experimental psychology (for example [3,6,7]). The disadvantage of these methods is that they are not always well-suited to the highly interactive nature of digital media. Most methods are applied after the experiment, providing a measure of the overall experience [8]. Some other physiological instruments can also present the intensity of emotions but it is difficult to discern what kind of emotion is being elicited. Moreover, some emotions with low arousal are difficult to capture. Self-reported measurement instruments have become an effective means of designing studies and surveys because of their advantages in terms of low cost and efficient collection. This study describes a non-verbal text-based self-assessment emotion tool (SAET), which was developed through the OCC model [9] based on the well-established derived rules for emotion perception, and the validation of the numerical computation of the emotion set and image PAD [10] dimension space, as well as the dual validation of image and textual ideation, which was conducted to finally explore the resulting measurement tool with comprehensive coverage of emotion categories and high image-recognition.
In this paper, we introduce theories related to emotion and emotion models firstly in Section 2, and briefly review some major emotion measurement tools for non-verbal texts. Based on this, in Section 3 we discuss our research direction, method, and design schemes. The SAET we studied is an emotion measurement tool based on an OCC model proposed by Ortony, Clore, and Collins with emotion-cognitive-derived rules to deduce emotion sets, and then numerical computation of the dimensional space pleasure–arousal–dominance (PAD) to validate the emotion sets and expression designs. Section 4 presents the validation study of SAET images we conducted. The experimental results show the validity of this type of tool in terms of both emotion semantic discrimination and quantitative numerical validation. Finally, Section 5 presents the usage, limitations, and summary of SAET. This paper proposed an emotion-measurement tool for non-verbal texts, and the emotion-assessment method it establishes can also help improve the design of pictorial expressions.

2. Related Work

2.1. Emotion and Emotional Space

Human research on emotions has a profound history and hundreds of ways of describing them have been proposed during this long process. Emotions are feelings that include all of the human organism, with its senses, mentality, and spirit [11]. Emotions have different meanings and ways of being understood in various disciplines. The focus of research has involved many aspects, all of which can be divided into two overall concerns: the study of the formation mechanism of emotions, and the study of the classification of types of emotions and methods of measurement [12].
One of the most important research orientations in the study of the formation mechanism of emotion is the far-reaching cognitive appraisal theory, which is based on previous psychological studies of emotion. Its basic idea is to direct environmental influences from objective stimuli to cognitive appraisal and to push physiological influences from the arousal row activity of the autonomic nervous system to the higher cognitive activity of the cerebral cortex. The representative theoretical model is the OCC model proposed by Ortony, Clore, and Collins (1988) [9], which expresses emotions in terms of a series of cognitively derived conditions.
In this model, emotions are assumed to be constituted by events (happy or not), actions (satisfied or not), objects (liked or not) and dispositional (positive or negative) responses to situations. It is inferred inductively through different cognitive conditions, and approximately 22 emotion types are specified, including the basic construct rules used to generate these emotion types, providing a taxonomy of emotions and giving the underlying reasoning process. For example, “Worry about not being needed by others” or “Will be forgotten” is an unpleasant thing, “Worry” indicates that things will be unhappy if they happen, and “Will be forgotten” indicates that the outcome is related to oneself. According to the generation rules of the emotion “Fear” in the OCC model, the sentence will be identified as having the emotion of fear and worry.
In contrast to the emotion generation rules of the OCC model, the other uses an explicit multidimensional space to express emotions. One of the main ideas of emotion classification research is to organize the various types of emotions relationally through different quantities (or dimensions). Dimensionality is a characteristic of emotions, and different theories of emotions have proposed a wide variety of dimensional divisions, all of which are useful for the understanding of emotions, and the greatest usefulness is a basis for establishing tools for measuring emotions.
One of the representative studies is the PAD model of emotion proposed by Mehrabian et al. (1996) [10], which consists of Pleasure (positive and negative charac-teristics of an individual’s emotional state), Arousal (the individual’s level of neuro-physiological activation), and Dominance (the individual’s state of dominance over situations and others) The three dimensions are independent of each other. +P and −P denote positivity and negativity, +A and −A denote high and low activation, and +D and −D are used for active and passive. It has been shown that the PAD three-dimension spatial model can effectively measure and explain human affective states [13]. Gebhard, Patrick (2005) proposed a layered model of affect (ALMA) [14], which introduces OCC emotion sets in the PAD space and assigns spa-tial coordinate values from −1 to +1 to these affective sets. This approach makes it pos-sible to manipulate the computational aspects of affect, to achieve quantitative ex-pressions of specific affect and to combine the cognitive generation rules of affect.

2.2. Non-Verbal Emotion Measurement Tool

Affective evaluation is the basis of affective design research. In design practice, affective measurement can be used to define the user experience of a product in the early stages of design, to evaluate the design or compare different prototypes in the middle stages, and to assess the type of affective expression of a product in the later stages [15]. The main methods of emotion measurement are self-reporting, physiological measurement and behavioral observation [12] among which self-reporting is an effective tool for designing studies and surveys due to its low cost and ease of large-scale information collection. Therefore, the development of self-reported forms of product-styling emotion measurement tools and design methods based on them have had positive implications for both affective-design research and product-development applications.
The self-reported measurement of emotions contains two representations: a verbal report questionnaire and a non-verbal text report questionnaire [16]. The former asks participants to indicate which words best match their feelings in reporting their current state, while the latter uses images or animations to represent emotions for participants to choose. Non-verbal text-based emotion measurement instruments do not convey emotions through words, and some studies have shown that such approaches are largely consensual across cultures.
Bradley and Lang’s (1994) [17] self-assessment manikin (SAM) is a three-dimensional self-report instrument of emotions based on the PAD model. SAM uses abstract two-dimensional characters to represent different levels of pleasure, arousal, and dominance. A nine-point scale is used to describe the scores of each dimension. Research has shown that the SAM can be used as an alternative to verbal report-based PAD scales in the form of non-verbal text, and has been used in emotion-assessment studies in a variety of domains such as home and advertising. Desmet, Hekkert, and Jacobs (2000) proposed a product emotion measure (PrEmo) [15] constructed by collecting a large number of design students’ emotional words about product appearance to construct 18 emotions to assess product appearance, and it has been widely used in industrial fields such as product design and automotive exterior styling. Later, in 2012, PrEmo2 [16] was iterated to improve the theoretical aspects of the emotion set and the design of the 2D images to better fit the meaning of the emotion words. The year 2017 saw the iteration of a self-reporting tool for emotions of 14 animated characters [18]. Pic-a-mood [19] is another scale that measures two dimensions of pleasure–arousal proposed by Vastenburg, Romero, van Bel and Desmet (2011), which has three persona designs for male, female, and robotic characters and is now used in research in the areas of airport experience, personal devices, and interactive media. Among the many non-verbal text measurement tools, the issue of recognition of certain images of emotions remains to be addressed. Studies have shown that positive-active class expressions are more difficult to recognize compared to negative emotions [20]. Furthermore, the issue of the number of emotion sets is still under-explored, and further research is needed to cover more categories while ensuring a concise and clear number of emotions in the tool. As the field matures, it is increasingly important to develop tools with a more comprehensive theoretical basis and validation.

3. The Design of the SAET
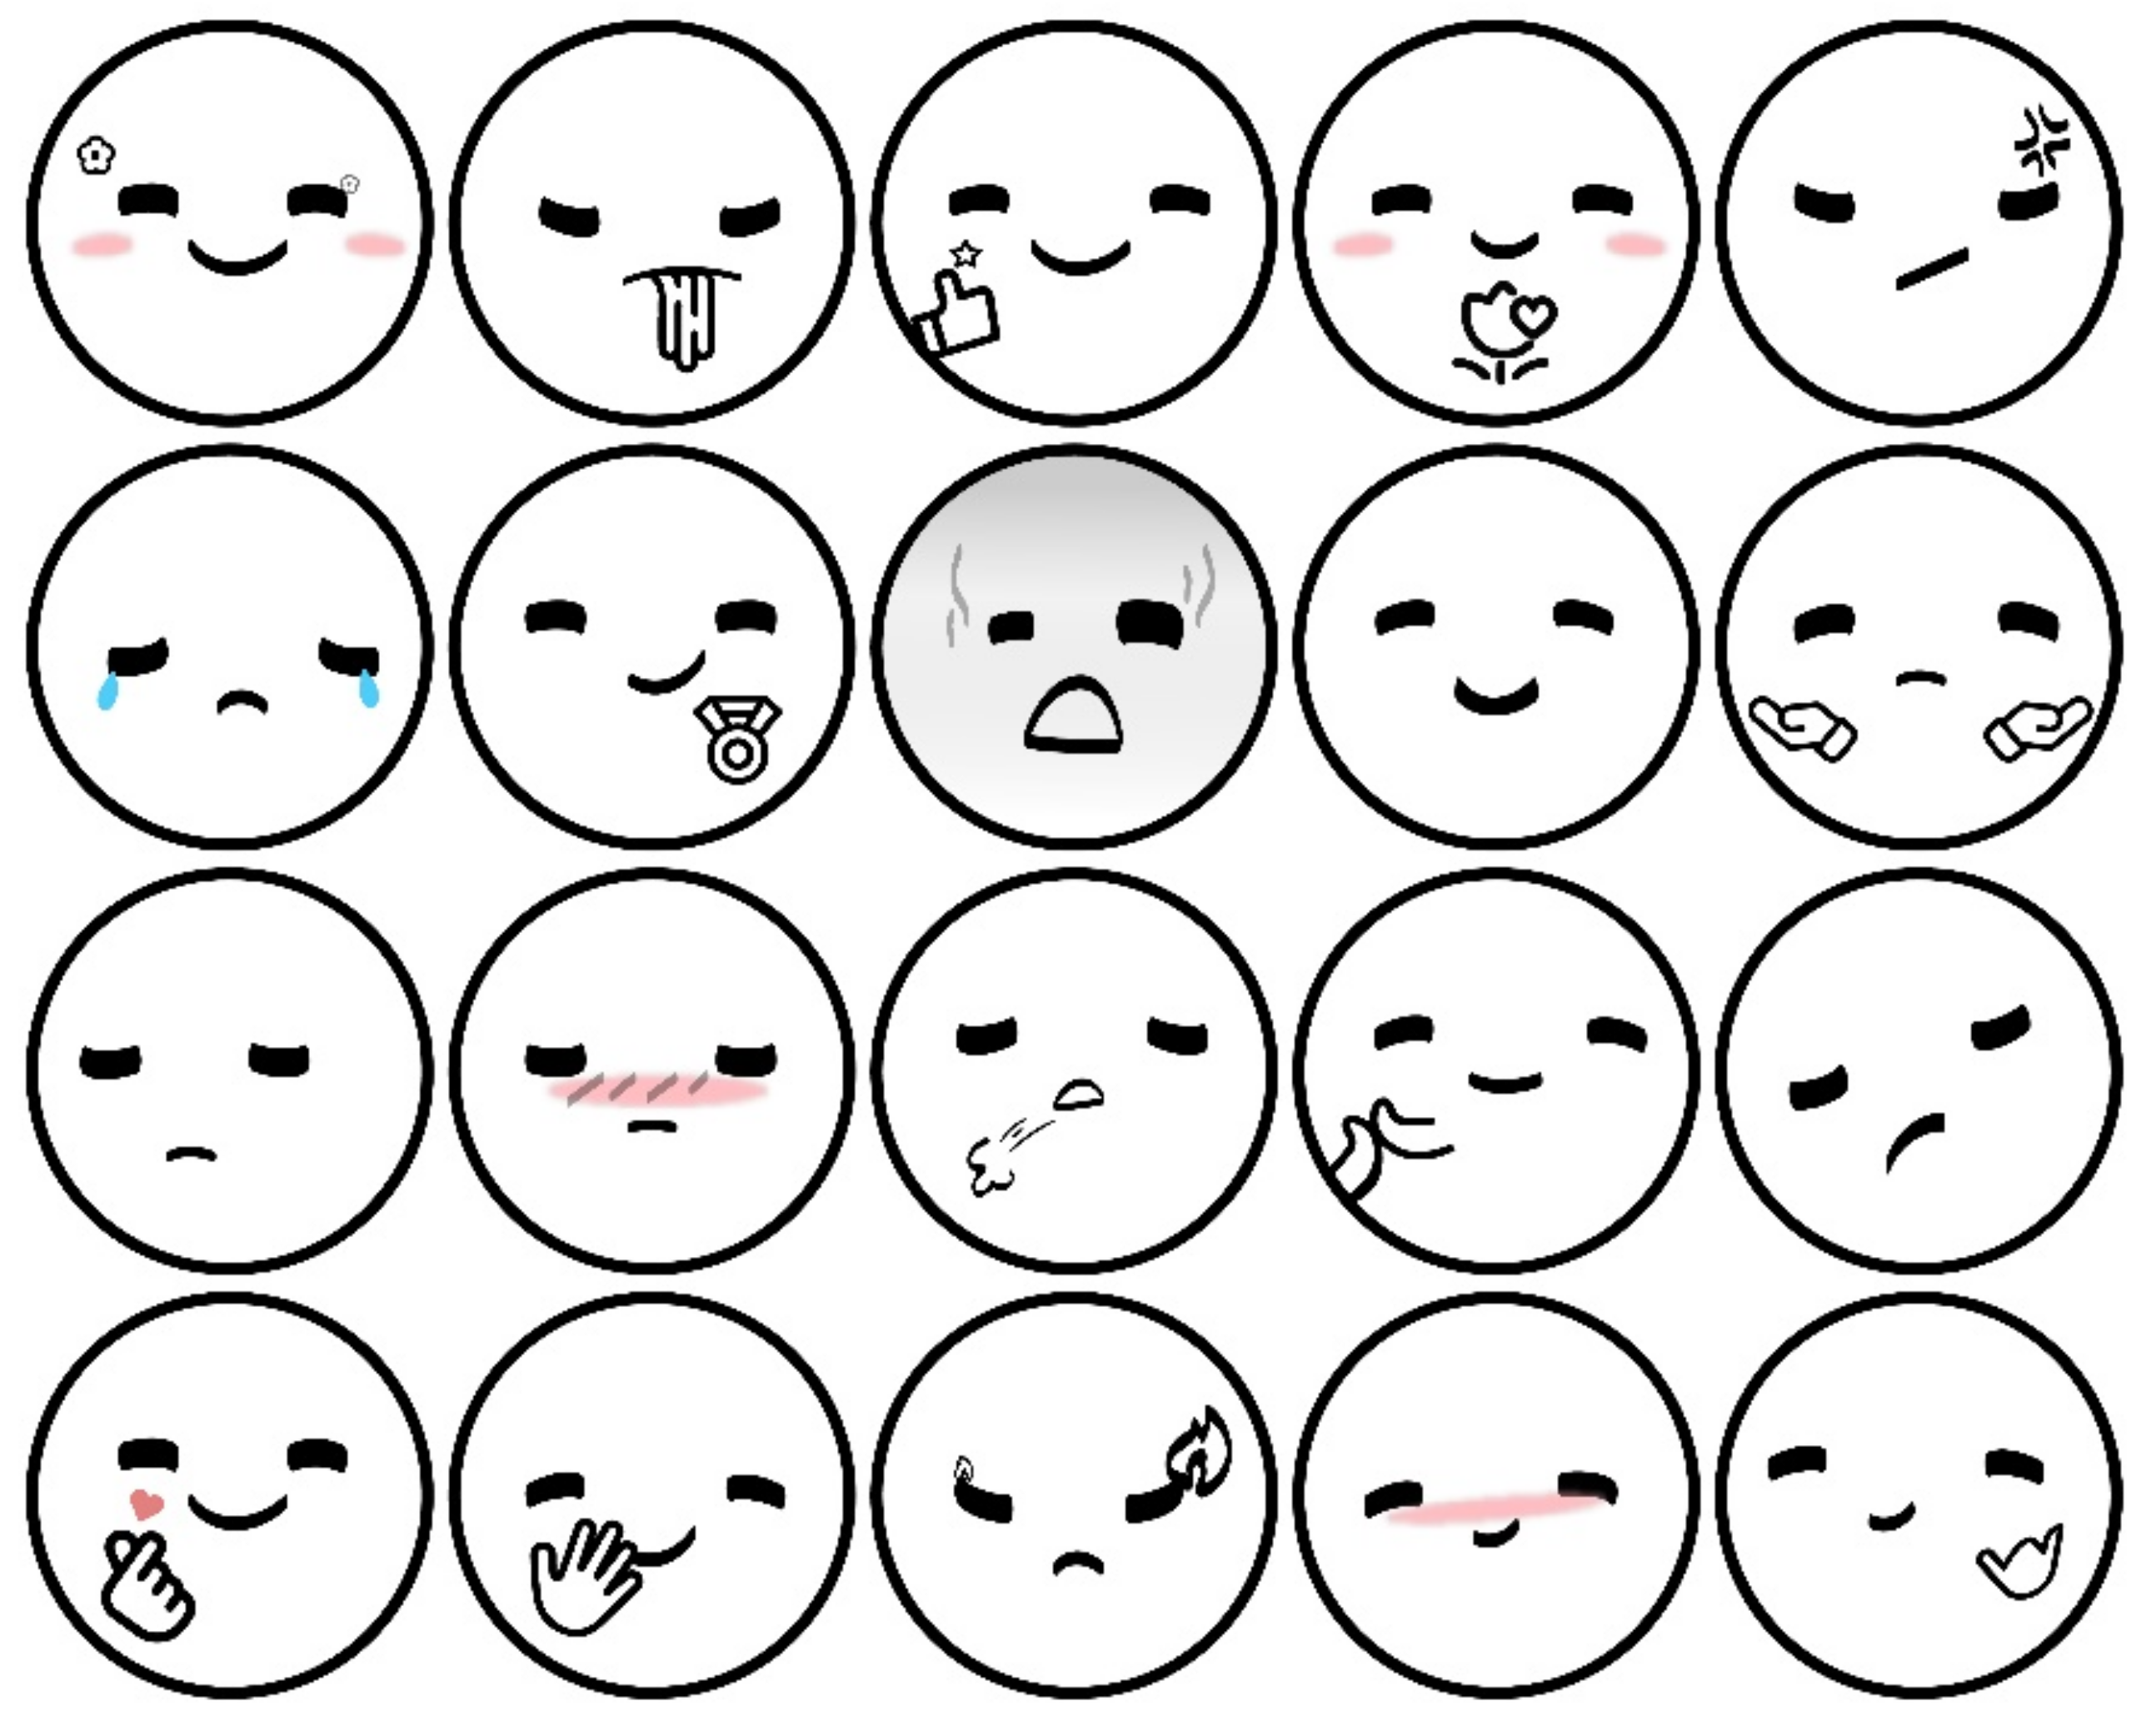
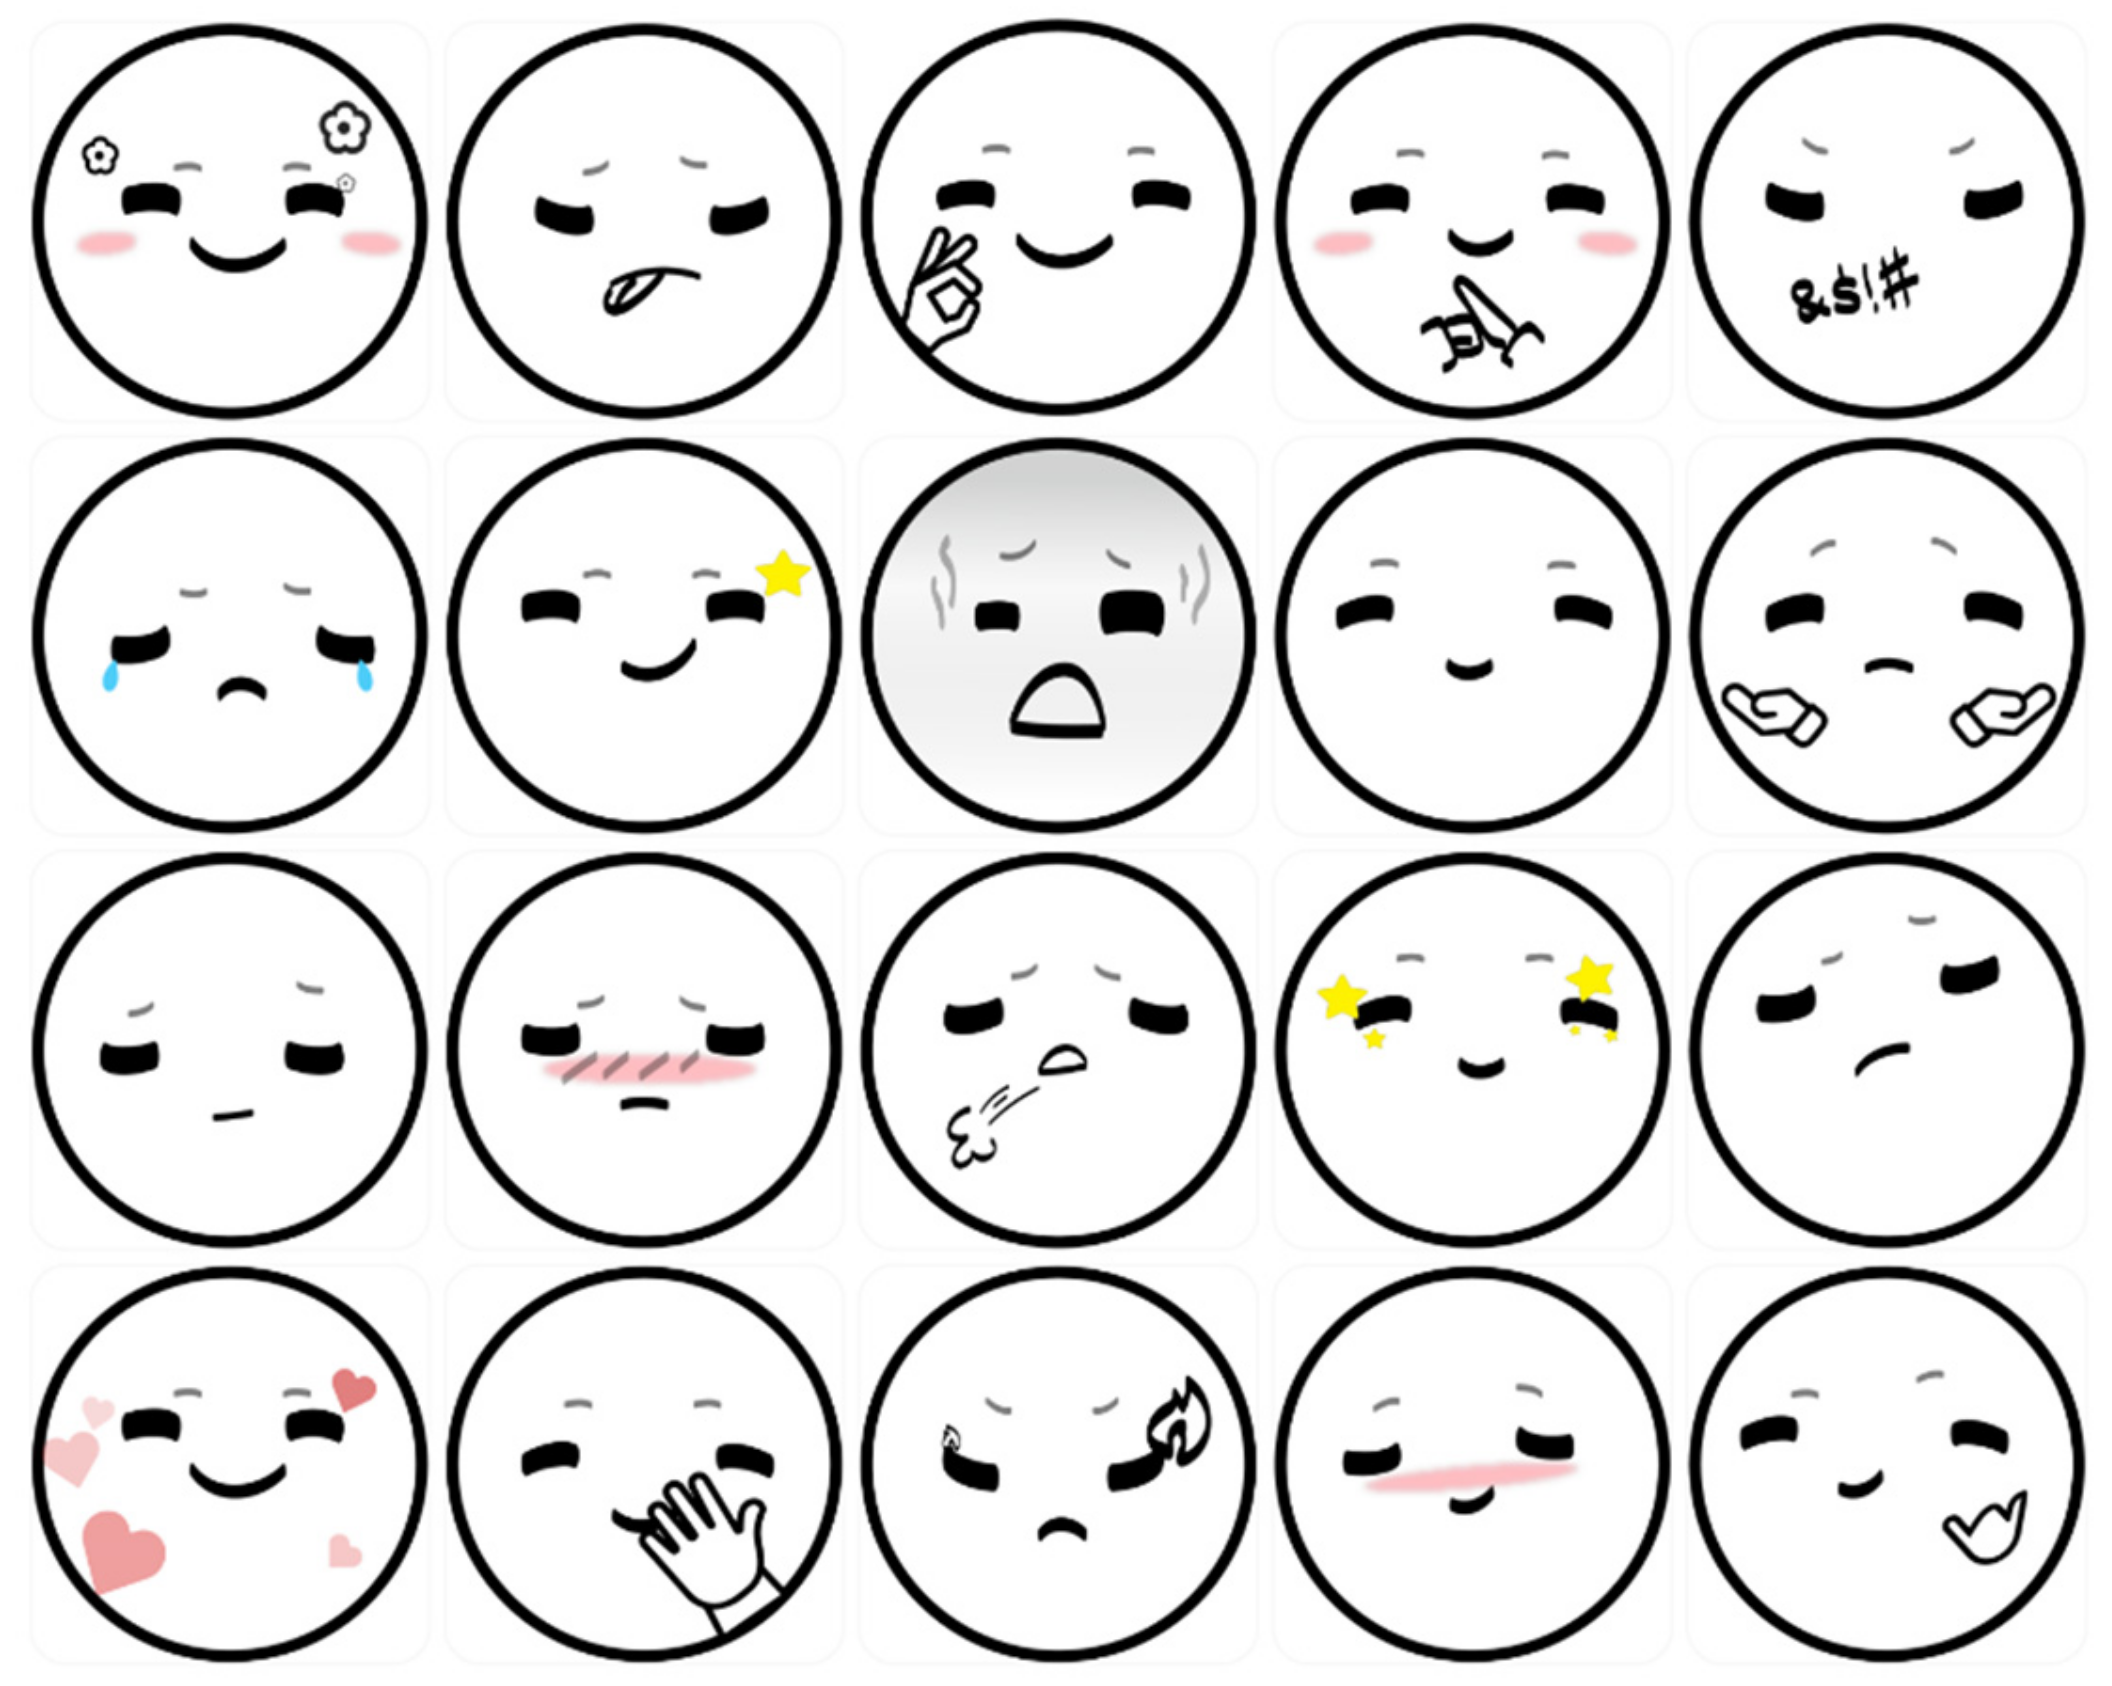
As discussed in the previous section, the non-verbal emotion measurement tool expresses emotion through images or animations, rather than words, so it is largely consensual across cultures and provides a more viable solution than verbal reports. Given the systematic academic and quantitative accuracy of affect-measurement tools, however, many factors need to be taken into account in the design of non-verbal emotion tools. Firstly, the use of an OCC model deriving rules from emotion cognition yields the emotion set of the tool, which gives it a firm theoretical foundation. Secondly, the numerical calculation of the dimensional space PAD is performed on the emotion set and expression design to verify the numerical relationship between emotion words and expression design, which renders the tool quantitatively accurate. Finally, the accuracy of the cognitive understanding of emotion words and expression designs can be ensured by directly matching the semantic meaning of the expression designs with the semantic meaning of the emotion words. SAET was developed with the above features and should be easy to use (i.e., in-process measurement), understandable (i.e., not too demanding for the participants) during operation, and should have the possibility of cross-cultural use. Because animations require time to play in their entirety, which would severely disrupt the participant’s interaction with the product or interface under evaluation, they are not applicable as content for the tool. For these reasons, the development of a new set of visual emotion measurement tools is necessary.

3.1. Emotion Set

In order to make the emotion set more comprehensive and cognitively meaningful, SAET used 22 emotion words generated by the emotion generation rules in the OCC model and added two additional emotions, “Boredom” and “Mildness”, from other emotion measurement tools [16]. Thus, 24 emotion types were formed.
Since the OCC model uses cognitive evaluation rules to derive emotions, different objects, events, and other factors may yield similar emotion words. Therefore, it is necessary to rate these 24 emotion words on the SAM scale at the first stage to derive the PAD value of each emotion word, and then to conduct relevance analysis. If two or more emotions are correlated in terms of values in the dimensional space and the words have very similar meanings, only one of them needs to be retained for the sake of simplicity of the measurement tool.
The PAD values of emotion words were evaluated among college students and the general population, and 178 results were collected through both online and offline methods, of which 153 were valid. The normal distribution test was conducted on the data results and it was found that the data did not conform to the normal distribution, so Spearman correlation analysis was used to make a two-by-two comparison between emotions. If two emotions were correlated at the same time in all three dimensions of pleasure, arousal and dominance, they were marked with orange color blocks as shown in Figure 1 (those that did not correlate with other words are not shown). The results show that the four groups of emotions, “gratification” and “satisfaction”, “joy” and “happy-for”, “remorse” and “pity”, and “distress” and “fears confirmed”, are highly correlated, and close in Chinese semantics. Therefore, one of the four groups was excluded and the other 20 emotions were retained to form the emotion set of SAET. The SAM scale scores of 1–9 were converted to an interval of −1 to +1, and the final scores are shown in Table 1.

3.2. The Emotion Design of SAET

Image design is generally classified as anthropomorphic, symbolic, and abstract. Symbolic design tends to make it easier for people to project their identities onto the robot [21], so a symbolic design style was used to allow users to better experience their emotions vicariously. Dynamic expressions are more expressive than static expressions, but static images were chosen to make the emotion measurement tool simpler and to cause as little visual fatigue as possible. The image was designed around a highly expressive face, containing eyes and a mouth as elements.
The eye is an important organ in facial expressions that reflect emotions [22]. The direction of eye gaze can convey the focus of facial attention and also show the motivation of a person’s behavior. When a person is in a positive emotion, the concave side of the eye usually faces down, indicating emotions such as happiness, gratitude, and pride; in a negative emotion, the concave side of the eye faces up, indicating that the avatar is experiencing an emotion such as shame, sadness, or anger. When the eyes are slightly narrowed, it indicates that the avatar is in a state of gentleness and relaxation. The change in the mouth is also one of the criteria for judging the expression of emotion. When the corners of the mouth are curved upward, the emotions are mostly positive emotions such as joy, hopefulness, gratitude, and admiration. The greater the curve of the mouth upward, the higher the pleasantness; while in sadness, shame, hostility and other emotions, the corners of the mouth face downward. Emoticons, as visual symbolic auxiliary elements [23], express the emotions of characters more precisely through gestures, props, and other elements on the one hand, and convey emotions that cannot be accurately conveyed to users by words through visuals on the other hand, creating a relaxed and pleasant atmosphere while satisfying the function. In the use of emoticons, users of different ages, countries, and cultural backgrounds will all have the same understanding of the meaning of emoticons and reach a unity of cognition.
Figure 2 shows that many emotions have certain correlations in people’s cognition. In order to effectively distinguish various types of emotions, the facial expressions were designed in multi-color and integrated with emojis. After referring to the mapping relationship between the expression parameters of the animated Tom and Jerry [24] and the classic Disney animation characters and the facial expression features, we extracted iconic design elements that best fit the virtual image expressions and drew 20 emotion images. The emoji design of the virtual image refers to the visual emotion symbols of emojis [23], including facial expressions, hand gestures, and emoticons. Due to the specific application of the design in the experiment, which involves cooperation with industry content, here we ensure the size of the PAD value and the relationship between the positive and negative of the premise to retain the facial features of the eyebrows, eyes, and mouth to show the emotion design, as shown in Figure 2.

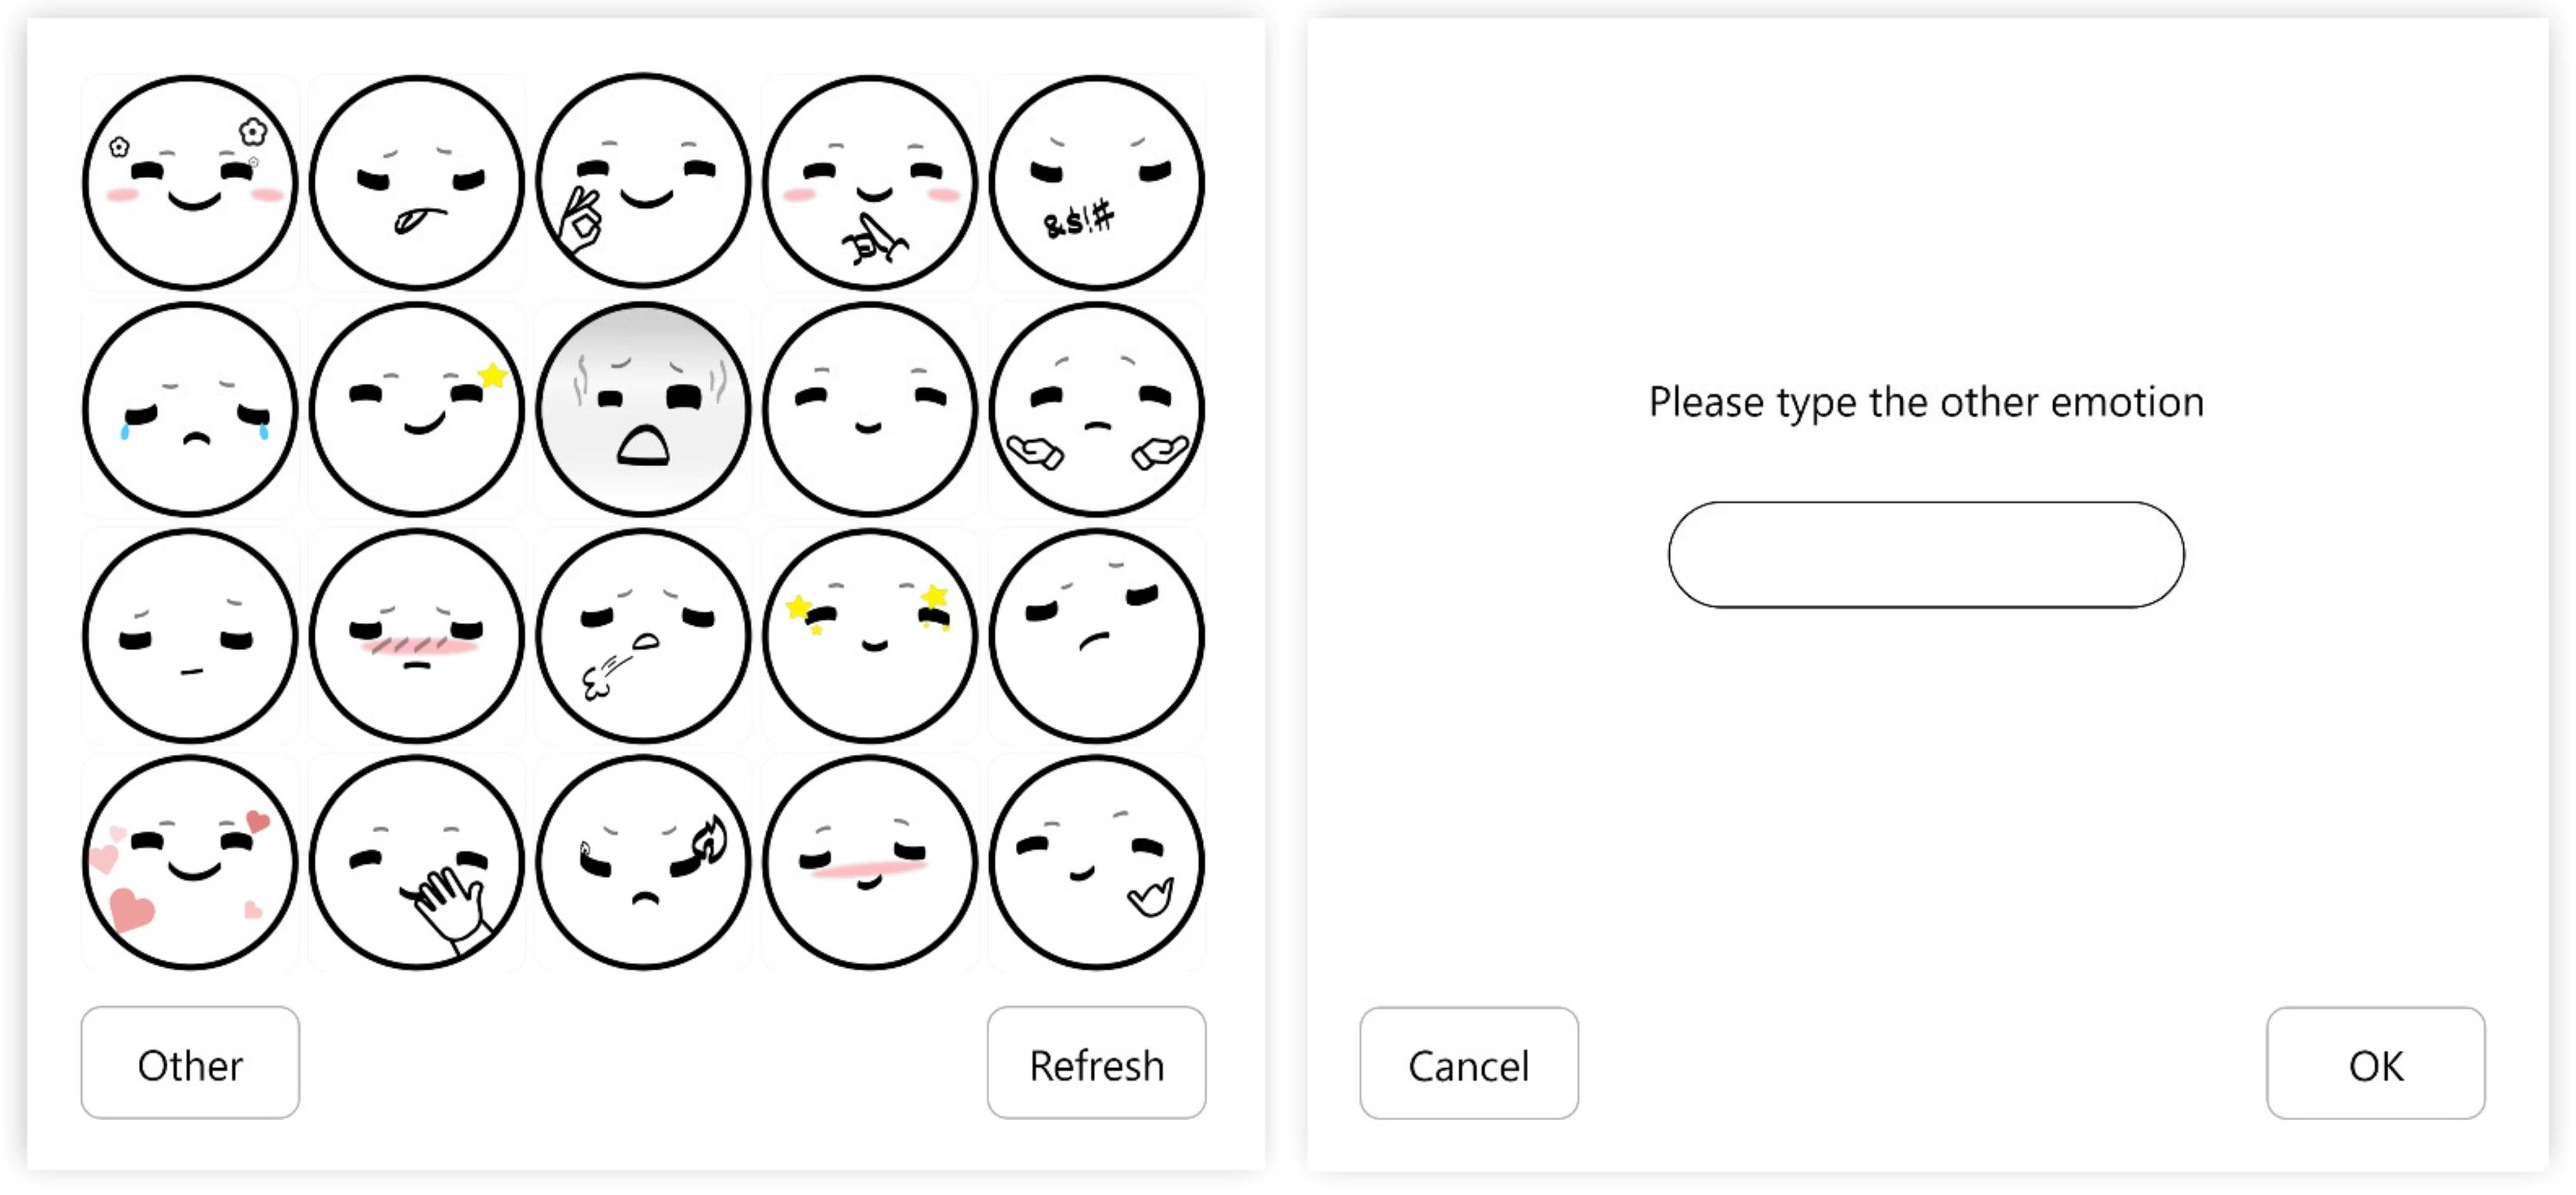
4. Validation of the SAET Images

A validation experiment was conducted to assess the recognizability of the SAET images, which was divided into a pilot study and a validation study. Participants were asked to rate the image by SAM to determine what score they thought the image was for each of pleasure, arousal, and dominance. For the validation study, they were also asked to choose the best emotion word for the image and indicate which emotion they thought the SAET image showed.

4.1. Pilot Study

Prior to the validation study, a pilot study was conducted. Its goal was to obtain the accuracy of the initially designed SAET images and iterate the image expression design from the results.

4.1.1. Participants

The participants were master and undergraduate students from Tongji University in China who were enrolled in a user research and interaction design course. A total of 9 male and 24 female students participated (N = 33). Their ages ranged from 20 to 26 years old (M = 22.09, SD = 2.3).

4.1.2. Apparatus

Participants used their cell phones to scan a QR code to enter and fill out the questionnaire. The SEAT images were played on the large screen in the conference room in randomized order.

4.1.3. Procedure

Participants were asked to score the expression design images on a three-dimensional (PAD) scale using the SAM scale. The experiment would automatically play the image for 6 s, and the participants were required to observe the image for that period. Subsequently, the playback screen would be blacked out for 10 s during which the participants would rate the images and then move on to the next image with a pause and black screen for the same duration, and so on until the material was all played out. In the experiment, the order of the images before and after was disrupted to balance the order effect. Participants judged independently throughout, without having mutual conversations with the experimenter or other people.

4.1.4. Results

In order to verify whether the expression design is in line with people’s perceptions, the design drawings need to be evaluated. The emotion images need to be converted to the interval from −1 to +1 according to a scale of 1–9, and the degree of the emotional tendency can be obtained by analyzing the distance relationship between the emotion images and the word PAD coordinates. The image with the smallest distance from the word is considered to be closer to the emotional tendency of that word, and the coordinate distances in the emotional space can be obtained using the Euclidean distance algorithm by calculating.
L n = p n p n 2 + a n a n 2 + d n d n 2 , n = 1 , 20 , n Z
L n is the coordinate distance between the static image and the 20 emotions in 3D space. P , A , D are the coordinate values of the measured emotional state e in the emotion space p n , a n , d n , the emotional word is e n , and p n , a n , d n are the figure f n . According to the coordinate values of the Formula (1), the distance between each picture and text can be calculated and labelled L 1 , L 2 , L 20 . If the static image f n p n , a n , d n calculates L 5 as the minimum of L n , then the emotional tendency of that static image corresponds to the fifth term of the textual emotion.
The results of the pilot study on the Euclidean distance of SAET images and emotion words are shown in Table 2. The yellow blocks indicate the distance between the emotion design and the corresponding text, and the green blocks indicate that the distance of the emotion from the text is smaller than the original design of the emotion. For example, the distance of the original design of emotion “Pride” to the word “Pride” is 0.54 (yellow), but the emoticons “Admiration,” “Gratitude,” “Happy-for,” and “Gloating” are 0.52, 0.43, 0.45 and 0.33 from the word “Pride” in the text, i.e., smaller than 0.54.

4.1.5. Discussion

The image designs with emotions that have green color blocks in each vertical column of Table 2 are considered to require modification and iteration. The PAD values of words can effectively guide the design element characteristics of expressions. For example, the PAD values for anger are (−0.74, 0.36, 0.26), which shows that people’s emotional tendency for anger is strongly unpleasant, moderately activated, and moderately low dominance, and the design direction can be eyes open like an inverted eight, eyebrows furrowed, and mouth tightly closed and pulled down. In contrast, the PAD values of sadness were (−0.75, −0.27, −0.55), it can be seen that people’s emotional tendency towards sadness is strongly unpleasant, moderately low activated and moderately low dominated. The designed direction can be eyes slightly squinted, eyebrows slightly furrowed, eyes spaced wider and mouth slightly closed and slightly pulled down. In addition, in interviews with participants, it was found that many expressions struggle to represent differences in emotion relying only on the eyes and mouth, suggesting the inclusion of another key feature, the eyebrows. In a study by Ekman [25], eyebrow movement was found to be associated with communication and the type of facial emotion-expressive movements depended to a large extent on the ambient eyebrow dynamics. This shows that eyebrows are an element that cannot be ignored in the design of facial emotion expression, so the design iteration adds the element of eyebrows to the first round of experiments to further enhance the embodiment of different emotions in the images.
The iterative design of the image refers to the PAD value of the initial text on the one hand, and adds eyebrows and modifies emojis to the facial feature elements on the other hand such as red blush, yellow stars, and hand gestures. For example, the “satisfied” expression is expressed through the “OK” gesture, while “proud” is expressed through the one-sided rise of the mouth and the addition of yellow stars at the end of the eye. Finally, according to the relationship between the size of PAD values, positive and negative shapes, and facial features, the design of 20 emotion expressions was modified as shown in Figure 3.

4.2. Validation Study

Participants were asked to rate the image by SAM in the validation study, but in contrast to the pilot study also needed to select the emotion word that best matched this image and indicate which emotion they thought the SAET image showed.

4.2.1. Participants

We conducted a validation study of the images offline with a population of college students and faculty members in a total of two rounds, and a total of 50 valid results were collected. A total of 26 male and 24 female Chinese participants took part in the study (N = 50). The age of the participants ranged from 19 to 33 years (M = 23.9, SD = 3.05).

4.2.2. Apparatus

Similarly, participants used their cell phones to scan a QR code to access and fill out the questionnaire. SEAT images were played in randomized order on a large screen in the conference room.

4.2.3. Procedure

The validation study was divided into two rounds. In the first round, SAM was used to score the expression design drawings in three dimensions (PAD), which was consistent with the steps of the pilot study. In the experiment, the image would automatically play and stay for 6 s, during which time the participant would observe it. Then the playback interface will be blacked out for 10 s, during which time the participant would score the image before moving on to the next, and so on until the material was played out. The first round thus had the same experimental scheme as the pilot.
After the first round of the experiment, a 5 min break was taken to enter the second round which required the selection of the closest Chinese emotion word for the design drawing. The second round of the experiment was the same, with the images automatically played on a large screen in randomized order and then blacked out after 6 s, except that the questionnaire filled in by the participants was replaced by multiple-choice questions with emotional words. The participant was given 10 s to select the emotional meaning he or she thought the image represented. During this process, participants judged independently and did not have mutual conversations with the experimenter or other people.

4.2.4. Result

The results of the first round of this validation study on the Euclidean distance between SAET images and the PAD of emotion words are shown in Table 3. The results show that after the design iterations, the Euclidean distances of PAD values for most of the images corresponding to words are the smallest, except for “Admiration”, “Hope”, “Disappointment” and “Mildness.” For example, the distance between the word “Admiration” and the image “Gratitude” is 0.31, while the distance to the image “Admiration” is 0.43, and thus smaller than the distance to the image “Admiration”. Similarly, the distance between the word “Resentment” and the image “Shame” is 0.13, which is smaller than the distance to the image “Resentment”, which is 0.37; the word “Resentment” is smaller than the distance to the image “Shame”. The distance between the word “Hope” and the image “Love” is 0.06, respectively, which is slightly smaller than the distance (0.07) to the image “Hope”. The distances between the word “Disappointment” and the images “Pity” and “Distress” are 0.11 and 0.13, respectively, which is slightly smaller than the distance to the image “Disappointment”. The distance between the word “Disappointment” and the images “Pity” and “Distress” is 0.11 and 0.13 respectively, which is slightly smaller than the distance of 0.17 to the image “Disappointment”; the distance between the word “Mildness” and the image “Relief” is 0.09, and thus smaller than the distance of 0.19 to the image “Mildness”. Although the Euclidean distances between these four emotions and the image are not the smallest, they are small compared to other distances.
The accuracy results of the second round evaluation experiments for image selection of emotion words are shown in Table 4. The results show that all the expression designs have the highest accuracy rates, with individual accuracy rates ranging from 40% to 92%, which indicates that all of them represent the corresponding emotional word in terms of the emotional perception of the image designs. “Pride”, “Love”, “Satisfaction”, “Fear”, “Distress”, “Anger”, “Shame”, and “Gloating”—these eight emotion images are highly accurate and do not produce ambiguities with other emotions, especially “Love”, “Distress”, “Anger”. In particular, the accuracy of the three emotion images “Love”, “Distress” and “Anger” reached over 90%.
In addition, there are four types of emotions that are easy to confuse: “Reproach” and “Anger”, “Disappointment” and “Mildness”, “Mildness” and “Distress”, “Pity” and “Disappointment”. They are all at the same level of pleasantness, and there is no confusion between positive and negative emotions.

4.3. Conclusions

The results of the pilot and the validation study show that SAET’s image design is effective. Each designer’s image design for emotion yields different results. The deterministic design found through the pilot study differs somewhat from the results generally perceived by the public, and the analysis from the perspective of the PAD values provides designers with a very clear baseline. This is also reflected in the results of the validation study, where the image design has improved to a great extent.
Furthermore, although the results of the first round of the validation study showed that not every emotion had the smallest Euclidean distance, with the exception of resentment and shame, these emotion groups were significantly correlated to their text (Figure 4), so it is possible that the PAD values for the expression designs were less distant from the other significantly correlated texts. The results of the second round evaluation for the selection of emotion words for the images indicate that the emotion set is largely representative of the textual emotion meaning of the corresponding words in terms of the meaning represented by the expressions. As the composition of the emotion set itself is derived from cognitive rules, the correlations between emotion words are greatly enhanced when the richness of the emotion set is ensured, meaning that some emotion words are naturally confused with other emotion words. Therefore, a combination of the PAD minimum distance from the emotion words can be a good way to obtain an expression design that matches the words, while ensuring the highest correctness of the design.
At the same time, we observed how the male and female groups scored the expressions. For the most part, there were no significant differences between them, except for some obvious differences in the ratings of dominance. We found that for females, the score on the dominance dimension is higher in the positive emotions than that of the male among these differential scores, for example, in the emotion images “happy-for” and “satisfaction”, while the males had greater scores than women in the dominance dimension of ratings on negative emotions—for example, in the emotion images “Pity” and “Anger”. This may be since that women perceive positive emotions as more likely to affect others, while men perceive negative emotions as more likely to affect others. However, there is little data to support this conclusion, and there are exceptions—for example, women have a higher dominance score for “Resentment” compared to men. This therefore cannot be taken as a definitive rule.
Combining the experimental results from the pilot study and the validation study, it was found that the image designs in SAET after the iterations were effective in conveying the emotional meaning of the text, and the vast majority of them corresponded to the PAD values, which also indicates a good grasp of the intensity of the emotion.

5. Conclusions and Discussion

5.1. Methods of Application

SAET is a graphical self-reporting tool (Figure 4) that can be disseminated via a web-based questionnaire, currently available in both Chinese and English. The SAET interface is arranged in a four by five matrix with randomized expressions. When a participant makes a choice by clicking on an expression, the interface will be refreshed automatically. Participants can also manually click the refresh button at the bottom right to rearrange the emotions. Besides this, the participant is left with the possibility of making other choices such as clicking on the “Other” button in the bottom left corner to jump to the screen for entering the name of another type of emotion.

5.2. Limitations and Future Research

There are some limitations to this emotion measurement tool. Firstly, the number of emotion sets is large, in order to cover as many types of emotion as possible, and the correlation between more emotions can be seen from the correlation of the word. Therefore, the experimenter could have simplified the emotion set again if it were necessary for the sake of the simplicity of the instrument, which of course would have reduced the accuracy of the emotion assessment. When the amount of other types of emotions accumulates to a certain degree, it is possible that other emotions beyond the emotion set could be generated, and this is where this emotion measurement tool could be improved. Secondly, all the participants in this experiment were all native Chinese speakers. Different cultures may interpret emotions differently and obtain different scores, so this tool would be better applied in countries with similar cultural backgrounds to China.
Considering these limitations, future studies should expand the experimental population to other countries as a way to develop culturally diverse or generic versions for those similar cultural backgrounds, while continuing to iterate images with low accuracy. Finally, the usage of this tool to collect self-reported emotion related to real products is necessary to assess the reliability and validity of the design.

5.3. Conclusions

There are still areas of improvement for the SAET self-assessment emotion measurement tool, such as a broader group of participants and a more concise emotion set. However, overall the SAET is a theoretically sound, methodologically innovative, and practically meaningful instrument based on a well-established derived rule model of affective cognition and validated with dimensional spatial numerical calculations for the measurement of experienced emotions. It is also a visual tool that can compensate for the limitations of users in expressing their emotions in words and give them visual cues, which can be used both in the first stage of user research on emotional experiences and in the later stage of emotional evaluation of products or services. This three-dimensional approach to evaluating the emotion space can be used as a quantitative way to assess the design of expressions, providing a reference for the design of emotional experiences and expressions. The construction of a self-reported form of emotion measurement tool and emotion assessment method has positive implications for both the accumulation of academic research on emotion design and the practical application of user-experience design.

Author Contributions

Conceptualization, J.W., F.Y. and Y.L.; methodology, Y.L.; software, T.Y.; formal analysis, Y.L. and Y.W.; investigation, Y.L. and Y.W.; writing—original draft preparation, Y.L.; writing—review and editing, Y.L. and J.M.; supervision, J.W. and F.Y.; project administration, J.W. and F.Y.; funding acquisition, J.W. and F.Y. All authors have read and agreed to the published version of the manuscript.

Funding

This research was supported by the National Social Science Fund of China (No. 19FYSB040), CES-Kingfar Excellent Young Scholar Joint Research Funding (No. 202002JG26), China Scholarship Council Foundation (2020-1509), Shanghai Automotive Industry Science and Technology Development Foundation (No. 1717), and Shenzhen Collaborative Innovation Project: International Science and Technology Cooperation (No. GHZ20190823164803756).

Institutional Review Board Statement

Not applicable.

Informed Consent Statement

Not applicable.

Data Availability Statement

Data sharing not applicable.

Conflicts of Interest

The authors declare no conflict of interest.

References

  1. Zajonc, R.B. Feeling and thinking: Preferences need no inferences. Am. Psychol. 1980, 35, 151–175. [Google Scholar] [CrossRef]
  2. Scherer, K.R. What are emotions? And how can they be measured? Soc. Sci. Inf. 2005, 44, 695–729. [Google Scholar] [CrossRef]
  3. Hassenzahl, M.; Diefenbach, S.; Göritz, A. Needs, affect, and interactive products—Facets of user experience. Interact. Comput. 2010, 22, 353–362. [Google Scholar] [CrossRef]
  4. Law, E.L.; Roto, V.; Hassenzahl, M.; Vermeeren, A.P.; Kort, J. Understanding, scoping and defining user experience: A survey approach. In Proceedings of the SIGCHI Conference on Human Factors in Computing Systems, Boston, MA, USA, 4–9 April 2009; Association for Computing Machinery: New York, NY, USA, 2009; pp. 719–728. [Google Scholar]
  5. Forlizzi, J.; Battarbee, K. Understanding experience in interactive systems. In Proceedings of the 5th Conference on Designing Interactive Systems: Processes, Practices, Methods, and Techniques, Cambridge, MA, USA, 1–4 August 2004; Association for Computing Machinery: New York, NY, USA, 2004; pp. 261–268. [Google Scholar]
  6. Mahlke, S.; Minge, M. Consideration of Multiple Components of Emotions in Human-Technology Interaction. In Affect and Emotion in Human-Computer Interaction: From Theory to Applications; Springer: Berlin/Heidelberg, Germany, 2008; pp. 51–62. [Google Scholar]
  7. Thüring, M.; Mahlke, S. Usability, aesthetics and emotions in human–technology interaction. Int. J. Psychol. 2007, 42, 253–264. [Google Scholar] [CrossRef]
  8. Huisman, G.; Van Hout, M.; Van Dijk, E.; Van Der Geest, T.; Heylen, D. LEMtool: Measuring emotions in visual interfaces. In Proceedings of the SIGCHI Conference on Human Factors in Computing Systems, Paris, France, 27 April–2 May 2013; Association for Computing Machinery: New York, NY, USA, 2013; pp. 351–360. [Google Scholar]
  9. Ortony, A.; Clore, G.L.; Collins, A. The Cognitive Structure of Emotions; Cambridge University Press: Cambridge, MA, USA, 1988. [Google Scholar]
  10. Mehrabian, A. Pleasure-arousal-dominance: A general framework for describing and measuring individual differences in Temperament. Curr. Psychol. 1996, 14, 261–292. [Google Scholar] [CrossRef]
  11. Kleinginna, P.R.; Kleinginna, A.M. A categorized list of emotion definitions, with suggestions for a consensual definition. Motiv. Emot. 1981, 5, 345–379. [Google Scholar] [CrossRef]
  12. Shiota, M.N.; Kalat, J.W. Emotion, 2nd ed.; Wadsworth Cengage Learning: San Francisco, CA, USA, 2012. [Google Scholar]
  13. Russell, J.A.; Mehrabian, A. Evidence for a three-factor theory of emotions. J. Res. Pers. 1977, 11, 273–294. [Google Scholar] [CrossRef]
  14. Gebhard, P. ALMA: A layered model of affect. In Proceedings of the 4th International Joint Conference on Autonomous Agents and Multiagent Systems (AAMAS 2005), Utrecht, The Netherlands, 25–29 July 2005. [Google Scholar]
  15. Desmet, P.; Hekkert, P.; Jacobs, J. When a car makes you smile: Development and application of an instrument to measure prod-uct emotions. Adv. Consum. Res. 2000, 27, 111–117. [Google Scholar]
  16. Laurans, G.F.G.; Desmet, P.M.A. Introducing PrEmo2 new directions for the non-verbal measurement of emotion in design. In Out of Control: Proceedings of the 8th International Conference on Design and Emotion, London, UK, 11–14 September 2012; Central Saint Martins College of the Arts and the Design and Emotion Society: London, UK, 2012. [Google Scholar]
  17. Bradley, M.M.; Lang, P.J. Measuring emotion: The self-assessment manikin and the semantic differential. J. Behav. Ther. Exp. Psychiatry 1994, 25, 49–59. [Google Scholar] [CrossRef]
  18. Desmet, P.; Laurans, G. Developing 14 animated characters for non-verbal self-report of categorical emotions. J. Des. Res. 2017, 15, 214–233. [Google Scholar] [CrossRef] [Green Version]
  19. Vastenburg, M.; Romero Herrera, N.; Van Bel, D.; Desmet, P. PMRI: Development of a pictorial mood reporting instrument. In CHI ’11 Extended Abstracts on Human Factors in Computing Systems; Association for Computing Machinery: Vancouver, BC, Canada, 2011; pp. 2155–2160. [Google Scholar]
  20. Bassili, J.N. Emotion recognition: The role of facial movement and the relative importance of upper and lower areas of the face. J. Pers. Soc. Psychol. 1979, 37, 2049–2058. [Google Scholar] [CrossRef]
  21. Blow, M.; Dautenhahn, K.; Appleby, A.; Nehaniv, C.L.; Lee, D.C. Perception of Robot Smiles and Dimensions for Human-Robot Interaction Design. In Proceedings of the ROMAN 2006—The 15th IEEE International Symposium on Robot and Human Interactive Communication, Hatfield, UK, 6–8 September 2006; pp. 469–474. [Google Scholar]
  22. Kobayashi, H.; Suzuki, S.; Takahashi, H. Automatic extraction of facial organs and recognition of facial expressions. In Proceedings of the 8th IEEE International Workshop on Robot and Human Interaction. RO-MAN ’99 (Cat. No.99TH8483), Pisa, Italy, 27–29 September 1999. [Google Scholar]
  23. Zhao, Y. A study of audience psychology in emojis. Art Des. Res. 2016, 6, 46–49. [Google Scholar]
  24. Shao, Z. Visual Humor Representation of Cartoon Character Design—Taking Tom and Jerry as an Example. Decorate 2016, 4, 138–139. [Google Scholar]
  25. Ekman, P. About Brows: Emotional and Conversational Signals; Cambridge University Press: Cambridge, UK, 1979. [Google Scholar]
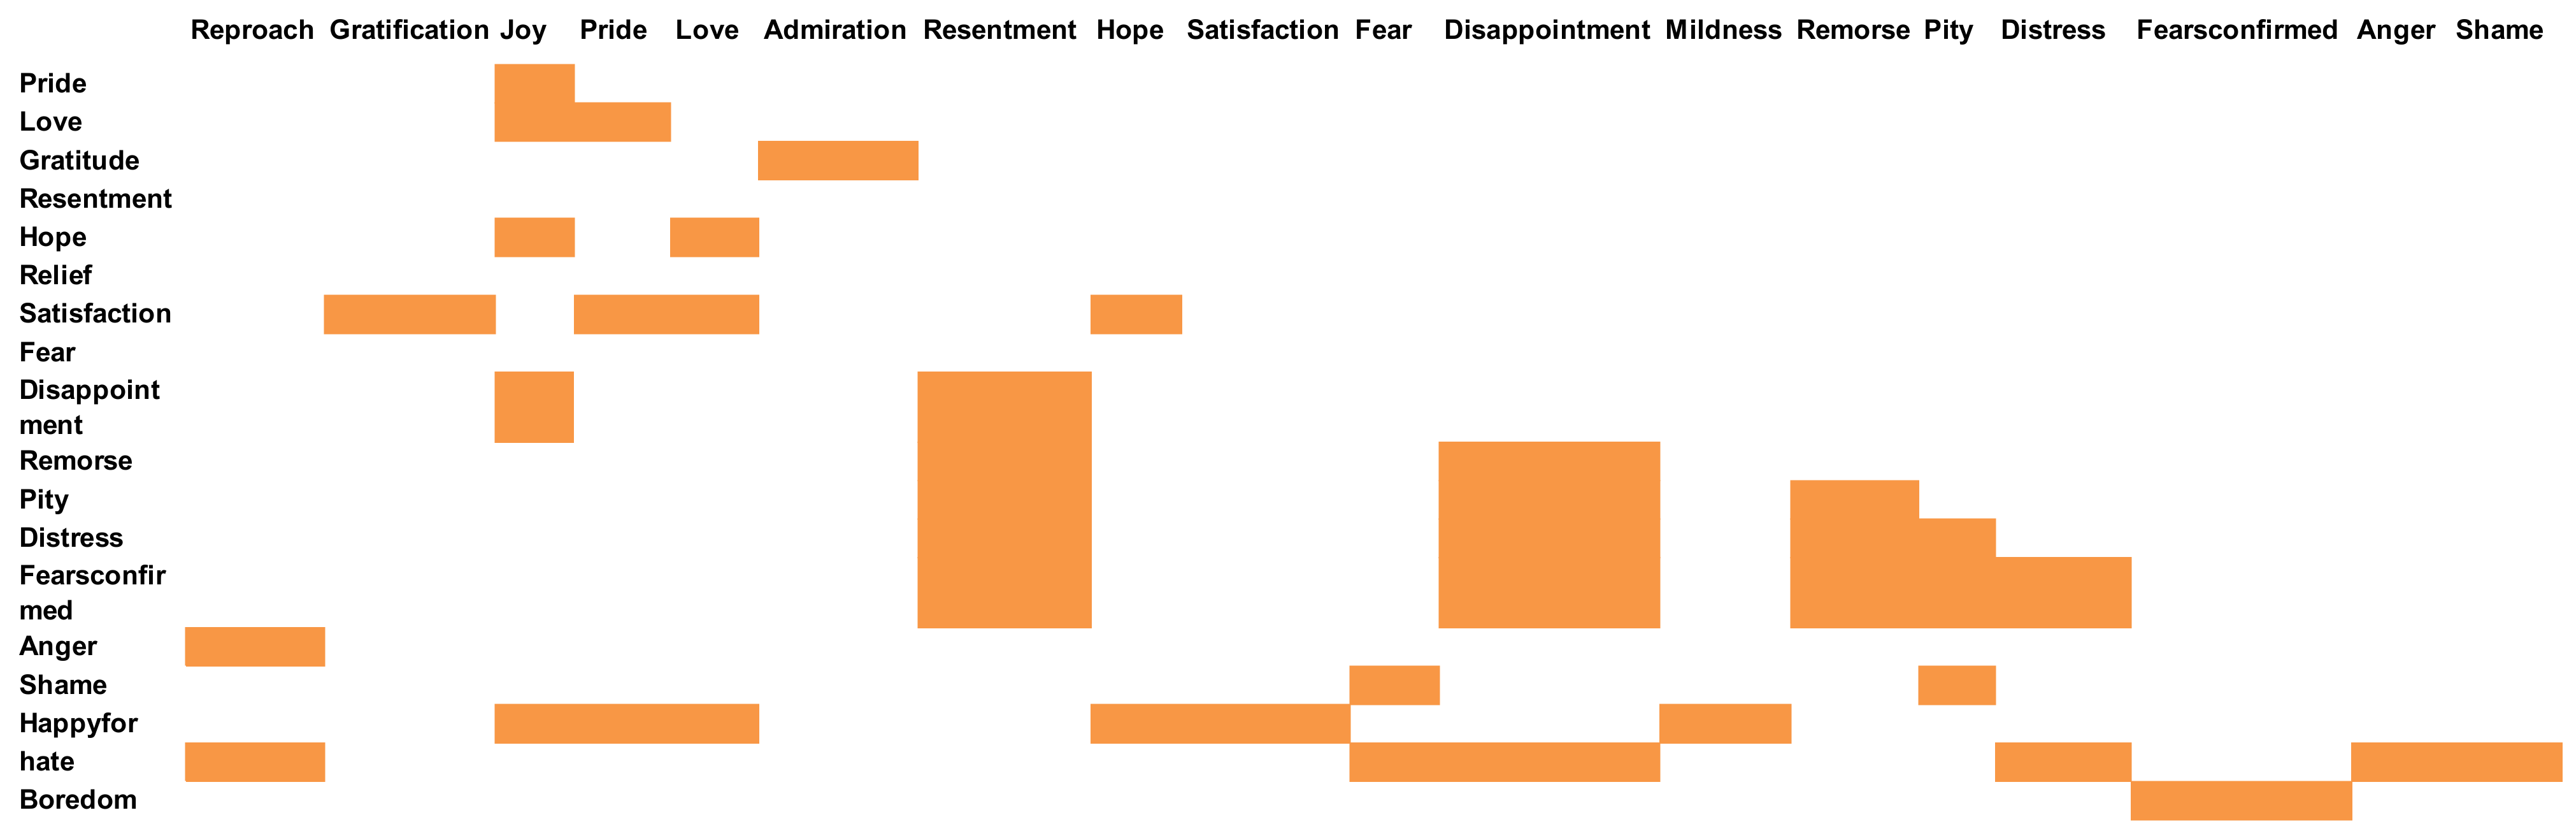
Figure 1. Relevance of emotion words in the three dimensions of PAD.
Applsci 11 07532 g001
Figure 2. 20 emotions of expression design. The emotions are, from left to right, top to bottom: happy-for, hate, satisfaction, gratitude, reproach, distress, pride, fear, mildness, pity, boredom, shame, disappointment, hope, resentment, love, gloating, anger, relief and admiration.
Applsci 11 07532 g002
Figure 3. Iterative image design of 20 emotions. The emotions are, from left to right, top to bottom: happy-for, hate, satisfaction, gratitude, reproach, distress, pride, fear, mildness, pity, boredom, shame, disappointment, hope, resentment, love, gloating, anger, relief and admiration.
Applsci 11 07532 g003
Figure 4. Screenshot of SAET system.
Applsci 11 07532 g004
Table 1. Coordinate values of 20 emotion words in PAD three-dimension emotion space.
ReproachPrideLoveAdmirationGratitudeResentmentHopeReliefSatisfactionFear
P−0.500.720.730.480.50−0.530.650.300.66−0.64
A0.250.570.550.340.350.090.55−0.070.330.45
D0.430.550.36−0.13−0.10−0.350.380.260.45−0.60
DisappointmentMildnessPityDistressAngerShameHappy-ForHateBoredomGloating
P−0.650.18−0.57−0.75−0.74−0.620.67−0.58−0.220.12
A−0.28−0.15−0.25−0.270.360.080.490.12−0.490.13
D−0.540.08−0.49−0.550.26−0.550.430.07−0.240.03
Table 2. The PAD Euclidean distance between 20 images and 20 emotional words in the pilot study.
Word
ReproachPrideLoveAdmirationGratitudeResentmentHopeReliefSatisfactionFearDisappointmentMildnessPityDistressAngerShameHappy-ForHateBoredomGloating
ImageReproach0.271.271.020.900.820.470.780.720.980.540.630.740.420.920.500.640.470.380.690.49
Pride1.070.540.240.170.271.170.360.560.121.271.380.721.131.481.151.410.211.181.120.47
Love0.990.640.240.160.121.150.200.610.311.151.340.751.121.401.161.310.251.171.120.42
Admiration1.060.520.160.060.211.140.320.600.181.231.380.761.141.451.121.380.131.181.150.45
Gratitude1.140.430.070.090.281.210.390.700.201.311.480.851.241.551.191.470.041.281.250.55
Resentment0.721.591.261.130.990.940.900.641.140.670.330.550.170.670.980.581.240.300.190.68
Hope1.090.560.160.060.151.160.260.610.221.201.380.761.141.441.151.360.161.191.150.44
Relief0.911.060.690.570.411.080.320.150.740.600.830.250.630.840.760.760.730.660.750.23
Satisfaction0.600.720.330.210.051.090.110.460.291.081.220.610.991.311.091.210.321.050.980.29
Fear0.971.461.181.080.980.581.111.011.220.310.751.030.680.520.680.471.160.650.930.71
Disappointment0.841.811.481.351.200.900.190.961.410.430.200.890.330.360.980.231.450.740.520.89
Mildness0.980.660.280.160.111.050.190.550.301.081.260.691.031.321.051.230.271.071.050.32
Pity0.661.641.321.191.050.870.970.741.220.590.230.660.090.550.930.481.290.210.300.73
Distress0.681.791.481.351.220.791.141.031.430.310.280.970.390.220.880.111.450.360.640.90
Anger0.311.421.281.191.180.061.171.211.320.690.971.260.850.750.100.851.240.751.180.91
Shame0.970.850.450.340.151.070.060.410.400.991.130.540.911.131.091.120.450.970.890.24
Happy-for1.170.450.050.090.261.220.370.710.240.991.490.871.261.491.211.470.071.301.260.55
Hate1.141.371.131.020.950.340.910.871.111.100.630.890.560.770.390.591.090.390.780.62
Boredom0.701.240.900.770.990.900.550.330.780.740.660.320.430.860.920.770.880.520.420.34
Gloating1.220.330.070.190.381.260.490.810.301.391.580.971.351.591.241.560.291.381.360.42
Table 3. The PAD Euclidean distance between 20 images and 20 emotional words in validation study.
Word
ReproachPrideLoveAdmirationGratitudeResentmentHopeReliefSatisfactionFearDisappointmentMildnessPityDistressAngerShameHappy-ForHateBoredomGloating
ImageReproach0.261.421.421.291.290.851.341.121.351.021.191.091.141.380.181.030.850.481.220.94
Pride1.240.060.230.780.741.610.210.840.311.771.951.041.852.021.481.790.191.451.640.92
Love1.130.160.070.620.581.510.060.780.261.661.850.951.751.921.451.690.101.391.550.82
Admiration0.950.460.380.430.401.180.320.420.271.401.490.581.391.571.181.370.321.061.170.46
Gratitude0.980.510.390.310.291.140.350.460.351.341.450.581.351.531.191.310.361.061.150.42
Resentment0.841.581.491.041.070.371.440.861.370.820.400.650.310.480.870.501.440.520.290.67
Hope1.150.240.120.520.481.400.070.670.211.571.730.831.631.811.371.580.101.291.430.70
Relief0.880.960.870.520.530.870.830.230.820.890.970.090.881.040.870.820.850.650.780.17
Satisfaction0.970.400.320.440.411.270.280.450.191.491.570.621.471.651.281.450.261.161.230.53
Fear1.101.631.521.061.090.381.671.231.520.200.721.070.680.730.830.361.510.670.990.88
Disappointment1.051.821.721.231.260.430.931.111.620.800.170.880.100.271.030.421.681.050.390.91
Mildness0.791.080.980.580.590.680.930.380.861.030.900.190.800.980.950.860.930.670.560.19
Pity1.041.851.751.271.290.391.701.151.650.750.110.930.040.200.990.371.710.660.460.94
Distress1.192.061.961.471.500.501.911.381.870.740.131.170.230.051.080.391.920.800.681.16
Anger0.401.551.531.311.320.691.451.191.470.821.031.120.991.020.090.841.470.391.150.96
Shame0.841.551.440.960.990.131.390.991.390.460.480.800.410.530.780.261.410.500.650.68
Happy-for1.140.230.130.530.491.400.070.660.200.461.730.831.631.781.361.580.091.281.420.70
Hate1.141.351.290.970.980.381.220.841.211.300.750.720.620.900.410.601.240.150.760.58
Boredom0.971.611.521.081.070.581.470.831.381.010.500.610.420.601.040.681.460.690.090.72
Gloating0.740.770.690.440.430.880.630.300.581.151.180.341.081.250.951.070.650.780.880.09
Table 4. Validation experiments for cognitive interpretation of selected emotion words. The “hit rate” is the percentage of correct responses for each image. “Other options” is the most common incorrect response.
ImageHit Rate Other OptionsHit Rate
Reproach52%Anger38%
Pride74%NoneNone
Love92%NoneNone
Admiration54%Satisfaction28%
Gratitude44%Hope18%
Resentment40%Hate24%
Hope40%Admiration20%
Relief42%Mildness34%
Satisfaction72%NoneNone
Fear82%NoneNone
Disappointment50%Distress34%
Mildness44%Relief38%
Pity42%Disappointment36%
Distress92%NoneNone
Anger92%NoneNone
Shame72%NoneNone
Happy-for50%Love24%
Hate54%Resentment14%
Boredom48%Disappointment20%
Gloating82%NoneNone
Publisher’s Note: MDPI stays neutral with regard to jurisdictional claims in published maps and institutional affiliations.

