Article

Optimization of Multi-Blade Centrifugal Fan Blade Design for Ventilation and Air-Conditioning System Based on Disturbance CST Function

1
College of Mechanical Engineering, Zhejiang University of Technology, Hangzhou 310023, China
2
Institue of Innovation Research of Shengzhou and Zhejiang University of Technology, Shengzhou 312400, China
3
Shanghai Nuclear Engineering Research and Design Institute, Shanghai 200233, China
*
Author to whom correspondence should be addressed.
Appl. Sci. 2021, 11(17), 7784; https://doi.org/10.3390/app11177784
Submission received: 5 July 2021 / Revised: 21 August 2021 / Accepted: 23 August 2021 / Published: 24 August 2021

Abstract

:
The multi-blade centrifugal fan is commonly used in modern building ventilation and air-conditioning system. However, it does not readily satisfy the increasing demand for energy saving, high efficiency or noise reduction. Its performance is inherently limited by the geometrical structure of single circular arc blades. Q35-type multi-blade centrifugal fan studied as an example by combining the disturbance CST function to parameterize the blades. The optimization parameter change range is confirmed, and test samples are extracted before establishing an RBF proxy model. The NSGA-II algorithm is incorporated, and multi-objective optimization is performed with flow rate and total pressure efficiency as optimization goals. The results show that the fan performance is effectively improved. At the design working point, the air volume of the multi-blade centrifugal fan increases by 1.4 m3/min; at the same time, the total pressure efficiency increases by 3.1%, and the noise is reduced by 1.12 dB, applying the proposed design. The obtained higher fan efficiency can effectively improve performance of the whole ventilation and air-conditioning system. This novel optimization method also has relatively few parameters, which makes it potentially valuable for designing multi-wing centrifugal and other types of fans, providing a new idea for energy saving and emission reduction design of fan.

1. Introduction

With the rapid economic development, people have put forward new requirements for the ventilation and air-conditioning system. At the same time, the COVID-19 pandemic has further raised people’s attention on this [1,2]. Building electrical energy accounts for a large proportion of total energy consumption [3,4], and ventilation and air-conditioning systems are important energy-consuming sections, accounting for about 40% of building energy consumption [5]. Fan is an important component of ventilation and air-conditioning system. The improvement in fan performance can reduce electricity consumption by itself, which is considerable in some ventilation use and help increase the efficiency of refrigeration system to decrease even more electric energy cost. Therefore, research on developing ventilation equipment with high efficiency, energy-saving and low noise has grown increasingly important [6].
From the user’s point of view, the multi-blade centrifugal fan has the characteristics of small space occupation and low noise. These two unique advantages make it widely used in air conditioning, ventilation, building ventilation and other industries [7]. However, its low efficiency has always limited the market promotion of this type of fan [8]. Noise and energy consumption problems in existing multi-blade centrifugal fan designs have grown increasingly problematic as modern demands for energy conservation and emissions reduction have intensified [9]. As the main working component of a building ventilation system, improving the efficiency of the fan can reduce the energy consumption of the entire system [10]. The increase in fan efficiency may also reduce the fan noise, which significantly affects users’ experience on building ventilation and air conditioning systems [11].
As the power component of the multi-blade centrifugal fan, the aerodynamic performance and the acoustic characteristics of the fan were impacted by the impeller [12]. Multi-blade centrifugal fans usually have 60 blades, so by adjusting the structure of the blades, the performance of the fan can be greatly improved [13,14]. In the conventional design, the blade profile of the multi-blade centrifugal fan is polynomial (and usually single) in the middle arc. The air performance of single arc blades is generally poor [15]. However, optimizing the design of the multi-segment curve of the blade profile may improve aerodynamic performance, the efficiency and acoustic characteristic of the fan.
Many previous scholars have attempted to optimize the design of multi-blade centrifugal fan blades. In selecting multi-blade centrifugal fan airfoil, Zuo [16] explored a single-arc blade type multi-blade fan and a double-arc blade type multi-blade fan to find that the aerodynamic characteristics of the former are inferior to those of the latter. A double-arc blade type multi-blade fan with a larger arc radius shows favorable aerodynamic characteristics and low noise. Recently, researchers have developed bionic designs on a leaf (blade) surface, leading-edge and trailing edge by extracting the unique noise-reducing characteristic structure produced by natural organisms during evolution [17,18]. Liu [19] found that the A-level noise of non-smooth structured bionic blades, striped surface bionic blades and bionic serrated leading-edge blades are all lower than those of prototype blades.
Early fluid machinery blade parameterization techniques mainly centered on the bump function method [20], which is convenient for airfoil design but requires approximately 10 control parameters. As the upper and lower surfaces are modified, the design volume grows excessive and it is difficult to intuitively reflect the influence of a single parameter on the design result. Deng et al. [21] proposed a new parametric airfoil design method based on the Bessel curve and developed it into a generalized form of adjustable shape parameters. The Bessel function addition was found to improve the local control ability over the position of the front and rear edges of the airfoil, which is very important in regards to the blade design. Zuo [22] developed the airfoil disturbance function designed by Hicks-Henne to investigate the multi-parameter and multi-objective optimization function in the airfoil optimization process; they proposed airfoil optimization design ideas accordingly. In order to improve aerodynamic performance of the range hood, Yang [23] used a dual-arc profile in the multi-blade centrifugal fan.
The above methods provide effective optimization results, but no previous researcher has fully considered the practical applicability of single-arc blade parameterization. These methods also tend to have an excess of design variables, which complicates the optimization process. At the same time, the reliability of the above method in practical engineering problems has not yet been verified. Therefore, there is still room for improvement. In the present study, the classical airfoil of the existing multi-blade centrifugal fan is fitted by linear superposition of four shape functions based on the Class Shape Transformation (CST) function, which has not been reported yet to the author’s knowledge. Design variables are established based on the perturbation function concept.
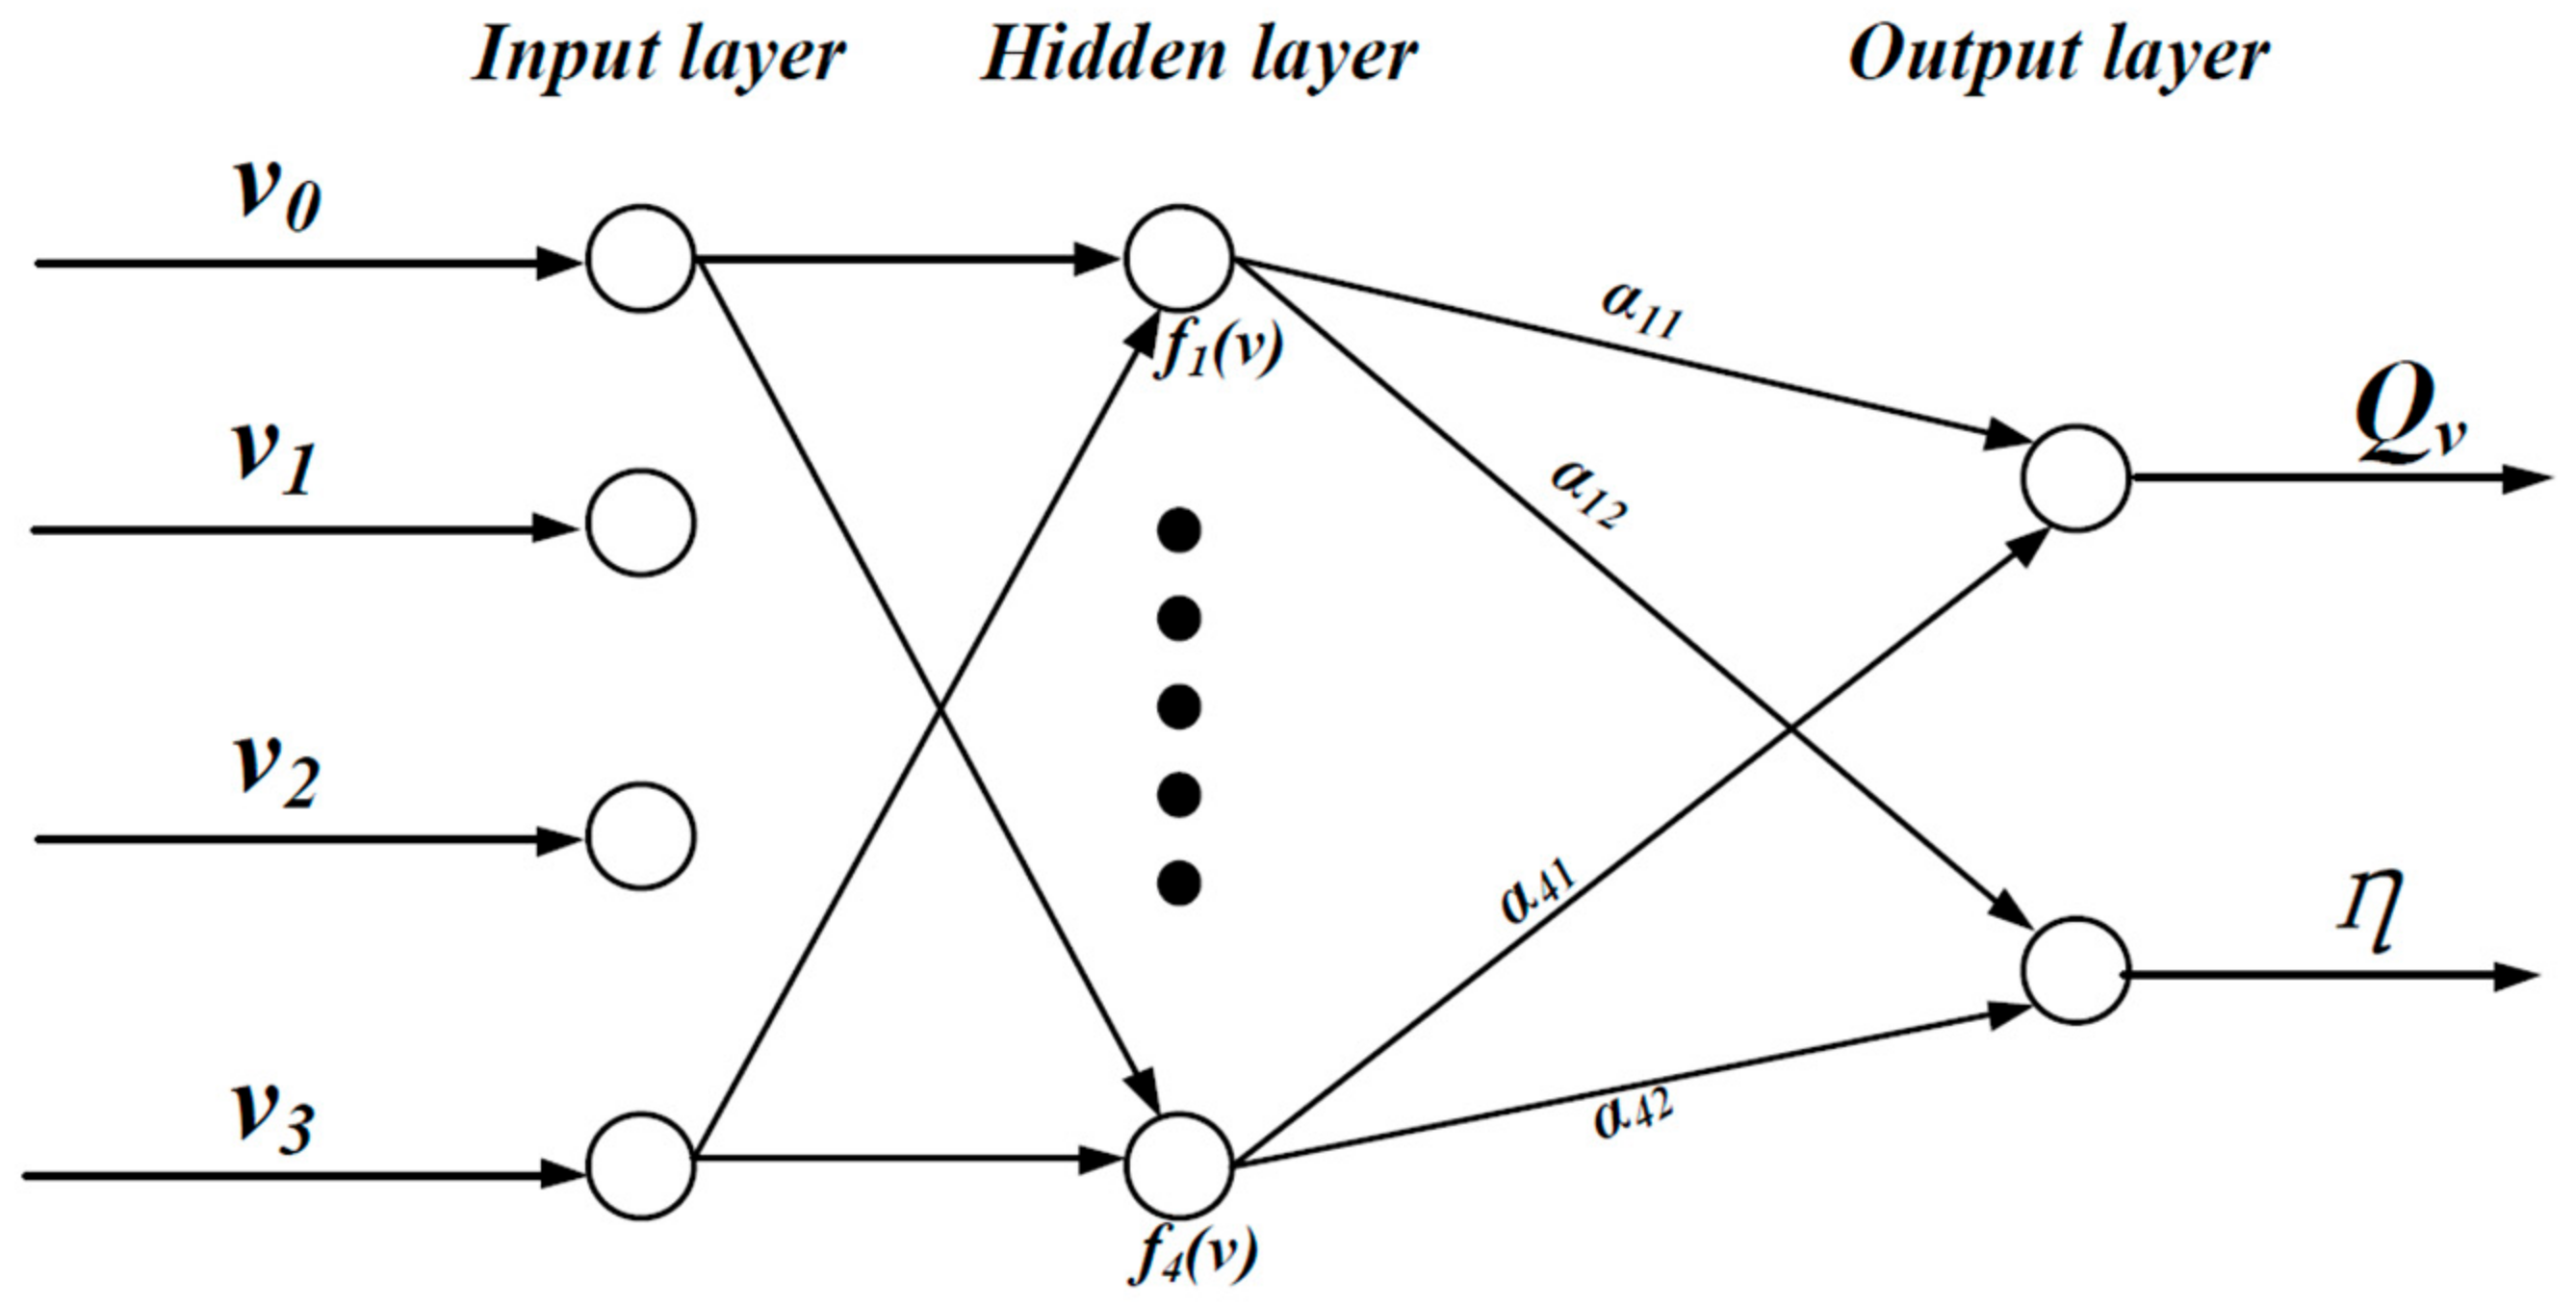
The Q35 fan, usually is used in building ventilation, is chosen for study in this work. The shape function coefficient of the disturbance CST function is used as a design variable to parameterize the blades. Using the experimentally validated CFD model, performance results of fans with different blade CST parameters are obtained. The RBF model is used to fit the coupling relationship between the CST parameters of the sample model and the numerical simulated performance value. The Non-dominated Sorting Genetic Algorithm-II (NSGA-II) is used to complete the optimization process. After the optimized impeller is analyzed by numerical simulation, its prototype is fabricated and verified by air performance and noise testing. This optimization method is also applicable to the blade airfoil optimization of other types of wind turbines and lays the basis for the optimization of building systems and heating ventilation and air conditioning (HVAC) systems that use wind turbines as their main power equipment.

2. Studied Equipment: The Original Multi-Blade Centrifugal Fan

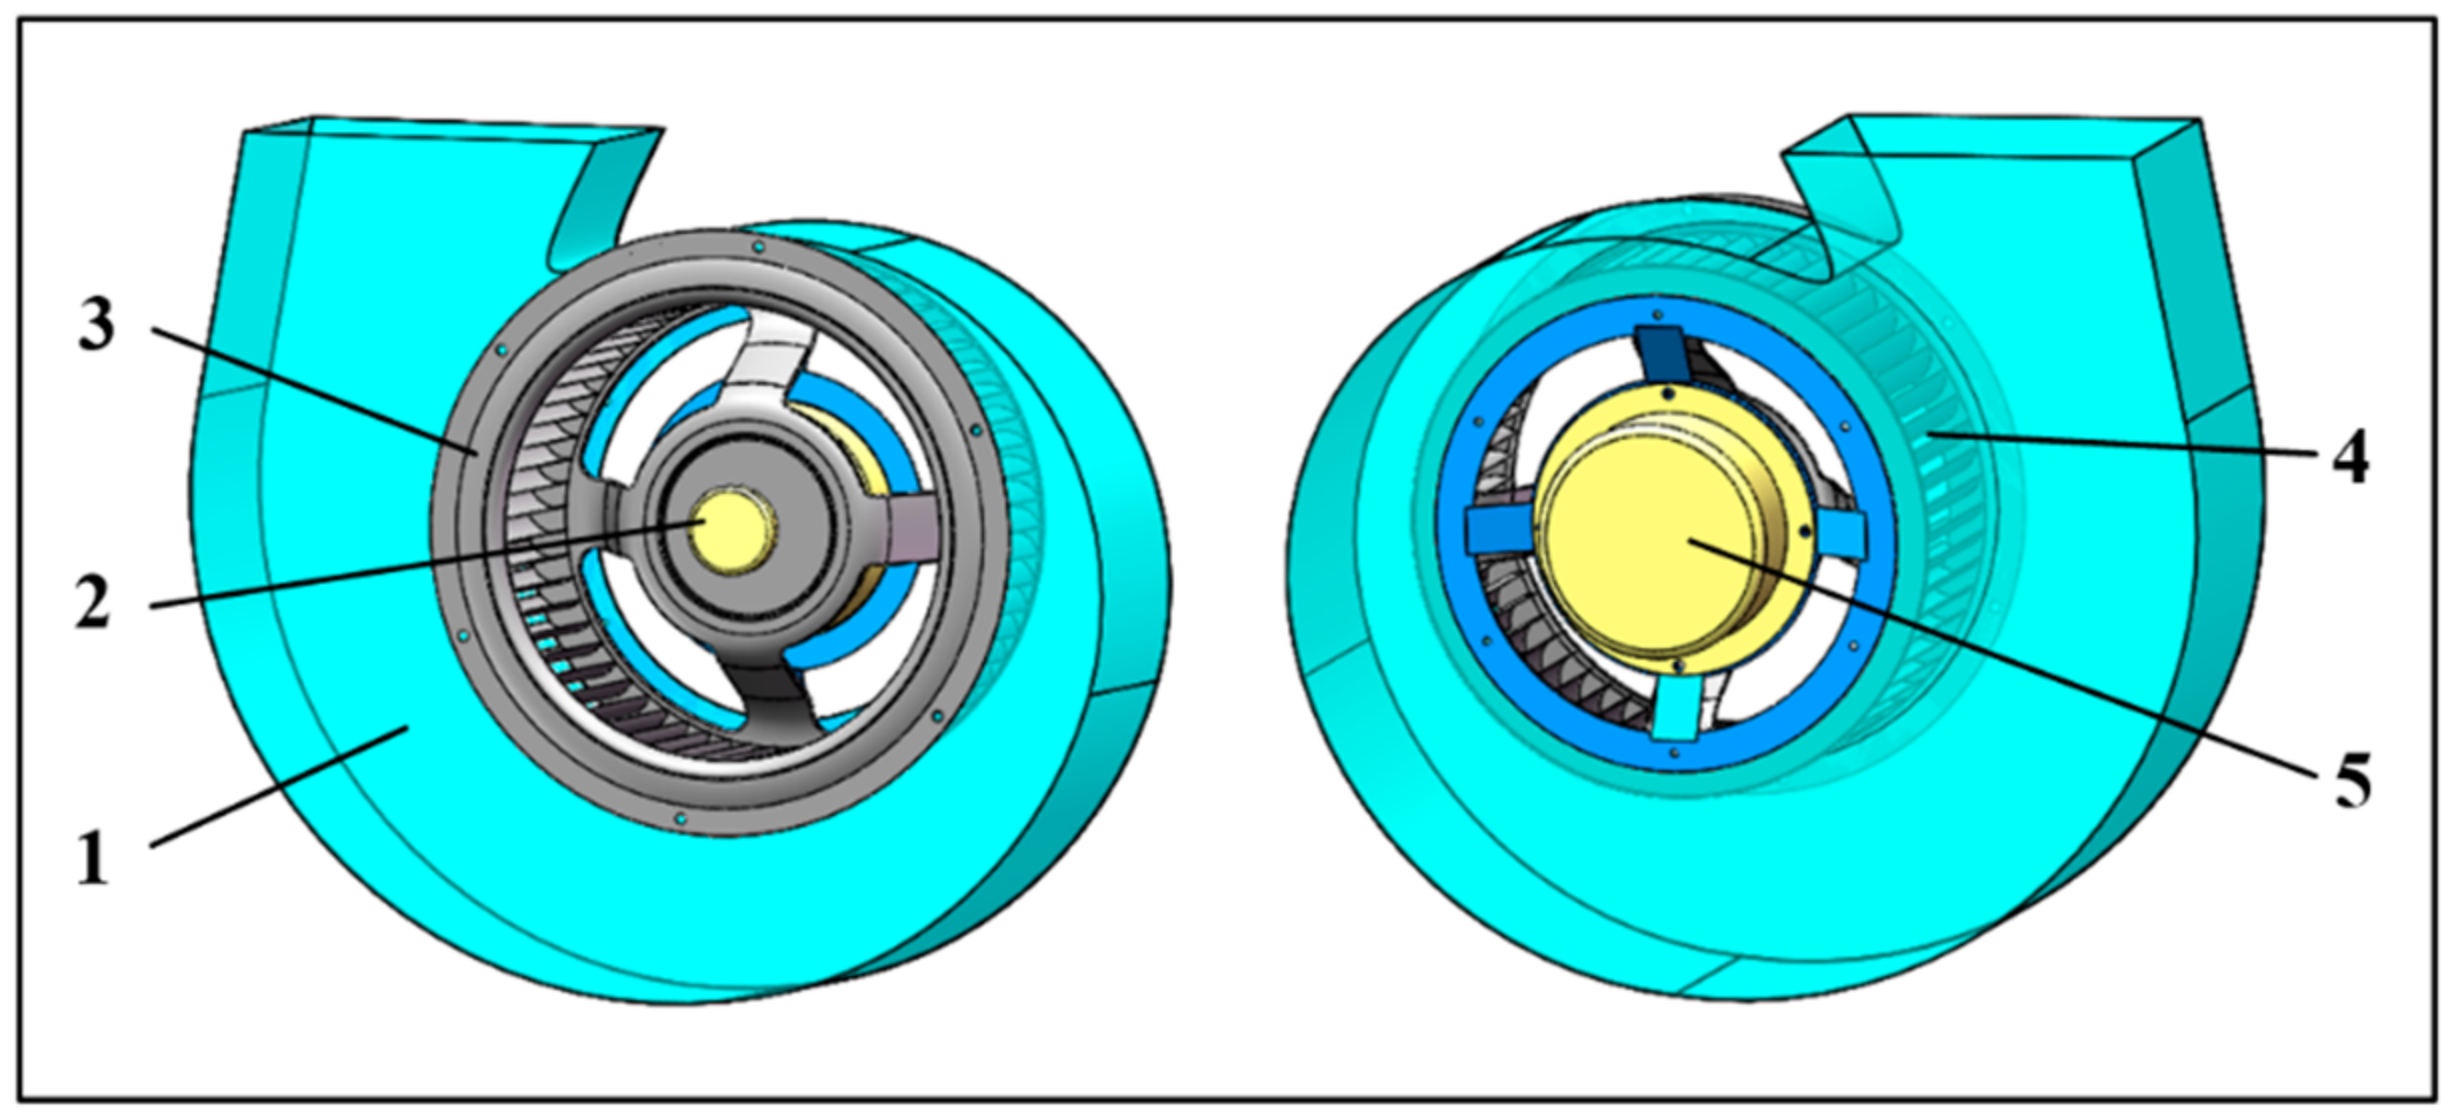
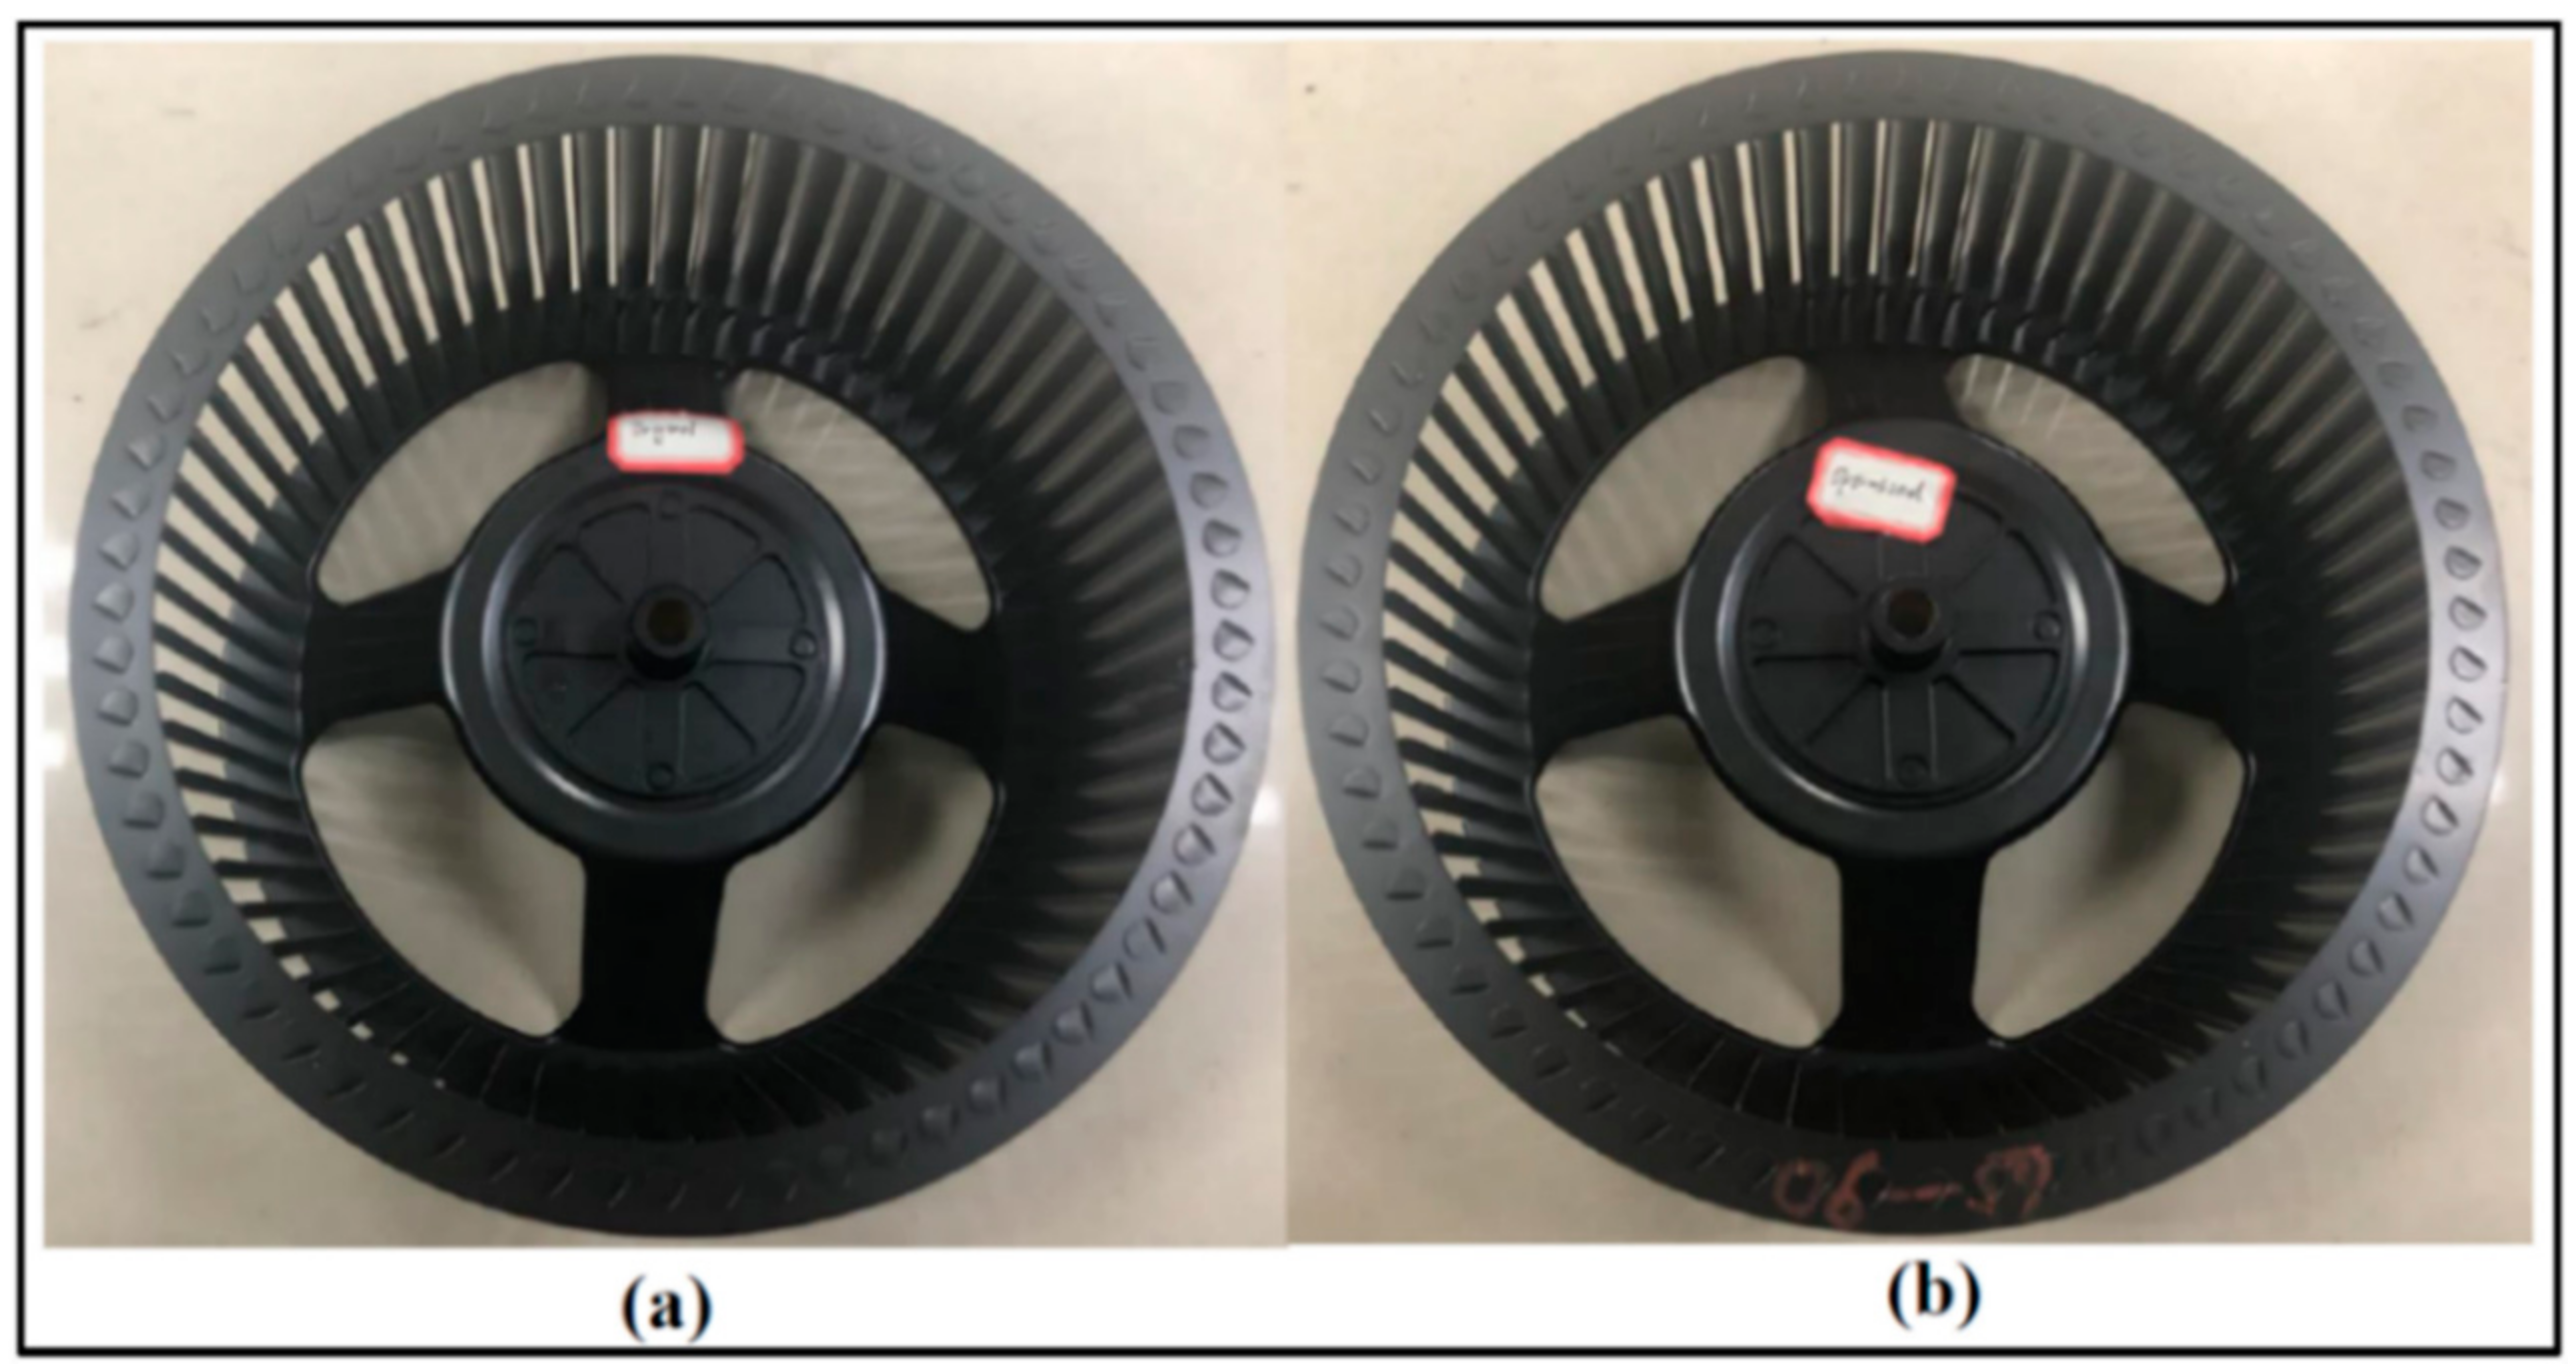
The research object of this study, as mentioned above, is the Q35 single-suction multi-blade centrifugal fan (Figure 1) commonly used in the ventilation system. Its rated speed is 880 rpm. Measured at the design working point, the air volume of the multi-blade centrifugal fan is 16.8 m3/min, its total pressure efficiency is 40.0% and its noise level is 54.05dB. The profile and thickness of the blade could influence the feature of the aerodynamic performance and the acoustic characteristics of the fan. The optimization of this shape can greatly improve the overall performance of the fan, including flow rate, efficiency, noise level and others. The main structural parameters of the fan impeller are listed in Figure 2 and Table 1.
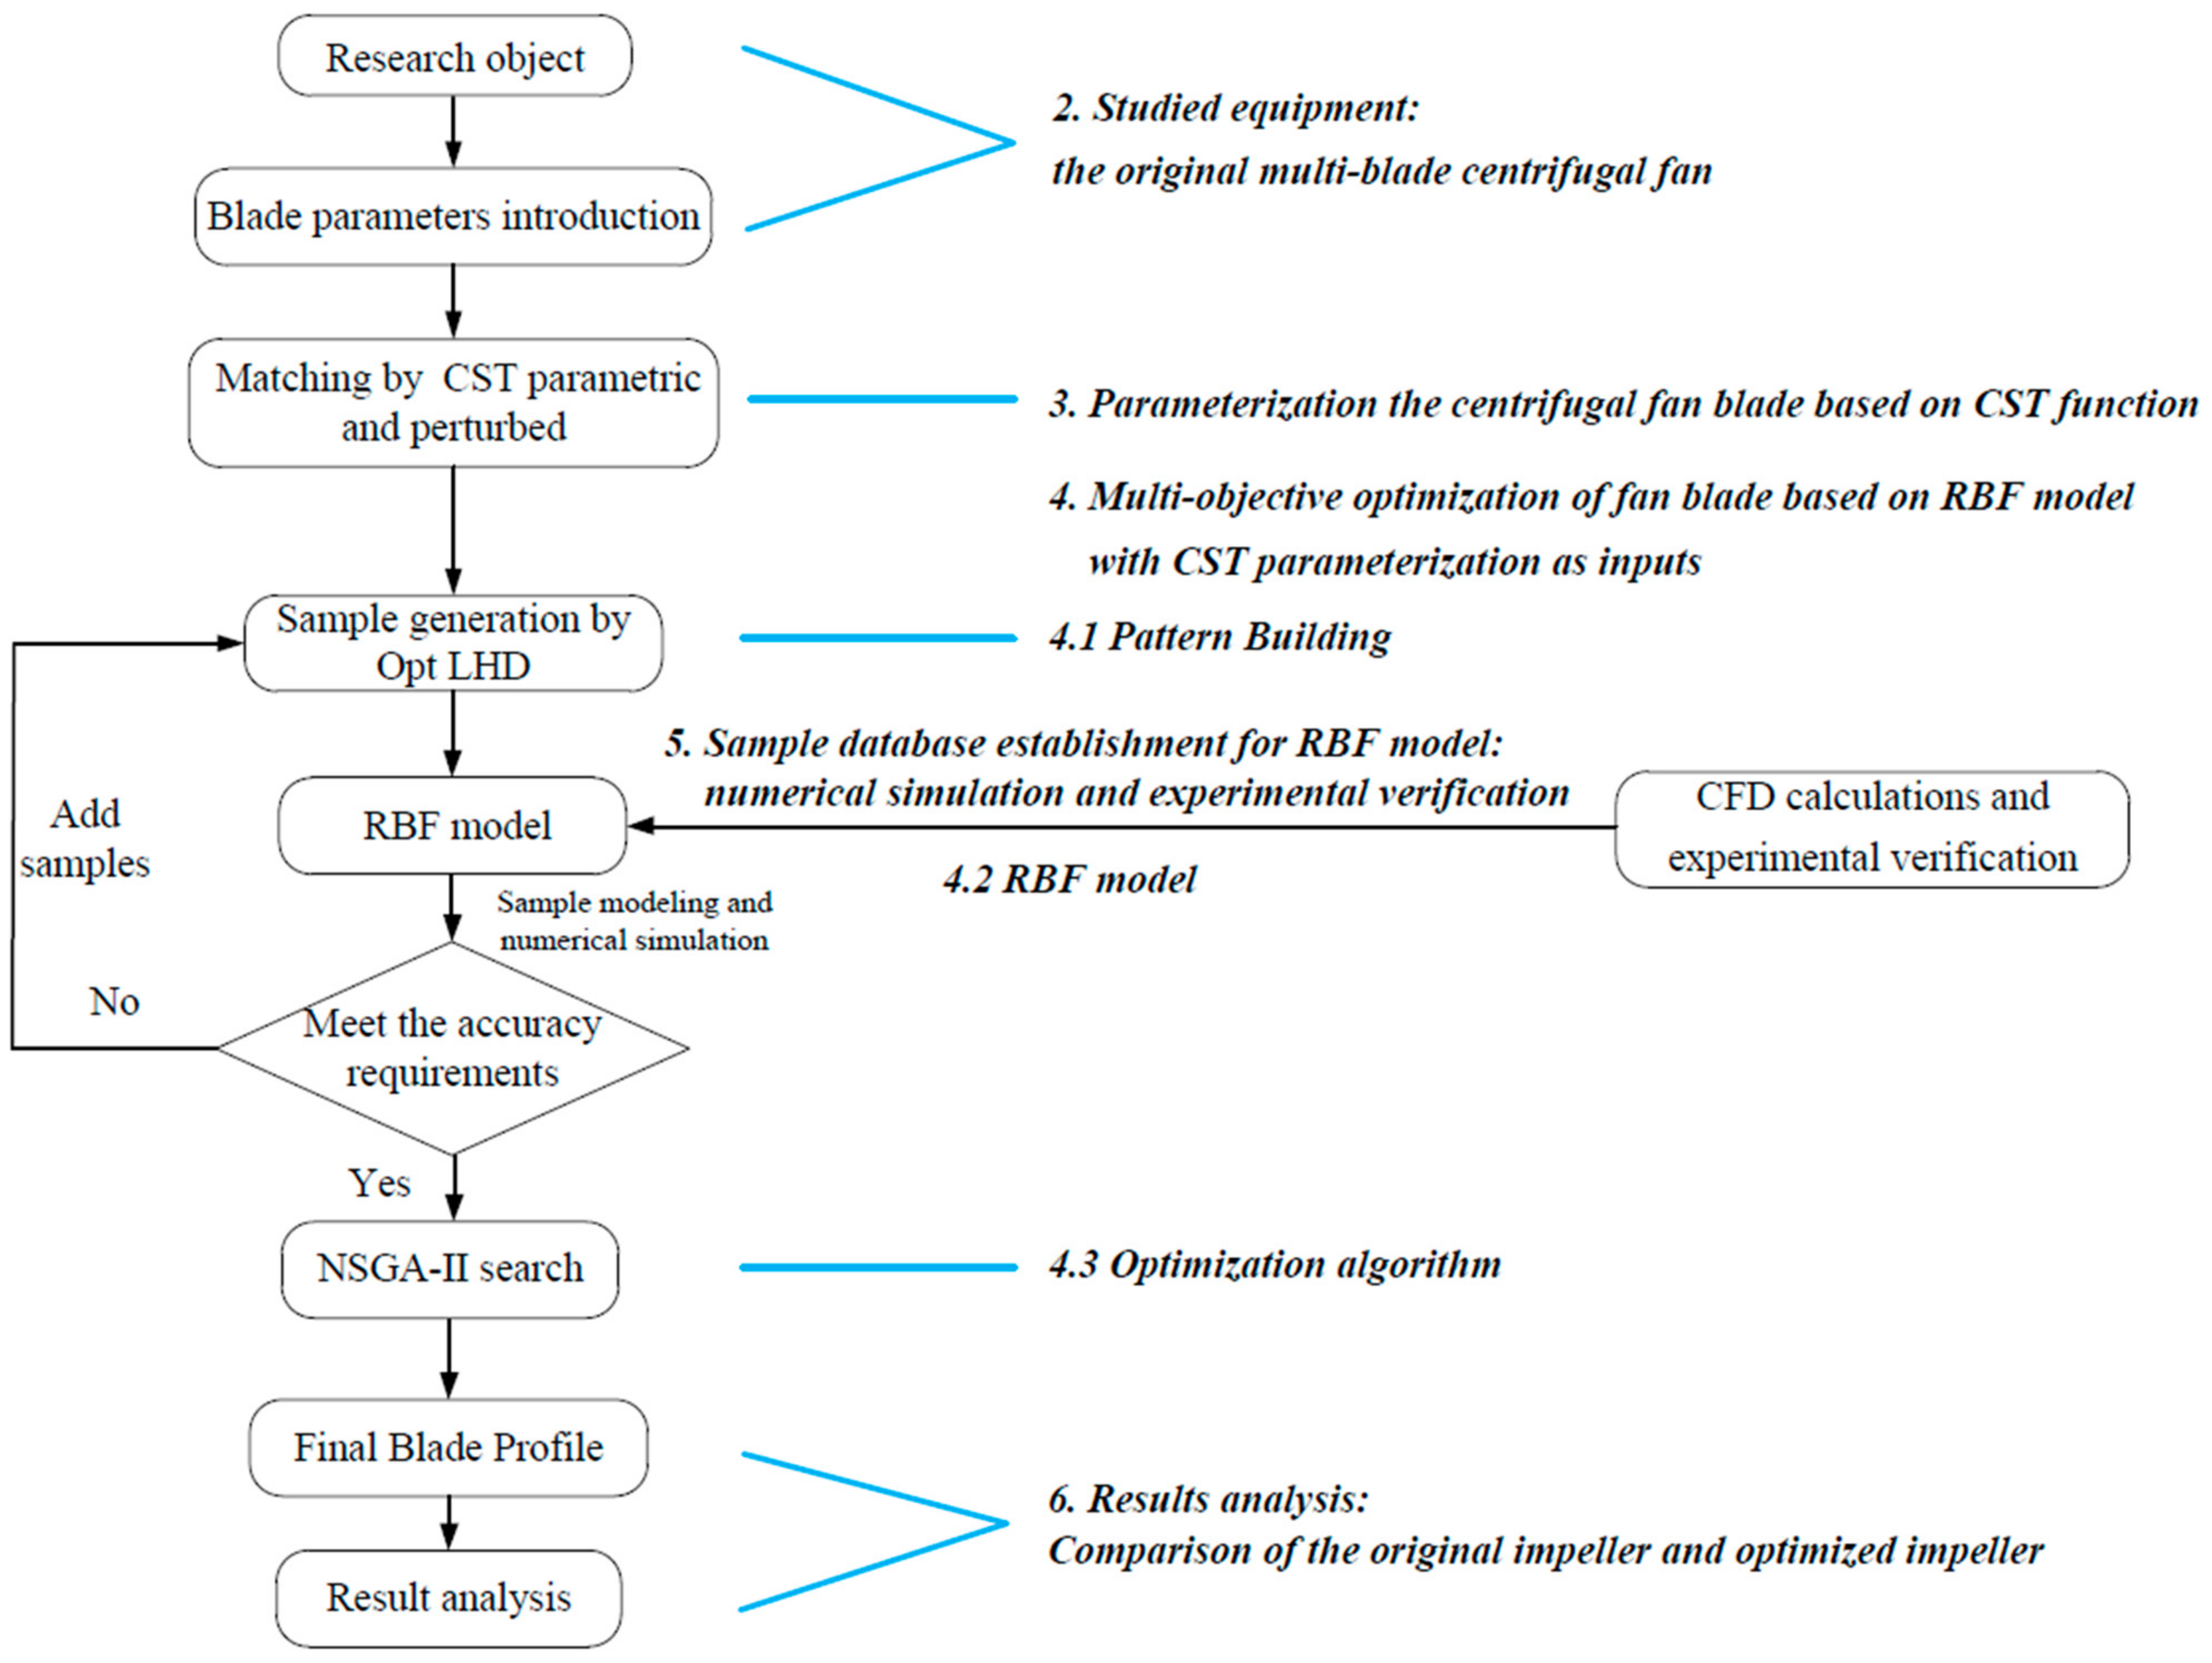
The whole optimization process is shown in Figure 3. The CST function fits the blade, then several groups of blade design samples are established after the perturbation range of the shape function is determined. By establishing the RBF model of the variables and the response, the NSGA-II algorithm was used to solve the RBF model. At the same time, after verifying the feasibility of replacing experiments with numerical simulations, the sample database for the training of the RBF model is calculated by CFD numerical method. After obtaining an optimized airfoil, the results were analyzed via proofing verification and analysis of the numerical simulation.

3. Parameterization the Centrifugal Fan Blade Based on CST Function

Kufan and Bussoletti proposed using a Class Function and a Shape Function (CST function) to represent the geometric shape of an aircraft. This parametric representation method uses the Class Function and the Shape Function to represent the airfoil. It is highly accurate and requires few parameters, making it intuitive and convenient when managing important design parameters such as a leading-edge airfoil radius. The CST method is mainly used to parameterize airfoils in the aviation and military fields and has shown good curve-fitting capabilities [24,25]. Multi-blade centrifugal fan airfoil designs are mostly based on traditional concepts. An improved CST function was applied here to parameterize the multi-blade centrifugal fan blade:
z c x c = C x c · S x c + x c · z T E c
C ( x / c ) = x c N 1 1 x c N 2
S x / c = i = 0 N v i · x c i · 1 x c N i
where C(x/c) is the class function of the leaf shape; N1 and 
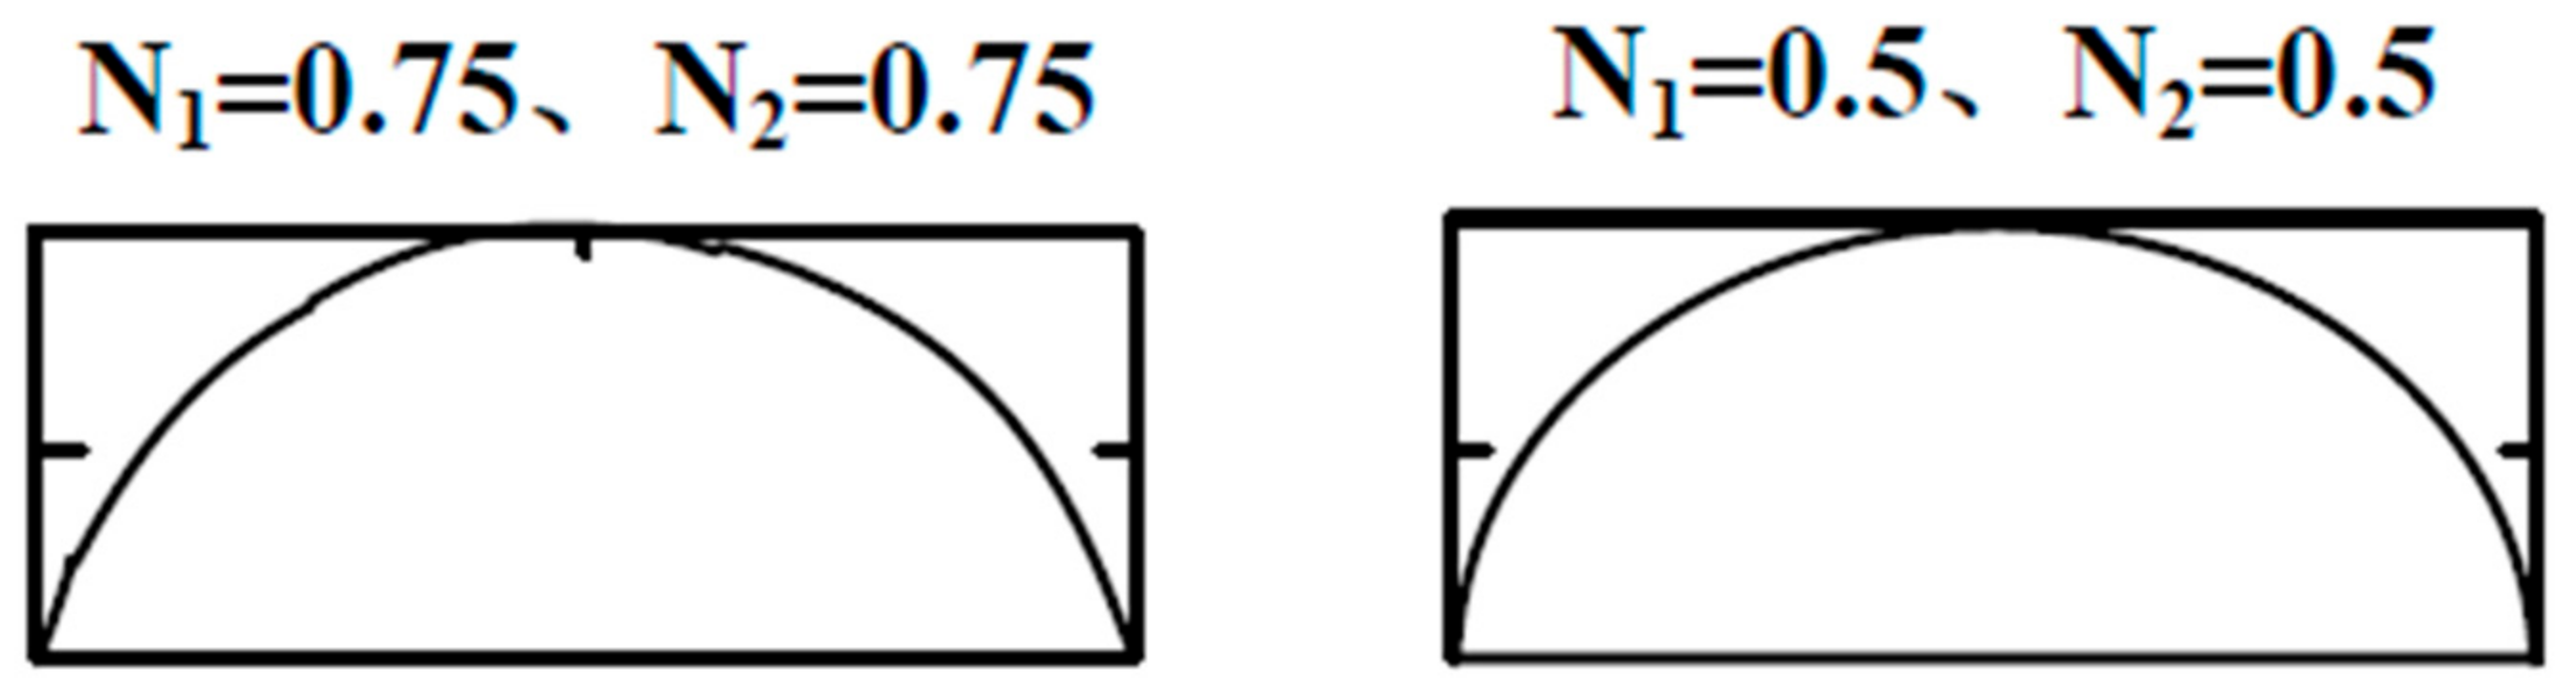
N2 indicate the type of leaf shape. When N1 = 0.5, N2 = 0.5, the category function is expressed as an elliptical airfoil with a round nose and round tail. When N1 = 0.75, N2 = 0.75, the category function is represented as a Sears-Haack body, as shown in Figure 4 below.
S(x/c) is the shape function of the airfoil, i = 0 N v i · x c i controls the curve shape of the airfoil from the leading edge to the trailing edge, and z T E c is the thickness of the trailing edge of the airfoil, which can be determined according to the design requirements. The airfoil of the multi-blade centrifugal fan can be considered to have no trailing edge, so the thickness is 0; c is the chord length of the airfoil. The Q35 fan blade airfoil was decomposed by the CST parameter using a third-order Bernstein polynomial in this study. N1 and N2 were fixed at 0.75 and 0.75 to obtain a curve that is close to the original impeller.
a i ( x ) = C x · S x
a i ( x ) = x 0.75 · ( 1 x ) 0.75 · i = 0 n v i x i ( 1 x ) n i
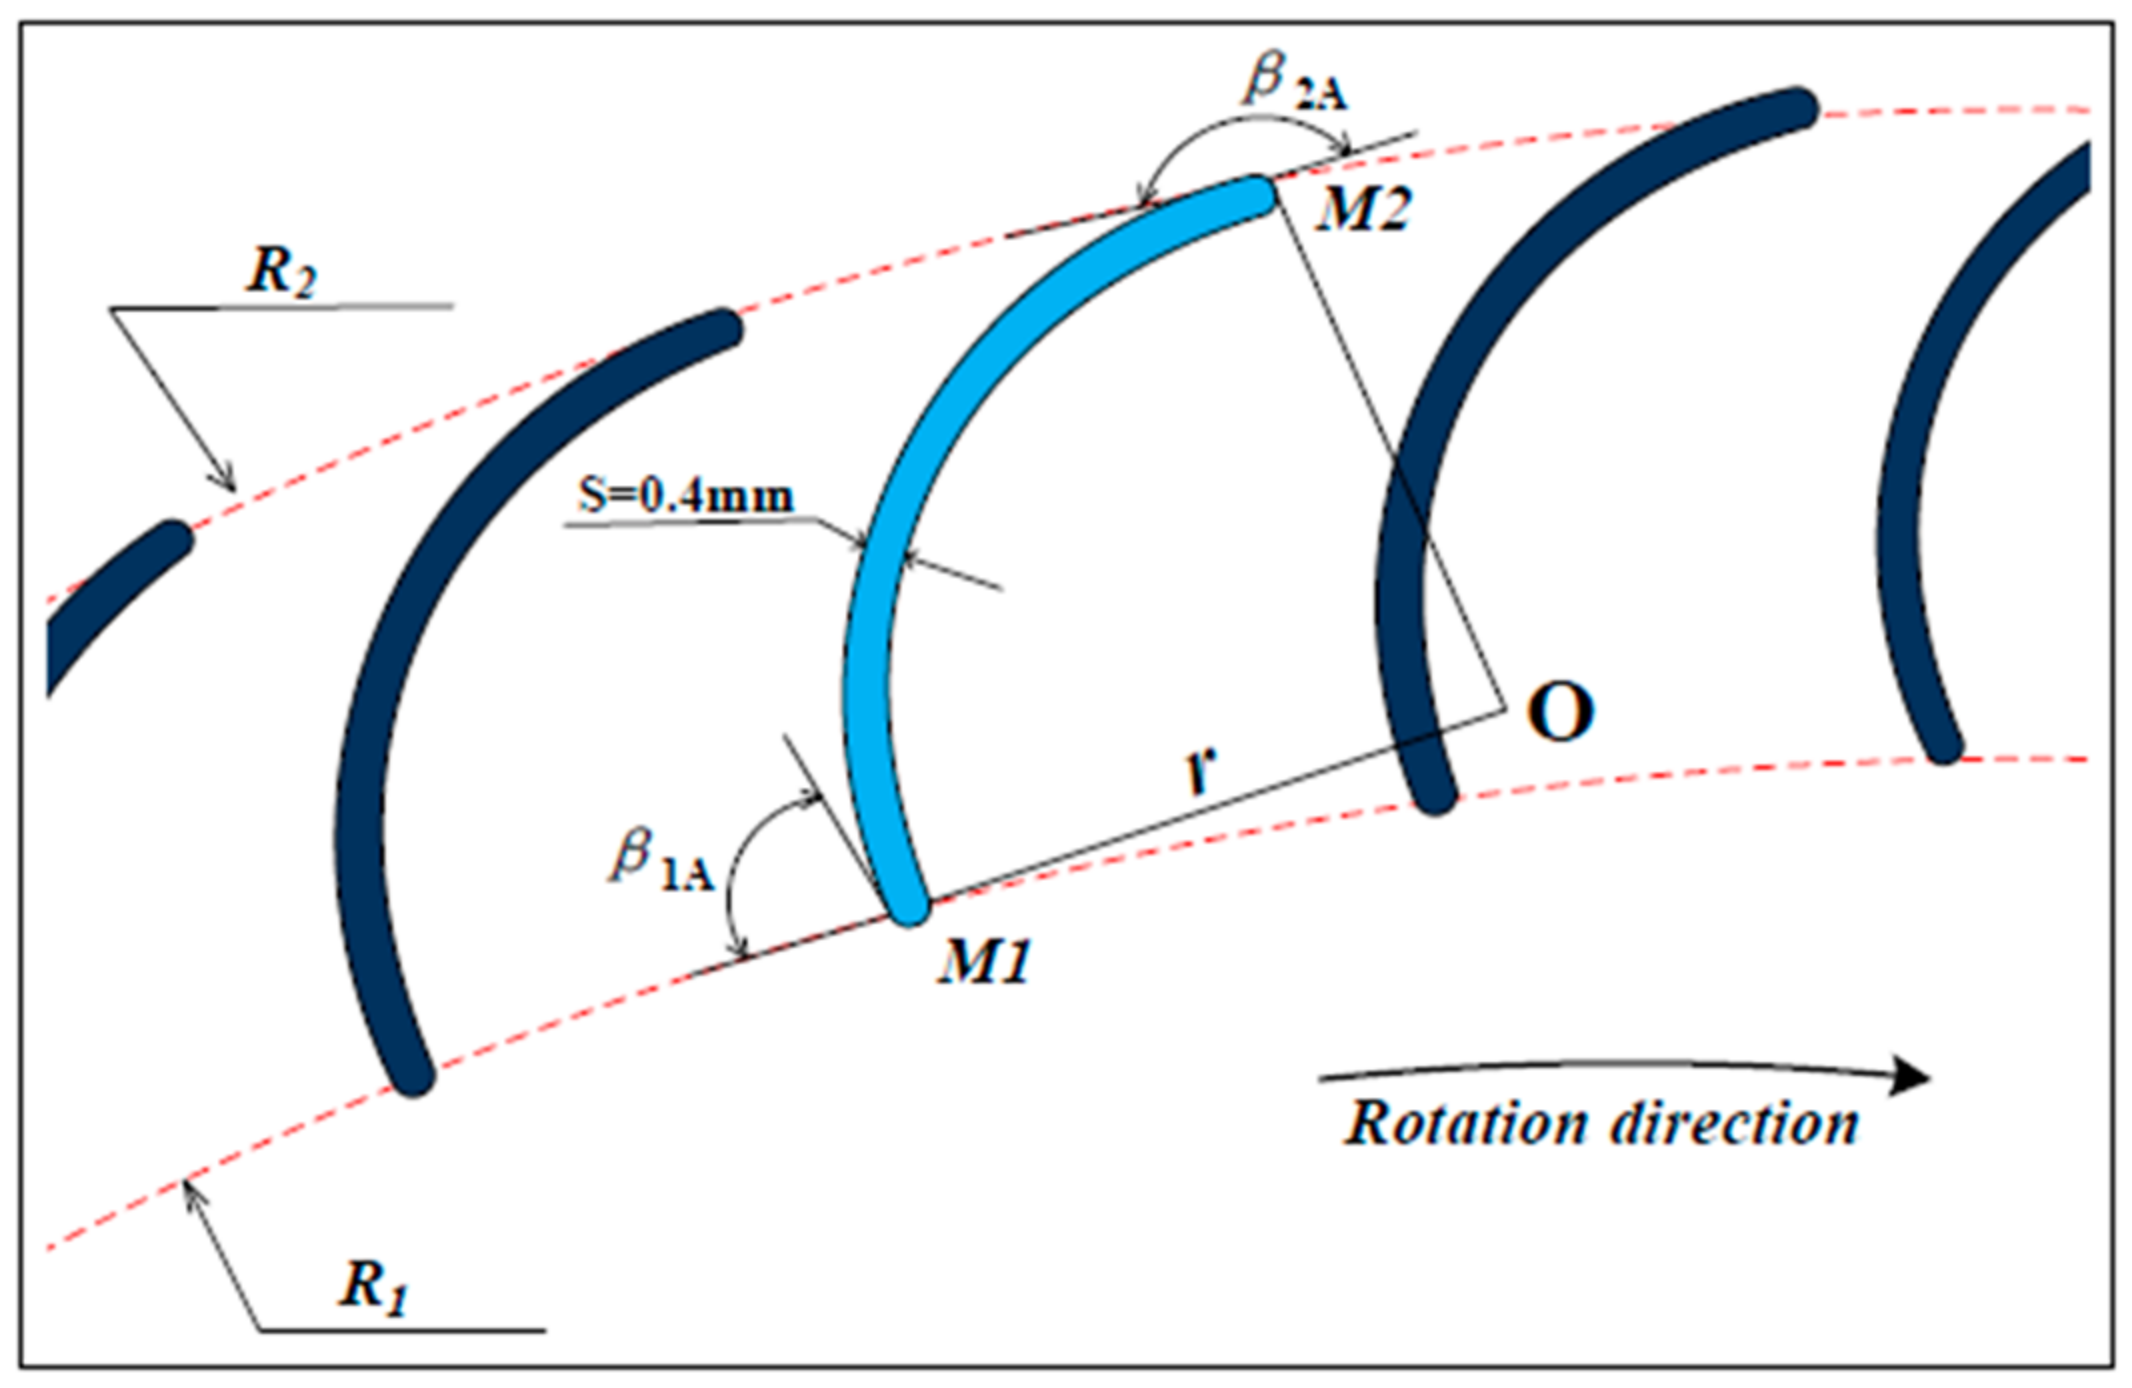
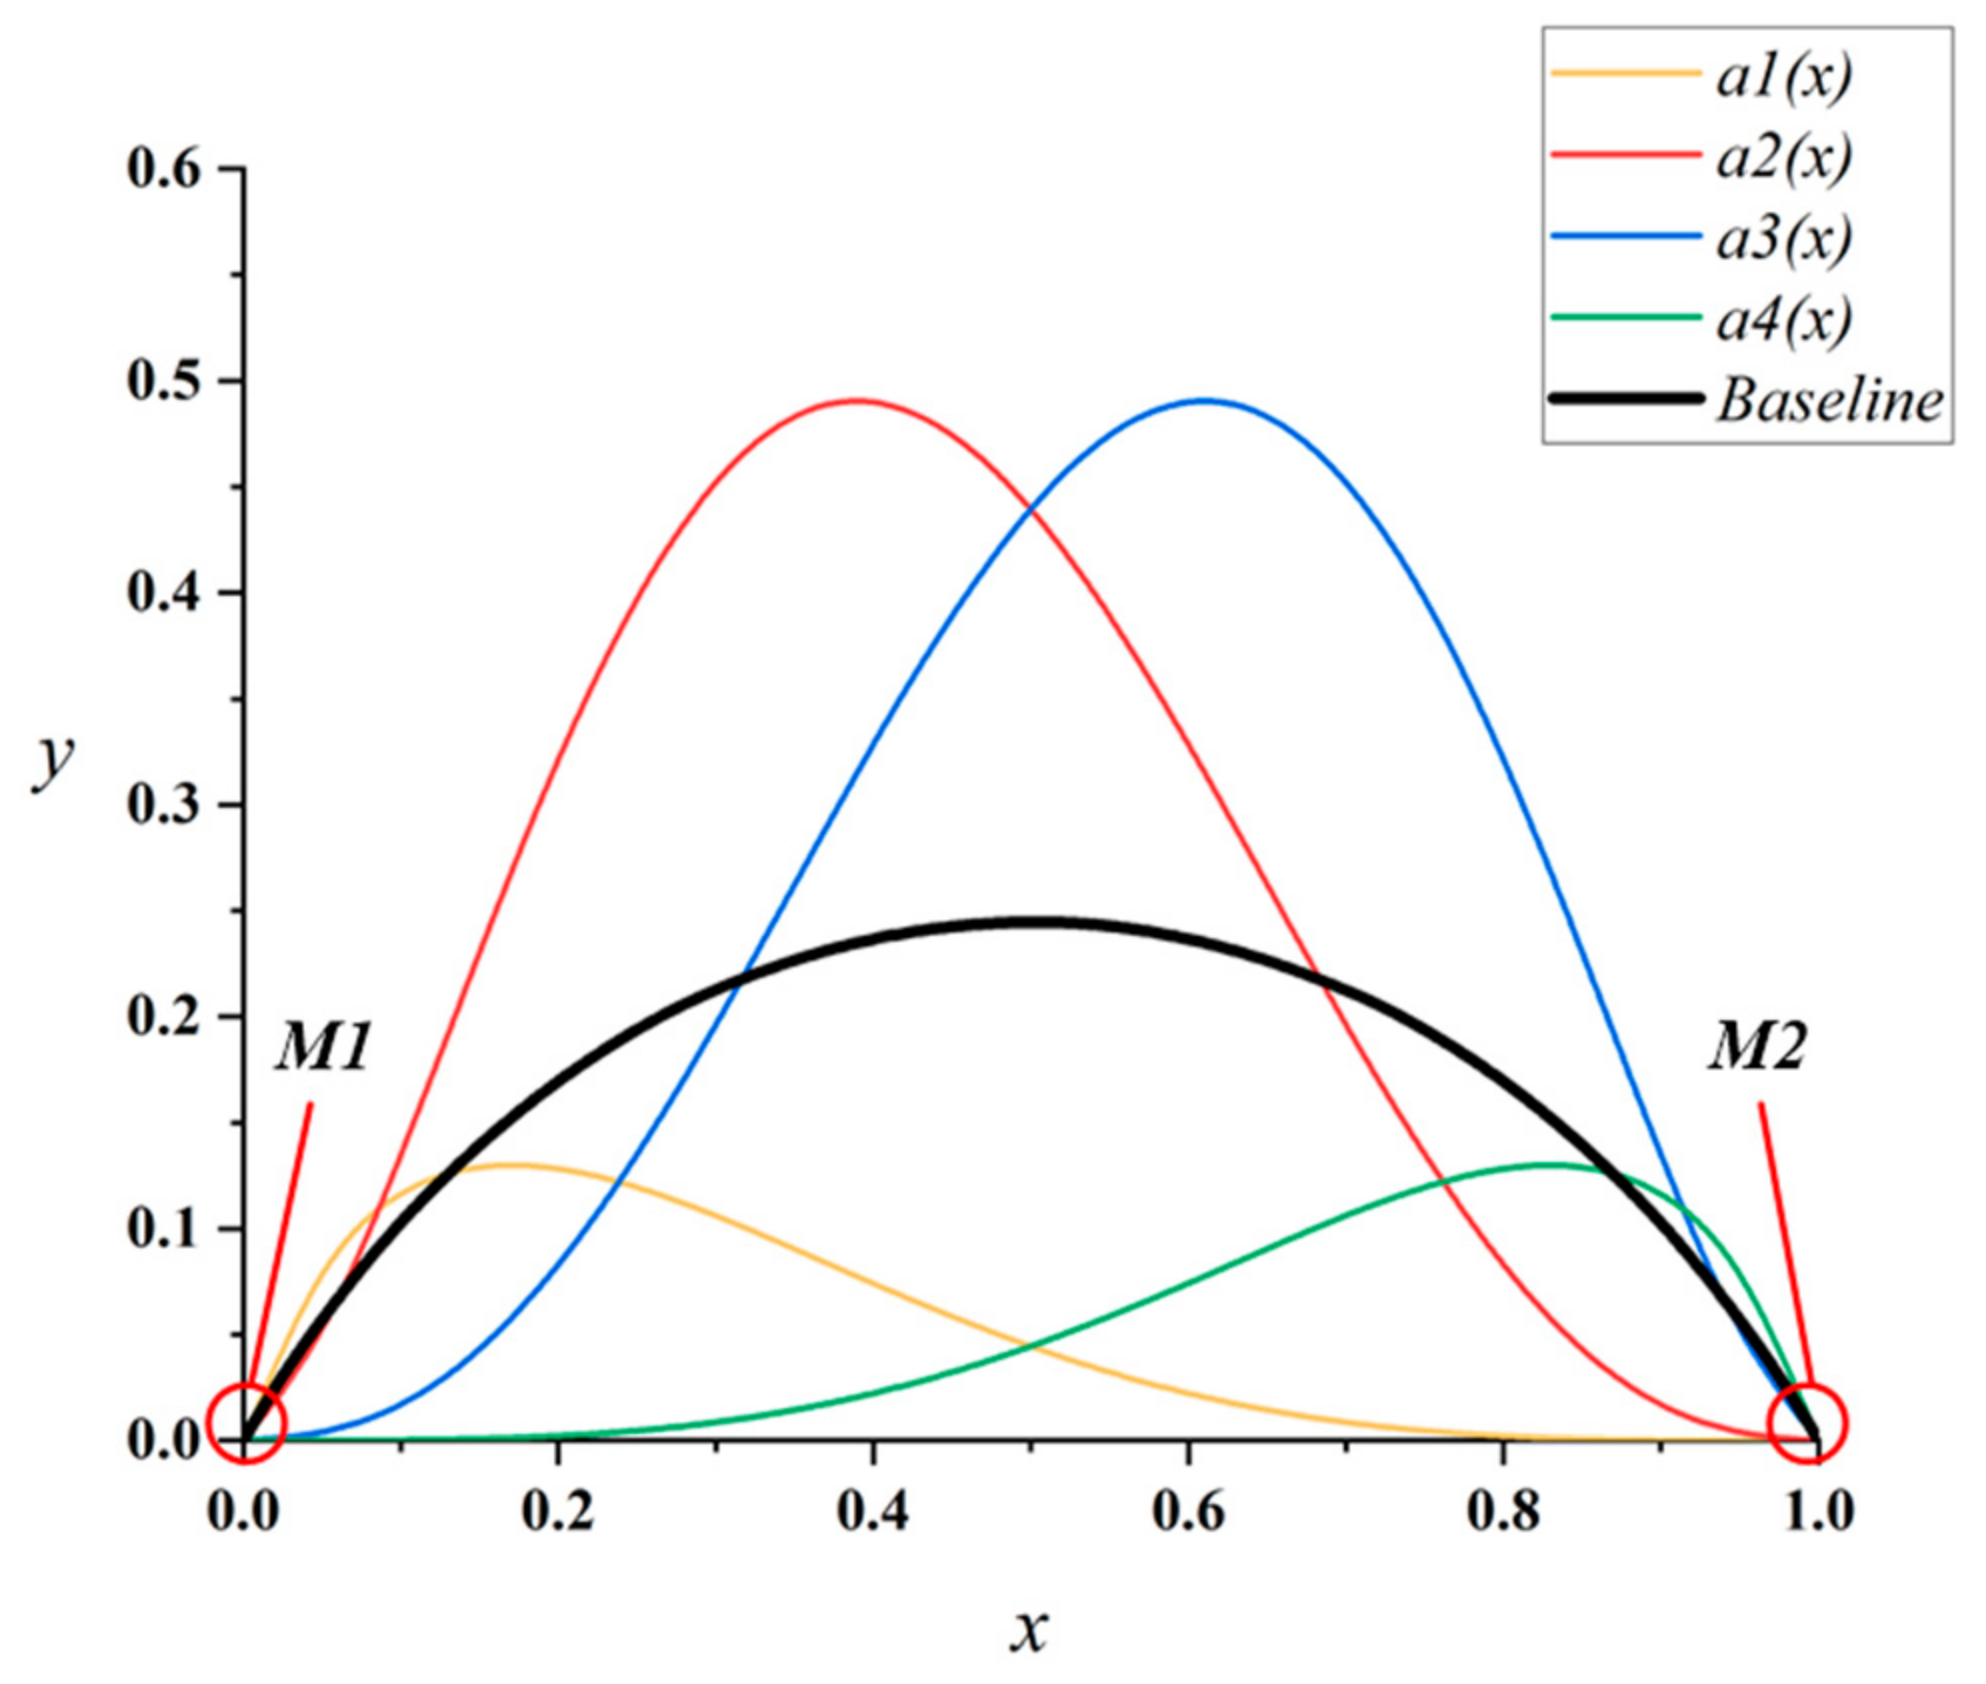
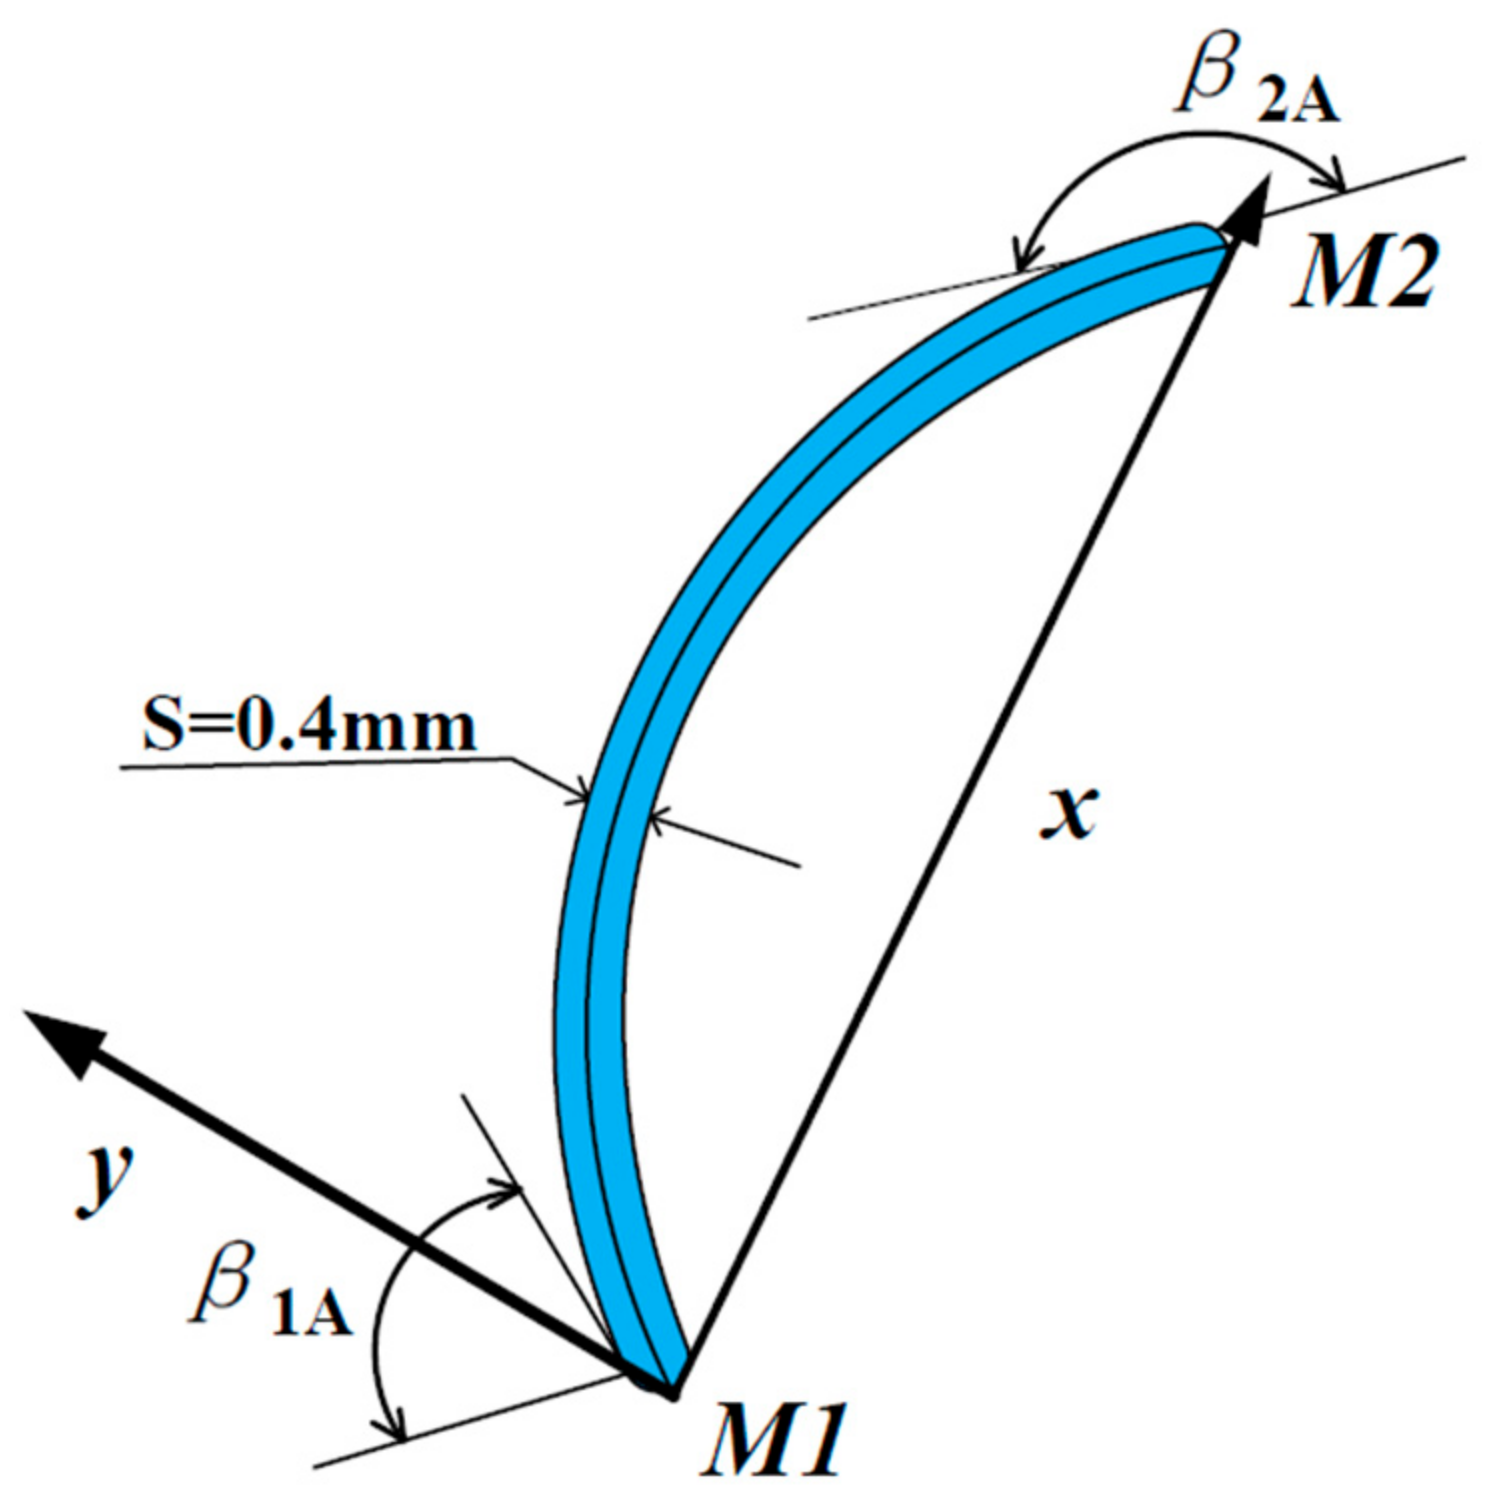
During the entire optimization process, the parameterization of the blade profile centerline is the most important. The parameterized blade profile centerline has fixed endpoints M1 and M2 so that the blade chord length L remains unchanged. Figure 5 shows the Schematic diagram of CST function superimposed blade forming. The value of n in Formula (5) not only determines the number of functions in the curvature distribution but also ensures smooth adjustment of key points of the leaf shape. An oversize n value, however, creates an increase in the number of design variables that complicates the optimization process. If the value of n is too small, the leaf shape cannot be adjusted effectively. After many comparisons, n = 3 was found to allow the CST function to be expressed as the sum of four divided subfunctions (Figure 5).
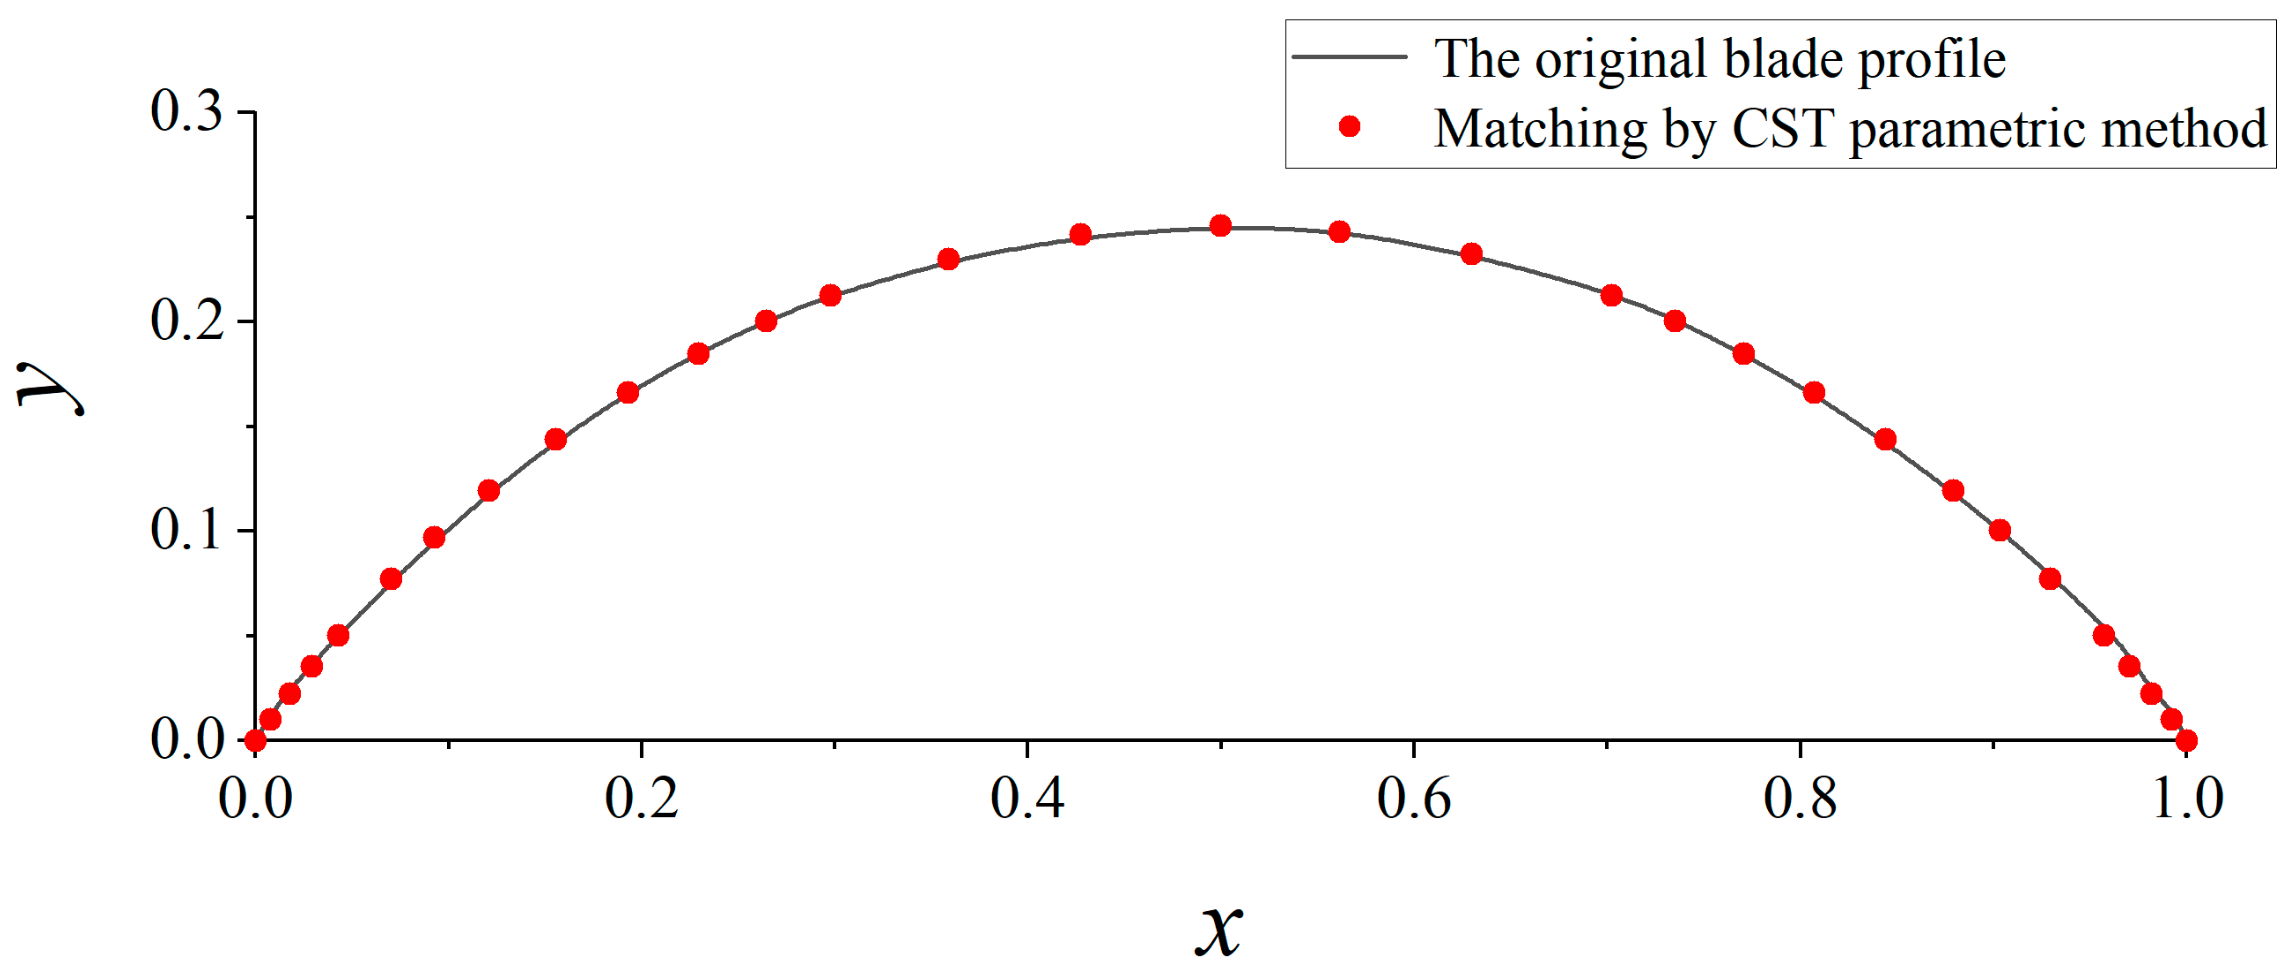
Figure 6 shows the blade structure of a multi-blade centrifugal fan. The CST parameterization method was used to fit the airfoil of the multi-blade centrifugal fan to validate the proposed method. The fitting curve is shown in Figure 7. The fitted values of the initial airfoil parameters are shown in Table 2, where the fitting error is less than 1%.
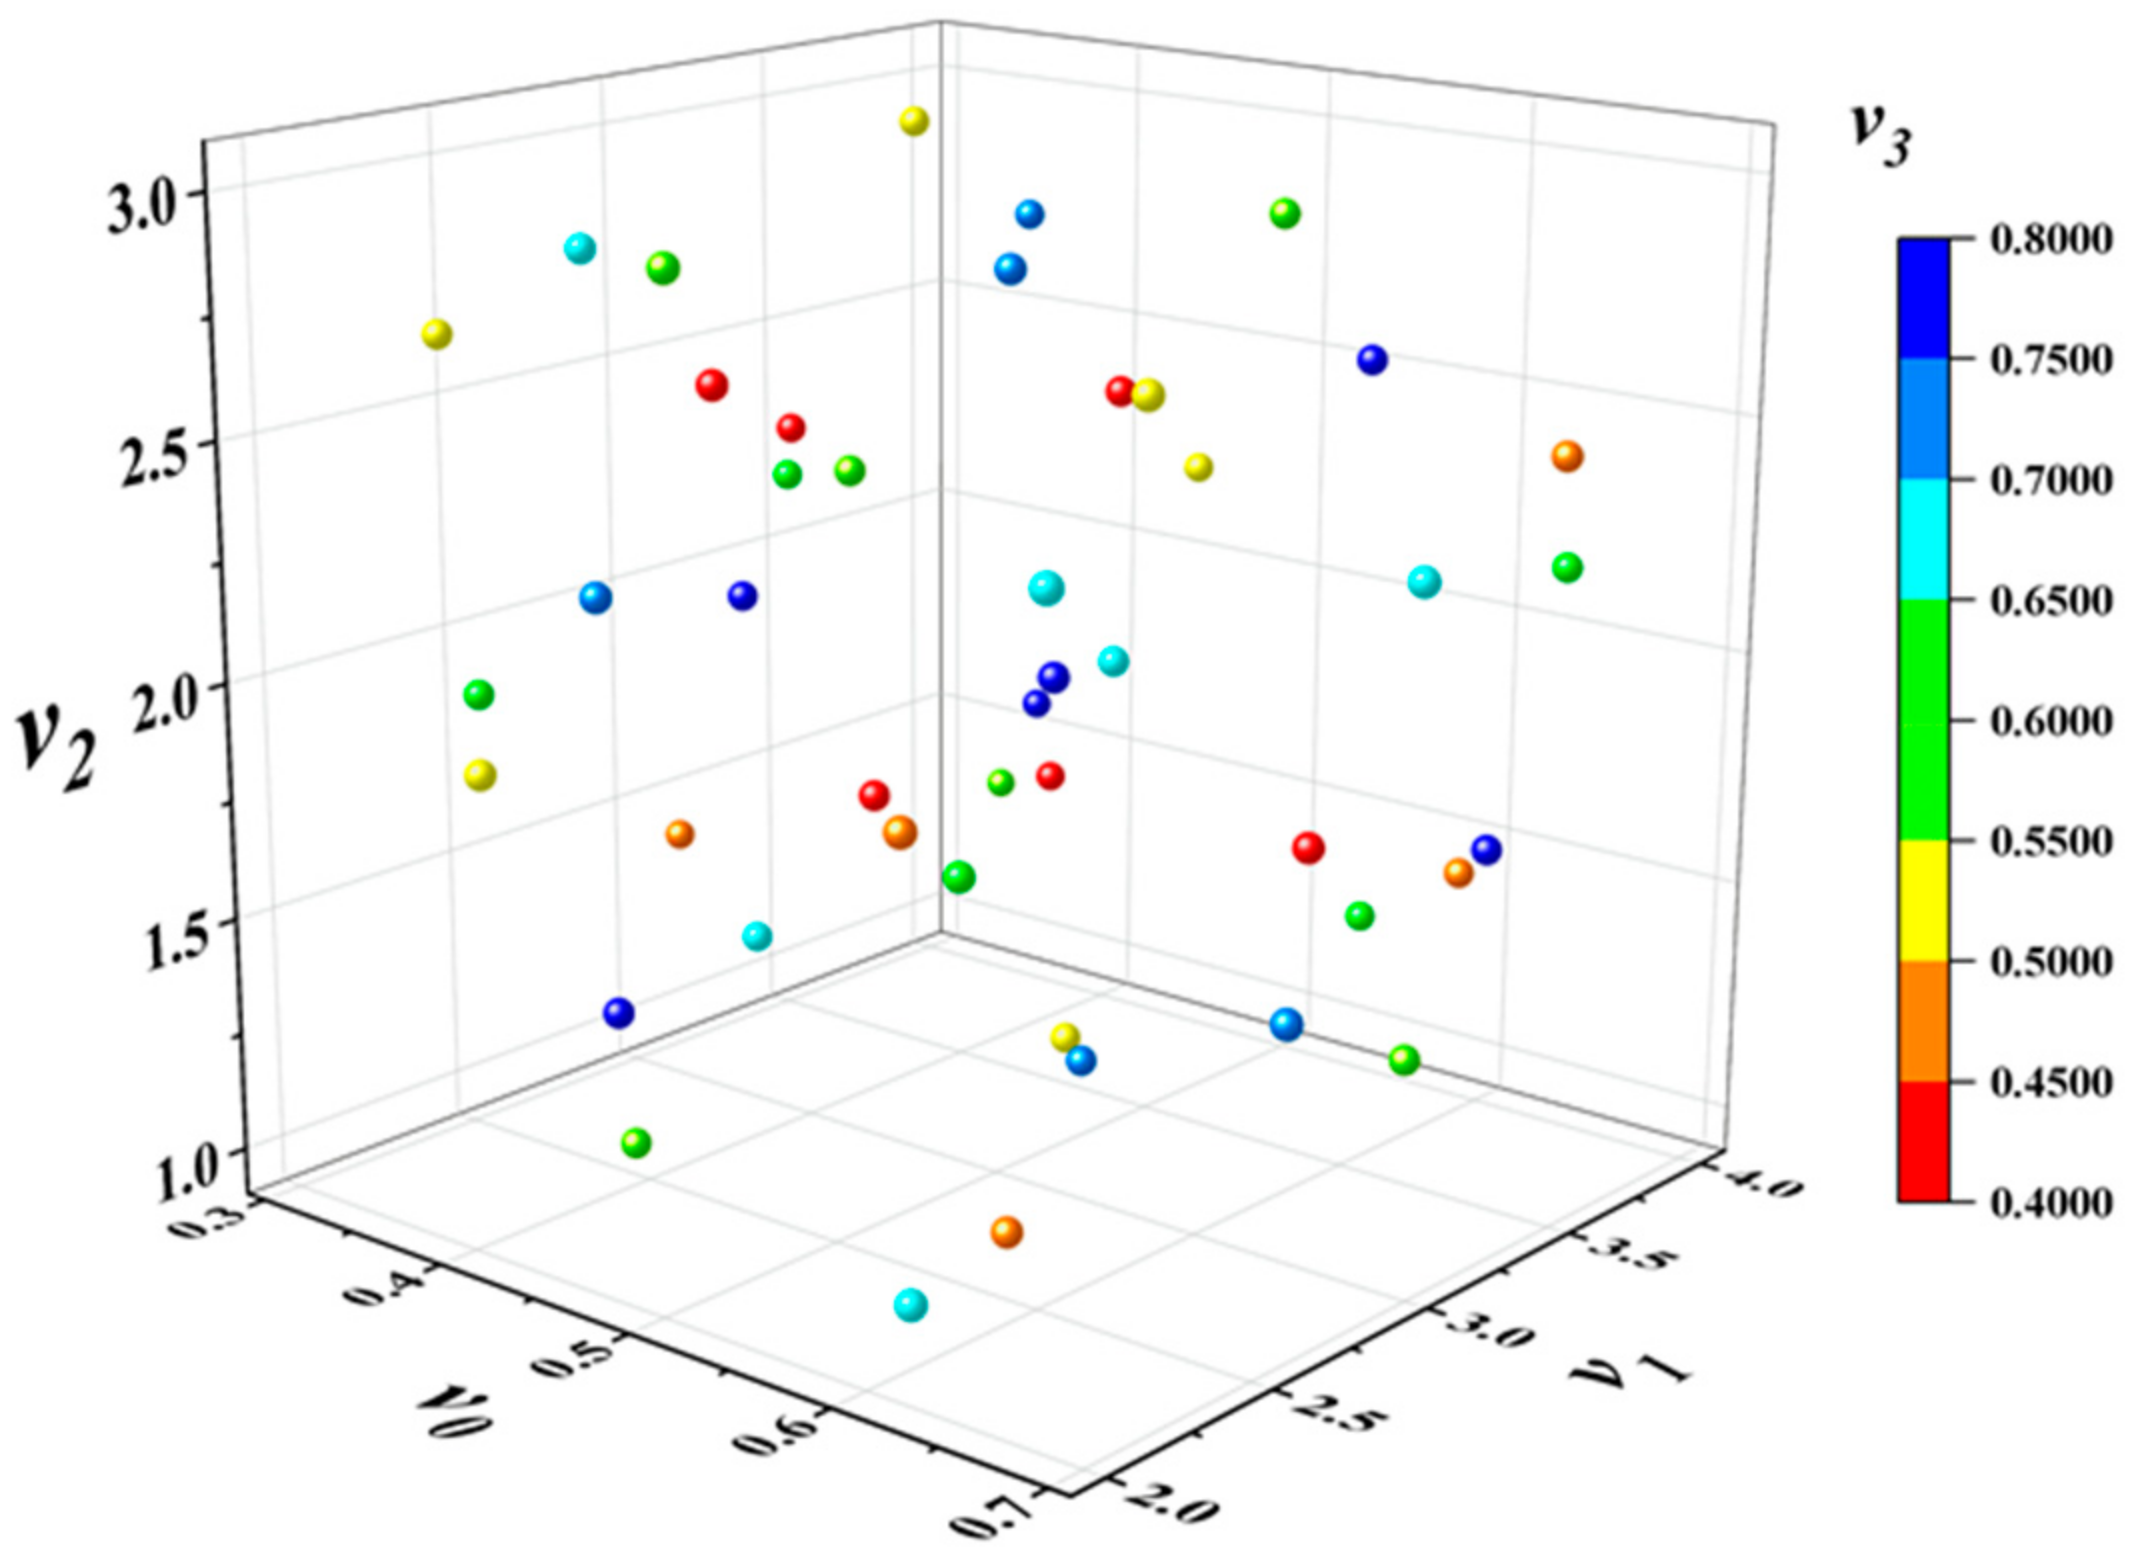
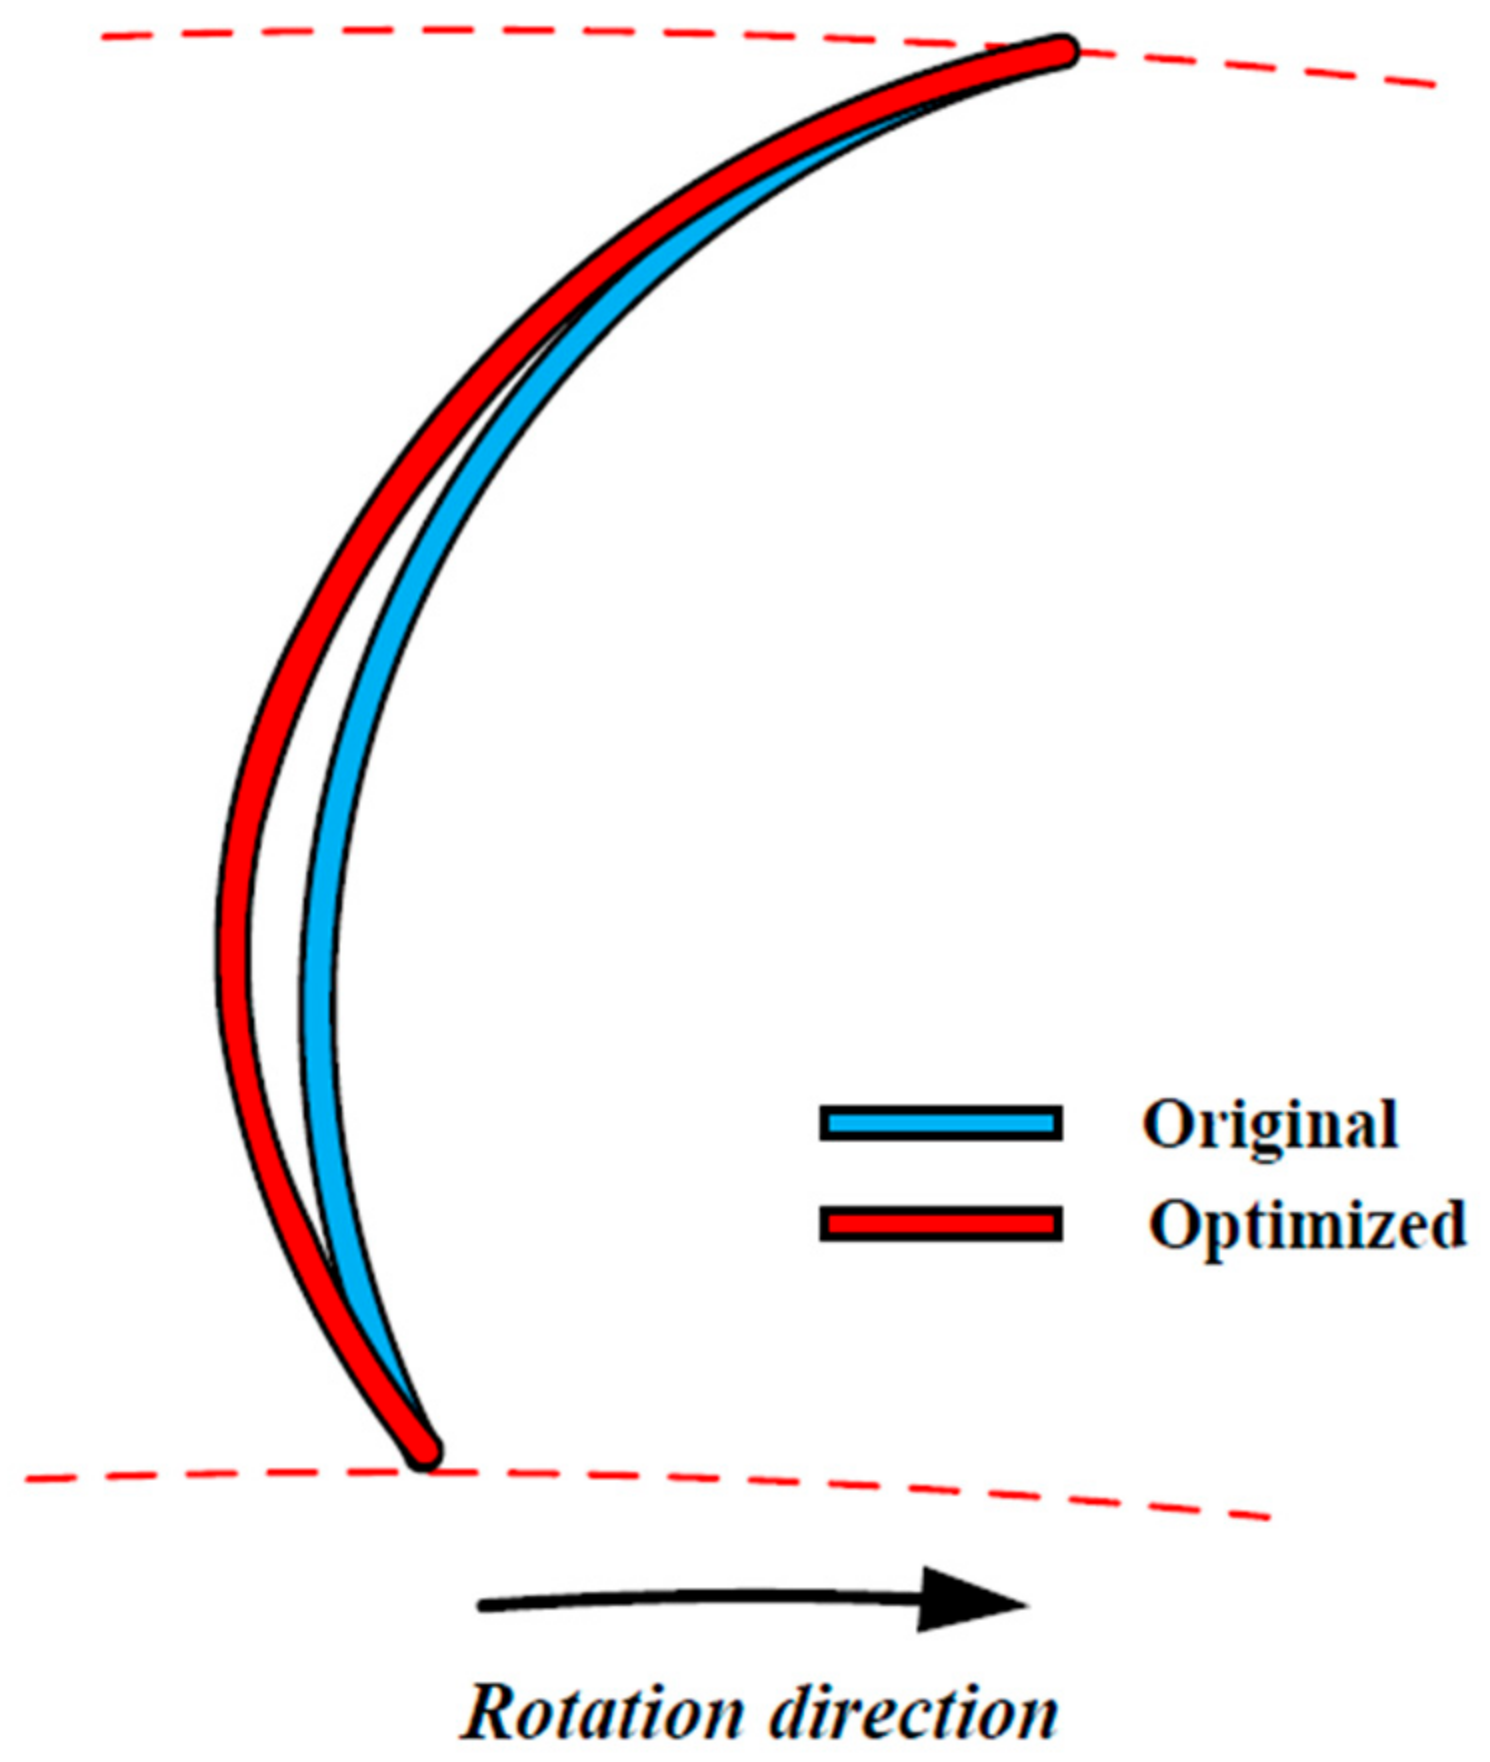
The design goal, in this case, is to optimize the blade profile, so it needs to be adjusted based on prototype line fitting. This approach reduces the modified sample space so that the optimized solution can be obtained quickly when performing multi-objective optimization.
With reference to the CST fitting parameters of the existing airfoil, the parameters were adjusted to obtain a more suitable airfoil. The variation range of the design variable (vi) is shown in Table 3.

4. Multi-Objective Optimization of Fan Blade Based on RBF Model with CST Parameterization as Inputs

Variables determined by CST parameterization, representing the blade shape, decide the fan performance. For different fan blade types, there will be some differences in parameters selection (such as N1, N2 and n). The relation between shape variables and performance parameters (such as Pressure and flow rate) is correlated with the RBF model. Based on this RBF model, multi-objective optimization with shape variables as optimized parameters can be conducted.

4.1. Pattern Building

The uniformity of sample distribution has an important effect on the accuracy of the approximate model. The Opt Latin Hypercube Designs (LHD) method can reduce the number of trials and reflect the characteristics of an entire optimized design space through a small number of sample points. This approach was adopted to make all test points evenly distributed across as much of the design space as possible [26]. The design variables ( v 0 , v 1 , v 2 , v 3 ) were sampled within the existing design range, and 45 sets of samples are obtained. The sampled samples are shown in Figure 8. CFD calculation was also performed on each sample airfoil to obtain sample response data (flow rate and total pressure efficiency).

4.2. RBF Model

The approximate model is a mathematical method approaching a set of input variables and output variables.
y ( x ) = y ˜ ( x ) + ε
where y(x) is the actual response values; y ˜ (x) is the response approximation, ε is the random error, respectively.
The Radial Basis Function network can approximate arbitrary non-linear functions and has good generalization ability [27,28]. Therefore, the Radial Basis Function network (RBF) is selected in this paper. Figure 9 shows the RBF model used in this optimization process. The model is a three-layer forward network structure divided into an input layer, hidden layer and output layer.
The data in Figure 8 were normalized and imported into Isight software to establish an approximate model and perform multi-objective optimization. Isight software is a software framework to integrate and automate the tedious and repetitive analytical design process. This data (sample set) is generally composed of design and optimized variables (Qv, η). The first 40 samples were selected as training samples, and the remaining five were used as test samples. Generally speaking, the training samples were used to build an approximate model, and the test samples were used to examine the accuracy of the approximate model. The R2 term is used to evaluate the accuracy of the approximate model:
R 2 = i = 1 n y ^ i y ¯ 2 i = 1 n y i y ¯ 2
where i is the number of training samples, n is the total number of samples, y ¯ is the average of the samples and y ^ is the predicted value of the test sample. The closer the R2 is to 1, the better the fitting effect. Table 4 shows that the R2 terms of each parameter is less than 0.95, so the approximate model is considered reliable.
The value R2 of this method shows that the prediction is reliable. The optimal sample was selected among 40 groups of samples for the purpose of determining the weight.

4.3. Optimization Algorithm

The NSGA-II algorithm (Non-dominant Sorting Genetic Algorithm-II) is a multi-objective optimization algorithm based on genetic algorithm and is a multi-objective optimization algorithm based on Pareto optimal solution discussion [29]. In this study, the population size was set to 80, iterations to 100 and crossover probability and mutation probability to 0.8 and 0.01, respectively. The coefficients of the four CST functions ( v 0 , v 1 , v 2 , v 3 ) were used as design variables. The flow rate and total pressure efficiency were selected as the optimization targets. In conclusion, the corresponding mathematical model of the study can be list as follows:
max ( q v ( v 0 , v 1 , v 2 , v 3 ) ) max ( η ( v 0 , v 1 , v 2 , v 3 ) ) 0.3 v 0 0.7 2 v 1 4 1 v 2 3 0.4 v 3 0.8

5. Sample Database Establishment for RBF Model: Numerical Simulation and Experimental Verification

The sample database for the training of the RBF model is calculated by CFD numerical method that is validated by experiment setup of this paper.

5.1. Experimental Setup and Method

In this article, there is a large number of samples that need numerical simulation calculations, so it is very important to ensure the accuracy of numerical simulation calculations by test verification. The aerodynamic performance of the multi-blade centrifugal fans was tested on the experimental platform with reference to GB/T 1236-2017 [30], based on a performance test of an industrial ventilator with a standardized air duct. Schematic diagram and physical diagram of the test equipment are shown in Figure 10. The outlet of the tested fan is connected with the test bench, and the different working conditions are adjusted by a throttling device. The static pressure was obtained by averaging four pressure probes evenly distributed around the measuring pipeline. The total pressure and efficiency were calculated accordingly.
Generally, the measurement error of the fan performance is affected by the accuracy of the sensors and the test method. The test under each working condition takes more than 5 min, and the average value under stable conditions is taken to ensure the accuracy of the data. In addition, the error of the sensors is calibrated and kept within 1%. Therefore, the uncertainty of fan performance measurement can be guaranteed within a small range (within 1%).

5.2. Verification of Numerical Model and Sample Calculation

Figure 11a displays the simplified diagram of the computing domain, which was divided into the impeller fluid domain, volute fluid domain, inlet fluid domain and outlet fluid domain. The inlet and outlet watersheds were extended appropriately for accurately simulating the flow conditions at the inlet and outlet of the fan. The inlet channel was a hemispherical inlet. The outlet flow area was extended to five times the radius of the volute inlet, and a rectifying plate was set in the outlet extension section so as to eliminate the vortex structure caused by separation and reduce the influence of the outlet airflow on the internal flow of the fan. In order to accurately simulate the complex flow, the wind turbine was discretized by structural grids. Unstructured grids were adopted for complex motors and support structures. The overall grid is depicted in Figure 11b,c presents the impeller structure grids.
The internal flow field of the multi-blade centrifugal fan was solved by FLUENT 19.1. The simulation medium was 25 °C dry air. The multiple reference frame model (MRF) was applied to the simulation of the impeller rotation. All the walls were assumed to be fixed walls except that the blade was set as a moving wall relative to the impeller flow field. The inlet and outlet boundary conditions were set as pressure inlet and pressure outlet. The pressure-based implicit solver was specified.
The shear stress transport model (SST k-ω) was used to close the turbulence term to solve the three-dimensional Reynolds averaged Navier-Stokes equation for its high calculation accuracy in the area with a large velocity gradient near the vortex. The velocity and pressure coupling model was selected using the versatile SIMPLE algorithm. The momentum equation, dissipation rate equation and turbulent kinetic energy equation were discretized with a second-order upwind scheme. The residual root means square (RMS) value of the governing equation was specified to be less than 10−5 to ensure the accuracy and convergence of numerical calculations [31].
For the SST k-ω turbulence model used in this study, the treatment of wall shear stress has a great influence on the accuracy of numerical scheme. The dimensionless distance (y+) must be limited to obtain accurate data from the SST model. The first mesh node should be placed in the viscous region at the bottom when dividing the grid. It is generally considered that the y+ value is less than 5. The empirical formula of y+ is:
Y w a l 1 = 6 V r e f   v 7 8 L r e f   2 1 8 y +
where Ywall is the height of the first layer of the boundary layer grid, in mm; Vref is the reference speed, in m/s; Lref is the reference length, in m; ν is the fluid kinematic viscosity, in m2/s; and y+ is a dimensionless parameter indicating the boundary point between the viscous bottom and logarithmic layers. The height of the first layer of the boundary layer grid should be <0.44 mm.
When the girl of the whole fluid domains reaches more than 2.6 million meshes, the total pressure and the flow rate in this model varies within 1% (Figure 12). Thus, comprehensively considering the accuracy of the calculation and the time cost of the optimization project, the calculated grid number was determined to be 2,675,823.
The numerical and experimental performance curves obtained in this study are in agreement with the large flow area (Figure 13). In the small flow rate region, however, there is some significant error due to the difficulty of numerically simulating turbulence and boundary layer separation. The design flow condition error is 2%, which is within an acceptable range.

6. Results Analysis: Comparison of the Original Impeller and Optimized Impeller

6.1. Final Blade Profile

The established RBF model was solved by NSGA-II to obtain a Pareto solution set. Figure 14 shows the Pareto frontier solution of this problem. The gap between the solution sets is very small. The optimization goal requires the simultaneous improvement of full pressure efficiency and flow rate. Therefore, considering that in the optimization goal, the flow rate of the fan and the total pressure are equally important. A mathematical model M a x 0.5 η B + 0.5 q v was selected as the best solution for analysis.
The corresponding blade structure parameters and aerodynamic performance of the original and optimized profiles are listed in Table 5. By comparison, it appears that under the design working conditions, the effective air volume of the fan increases by near 1.4 m3/min and the total pressure efficiency increases by near 3.1%.
Figure 15 shows the original and optimized blade profiles. Figure 16 shows the original and optimized impeller. The optimized blade shows a major modification in the trailing edge, while the angle adjustment at the leading edge is small. By comparing the geometrical structure of blades before and after optimization, the inlet installation Angle β 1 A is shown to decrease by 4.7° while the outlet installation Angle β 2 A increases by 1.7°.

6.2. Comparison of Performance Curve

The aerodynamic performance of the fan appears to improve after optimization significantly. Numerical simulation and experimental testing of the fan after optimization of the blade shape were conducted to analyze this result further. Figure 17 shows the fan performance curve before and after optimization. The air performance curve of the optimized fan is consistent with the original fan performance curve. The difference is that the optimized fan’s total pressure and total pressure efficiency at various operating conditions are improved. At the design point, the effective air volume increases by 1.4 m3/min, and the total pressure efficiency increases by 3.1%. Comparing to the two-fan performance curve, the efficiency of the optimized fan is obviously higher than that of the original one and a higher efficiency fan can save the energy of the ventilation system and temperature adjustment system.

6.3. Comparison of Flow Characteristics Original and Optimized

Figure 18 shows vorticity comparison in the range of 220°~280°. Under the influence of the inlet direction of the impeller, after the gas flowed in from the impeller inlet, the leading edge of the blade will have obvious flow separation and the leading-edge separation vortex will occupy the blade passage and occupies a larger space. The separation vortex continues to develop along the blade path, which will cause the deterioration of the downstream flow field. In the range of 220°~280°, the impeller is close to the outlet of the volute domain, so there is a large amount of airflow leaving the flow field. Thus, the flow characteristics of this area have a greater impact on air performance. Affected by the inlet installation Angle β 1 A , there is obvious suction separation at the leading edge of the blade and the vortex will occupy the space of the flow path and cause the deterioration of the flow field. Affected by the Blade outlet angle, the shedding vortex of the trailing edge will also follow the blade tail to affect the blade outlet flow path. Unreasonable vortex formation and rupture aggravate the turbulence of the flow field and increase the energy loss of the entire flow field. The optimized impeller (Figure 18a) has better vortex sizes and distribution at the front and rear edges of the blades than the original one. Therefore, the optimized fan is more efficient and the air conditioning system used by the fan has a higher energy utilization rate.
Figure 19 shows a speed expansion diagram of the impeller outlet. The area of the volute tongue corresponding to the impeller falls into the middle of the diagram. The airflow angle in the impeller channel near the volute tongue area after optimization is reduced to a certain extent compared with the original model in one cycle. This indicates that the airflow from the impeller flows more area along the tangential direction of the impeller radius, which reduces the radial velocity component in the impeller flow path. The circumferential velocity increases as well, which reduces the flow loss caused by the impact of the gas on the wall of the volute. Reducing the impact loss of the outlet airflow and the wall surface can indirectly improve the efficiency of the fan, thereby increasing the efficiency of the system. At the same time, the gas impacts the inner wall of the volute at a large angle after flowing out of the impeller, which will cause unreasonable broadband noise.
According to vortex-sound theory [32], the noise level of the fan is largely affected by the vortex. The vortex-acoustic equation for isentropic flow at a low Mach number can be written as follows:
1 c 0 2 2 t 2 2 B = d i v ( ω × v )
where B is the total enthalpy of the fluid, w is the flow vortex vector and v is the speed of vector. The tension and breakdown of the vortex cause pressure pulsation and then generate vortex noise. Under stable conditions, the speed of vector tends to stabilize, so the turbulent vortex w has a significant contribution to the noise of the fan.
Figure 20 is a streamline diagram of the exit area of the volute. As shown in Figure 20a, there are large-scale vortices in the volute channel, and the vortex core in the red circle disappears after optimization. The turbulence of the volute passage is improved, and the residence time of the airflow in the volute passage is reduced, which together enhances efficiency. The vortex core in the red circle disappears after optimization as well, so it can be inferred that the noise performance of the optimized fan is better than that of the prototype. In order to verify this conjecture, the acoustic characteristics of the impeller original and optimized were tested.

6.4. Experimental Comparison of Acoustic Characteristics Original and Optimized

As the primary source of noise in the building ventilation system, the acoustic characteristic of the fan affects the experience of building users. As another form of energy dissipation, reduction of the fan noise can indirectly improve the efficiency of the fan. Therefore, the noise of the fan should also be taken into consideration after optimization.
The multi-blade centrifugal fan field test was conducted with reference to the standard GB/T 2888-2016, “Measurement Method for Noise of Fans and Roots Fans” [33]. The noise measurement was carried out in a semi-anechoic room laboratory (Figure 21). The control room uses a multi-channel acquisition and analysis system with acoustic and vibration analysis software, including powerful FFT, CPB (1/3 octave band analysis) and a total level value analyzer.
Schematic diagram of test points is shown in Figure 22. The sound pressure level (SPL) spectrum of the two wind impellers at monitoring point A is shown in Figure 23. The sound pressure level spectrum of the optimized fan and the sound pressure level spectrum of the prototype fan are shown in Figure 23 for comparison. The basic frequency and multiplication frequency of the fan can be calculated from the blade frequency formula. The sound pressure level appears to be highest at the fundamental frequency of 880 Hz and decreases at the double frequency. The sound pressure level spectrum of the two fans shows basically the same trend across the entire frequency range. The sound pressure level of the optimized fan at the fundamental frequency and octave frequency is reduced to a certain extent; the broadband noise of other frequency bands is also slightly lower than that of the prototype fan. Comparing the noise value measured by the prototype (54.05 dB) and the noise value measured after optimization (52.93 dB), the prototype wind turbine containing the optimized blade is 1.12 dB quieter.
Figure 24 compares the sound pressure level distribution under 1/3 octave frequency between the original and optimized fan structures. The optimized fan shows a significant reduction in low-frequency noise and similar high-frequency change trends as the original device. The blades, after airfoil modification, can suppress the eddy current noise of the fan over a wide frequency distribution; the attenuation amplitude of the discrete characteristic rotating noise is greater than that of the original fan. The optimized airfoil can change the trailing edge vortex distribution, reduce the impact of the outflow on the interior of the volute and reduce aerodynamic noise. As the main work component of the ventilation system, the reduction of fan noise can greatly improve user experience.

7. Conclusions

A multi-objective multi-blade centrifugal fan optimization design was developed in this study using the disturbance CST function. Numerical simulation and experimental analyses were conducted to test its feasibility and effectiveness. The conclusions of this work can be summarized as follows:
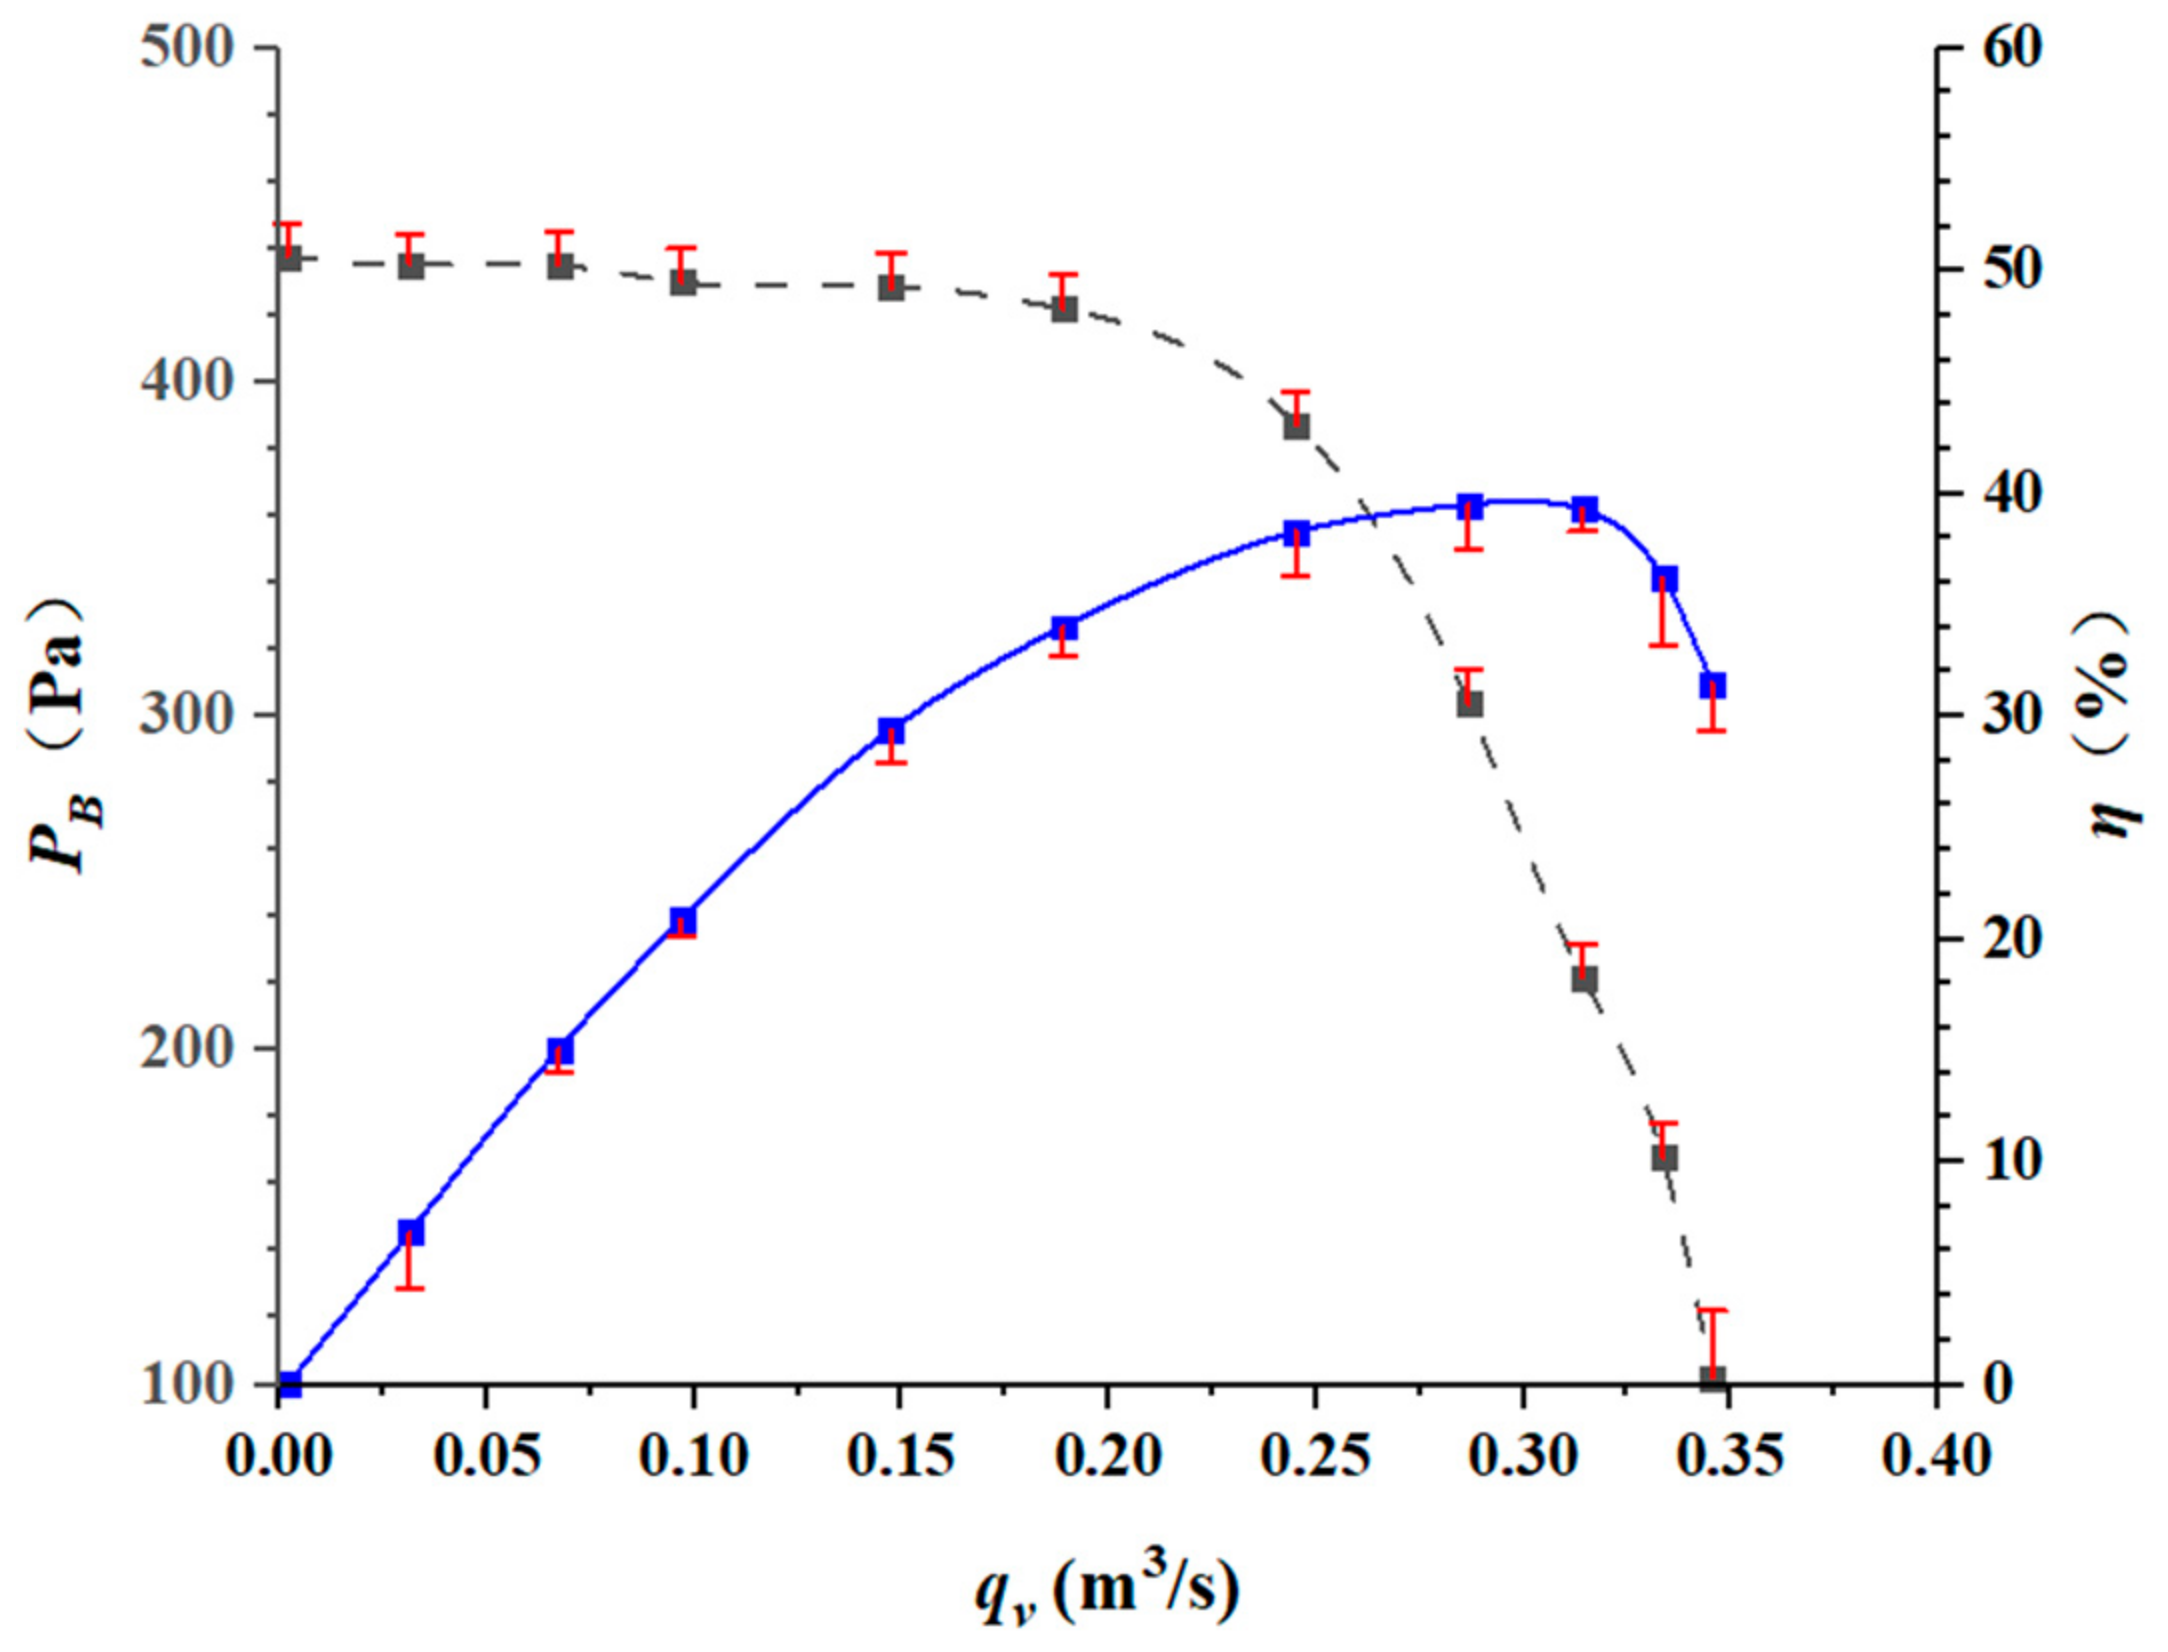
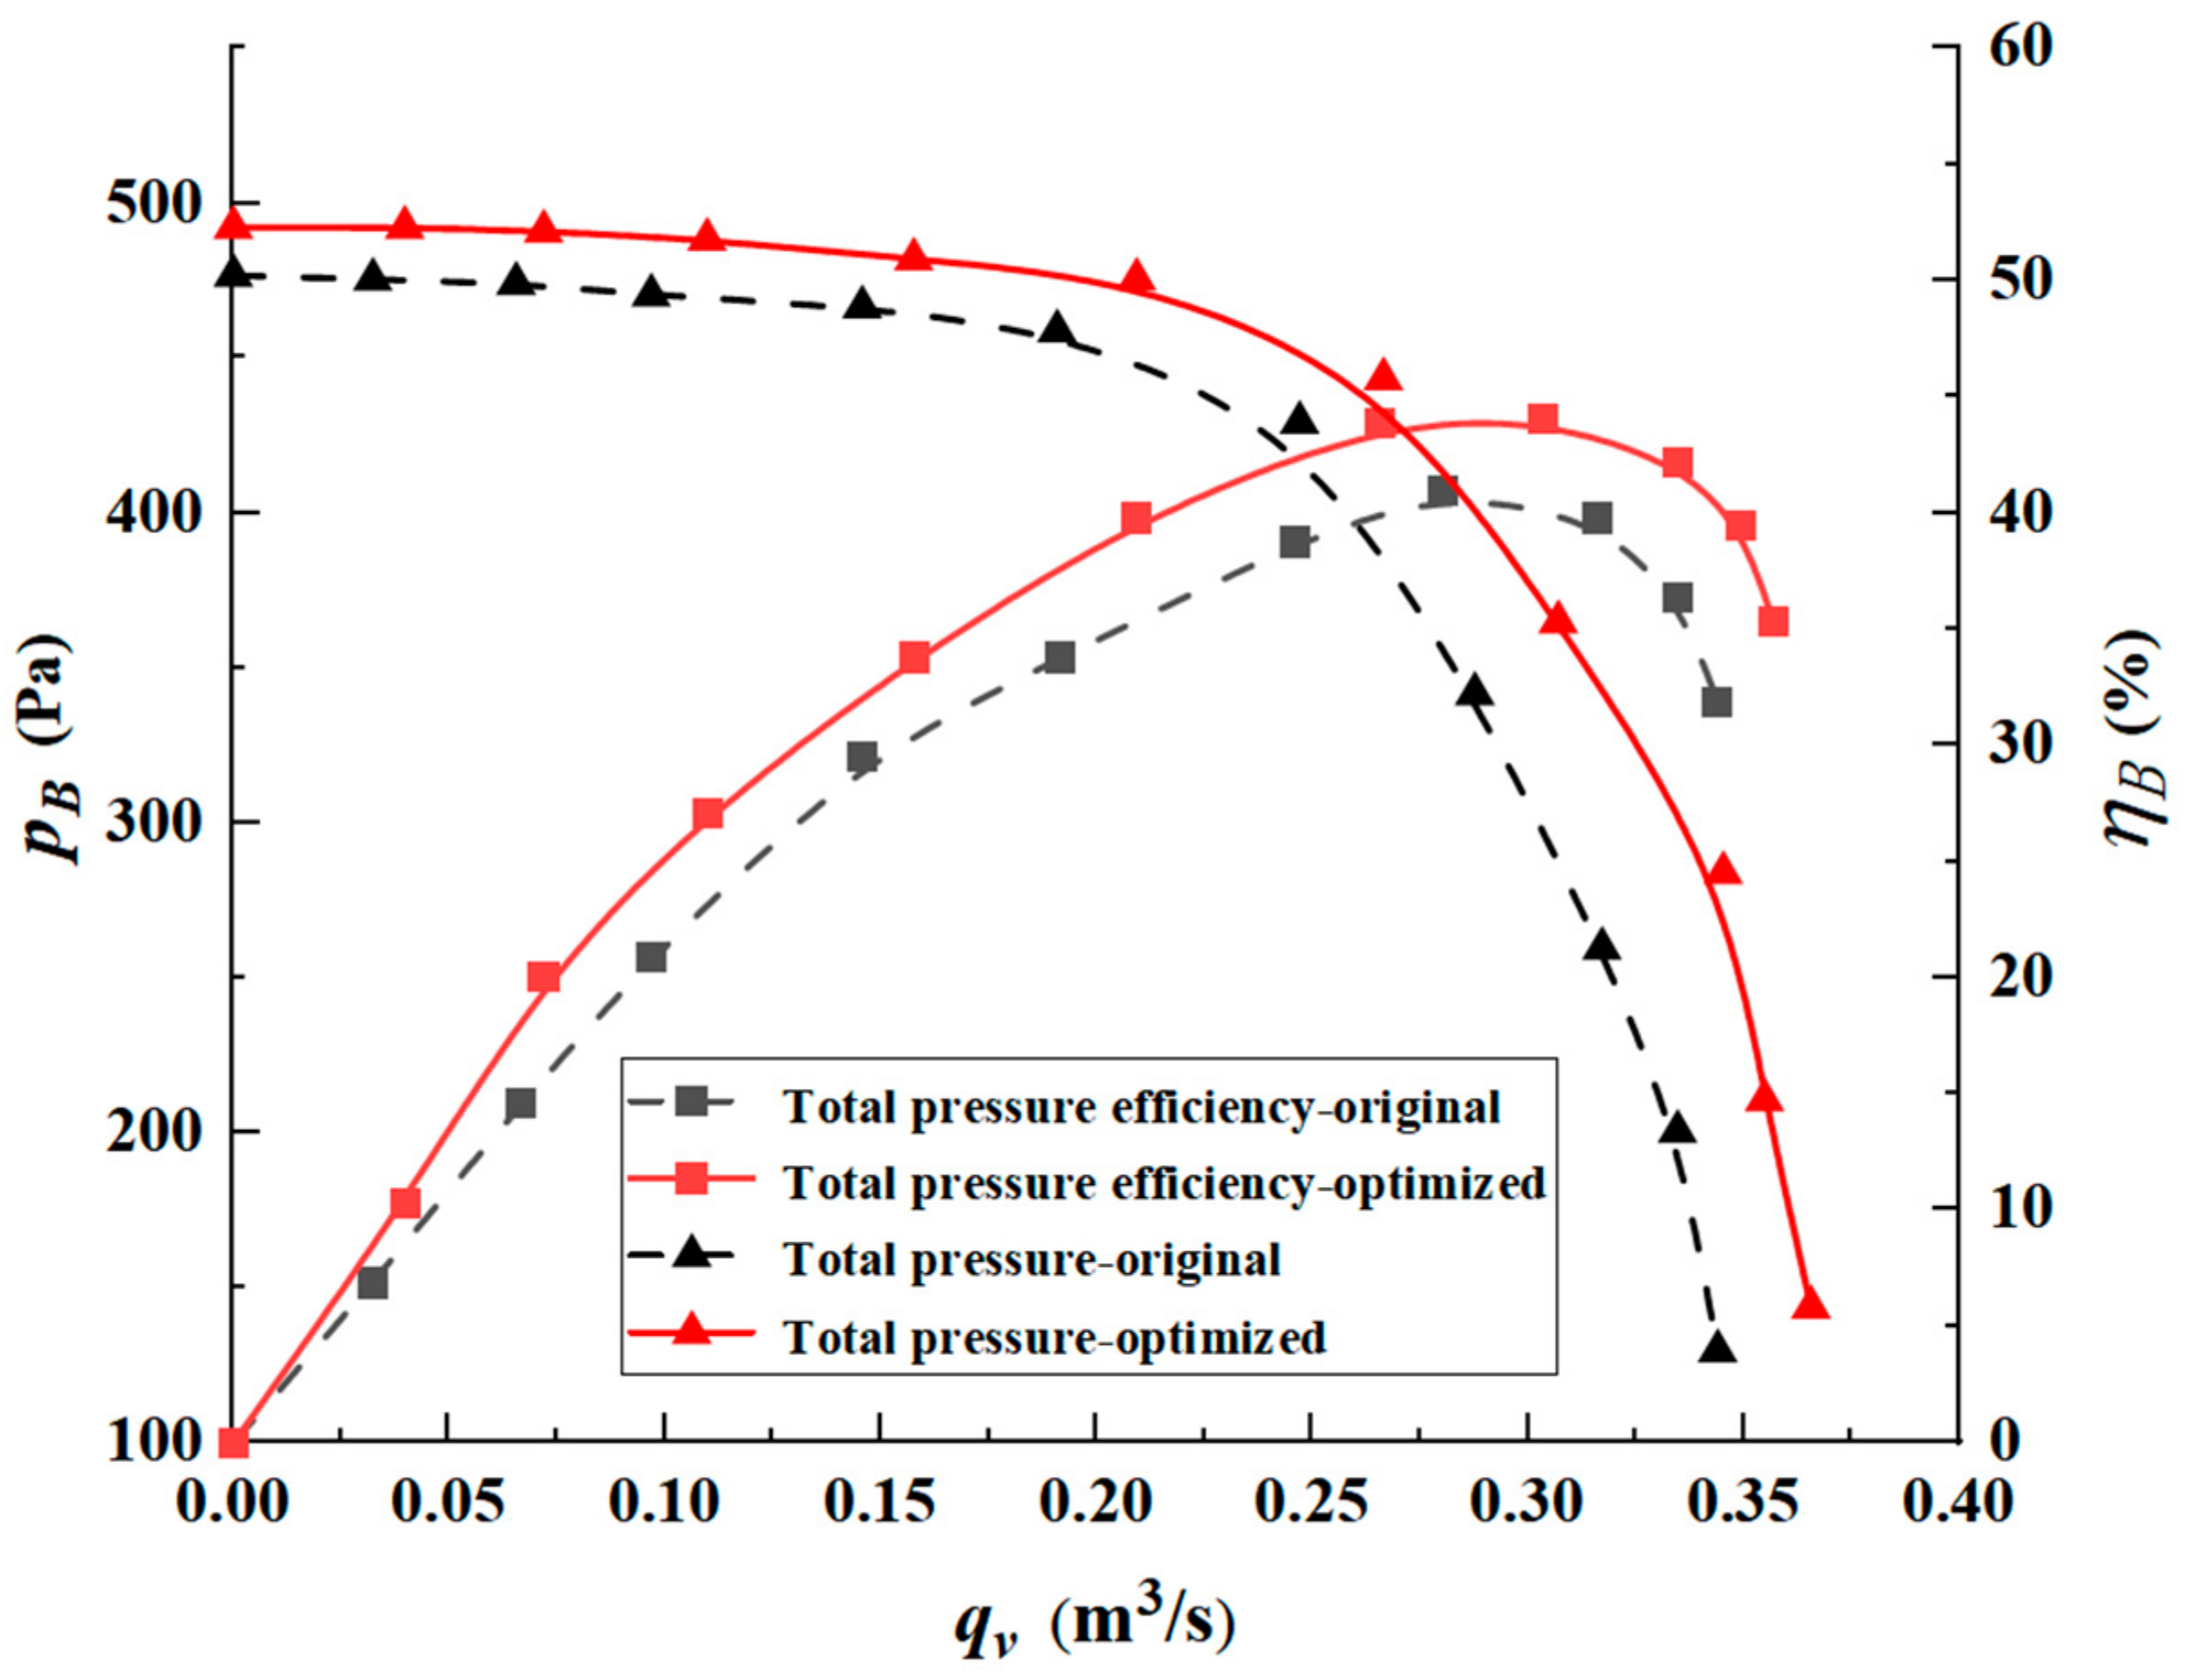
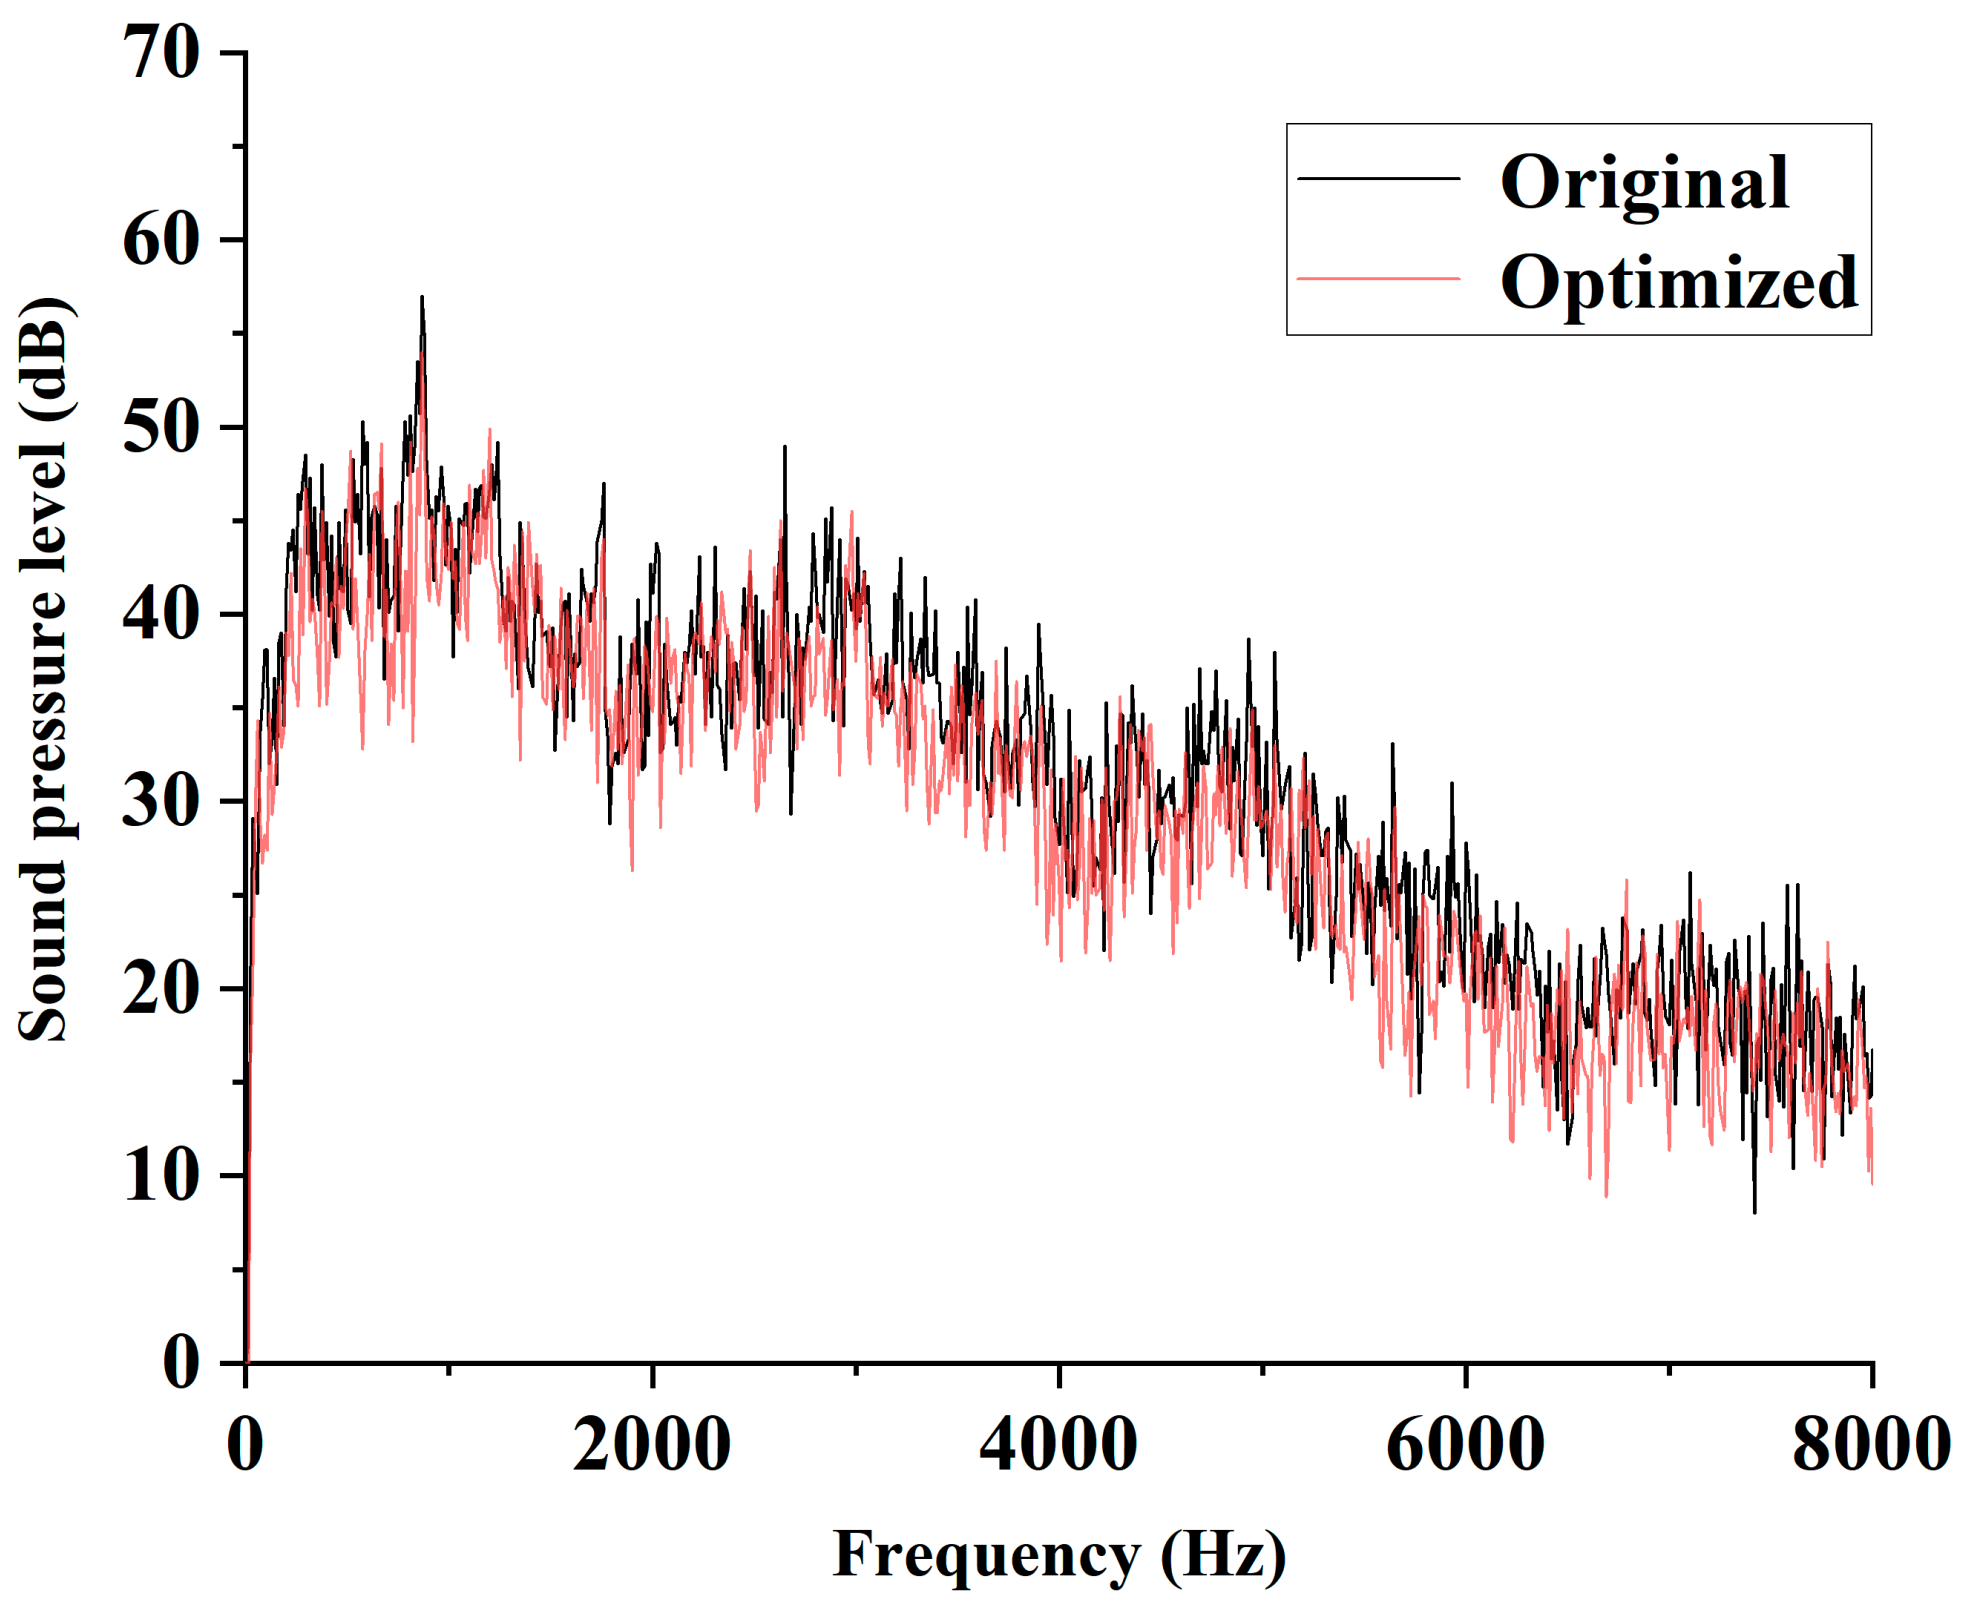
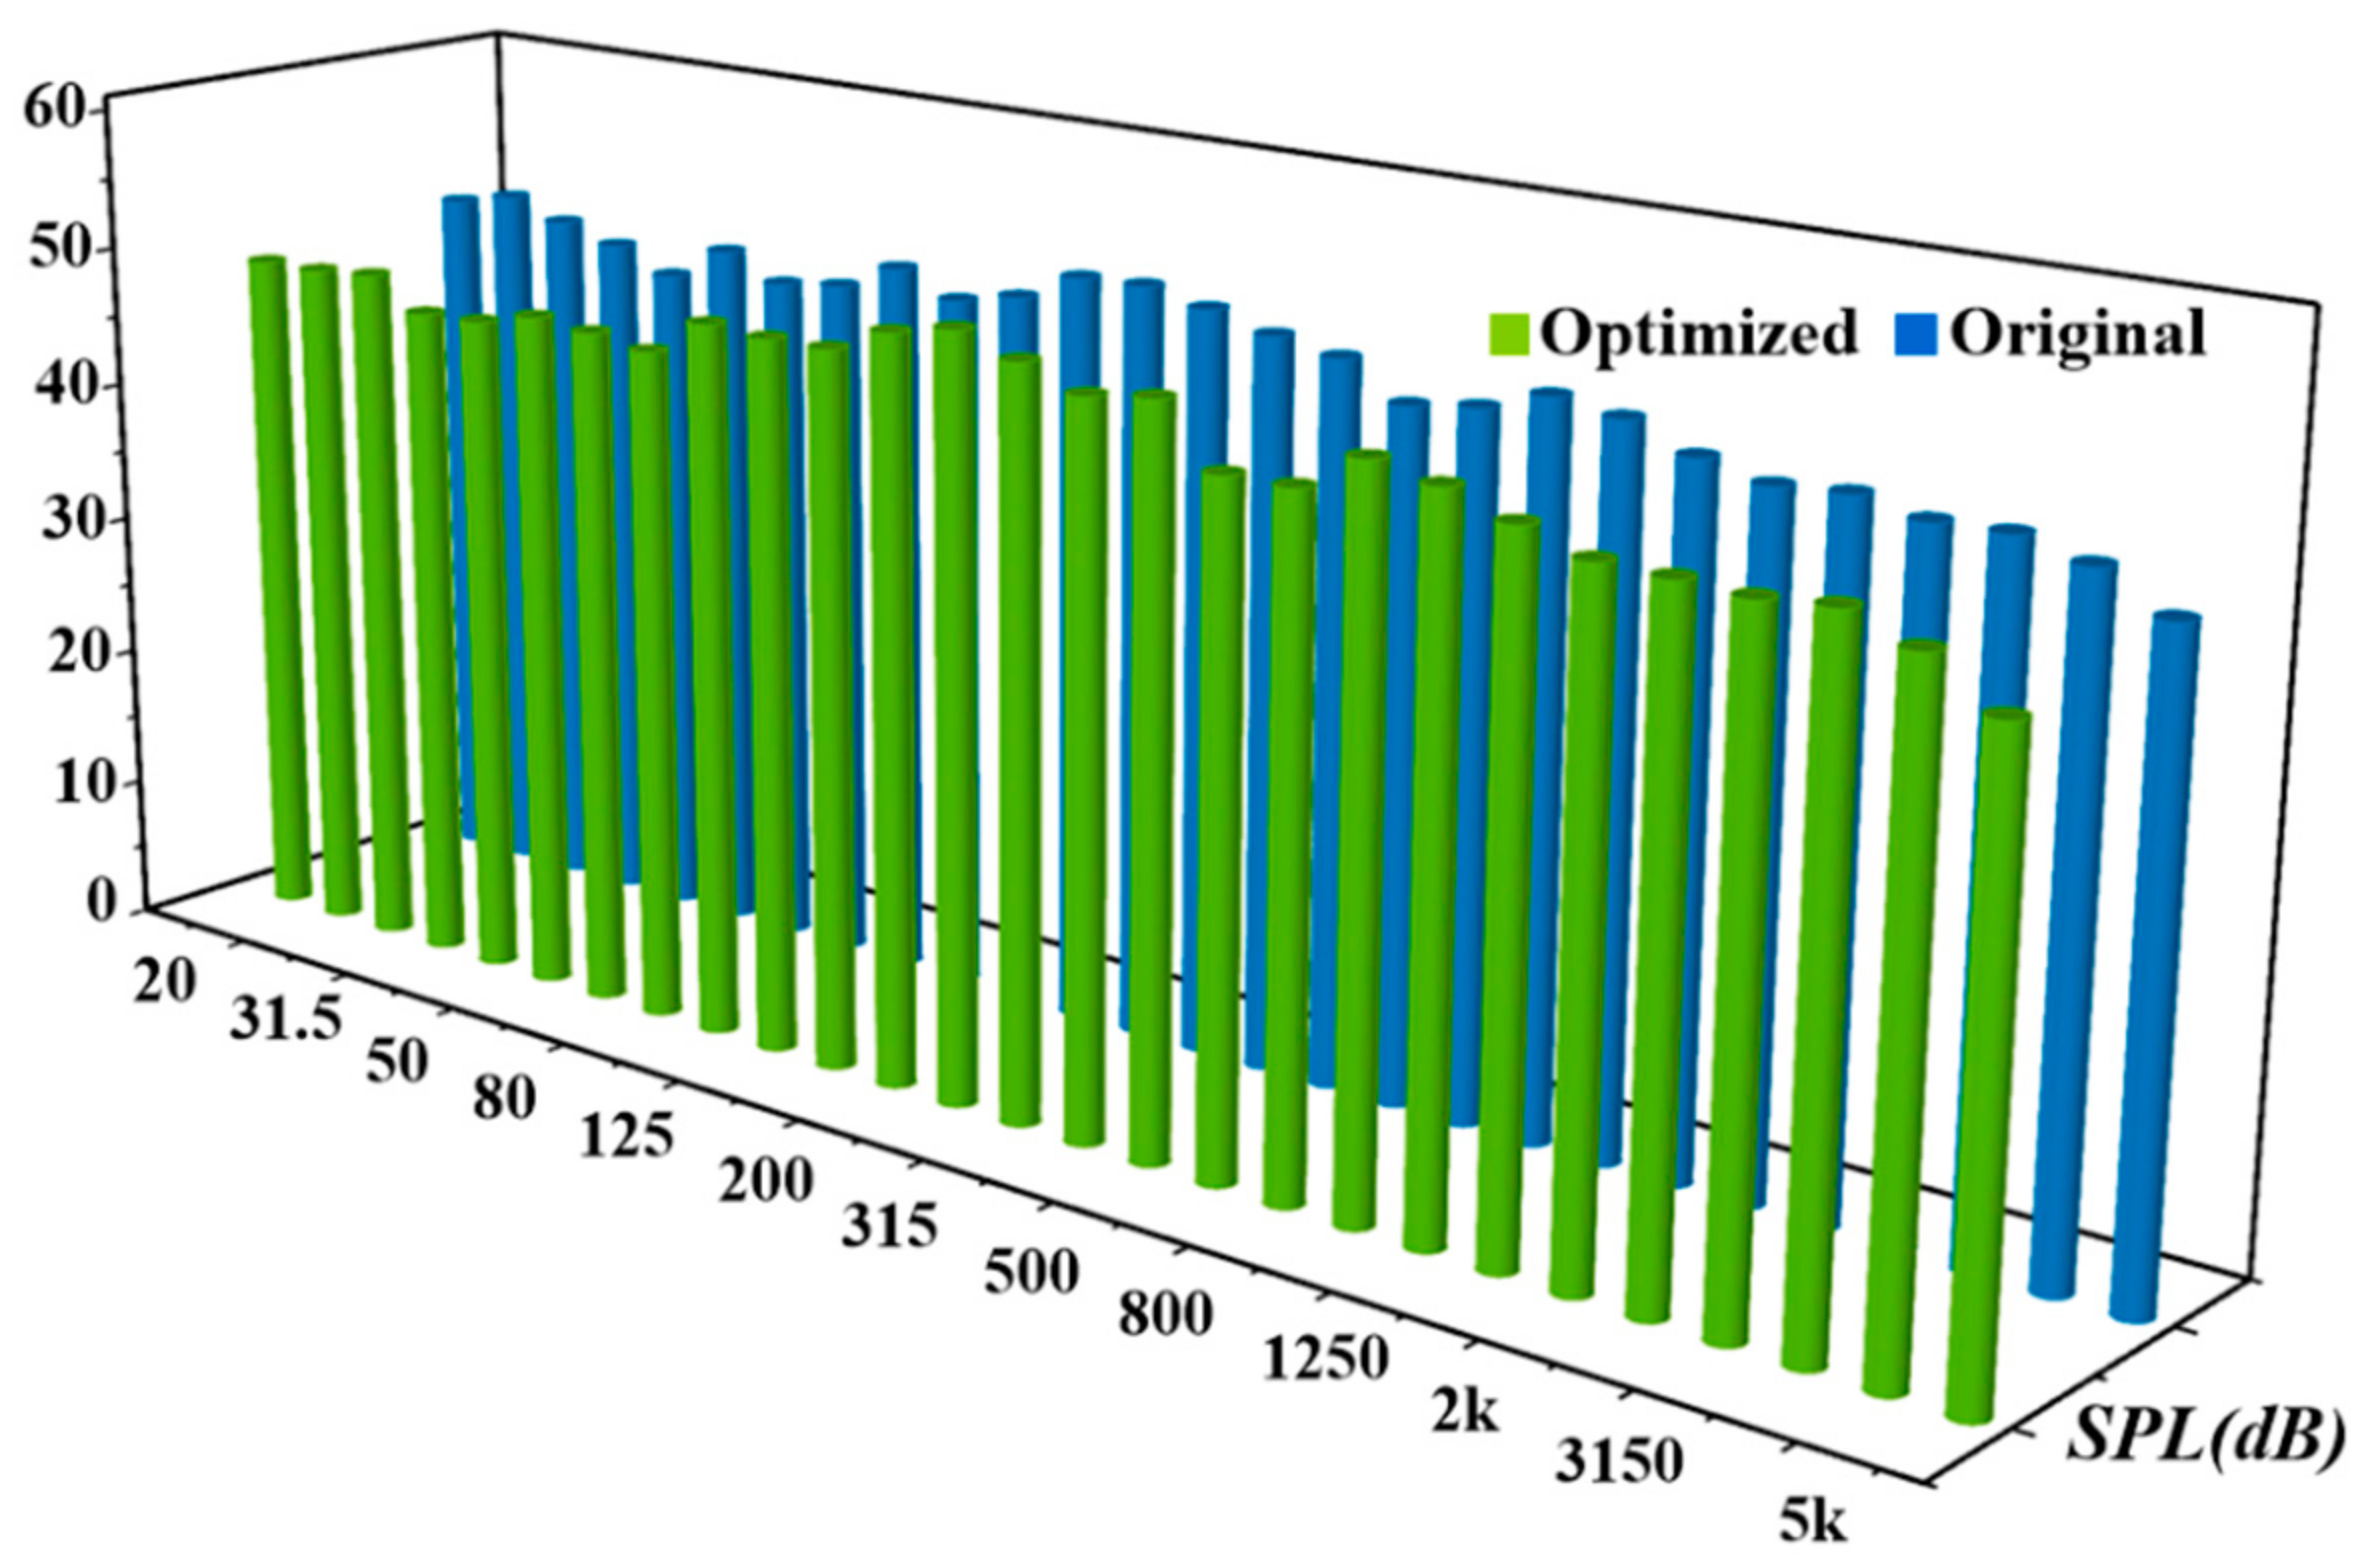
(1) Aerodynamic performance and noise tests on original and optimized fans showed consistent characteristic curves between them. The total pressure and efficiency of the total pressure fan were effectively improved in different working environments. At the design working point, the air volume increases by 1.4 m3/min while total pressure efficiency increases by 3.1% and low-frequency noise is markedly reduced. As the main working component of a building ventilation system, improving the efficiency of the fan can reduce the energy consumption of the entire system and noise reduction can significantly improve user comfort.
(2) The disturbance CST function was applied to the optimal design of multi-blade centrifugal fan blades, and the feasibility of coupling the CST function and multi-objective genetic algorithm in the parametric blade design was validated. The entire proposed optimization design requires relatively few design variables. It provides a way of thinking for the energy-saving design of the ventilation system. The optimization process is simple and effective; the proposed method has certain engineering application value. In the longer term, this method provides a feasible method for the design of fluid machinery blades, such as compressors, pumps or wind turbines.

Author Contributions

Conceptualization, S.Z.; methodology, K.Y.; software, C.W.; validation, W.Z. and S.Z.; writing—original draft preparation, K.Y.; writing—review and editing, K.Z. and W.J.; project administration, S.Z.; funding acquisition, S.Z. All authors have read and agreed to the published version of the manuscript.

Funding

This research is supported by National Science and Technology Major Project (Grant no. 2019ZX06004001) and Zhejiang Provincial Natural Science Foundation Committee, exploration project (Y, LY20E090004). Thanks to ZJUT for providing computing resources and technical support. The authors also appreciate all other scholars for their advice and assistance in improving this article.

Acknowledgments

Thanks are due to ZJUT for providing computing resources and technical support. The authors also appreciate all other scholars for their advice and assistance in improving this article.

Conflicts of Interest

The authors declare no conflict of interest.

Nomenclature

Variables
rpmRotating speed (r/min)
R1Impeller inlet radius (mm)
R2Impeller outlet radius (mm)
B1Impeller width (mm)
B2Volute width (mm)
rSingle-arc blade radius (mm)
β1ABlade inlet angle (deg)
β2ABlade outlet angle (deg)
zNumber of blades
N1/N2The type of leaf shape
zTEThe thickness of the trailing edge of the airfoil (mm)
cThe chord length of the airfoil (mm)
viThe design variable
y(x)The actual response values
y ˜ (x)The response approximation
εThe random error
QvThe flow rate (m3/min)
ηThe total pressure efficiency (%)
βThe angle between A-B and the axis (°)
iThe number of training samples
nThe total number of samples
y ¯ The average of the samples
y ^ The predicted value of the test sample
YwallThe height of the first layer of the boundary layer grid (mm)
VrefThe reference speed (m/s)
LrefThe reference length (m)
νThe fluid kinematic viscosity (m2/s)
y+The dimensionless parameter indicating the boundary point between the viscous bottom and logarithmic layers (mm)
q v The flow rate (m3/s)
Abbreviations
HAVCheating ventilation and air conditioning
CST functionClass Function and a Shape Function
R2The correlation coefficient
NSGA-IINon-Dominated Sorting Genetic Algorithm II
RBFThe Radial Basis Function network
Opt LHDThe optimal Latin hypercube design

References

  1. Leonard, F.; Wang, N.; Timothy, I.; Ronald, M.; Underhill, J.E. Investigation of potential aerosol transmission and infectivity of SARS-CoV-2 through central ventilation systems. Build. Environ. 2021, 197, 107633. [Google Scholar] [CrossRef]
  2. Xu, Y.; Jiang, N.; Pan, F.; Wang, Q.; Gao, Z.; Chen, G. Comparative study on two low-grade heat driven absorption-compression refrigeration cycles based on energy, exergy, economic and environmental (4E) analyses. Energy Convers. Manag. 2017, 133, 535–574. [Google Scholar] [CrossRef]
  3. Xu, Y.; Mao, C.; Huang, Y.; Shen, X.; Xu, X.; Chen, G. Performance evaluation and multi-objective optimization of a low-temperature CO2 heat pump water heater based on artificial neural network and new economic analysis. Energy 2021, 216, 119232. [Google Scholar] [CrossRef]
  4. European Parliament; Council of the European Union. Directive 2009/28/EC of the European Parliament and of the Council of 23 April 2009 on the promotion of the use of energy from renewable sources and amending and subsequently repealing directives 2001/77/EC and 2003/30/EC. Off. J. Eur. Union 2009, 5, 140. [Google Scholar]
  5. Huang, M. VWV energy-saving control of air conditioning water system. Refrig. Technol. 2009, 11, 29–31. [Google Scholar]
  6. Qiu, M.; Hao, Y.; Fan, Z.; Jiang, X. Design of single stage high efficiency fan based on arbitrary polynomial camber line airfoils. Acta Aeronaut. Astronaut. Sin. 2017, 38, 5. [Google Scholar] [CrossRef]
  7. Zhong, M.; Zu, Y.; Huan, X.; Jun, L.; Ting, X. Numerical simulation and optimal design investigation on air duct of floor standing air-conditioner. Adv. Des. Technol. 2011, 563, 308–310. [Google Scholar] [CrossRef]
  8. Iwano, K.; Goto, Y.; Fukao, Y.; Sakai, Y.; Ito, Y.; Nagata, K. Experimental study on the flow structure and sound generation between the blades of multi-blade fan. Trans. JSME 2017, 83, 849. [Google Scholar] [CrossRef] [Green Version]
  9. American Society of Heating, Refrigerating and Air-Conditioning Engineers. Energy Standard for Buildings Except Low-Rise Residential Buildings; ANSI/ASHRAE/IES Standard 90.1-2016; American Society of Heating, Refrigerating and Air-Conditioning Engineers: Atlanta, GA, USA, 2016. [Google Scholar]
  10. Lun, Y.; Ye, X.; Lin, L. Unsteady characteristics of forward multi-wing centrifugal fan at low flow rate. Processes 2019, 7, 691. [Google Scholar] [CrossRef] [Green Version]
  11. Lu, C.; Li, Q.; Huang, S. Noise simulation and evaluation of fan power generation in super tall buildings. J. Vib. Shock 2012, 6, 10–14. [Google Scholar] [CrossRef]
  12. Kawasaki, M.; Hirahara, H.; Kang, D. A study on the process of low-frequency noise generation in a multi-blade centrifugal fan. Int. J. Fluid Mach. Syst. 2020, 13, 2. [Google Scholar] [CrossRef]
  13. Maeda, M.; Hirahara, H.; Nakamura, M. 0313 Experimental analysis of internal 3D flow field of multi-blade centrifugal fan with PIV measurement. Proc. Fluids Eng. Conf. 2012, 2012, 151–152. [Google Scholar] [CrossRef]
  14. Yoon, S.H.; Park, H.W.; Cho, Y.H. Study on the aerodynamic design of multi-blade centrifugal fan for hybrid electric vehicle. In Proceedings of the KFMA Annual Meeting, Hanoi, Vietnam, 5–6 May 2011; Volume 11, pp. 73–74. [Google Scholar]
  15. Zhou, S.; Li, Y. Volute characteristics of centrifugal fan based on dynamic moment correction method. Proc. Inst. Mech. Eng. 2019, 233, 176–185. [Google Scholar] [CrossRef]
  16. Zuo, W.; Xu, Q. Experimental study on the blade profile of forward multi-blade centrifugal fan. Fluid Mach. 2003, 11, 1–2. [Google Scholar] [CrossRef]
  17. Liu, C.; Sheng, C. Design and optimization of bionic janus blade in hydraulic torque converter for drag reduction. J. Biomim. Eng. 2018, 15, 160–172. [Google Scholar] [CrossRef]
  18. Dai, C.; Guo, C.; Ge, Z.; Liu, H.; Dong, L. Study on drag and noise reduction of bionic blade of centrifugal pump and mechanism. J. Bionic Eng. 2021, 18, 428–440. [Google Scholar] [CrossRef]
  19. Liu, Q. Study on Bionic Noise Reduction of Axial Flow Fan Blade; Jilin University: Changchun, China, 2006. [Google Scholar]
  20. Balasubramanian, K.; Turner, M.G.; Siddappaji, K. Novel curvature-based airfoil parameterization for wind turbine application and optimization. In Proceedings of the ASME Turbo Expo 2017: Turbomachinery Technical Conference and Exposition, Charlotte, NC, USA, 26–30 June 2017. [Google Scholar]
  21. Deng, J.; Feng, R. Parameterization method of supercritical airfoil for optimal design. J. Beijing Univ. Aeronaut. Astronaut. 2011, 37, 368–373. [Google Scholar] [CrossRef]
  22. Zuo, L.; Wang, J. Foil design optimization at low reynolds number airfoil. Acta Armamentarii 2009, 30, 1073–1077. [Google Scholar] [CrossRef]
  23. Yang, X.; Jiang, B.; Wang, J.; Huang, Y. Multi-objective optimization of dual-arc blades in a squirrel-cage fan using modified non-dominated sorting genetic algorithm. Proc. Inst. Mech. Eng. Part A J. Power Energy 2020, 234, 1053–1068. [Google Scholar] [CrossRef]
  24. Kulfan, B.M. Recent extensions and applications of the ‘CST’ universal parametric geometry representation method. Aeronaut. J. 2010, 114, 157–176. [Google Scholar] [CrossRef] [Green Version]
  25. Ariyarit, A.; Kanazaki, M. Multi-segment Class-Shape-Transformation (CST) for global design exploration. In Proceedings of the 10th France-Japan/8th Europe-Asia Congress on Mecatronics, Tokyo, Japan, 27–29 November 2014; pp. 64–69. [Google Scholar] [CrossRef]
  26. Zapotecas, M.; Coello, C. Combining surrogate models and local search for dealing with expensive multi-objective optimization problems. In Proceedings of the 2013 IEEE Congress on Evolutionary Computation, Cancun, Mexico, 20–23 June 2013; pp. 2572–2579. [Google Scholar]
  27. Seshagiri, S.; Khalil, H.K. Output feedback control of nonlinear systems using RBF neural networks. IEEE Trans. Neural Netw. 2000, 11, 69–79. [Google Scholar] [CrossRef] [Green Version]
  28. Li, Y.; Qiang, S.; Zhuang, X.; Kaynak, O. Robust and adaptive backstepping control for nonlinear systems using RBF neural networks. IEEE Trans. Neural Netw. 2004, 15, 693–701. [Google Scholar] [CrossRef] [PubMed]
  29. Yang, M.; Chen, Y.; Lin, Y. Multiobjective optimization using nondominated sorting genetic algorithm-II for allocation of energy conservation and renewable energy facilities in a campus. Energy Build. 2016, 122, 120–130. [Google Scholar] [CrossRef]
  30. Performance Test of Industrial Ventilator with Standardized Air Duct; GB/T 1236-2017; China Standard Press: Beijing, China, 2017.
  31. Wang, F. Computational Fluid Dynamics Analysis; Tsinghua University Press: Beijing, China, 2004. [Google Scholar]
  32. Schram, C.; Hirschberg, A. Application of vortex sound theory to vortex-pairing noise: Sensitivity to errors in flow data. J. Sound Vib. 2003, 266, 1079–1098. [Google Scholar] [CrossRef]
  33. General Administration of Quality Supervision, Inspection and Quarantine, National Standardization Management Committee. Fan and Roots Blower Noise Measurement Method; GB/T 2888-2008; China Standard Press: Beijing, China, 2008. [Google Scholar]
Figure 1. Structure of multi-blade centrifugal fan (1. Volute 2. Lock nut 3. Inlet collector 4. Impeller 5. Motor).
Applsci 11 07784 g001
Figure 2. Impeller structure.
Applsci 11 07784 g002
Figure 3. Optimization flow chart.
Applsci 11 07784 g003
Figure 4. Basic airfoil under different N1 and N2 values.
Applsci 11 07784 g004
Figure 5. Schematic diagram of CST function superimposed blade forming.
Applsci 11 07784 g005
Figure 6. Parameterized coordinate axis of Q35 fan blade airfoil.
Applsci 11 07784 g006
Figure 7. CST parameterization fitting of Q35 fan blade airfoil.
Applsci 11 07784 g007
Figure 8. Opt LHD test design.
Applsci 11 07784 g008
Figure 9. RBF neural network.
Applsci 11 07784 g009
Figure 10. Aerodynamic performance test of fan. (a) Sketch of experimental system (b) Experimental facility (c) Original fan.
Applsci 11 07784 g010
Figure 11. Calculation domains and grid model (a) Calculation domains (b) Fan grid (c) Mesh in blade passage.
Applsci 11 07784 g011
Figure 12. Grid independence.
Applsci 11 07784 g012
Figure 13. Comparison of experimental and numerical simulation performance curves.
Applsci 11 07784 g013
Figure 14. Pareto front.
Applsci 11 07784 g014
Figure 15. Original and optimized blade profiles.
Applsci 11 07784 g015
Figure 16. Original and optimized impeller (a) Original (b) Optimized.
Applsci 11 07784 g016
Figure 17. Fan performance curves original and optimized.
Applsci 11 07784 g017
Figure 18. Vorticity comparison in the range of 220°~280° (a) Original (b) Optimized.
Applsci 11 07784 g018
Figure 19. Speed expansion diagram of impeller outlet (a) Original (b) Optimized.
Applsci 11 07784 g019
Figure 20. Streamline diagram of volute exit area (a) Original (b) Optimized.
Applsci 11 07784 g020
Figure 21. Fan noise test system (a) Photo of fan noise field test (b) Data analysis system.
Applsci 11 07784 g021
Figure 22. Noise monitoring points.
Applsci 11 07784 g022
Figure 23. Spectrograms of impeller.
Applsci 11 07784 g023
Figure 24. Comparison of original and optimized fan noise.
Applsci 11 07784 g024
Table 1. The profile data of impeller.
ParameterSize
Impeller inlet radius, R1 (mm)115
Impeller outlet radius, R2 (mm)140
Impeller width, B1 (mm)100
Volute width, B2 (mm)135
Single-arc blade radius, r (mm)15
Blade inlet angle, β1A (deg)67
Blade outlet angle, β2A (deg)163
Number of blades, z60
Table 2. CST parameterized fitting parameters of Q35 fan blade airfoil.
v 0 v 1 v 2 v 3
0.49432.8541.56940.6450
Table 3. Value range of design variables v i .
viminmax
v10.30.7
v224
v313
v40.40.8
Table 4. R2 terms.
Table 4. R2 terms.
Qvη
R20.9620.977
Table 5. Blade structure parameters original and optimized.
v 0 v 1 v 2 v 3 β 1 A β 2 A η B /% Q v /(m3/min)
Original0.49432.8541.56940.64506716340.016.8
Optimized0.61723.8782.1750.487562.3164.743.118.2
Publisher’s Note: MDPI stays neutral with regard to jurisdictional claims in published maps and institutional affiliations.

