
Evaluation of Natural Airfield Pavements Condition Based on the Airfield Pavement Condition Index (APCI)


Abstract
:1. Introduction
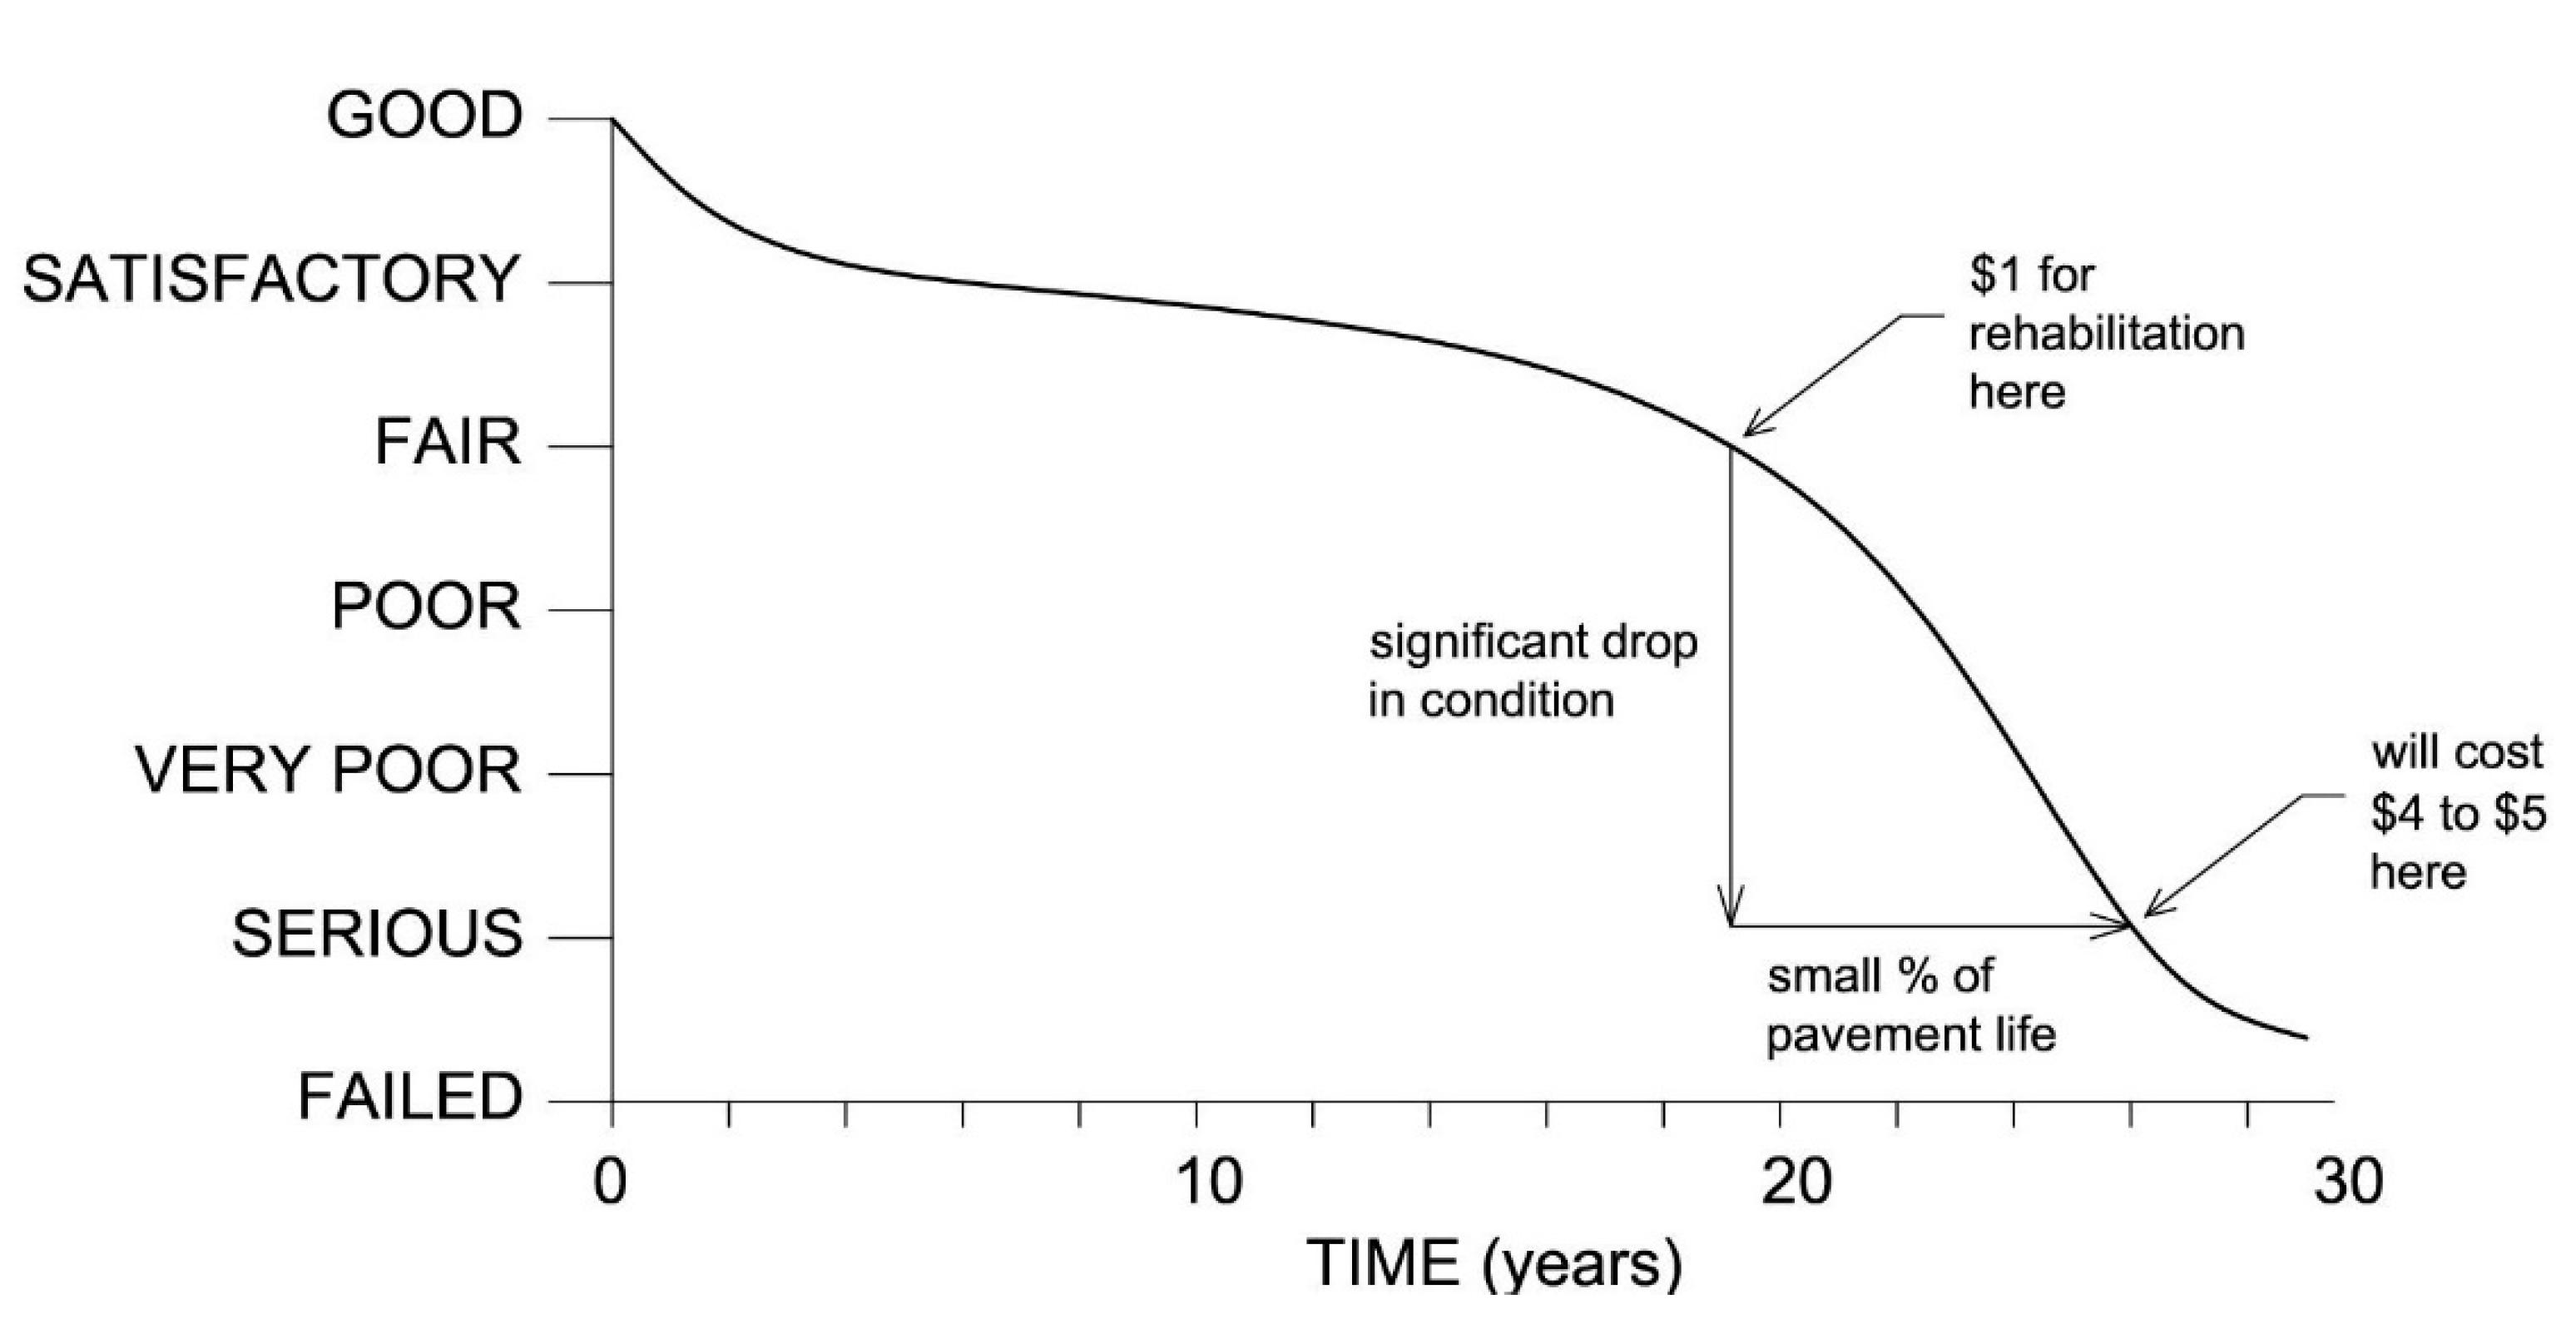
1.1. Genesis of APCI Idea
1.2. Pavements Condition Indicators
1.3. Normative Documents
- Annex to the Decision of the Executive Director of EASA No. 2017/021/R of December 8, 2017 implementing the fourth edition of Certification Specifications (CS) and Guideline Materials (GM) for Airport Design CS-ADR-DSN [28], 2017.
- ICAO Annex 14 to the Convention on International Civil Aviation, Airports Volume I—Aerodrome Design and Operation [29], 6th edition, 2013.
- Doc. 9157 ICAO AN/901 Aerodrome Design Manual Part 1—Runways [30], ICAO Third Edition, 2006.
- Doc. 9137 ICAO AN/898 Airport Service Manual Part 2—Pavement Surface Conditions [31], ICAO, Fourth Edition, 2002.
- Advisory Circular no: 150/5320-12C, Measurement, Construction, and Maintenance of Skid Resistant Airport Pavement Surfaces, US Department of Transportation, Federal Aviation Administration [32], (FAA) 1997 as amended.
- Guidelines No. 2 of the President of the Civil Aviation Authority of 25 January 2016 on the methods of assessing, measuring, and reporting the condition of the runway surface [33], 2016.
- ASTM D5340-12 Standard Test Method for Airport Pavement Condition Index Surveys [14], 2018.
- ASTM D6433-18 Standard Practice for Roads and Parking Lots Pavement Condition Index Surveys [15], 2018.
1.4. The Role of Natural Airfield Pavements
- emergency runway shoulders (shoulders), which protect the aircraft against damage in the event of an emergency runway exit. In case of a possible aircraft exit from the runway, natural surfaces should be prepared or constructed in order to destroy neither aircraft nor underground infrastructure, and guarantee quick restoration of the airport’s operational capacity by efficient removal of the aircraft by airport services [28,29];
- unpaved runways at smaller aerodromes or an emergency runway (AFE at military airfields) that are part of the runway intended for the take-off approach and take-off run, and for a touchdown and landing runway.
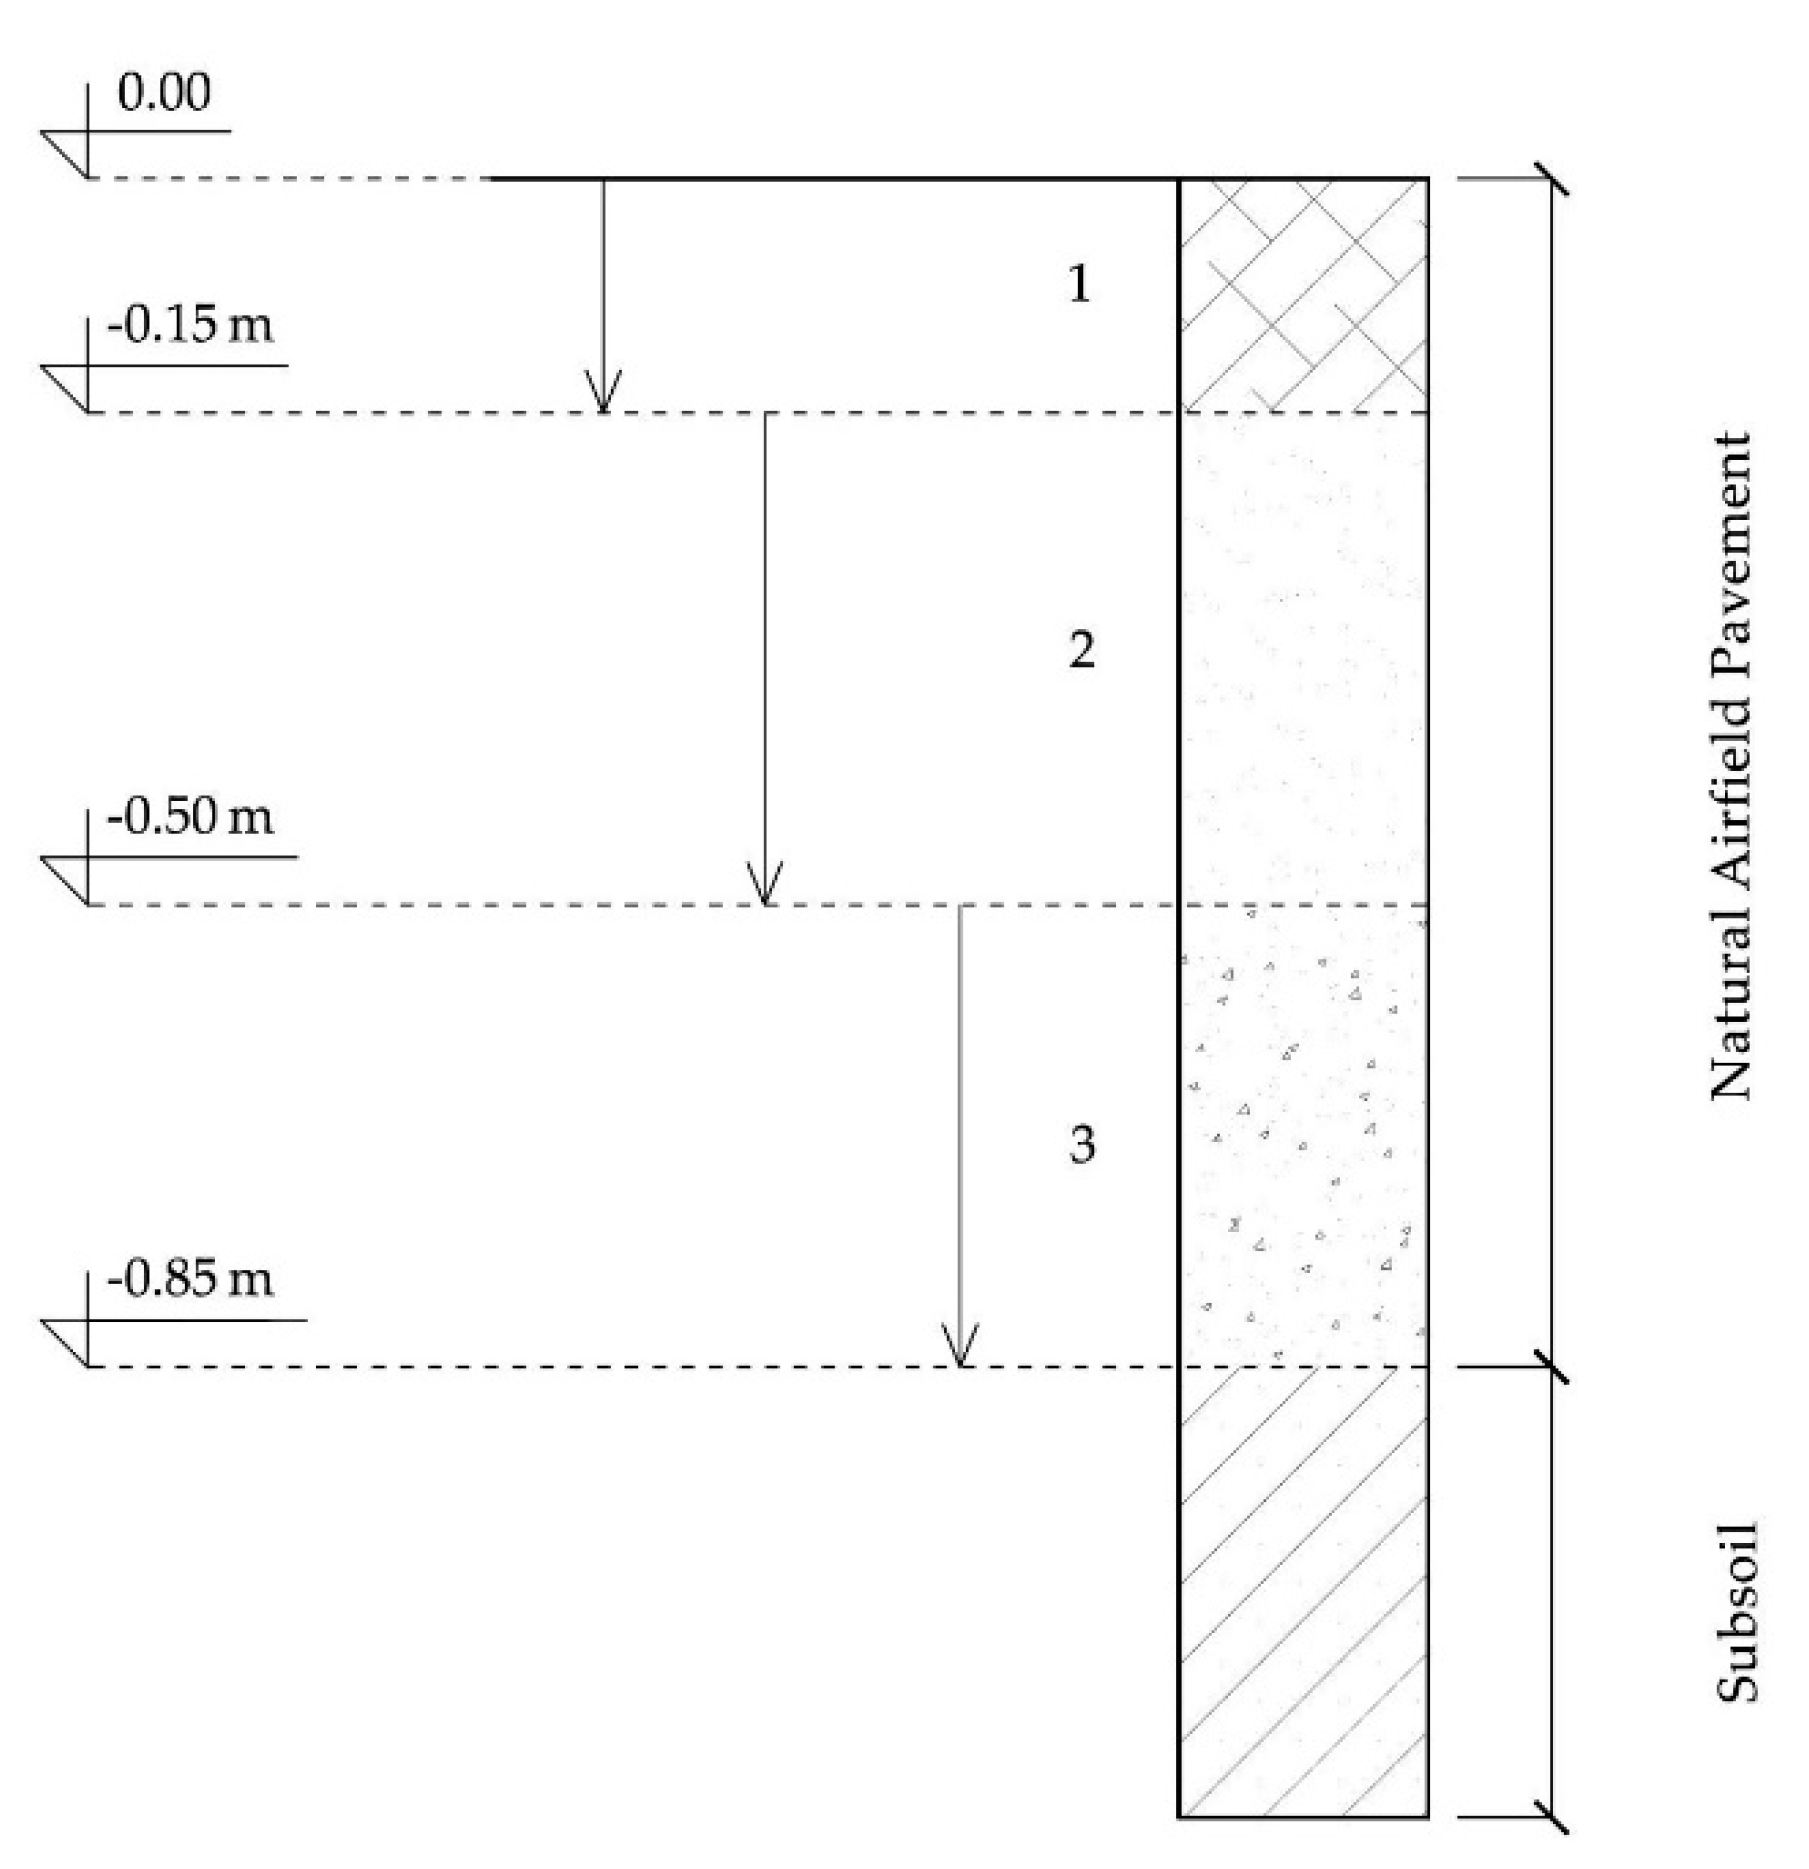
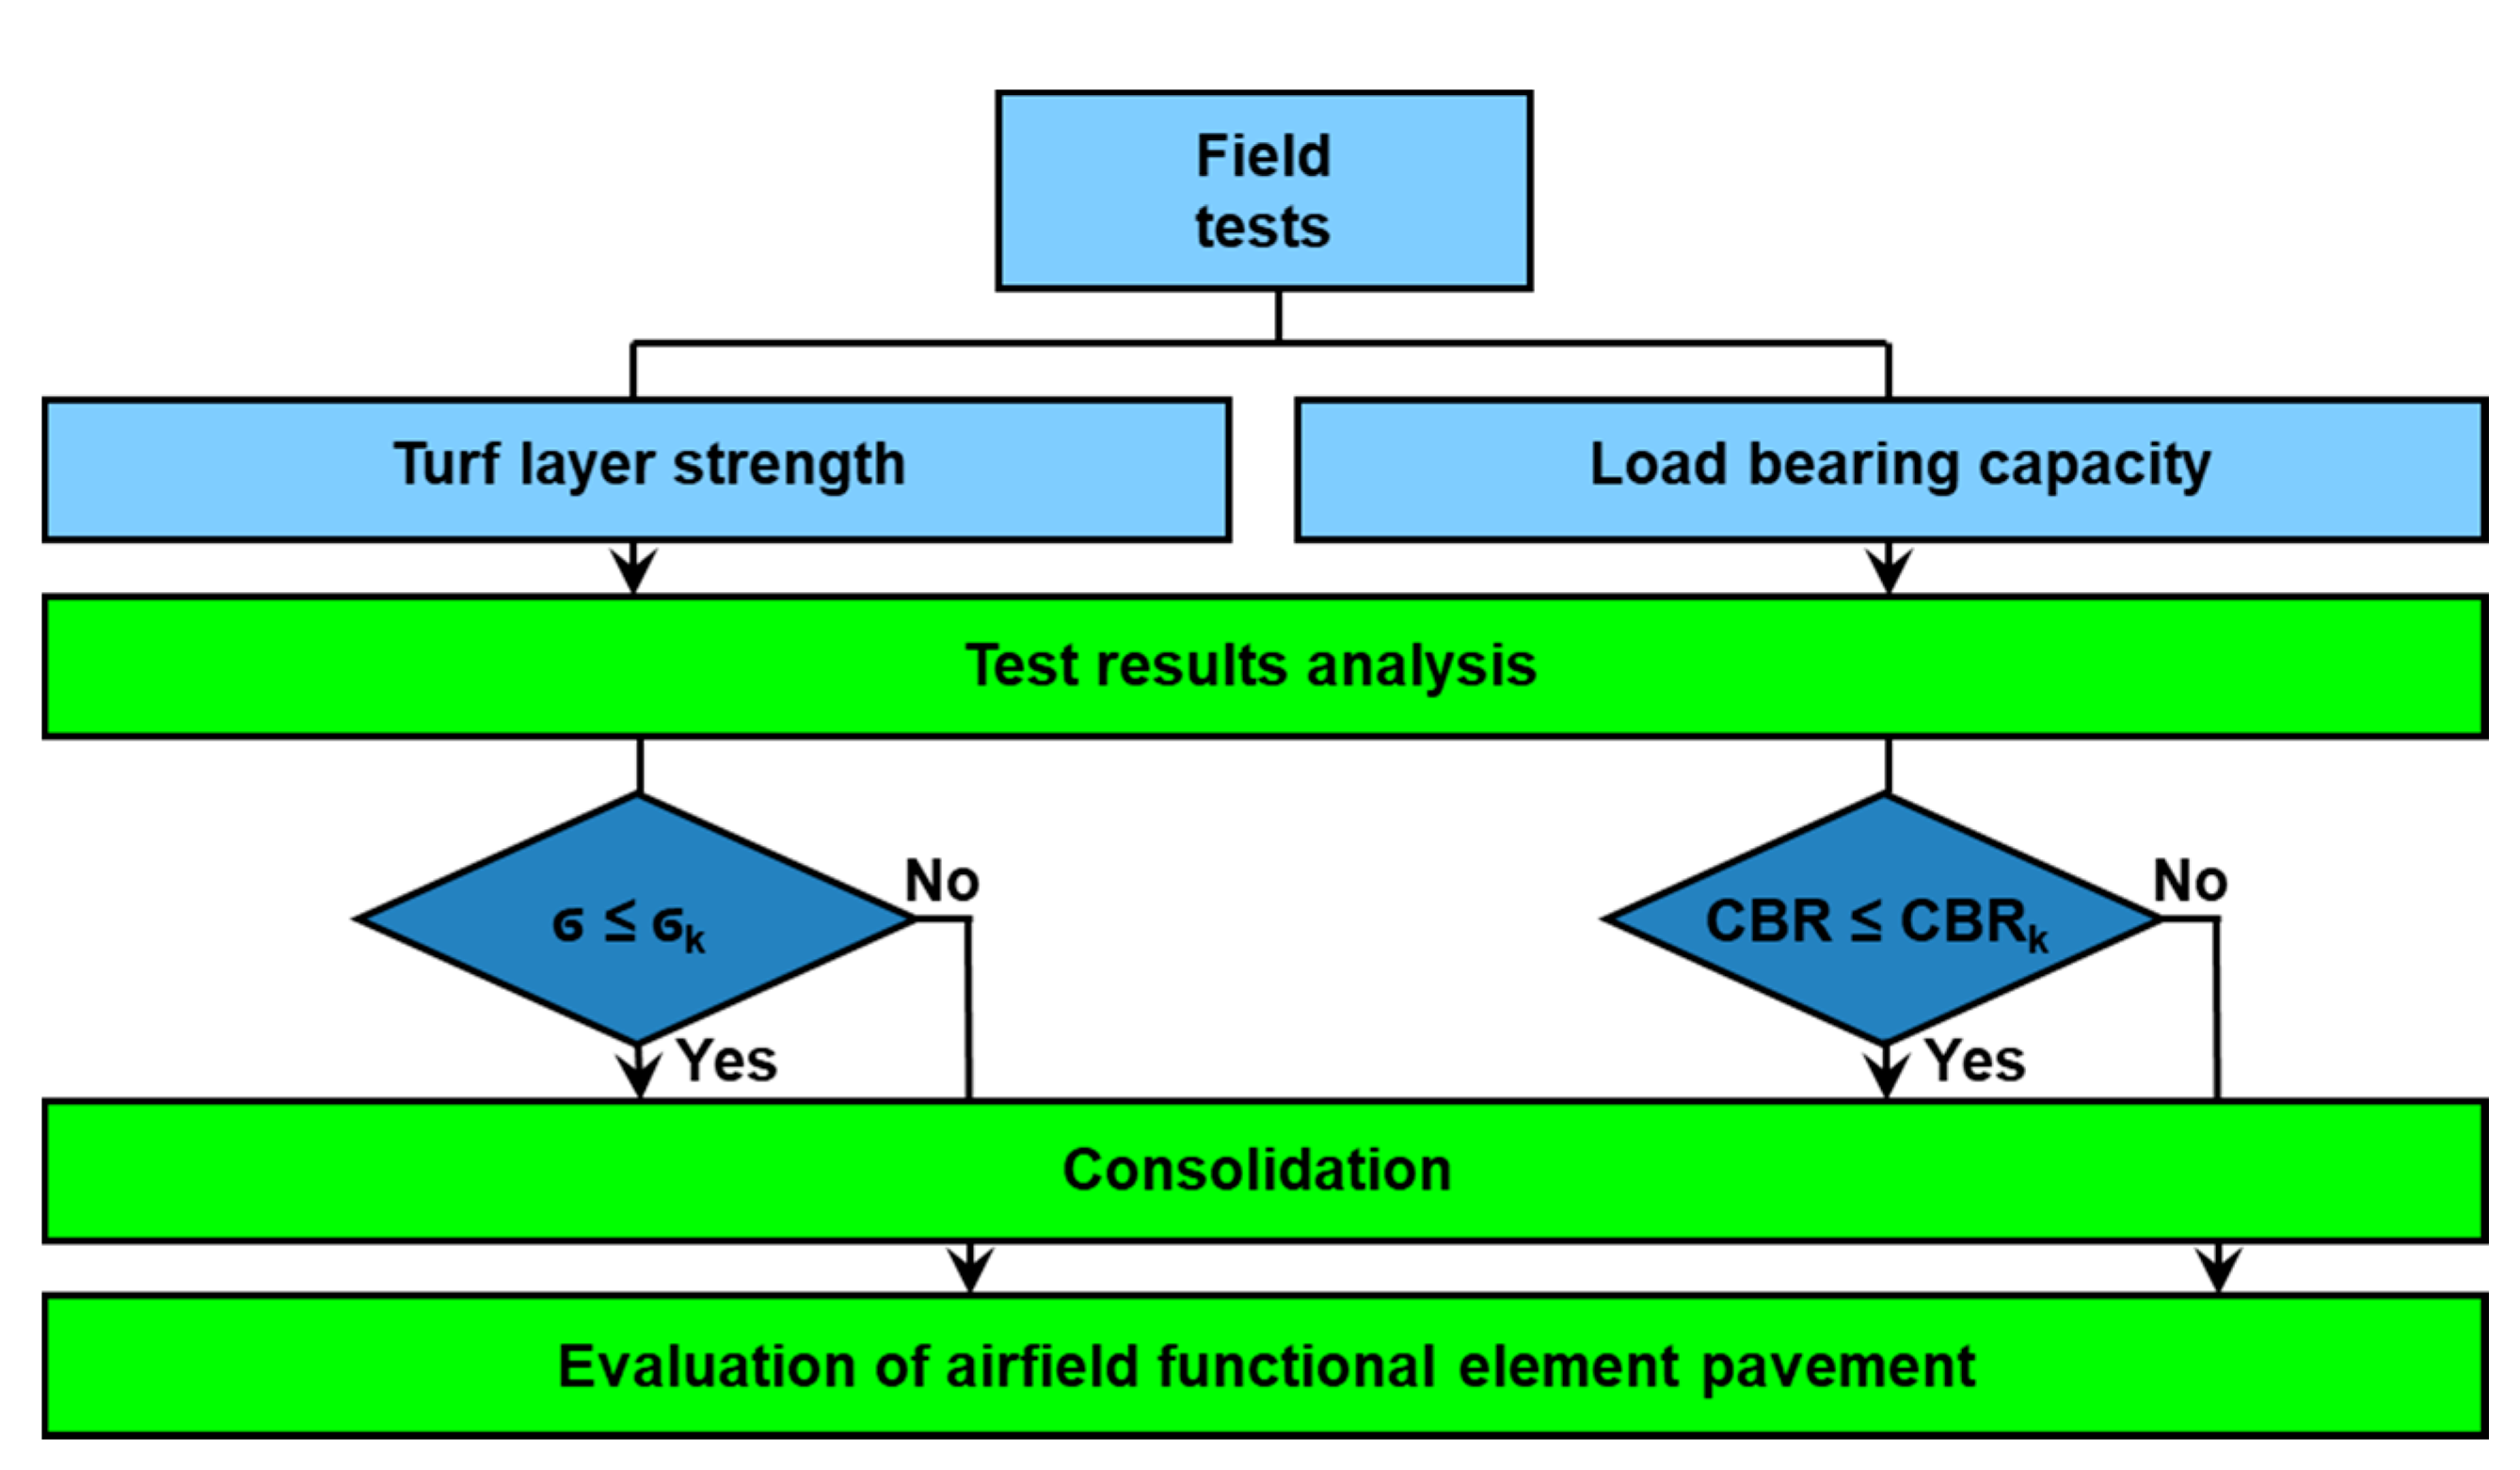
- strength of the turf layer to a depth of 0.3 m below the ground level in accordance with the requirements of the NO-17-A503: 2017 standard [34];
- testing the load bearing capacity of the natural surface to a depth of 0.85 m below the ground level in accordance with the requirements of the NO-17-A503: 2017 standard [34].
2. Materials and Methods
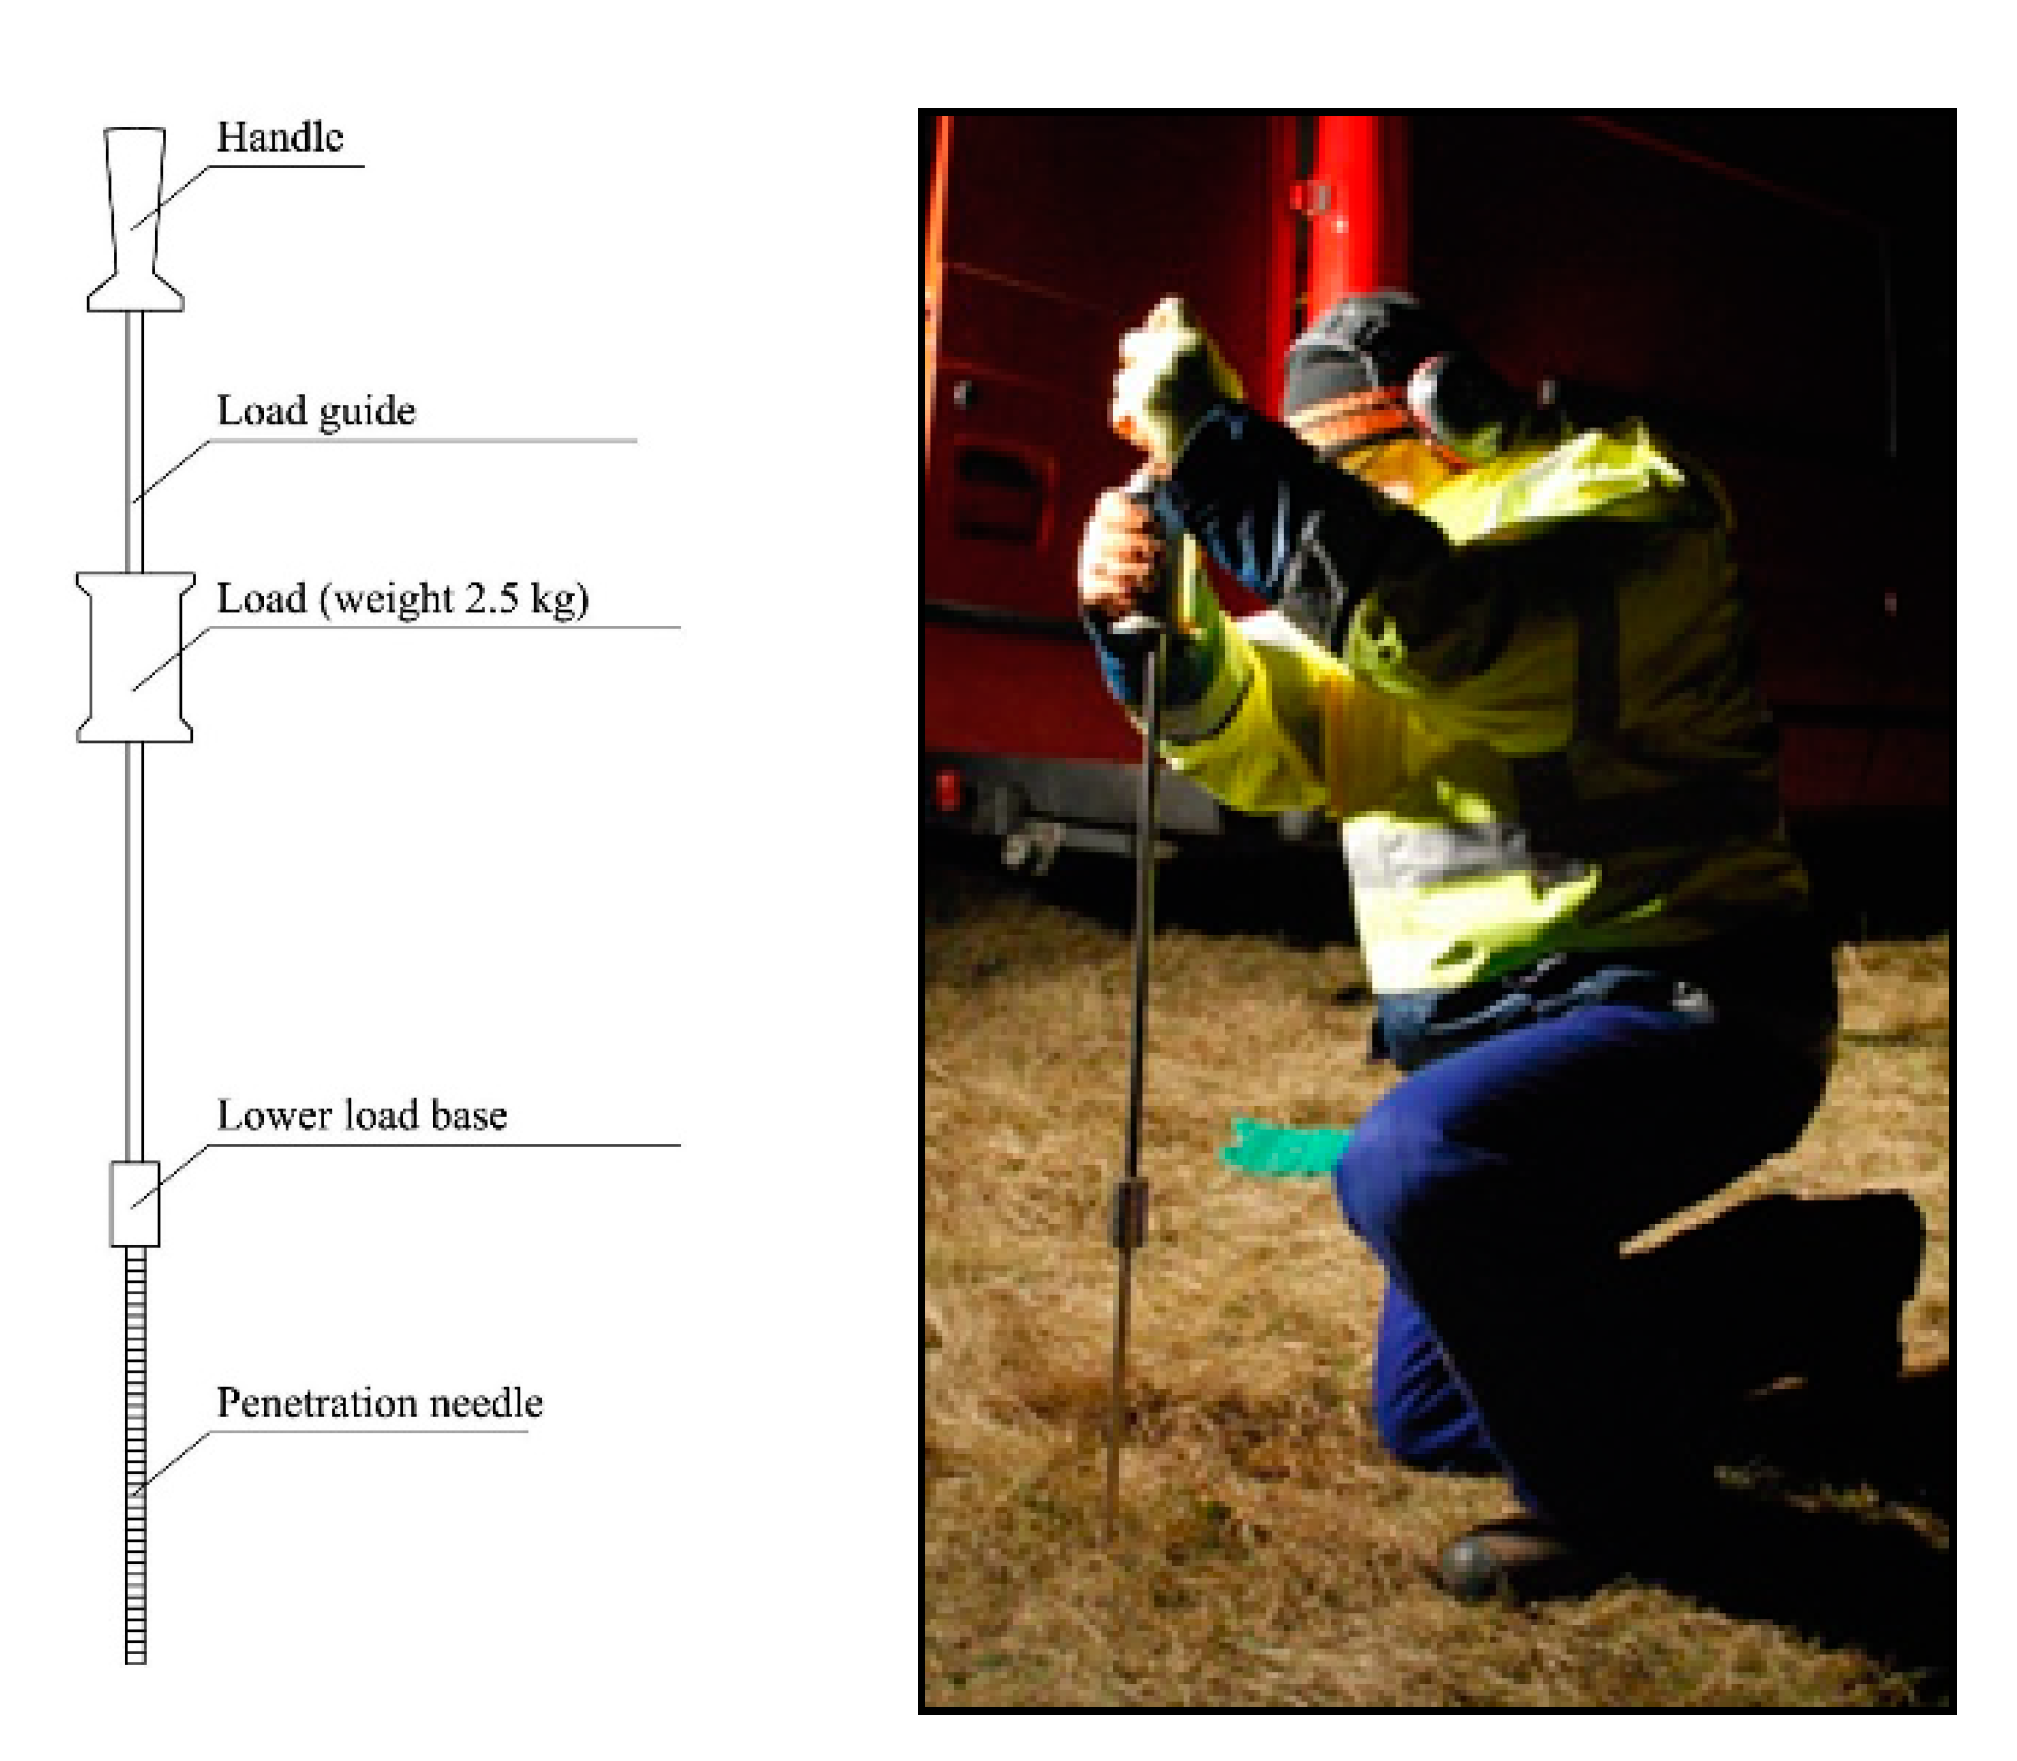
2.1. Inspection of Natural Pavements
- growing and sowing mixtures of grasses; three groups of grasses are sown: tall grasses—overgrowth grasses, low grasses —underslung, legumes;
- mechanical processing of turf (harrowing, disking, rolling), aimed at brushing out the old turf, loosening the turf, removing weeds and leveling molehills, deep application of the fertilizers;
- the use of mineral and organic fertilizers;
- mowing the grass.
- plant content (shoot density), which results from plant density, viable shoots per unit area seen from above;
- the thickness of the felt layer and its construction;
- roots density and their thickness;
- turf uniformity;
- bond strength of the turf.
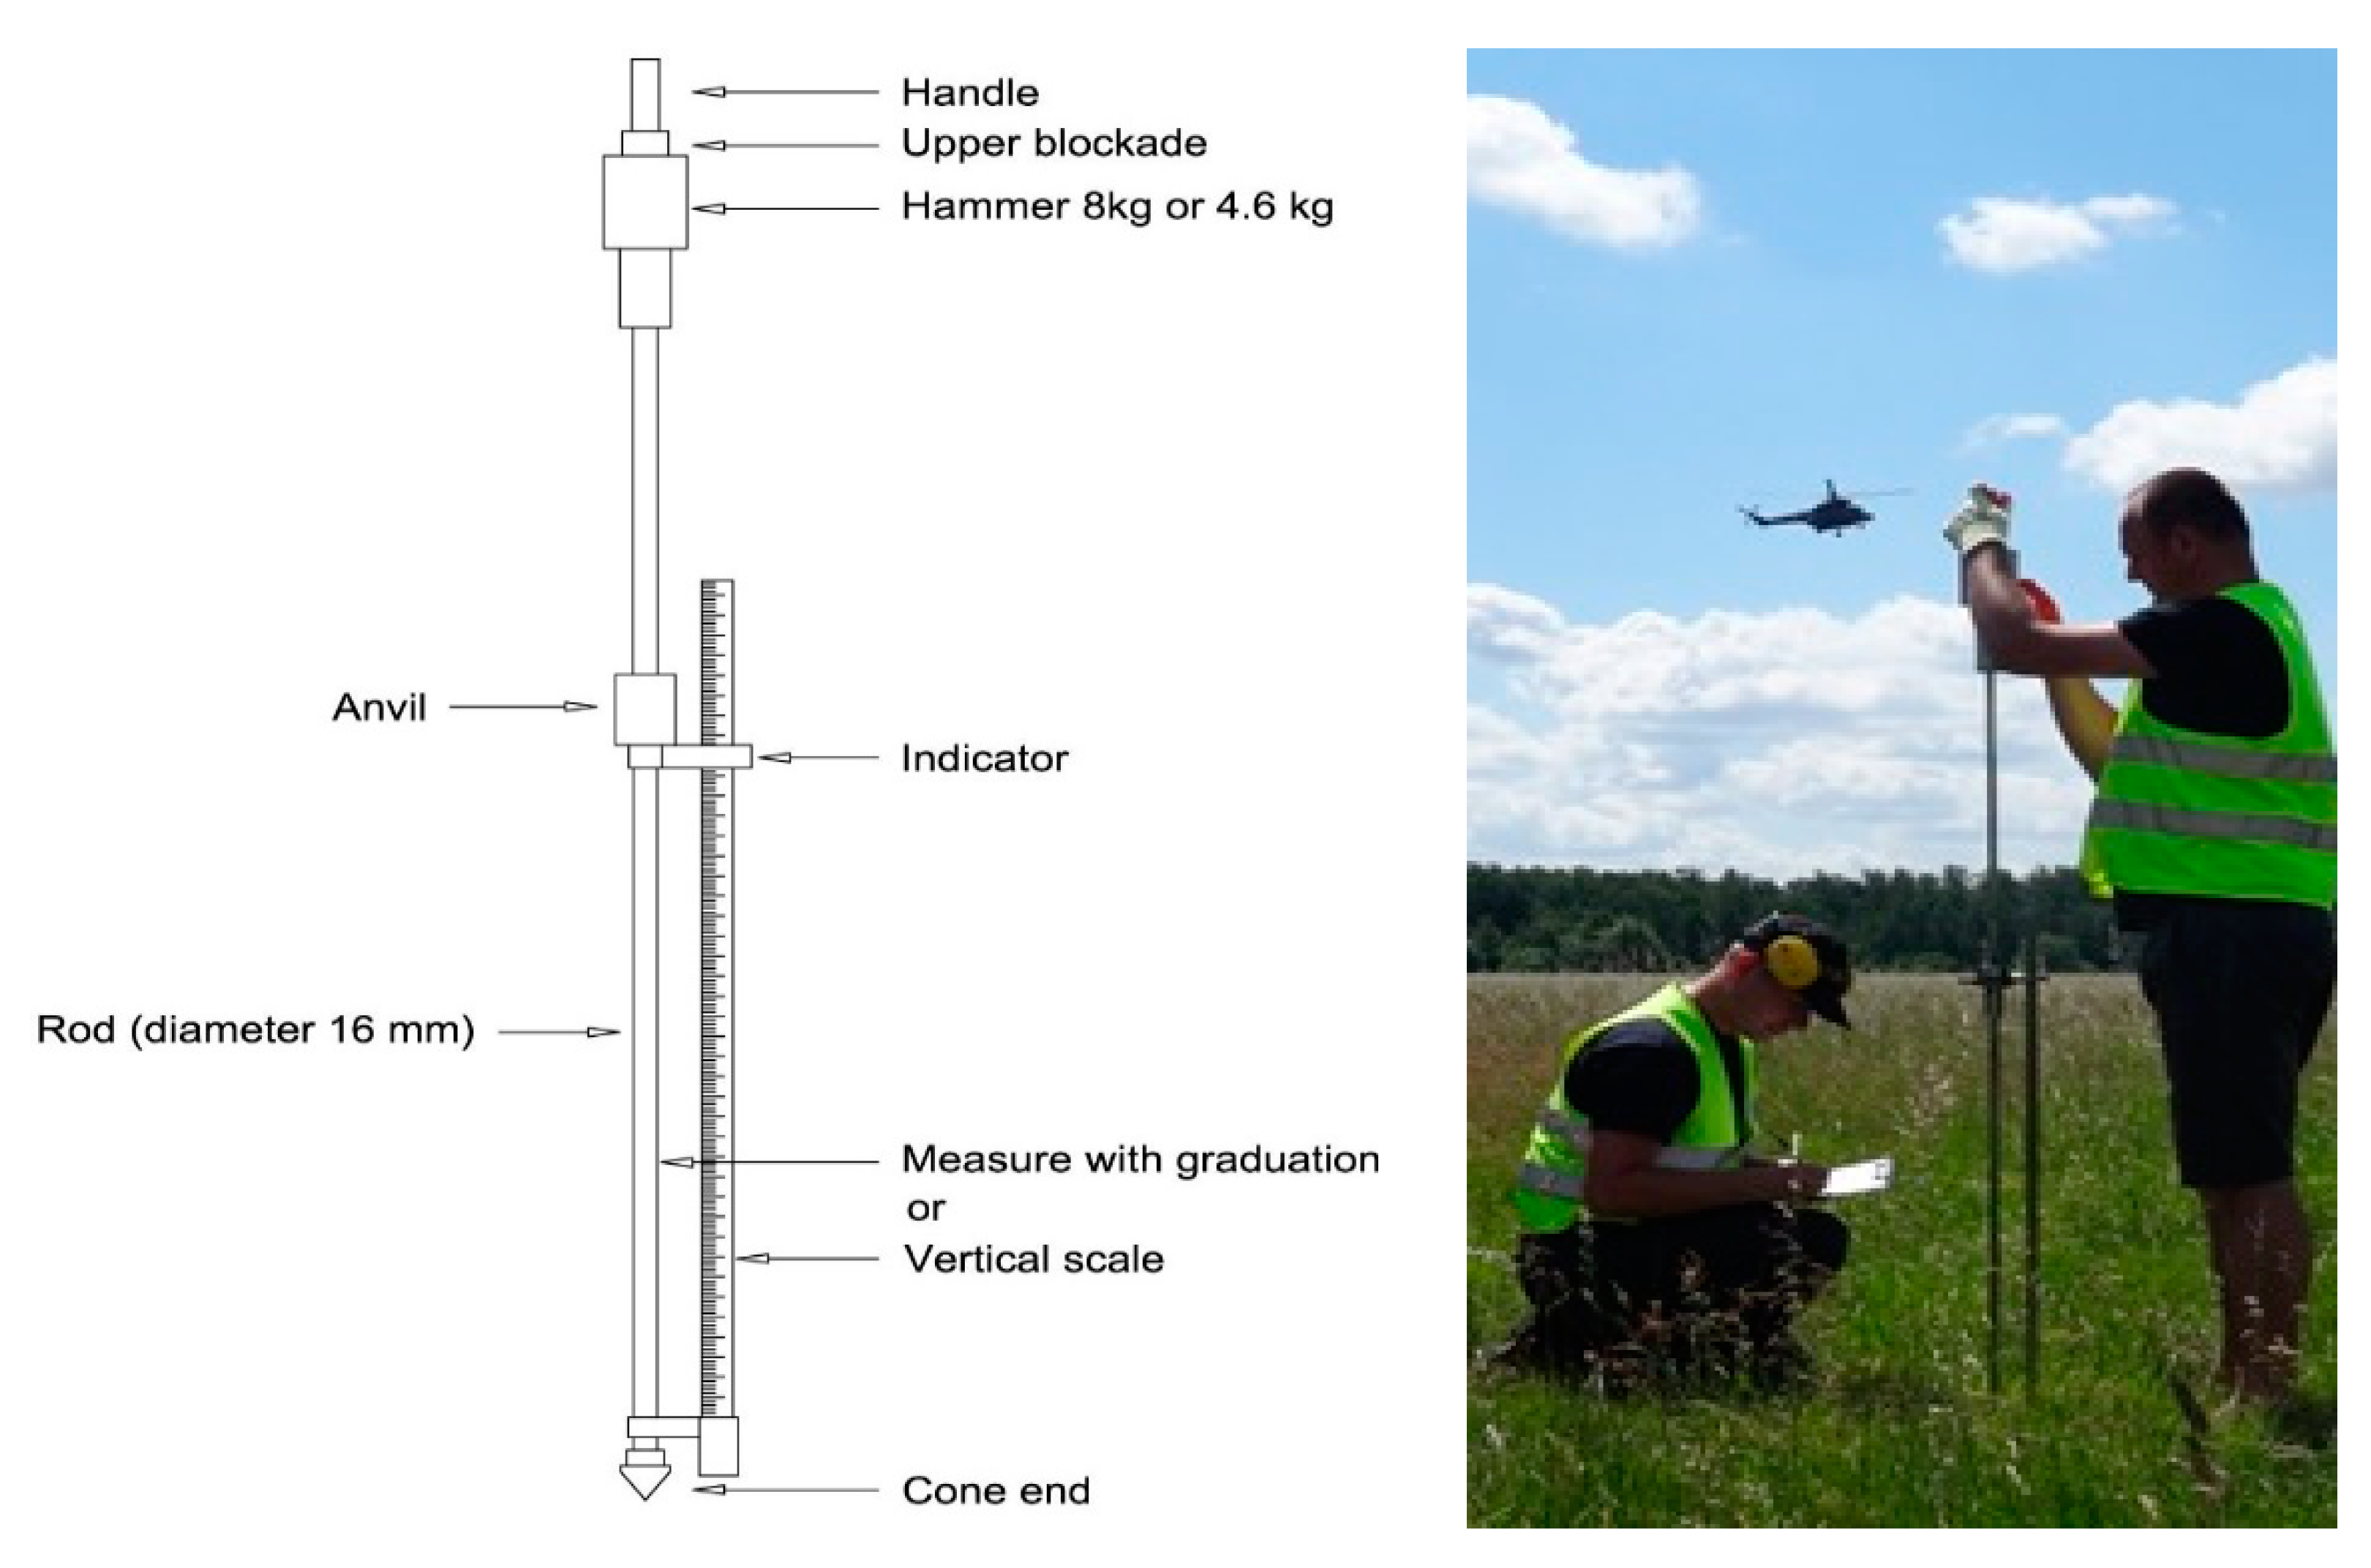
2.2. The Load Bearing Capacity of Natural Airfield Pavements
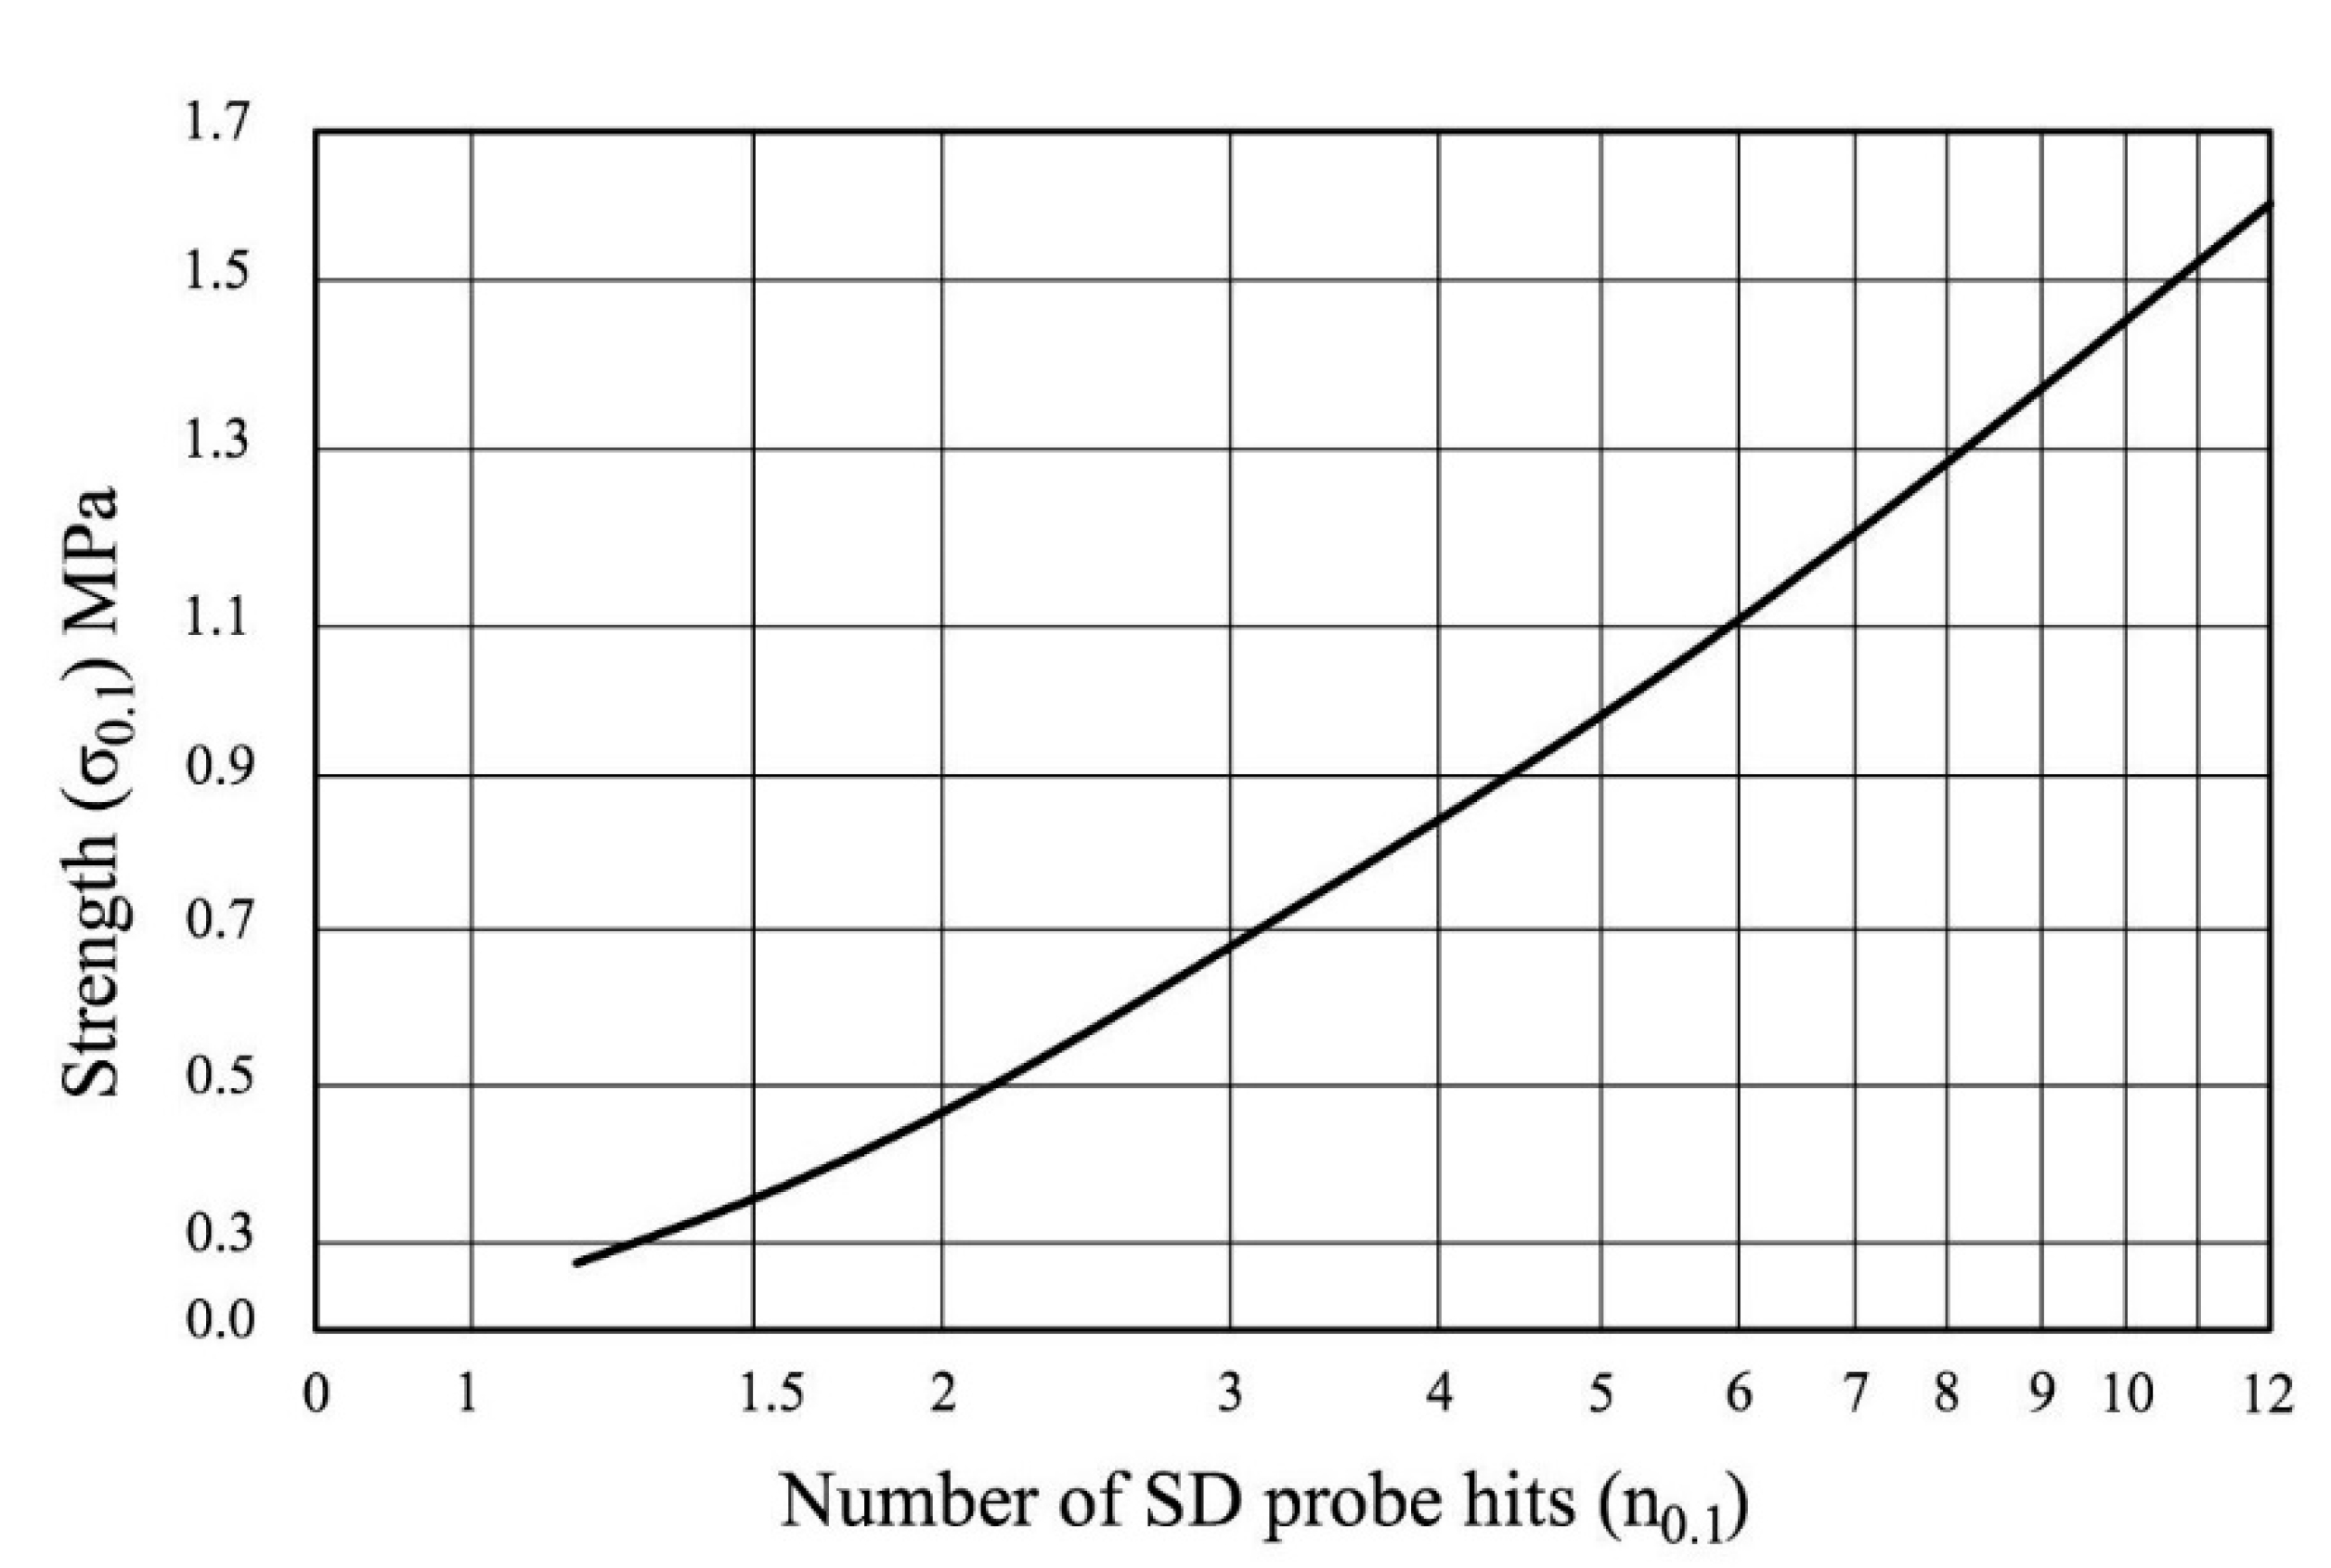
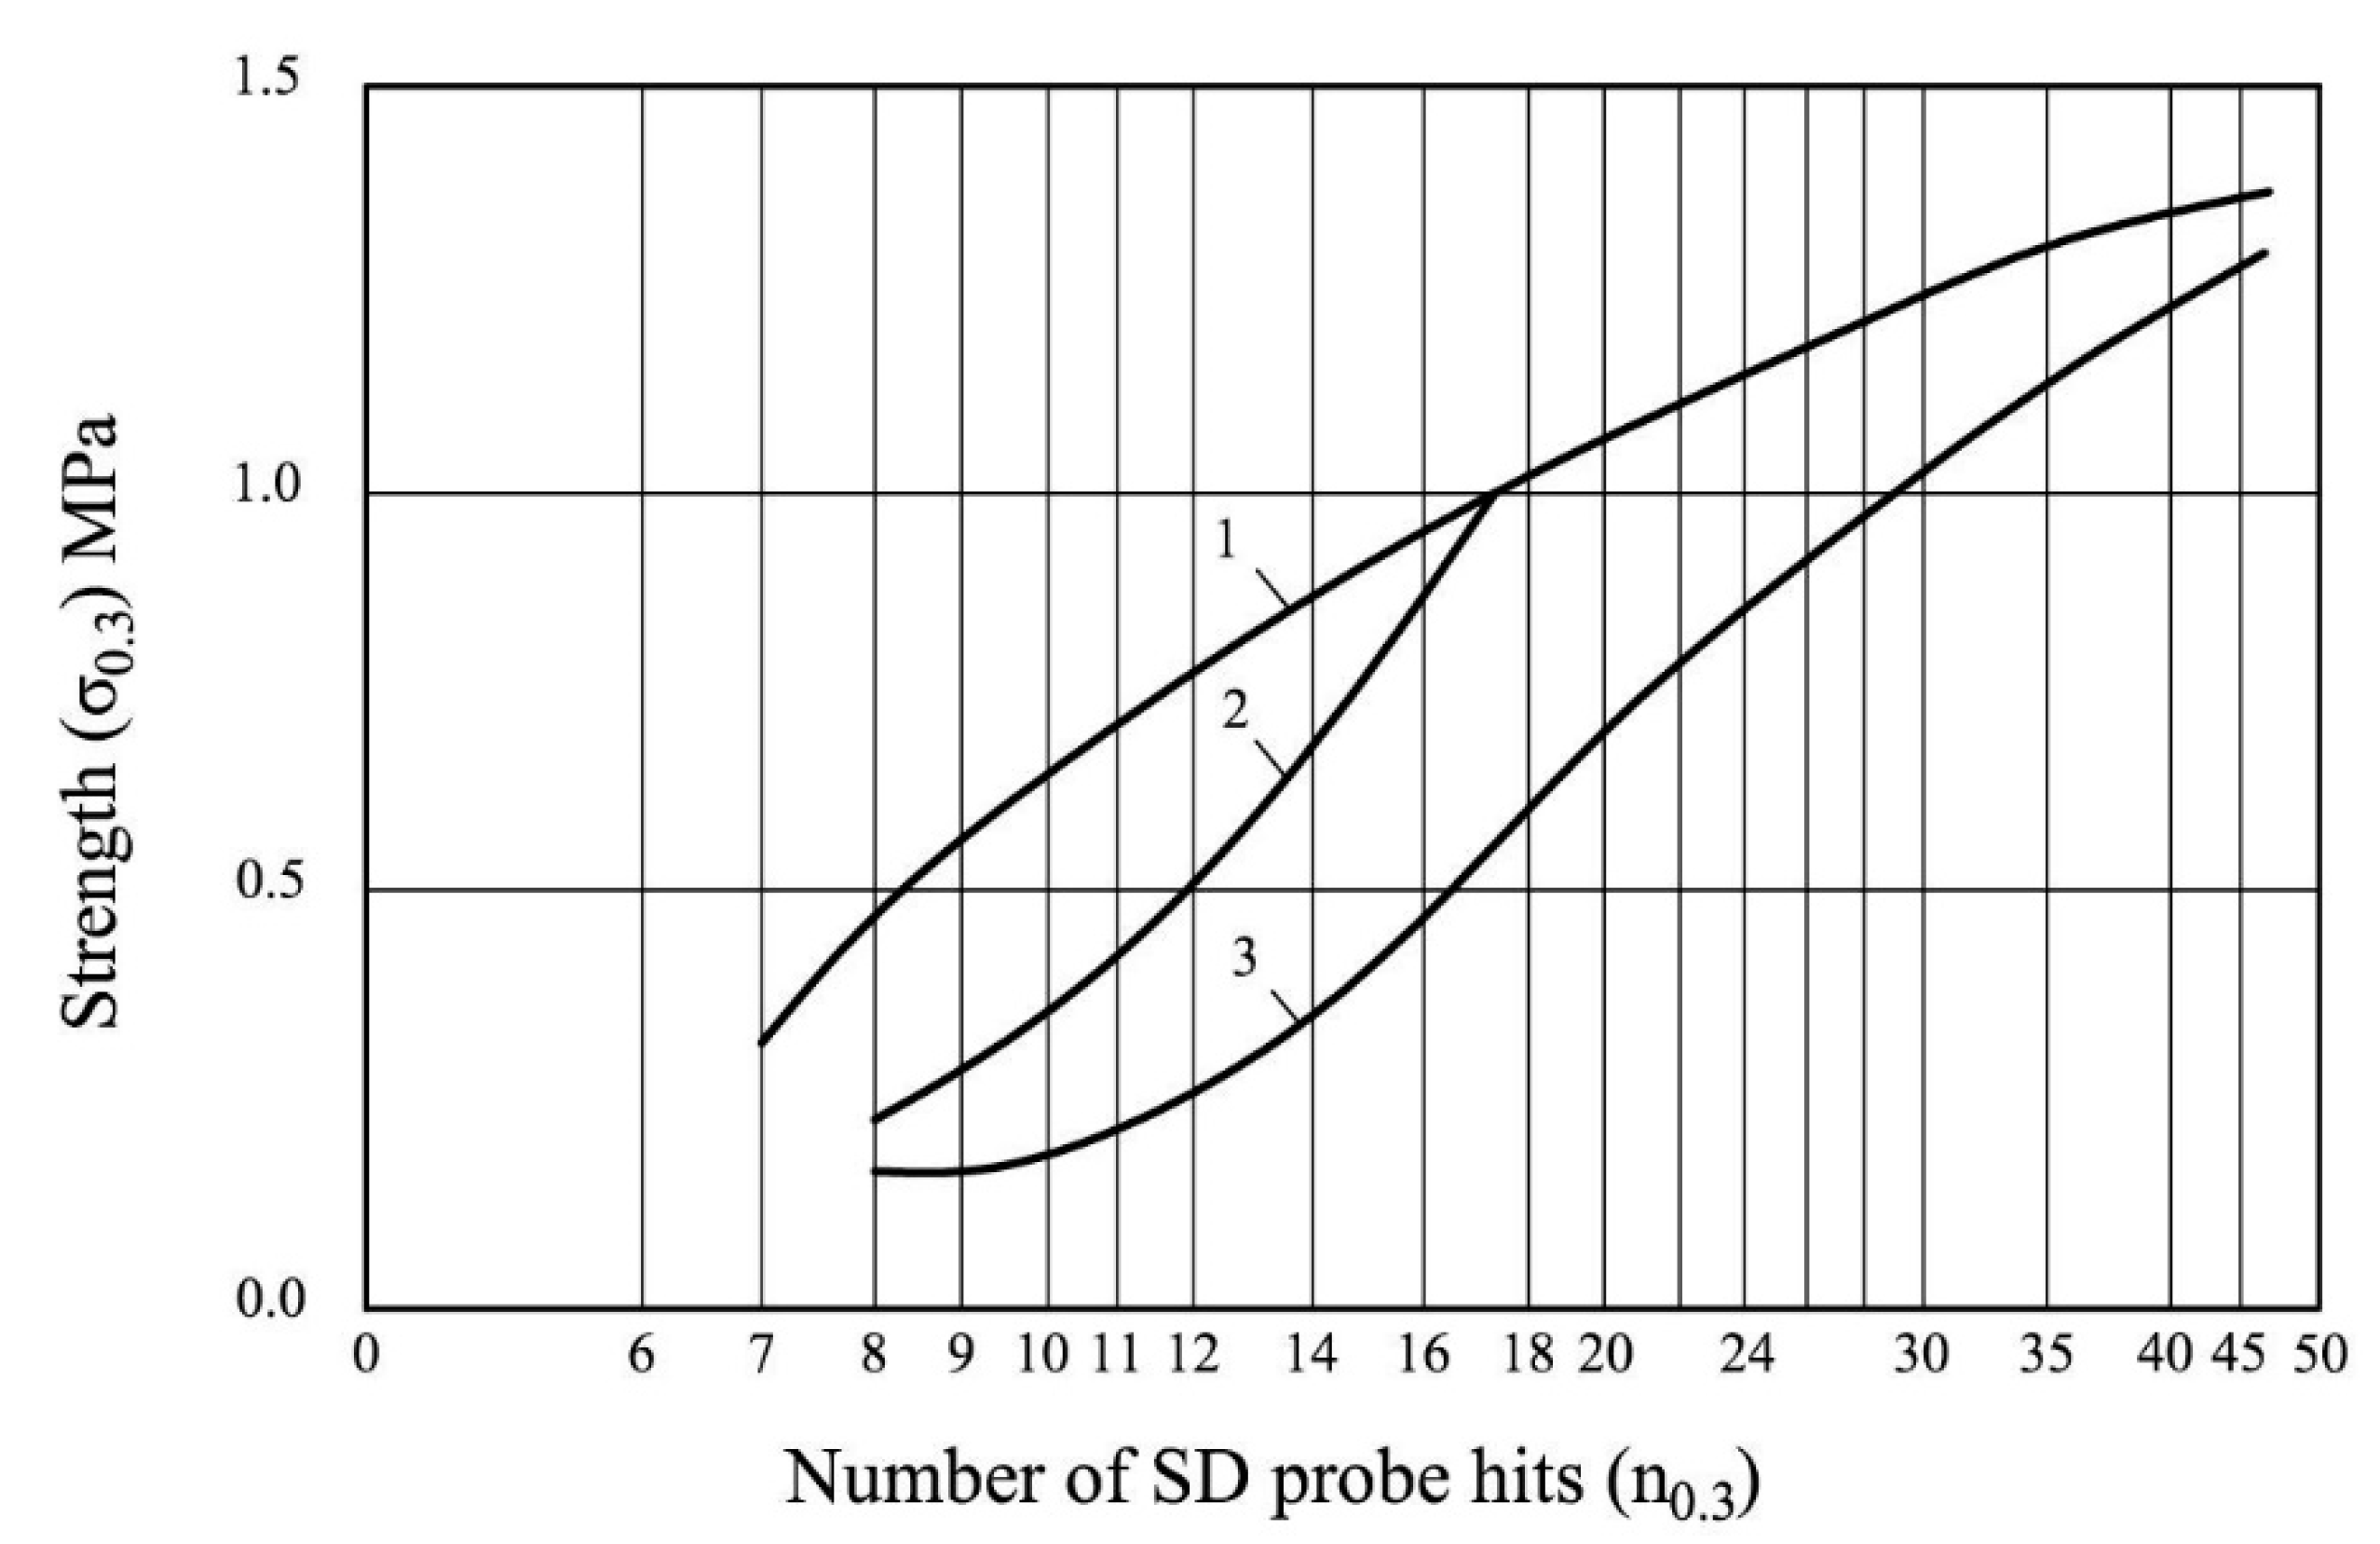
2.3. Strength of Turf Layer
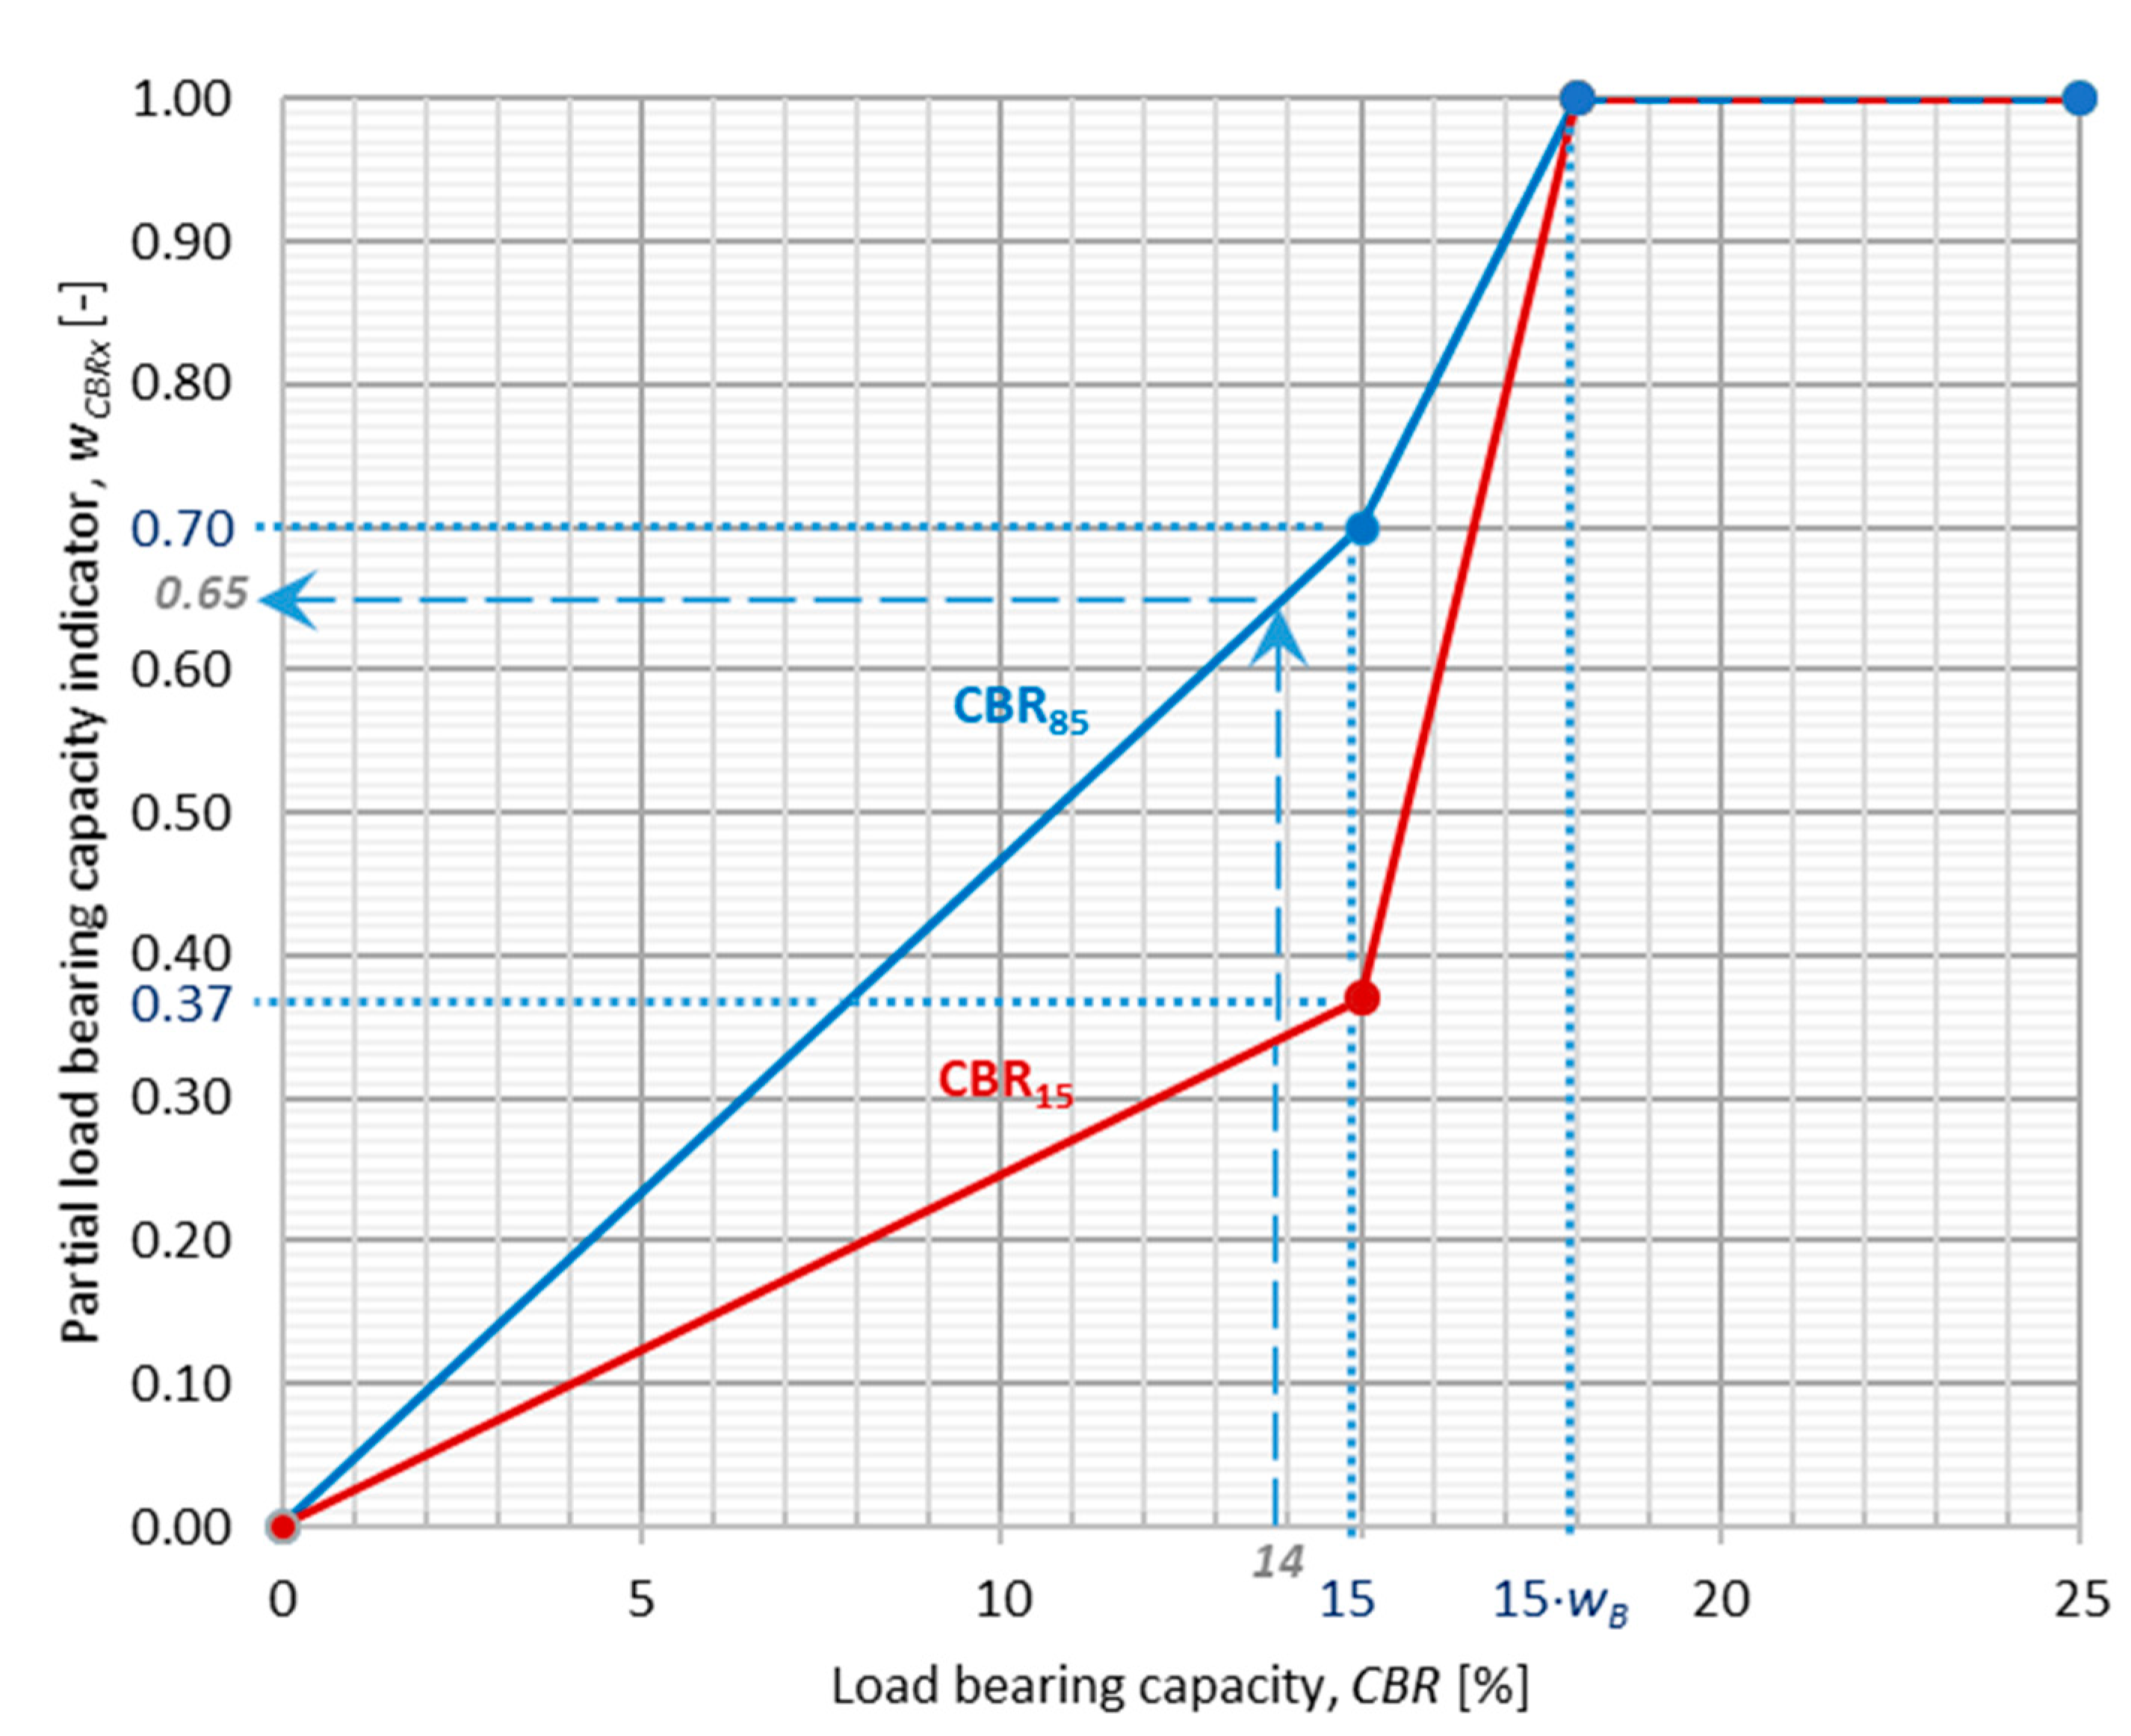
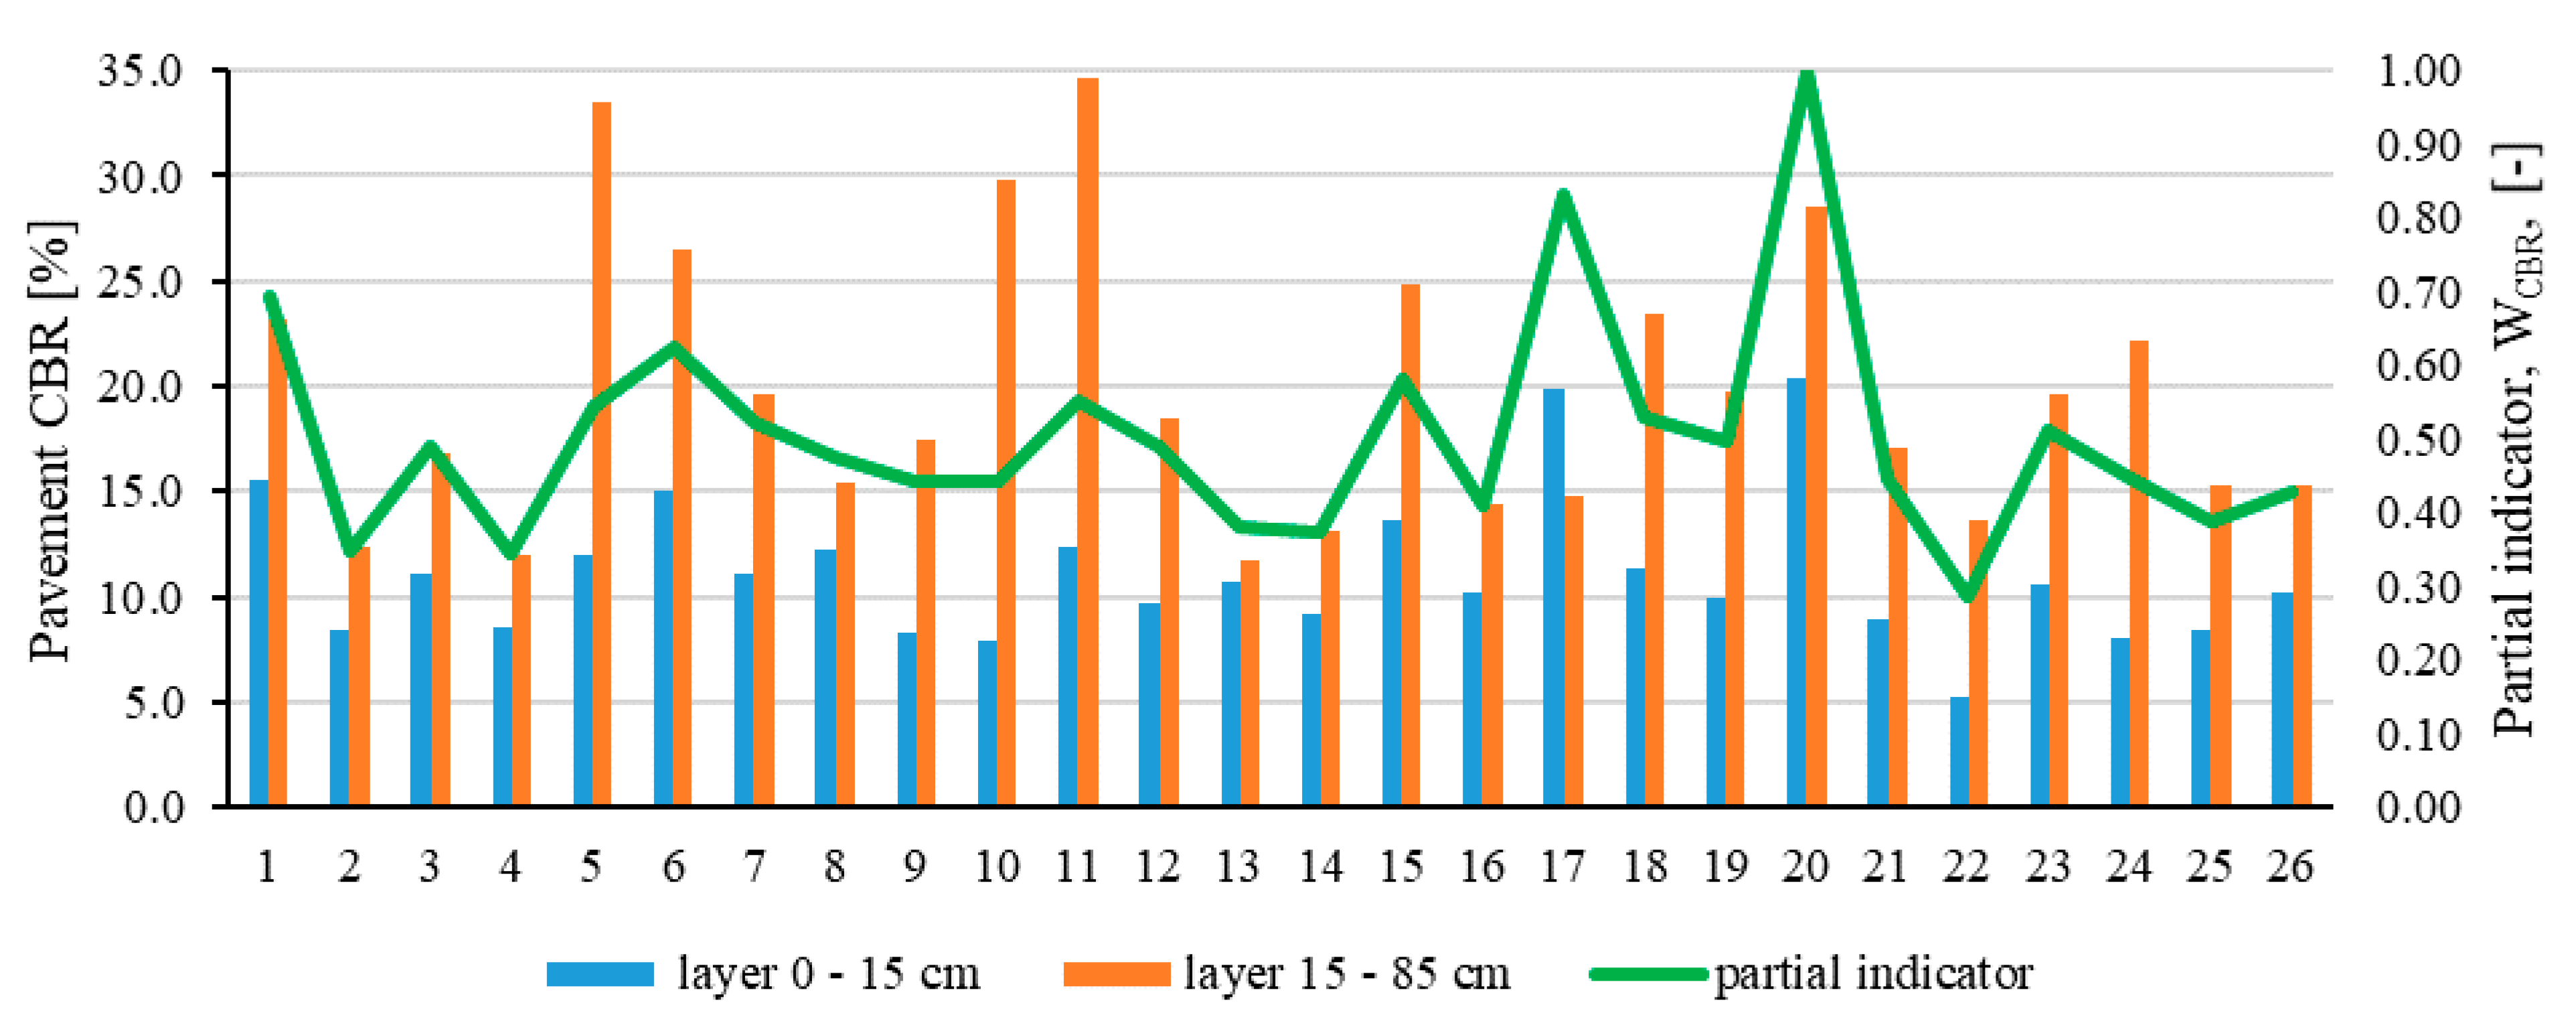
2.4. Load Bearing Capacity of the Natural Pavement
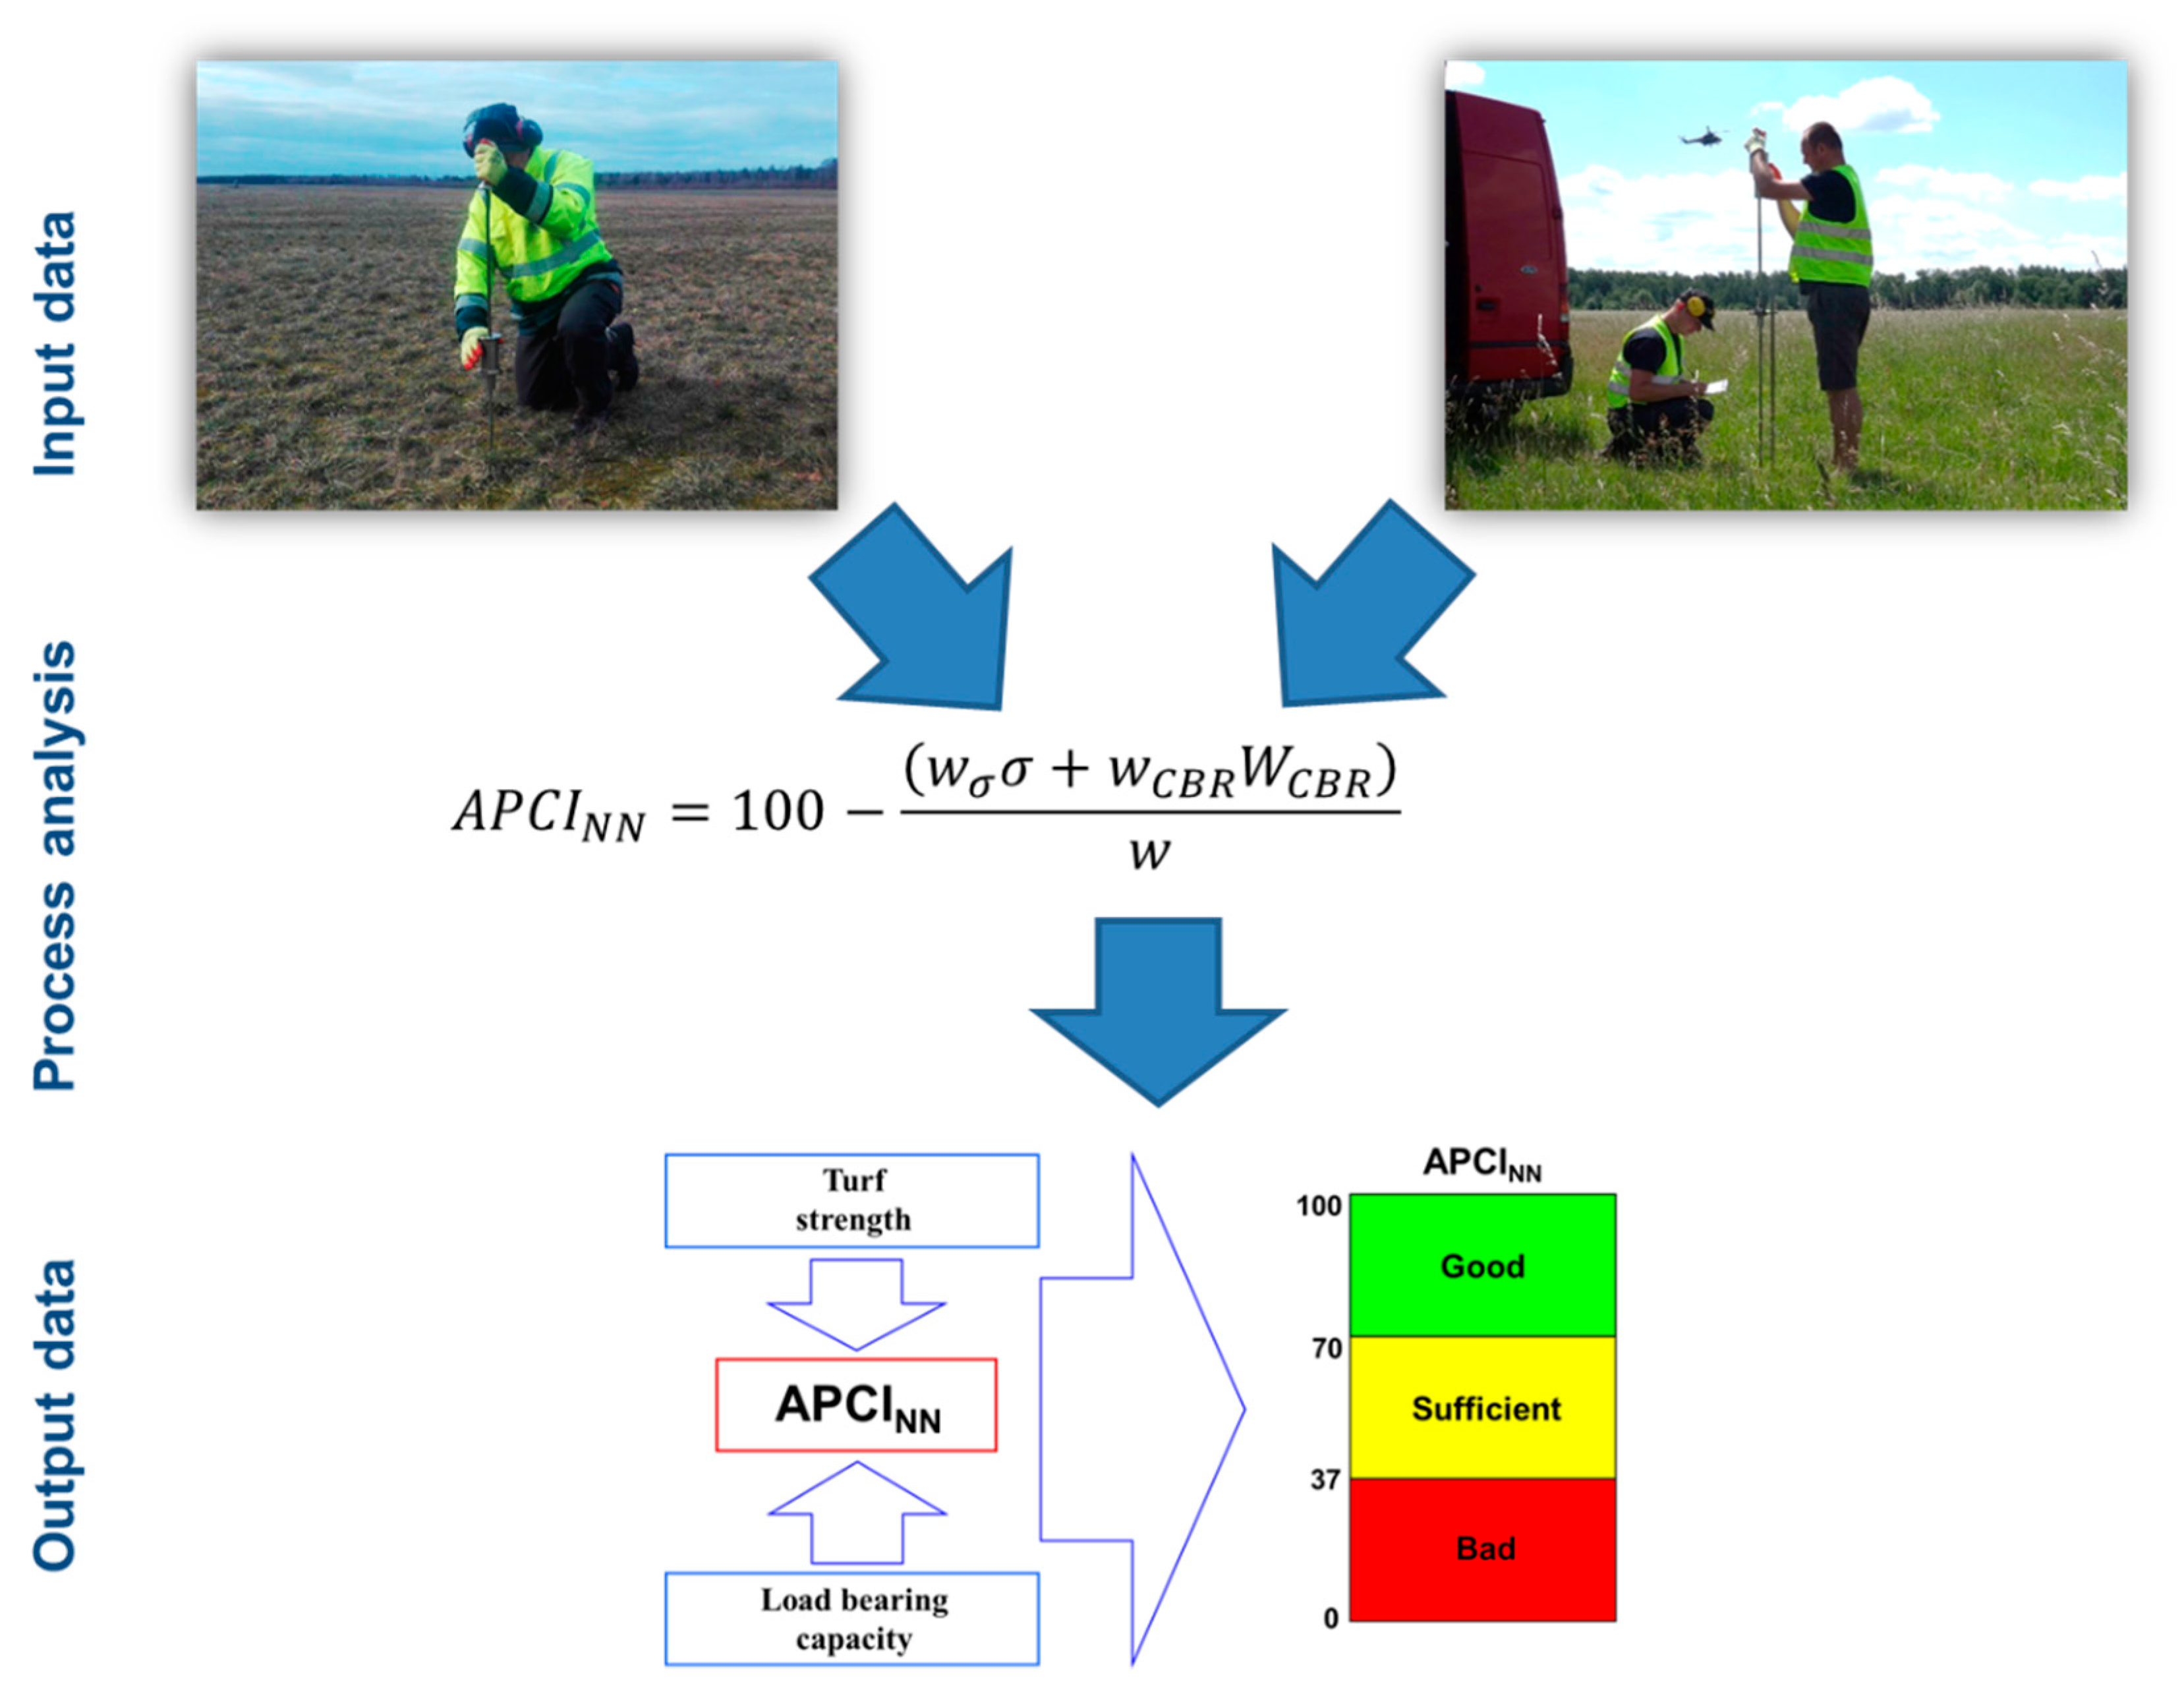
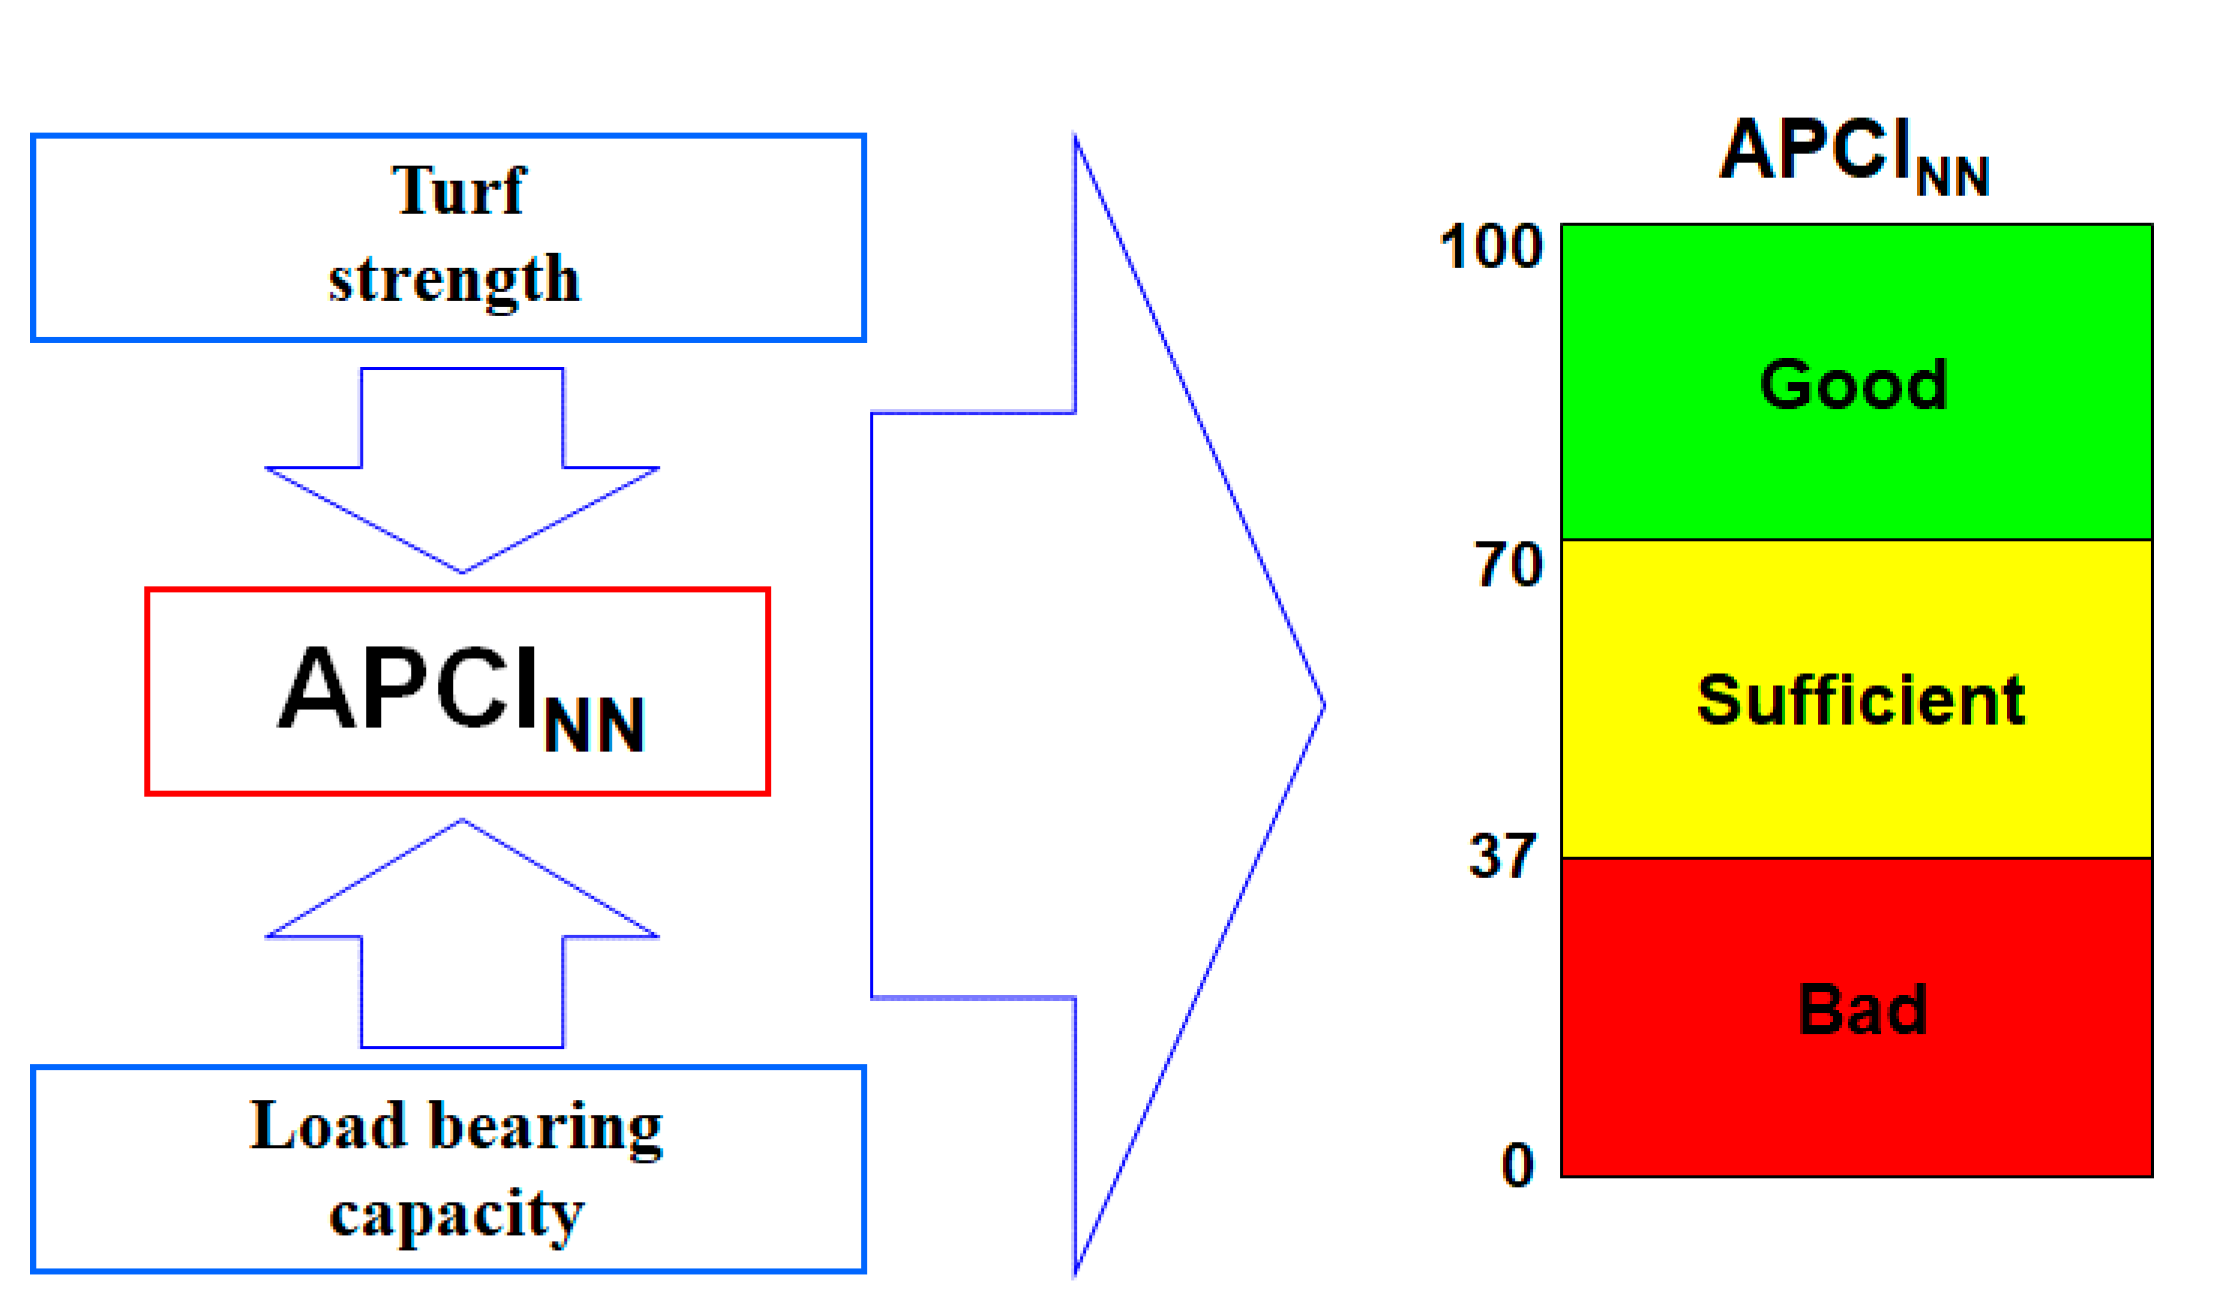
2.5. The Natural Pavement Condition Indicator APCINN
- testing the strength of the turf layer to a depth of 0.3 m below ground level in accordance with the requirements of the NO-17-A503: 2017 standard [34],
- testing the load bearing capacity of the natural pavement to a depth of 0.85 m below ground level in accordance with the requirements of the NO-17-A503: 2017 standard [34].
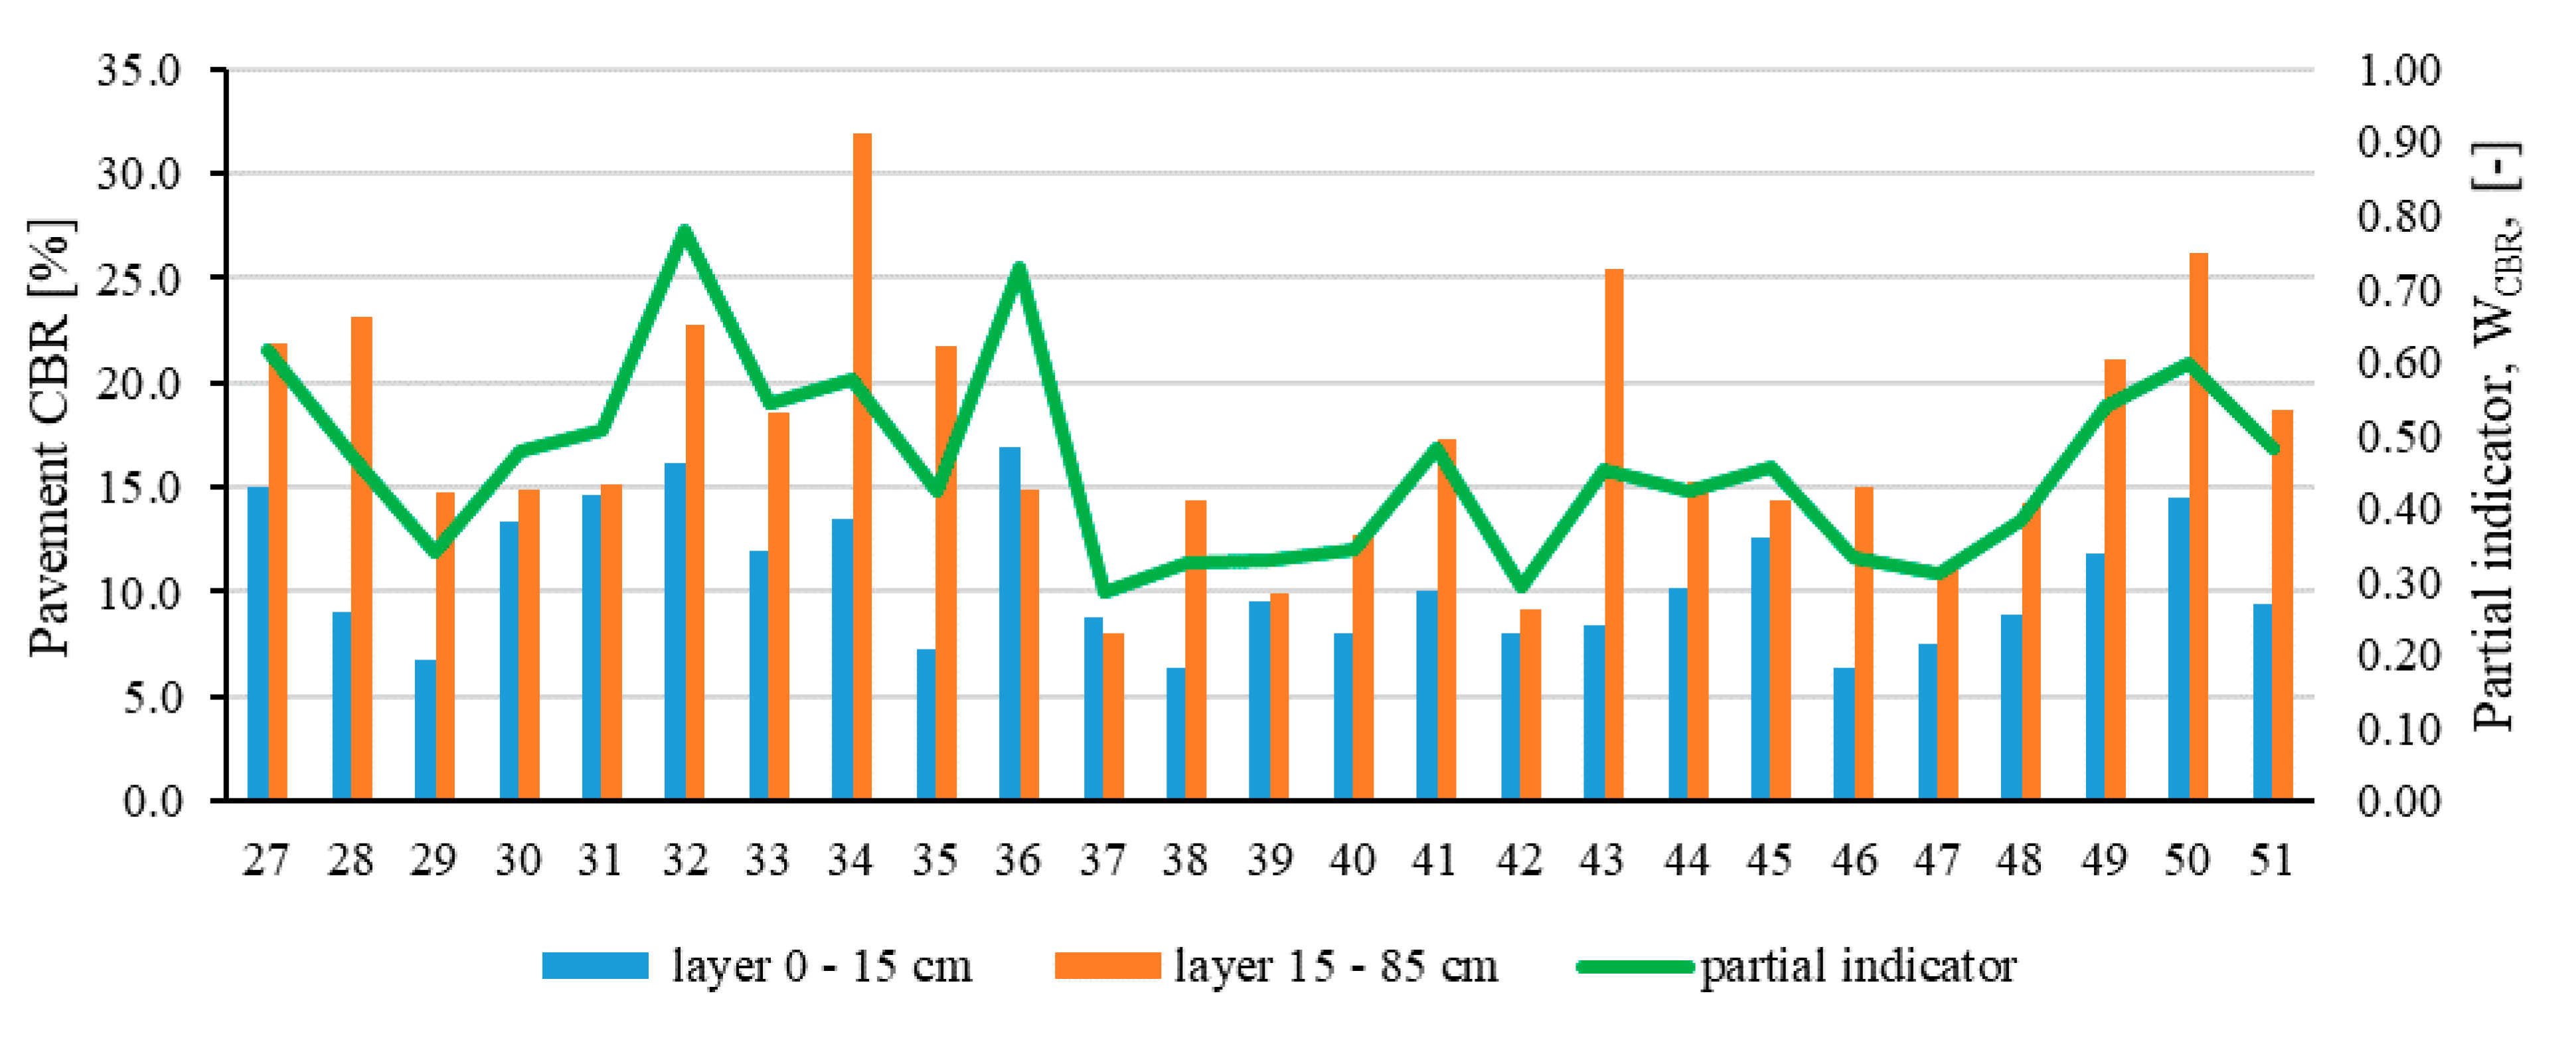
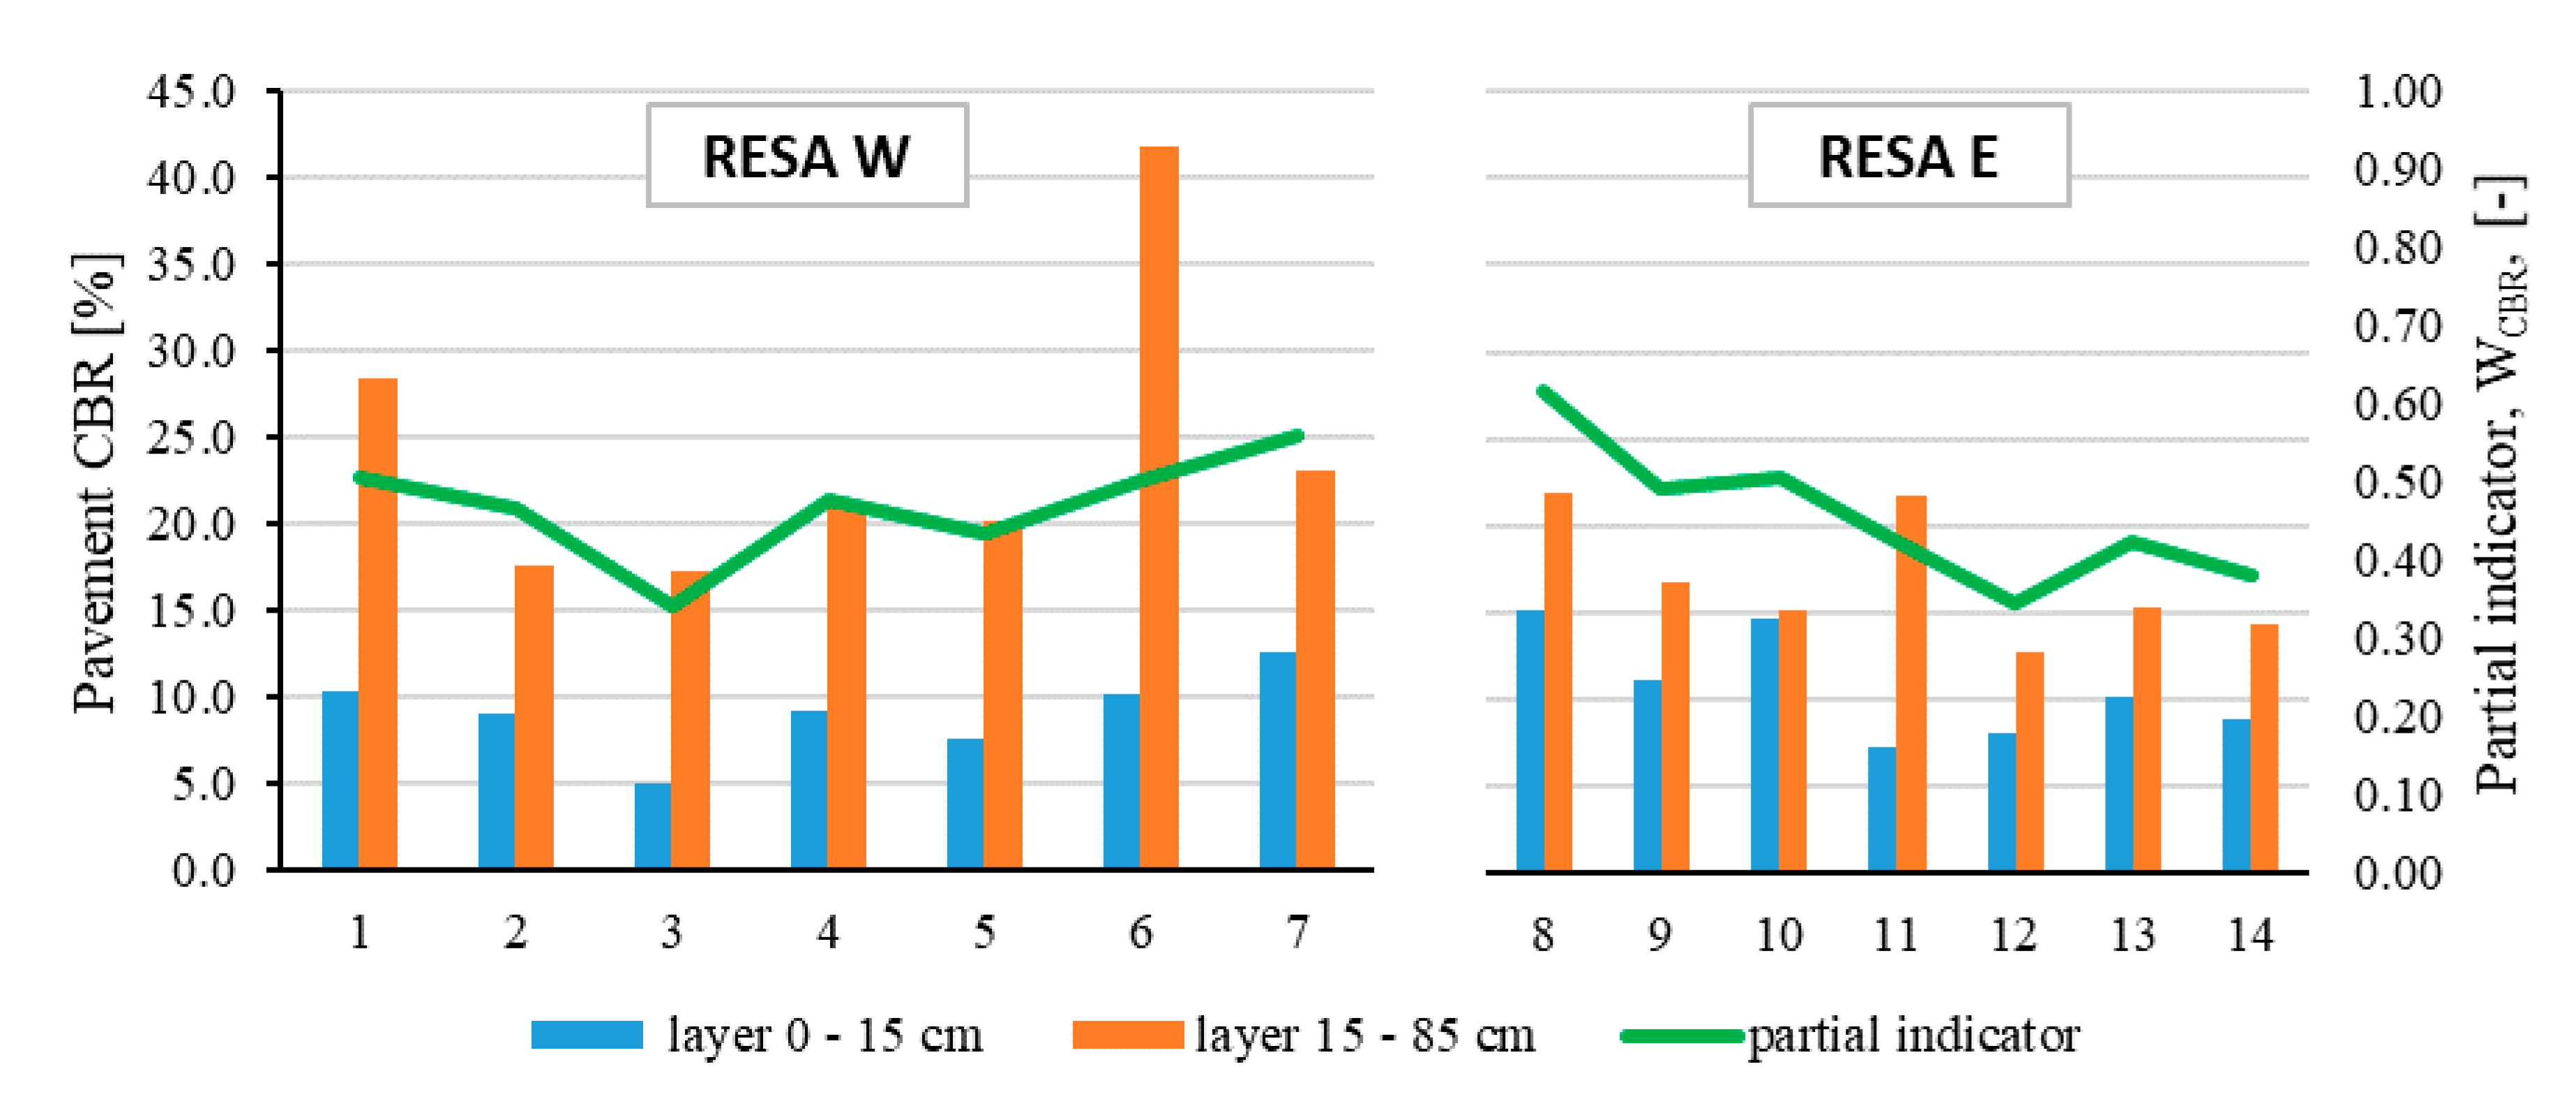
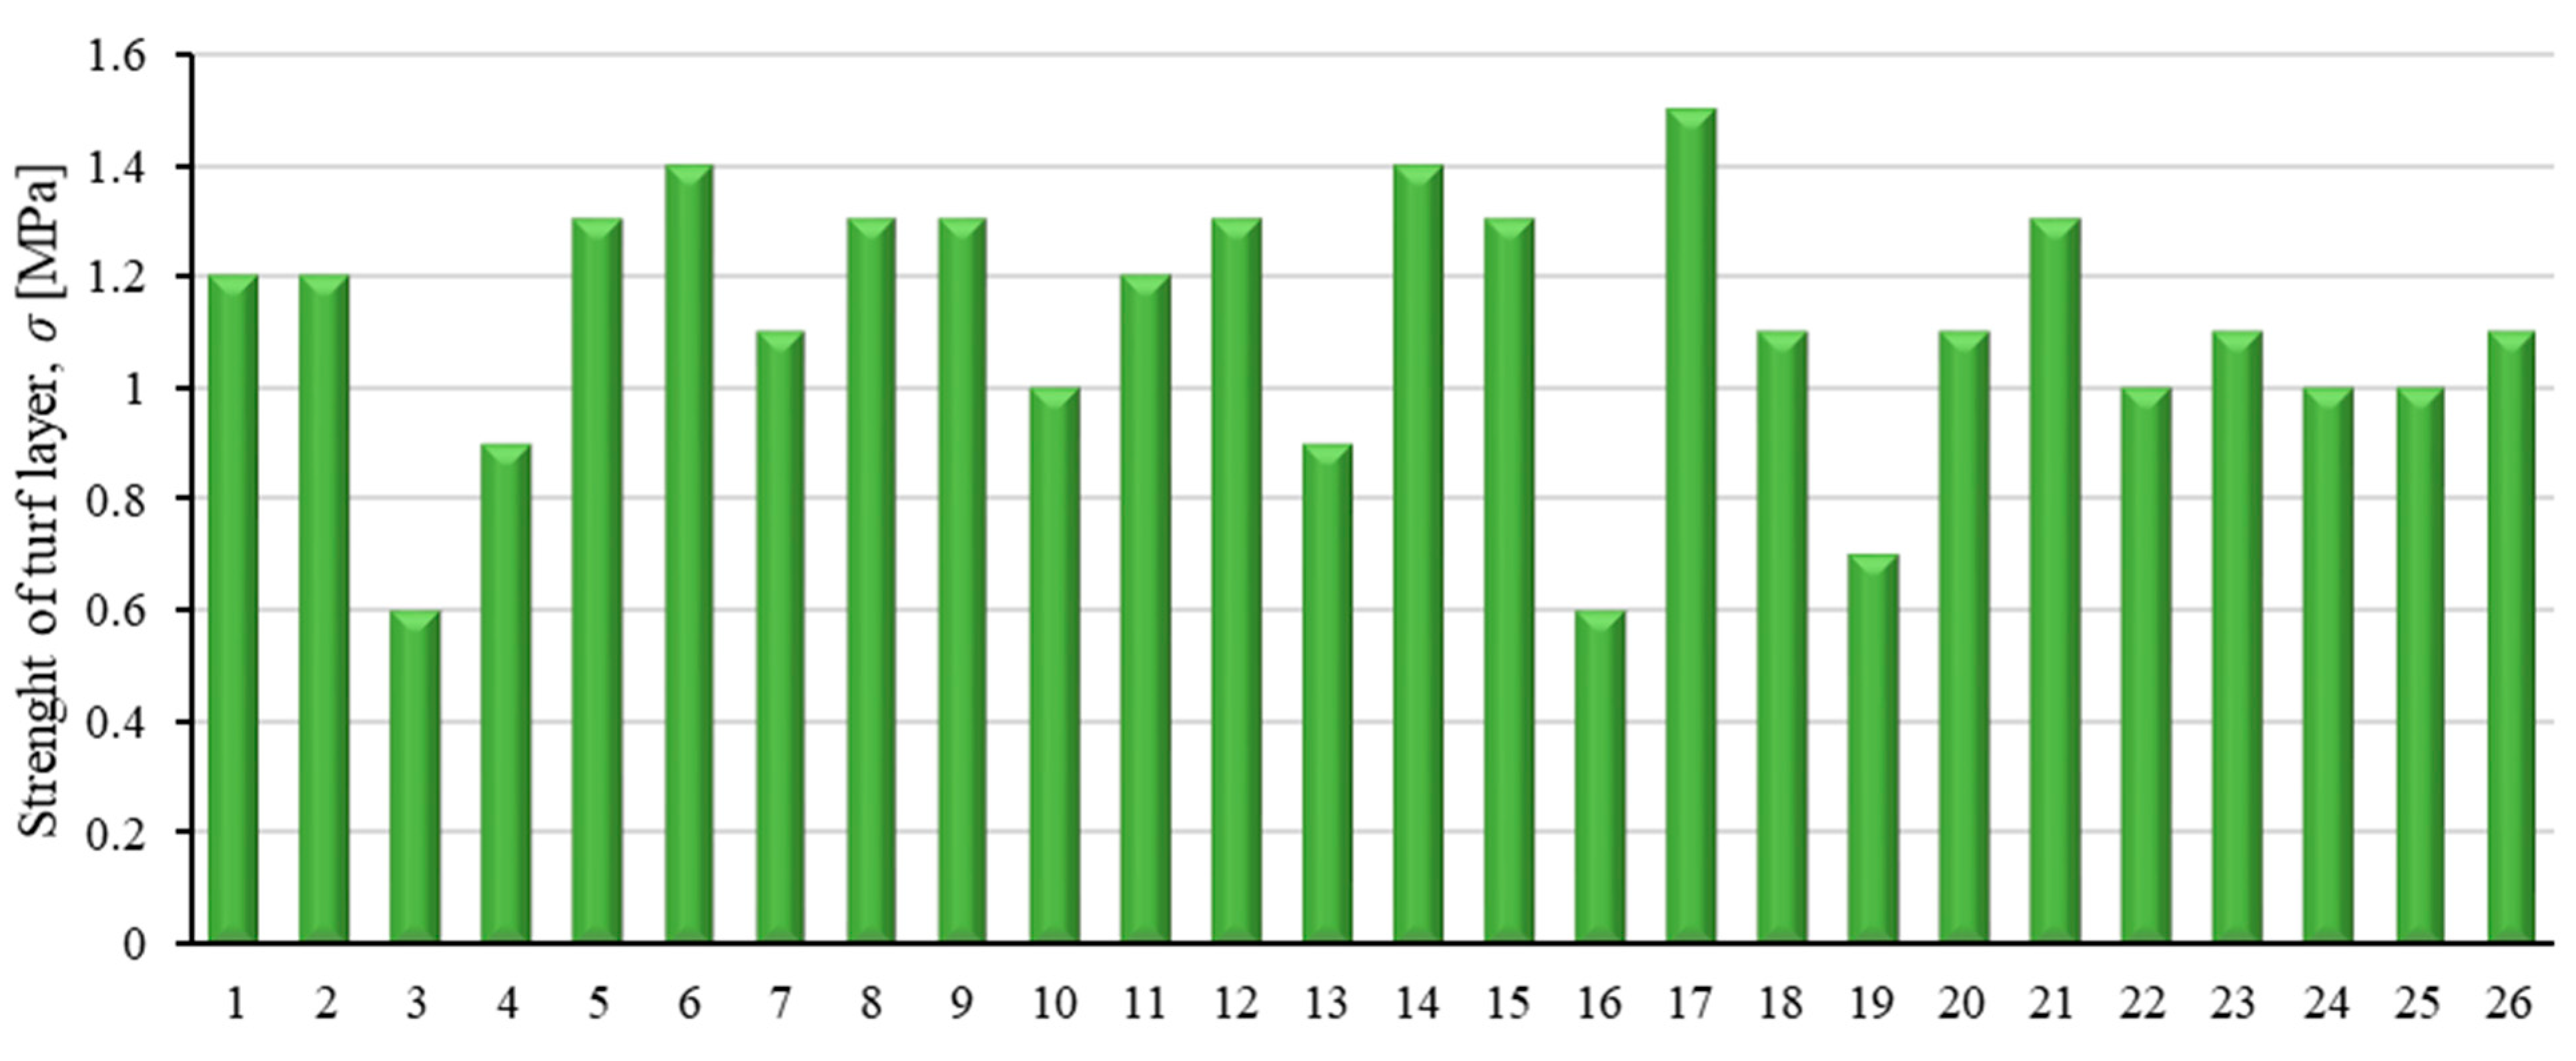
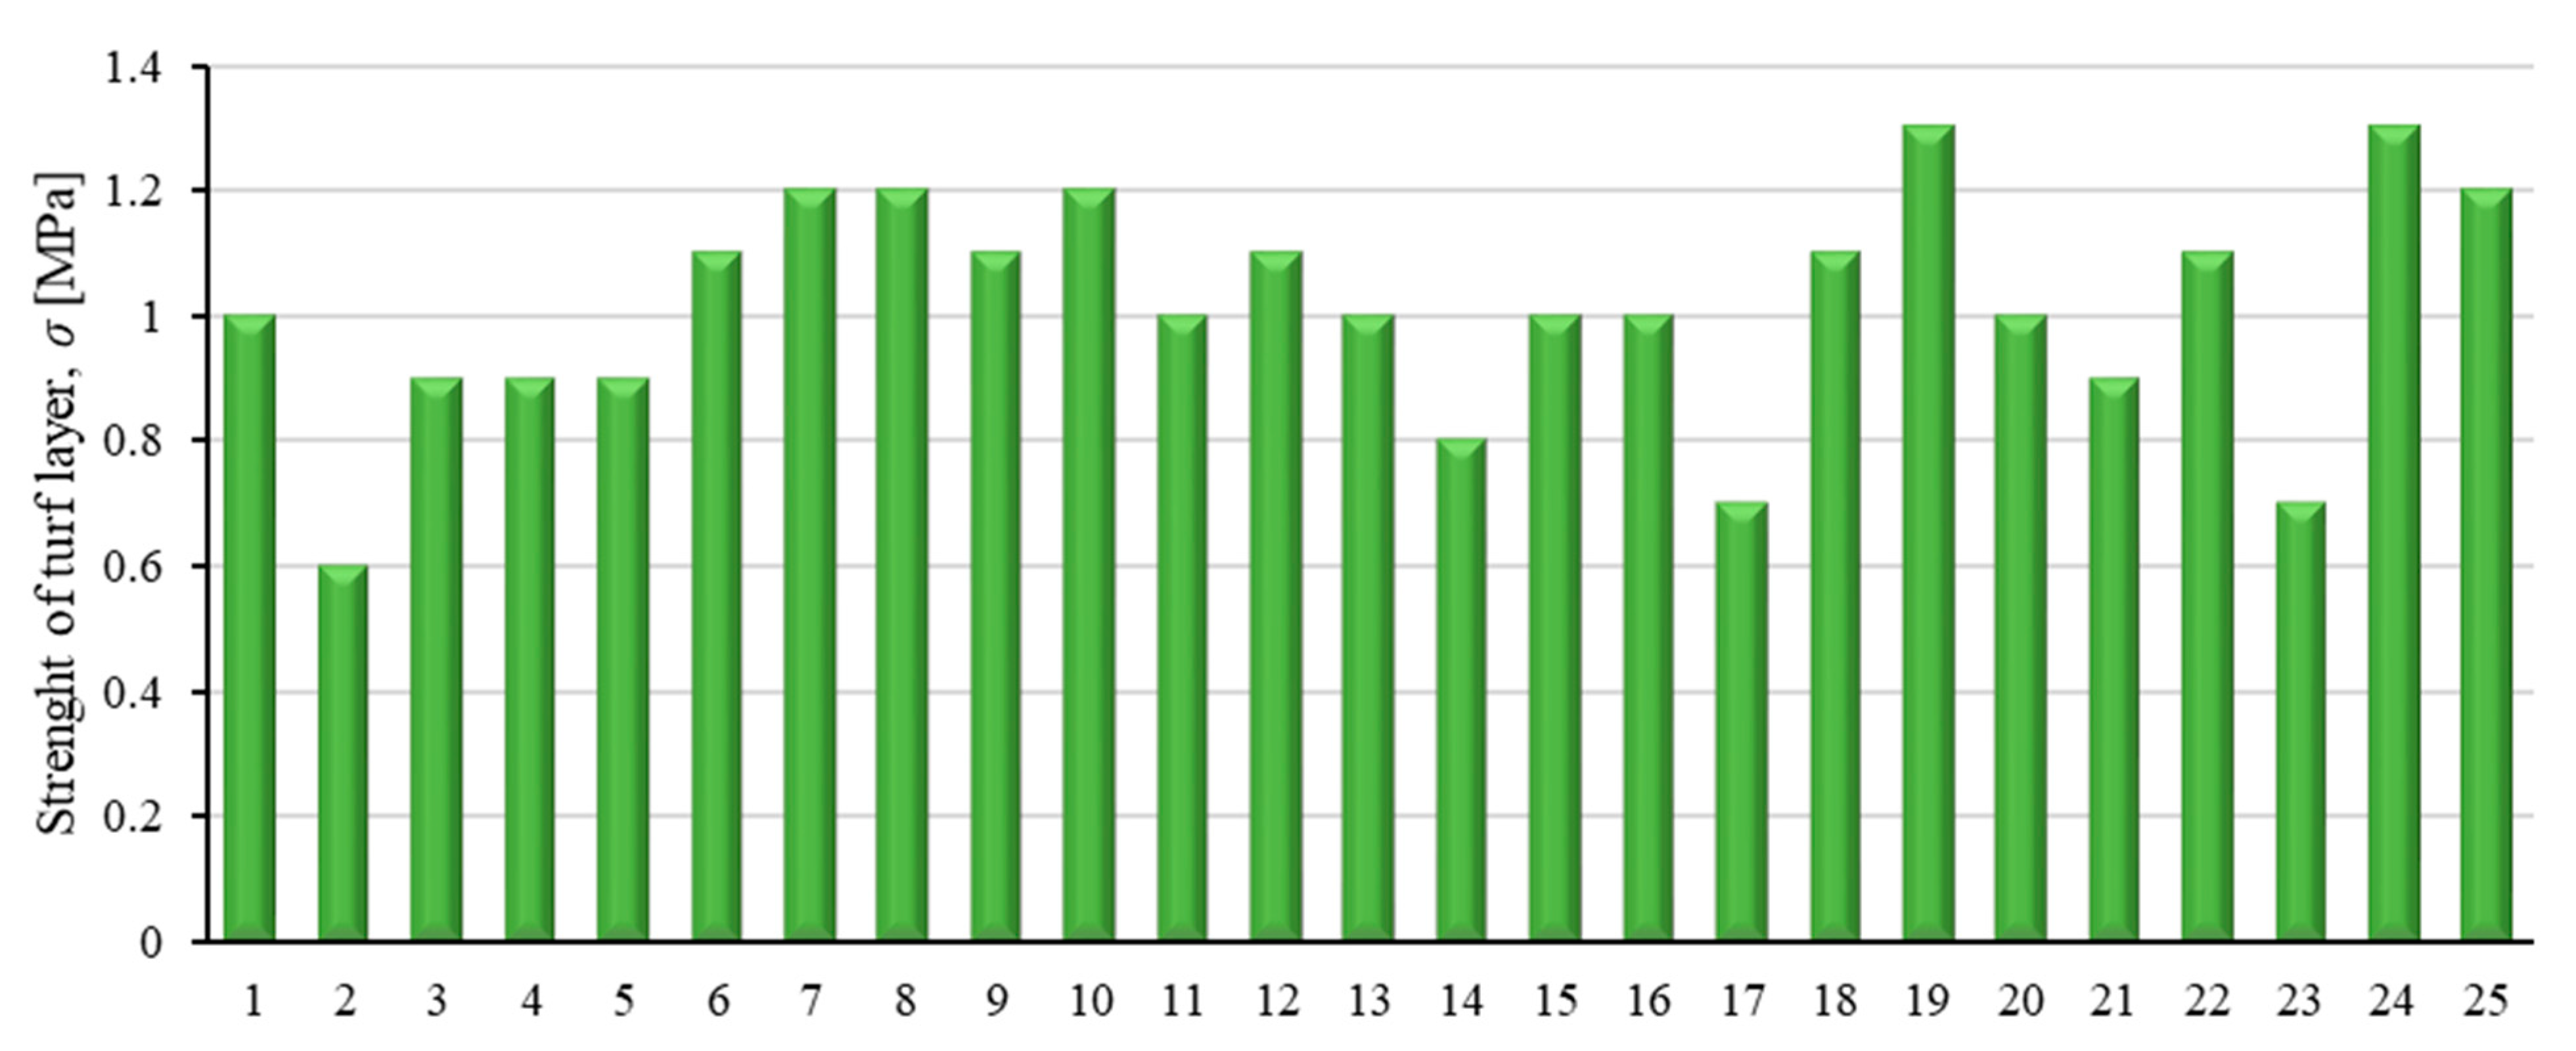
3. Results
4. Conclusions
Author Contributions
Funding
Institutional Review Board Statement
Informed Consent Statement
Conflicts of Interest
References
- Shahin, M.Y. Pavement Management for Airports, Roads, and Parking Lots; Wydanie Drugie; Springer: New York, NY, USA, 2005. [Google Scholar]
- Deflorio, J.; Louch, H. Local Pavement Management Systems; Final Report; Cambrigde Systematics, Inc.: Medford, MA, USA, 2014. [Google Scholar]
- Khattak, M.J.; Baladi, G.; Zhang, Z.; Ismail, S. Review of Louisiana’s Pavement Management System: Phase I. Transp. Res. Rec. J. Transp. Res. Board 2008, 2084, 18–27. [Google Scholar] [CrossRef]
- Pierce, L.M.; McGovern, G.; Zimmerman, K.A. Practical Guide for Quality Management of Pavement Condition Data Collection; Final Document; Applied Pavement Technology Inc.: Urbana, IL, USA, 2013. [Google Scholar]
- Shahnazari, H.; Tutunchian, M.A.; Mashayekhi, M.; Amini, A.A. Application of Soft Computing for Prediction of Pavement Condition Index. J. Transp. Eng. 2012, 138, 1495–1506. [Google Scholar] [CrossRef]
- Zofka, A. Proactive Strategy for Management Road Infrastructure Elements; IBDiM: Warsaw, Poland, 2019. [Google Scholar]
- Herbert, Rowland & Grubic Incorporated. 5 Reasons to Consider a Modern Pavement Management Program. Available online: https://www.hrg-inc.com//5-reasons-you-should-consider-a-pavement-management-program/ (accessed on 1 January 2021).
- Wesołowski, M.; Iwanowski, P. APCI Evaluation Method for Cement Concrete Airport Pavements in the Scope of Air Operation Safety and Air Transport Participants Life. Int. J. Environ. Res. Public Health 2020, 17, 1663. [Google Scholar] [CrossRef] [PubMed] [Green Version]
- Wesołowski, M.; Iwanowski, P. Evaluation of asphalt concrete airport pavement conditions based on the Airfield Pavement Condition Index (APCI) in scope of flight safety. Aerospace 2020, 7, 78. [Google Scholar] [CrossRef]
- Baladi, G.; Novak, E.; Kuo, W. Pavement Condition Index—Remaining Service Life. In Pavement Management Implementation; ASTM International: West Conshohocken, PA, USA, 1991. [Google Scholar]
- Setyawan, A.; Nainggolan, J.; Budiarto, A. Predicting the Remaining Service Life of Road Using Pavement Condition Index. Procedia Eng. 2015, 125, 417–423. [Google Scholar] [CrossRef] [Green Version]
- Applied Research Associates Inc. Pavement Condition Report; Project 15805741; Applied Research Associates Inc.: Albuquerque, NM, USA, 2015. [Google Scholar]
- Sharaf, E.A.; Reichelt, E.; Shahin, M.Y.; Sinha, K.C. Development of a Methodology to Estimate Pavement Maintenance and Repair Costs for Different Ranges of Pavement Condition Index; Transportation Research Board, 1987. 1123. Available online: https://trid.trb.org/view/282533 (accessed on 5 May 2021).
- ASTM D5340-12. Standard Test Method for Airport Pavement Condition Index Surveys; ASTM International: West Conshohocken, PA, USA, 2018. [Google Scholar]
- ASTM D6433-18. Standard Practice for Roads and Parking Lots Pavement Condition Index Surveys; ASTM International: West Conshohocken, PA, USA, 2018. [Google Scholar]
- Wesołowski, M. A Comprehensive Assessment of the Technical Condition of the Surface of Functional Elements of Airports in the Aspect of Flights Safety; ITWL: Warsaw, Poland, 2020. [Google Scholar]
- Kirbas, U.; Karasahin, M. Estimating PCI Using Vibration Data for Asphalt Concrete Pavements; ICTE: Barcelona, Spain, 2017. [Google Scholar]
- McGhee, K.H.; Habib, A.; Chowdhury, T. Development of Pavement Condition Indices for the Virginia Department of Transportation, Phase II. Rigid Pavements; Virginia Department of Transportation: Richmond, Virginia, 2002. [Google Scholar]
- McGhee, K.H. Development and Implementation of Pavement Condition Indices for the Virginia Department of Transportation, Phase I; Virginia Department of Transportation: Richmond, Virginia, 2002. [Google Scholar]
- Arhin, S.A.; Williams, L.N.; Ribbiso, A.; Anderson, M.F. Predicting pavement condition index using international roughness index in a dense urban area. J. Civ. Eng. Res. 2015, 5, 10–17. [Google Scholar]
- Pantuso, A.; Loprencipe, G.; Bonin, G.; Teltayev, B.B. Analysis of pavement condition survey data for effective implementation of a network level pavement management program for Kazakhstan. Sustainability 2019, 11, 901. [Google Scholar] [CrossRef] [Green Version]
- Shah, Y.U.; Jainb, S.; Tiwaric, D.; Jain, M. Development of Overall Pavement Condition Index for Urban Road Network. Procedia Soc. Behav. Sci. 2013, 104, 332–341. [Google Scholar] [CrossRef] [Green Version]
- Chen, D.; Hildreth, J.; Nicholas, T.; Dye, M. Development and Validation of Pavement Deterioration Models and Analysis Weight Factors for the NCDOT Pavement Management System. Part II: Automated Survey Data; Final Report; University of North Carolina at Charlotte: Charlotte, NC, USA, 2014. [Google Scholar]
- Wesołowski, M.; Blacha, K.; Barszcz, P. Multi-Criteria Analysis in Assessment of the Degree of Degradation Pavement Elements Functional Airports Made of Cement Concrete. In Proceedings of the Environmental Engineering, 10th International Conference “Environmental Engineering”, Vilnius, Lithuania, 27–28 April 2017; Volume 125. [Google Scholar]
- Zieja, M.; Barszcz, P.; Blacha, K.; Wesolowski, M. The evaluation method of degradation degree of runway pavement surfaces constructed from cement concrete. In Proceedings of the 2nd International Conference on Engineering Sciences and Technologies, Tatranske Matliare, Slovak Republic, 29 June–1 July 2016; Taylor & Francis Group: London, UK, 2017. [Google Scholar]
- Loprencipe, G.; Pantuso, A. A Specified Procedure for Distress Identification and Assessment for Urban Road Surfaces Based on PCI. Coatings 2017, 7, 65. [Google Scholar] [CrossRef] [Green Version]
- Cafiso, S.; Di Graziano, A.; Goulias, D.G.; D’Agostino, C. Distress and profile data analysis for condition assessment in pavement management systems. Int. J. Pavement Res. Technol. 2019, 12, 527–536. [Google Scholar] [CrossRef]
- EASA. Certification Specifications and Guidance Material for Aerodromes Design CS-ADR-DSN Issue 4 [X]; EASA: Cologne, Germany, 2017. [Google Scholar]
- ICAO. Annex 14 to the Convention on International Civil Aviation—Aerodromes—Volume I—Aerodrome Design and Operations, 6th ed.; ICAO: Montreal, QC, Canada, 2013. [Google Scholar]
- ICAO. Doc. 9157 ICAO AN/901 Aerodrome Design Manual Part 1—Runways, 3rd ed.; ICAO: Montreal, QC, Canada, 2006. [Google Scholar]
- ICAO. Doc. 9137 ICAO AN/898 Airport Service Manual Part 2—Pavement Surface Conditions, 4th ed.; ICAO: Montreal, QC, Canada, 2002. [Google Scholar]
- Advisory Circular No: 150/5320-12C; U.S. Department of Transportation, Federal Aviation Administration: Washington, DC, USA, 1997.
- Guidelines No. 2 of the President of the Civil Aviation Authority of January 25, 2016 on Methods of Assessment, Measurement and Reporting the Condition of RUNWAY; EASA: Cologne, Germany, 2016.
- Polish Military Standard NO-17-A503:2017 Airfield Pavements—Natural Airfield Pavements—Load Capacity Testing; The Military Centre for Standardization, Quality and Codification: Warsaw, Poland, 2017.
- Graczyk, M.; Nita, P. Ground and Darnic Airport Surfaces, IBDiM Works, nr 3-4; Road and Bridge Research Institute: Warsaw, Poland, 1998. [Google Scholar]
- Wesołowski, M.; Blacha, K.; Iwanowski, P.; Pietruszewski, P. Role and function of natural airfield pavements in the system ensuring air operation safety. Przegląd Komunikacyjny 2018, 12, 7–16. [Google Scholar] [CrossRef]
- Commission Regulation (EU) No 139/2014 of 12 February 2014 Laying down Requirements and Administrative Procedures Related to Aerodromes Pursuant to Regulation (EC) No 216/2008 of the European Parliament and of the Council Text with EEA Relevance; European Union: Brussels, Belgium, 2014.
- Nita, P. Natural Airfield Pavements, Load-Carrying Capacities there of Principles of Construction and Operational Use. J. Konbin 2015, 34, 117–138. [Google Scholar] [CrossRef]
- Nita, P. Construction and Maintenance of Airport Surfaces; Wydawnictwa Komunikacji i Łączności: Warsaw, Poland, 2008. [Google Scholar]
- Wesołowski, M.; Iwanowski, P.; Pietruszewski, P.; Włodarski, P. Tests and assessment of the contact surface of selected measuring tires of friction testers with the airport surface depending on changes in pressure and pressure. J. Konbin 2020, 50, 377–397. [Google Scholar] [CrossRef]
- Airport Guidelines, Technical Evaluation of Airport Turf Pavements on a Sandy and Sand-Clay Ground; Air Force Institute of Technology: Warsaw, Poland, 1967.
- ASTM D6951M-09 Standard Test Method for Use of the Dynamic Cone Penetrometer in Shallow Pavement Applications; ASTM International: West Conshohocken, PA, USA, 2009.
- ITWL. Report No. 34/24/17 Execution of a Service Consisting in the Performance of a Five-Year Periodic Control of Technical Condition and Suitability for Use of Specialized Airport Infrastructure and Fixed Technical Equipment of Military Airports; ITWL: Warsaw, Poland, 2017. [Google Scholar]
- ITWL. Report No. 50/24/17 Execution of Periodic Five-Year Control of Artificial Airport Surfaces Technical Condition; ITWL: Warsaw, Poland, 2017. [Google Scholar]
- ITWL. Report No. 23/24/19 Supervision and Periodic Control along with Training and Performing Technical Condition of Artificial and Natural Airport Surfaces Tests; ITWL: Warsaw, Poland, 2019. [Google Scholar]
- ITWL. Report No. 39/24/19 Performing Artificial Diagnostics and Turf Airport Surfaces at Military Airports; ITWL: Warsaw, Poland, 2019. [Google Scholar]
- SKYbrary: Instrument Landing System (ILS). Available online: https://www.skybrary.aero/index.php/Instrument_Landing_System_(ILS) (accessed on 16 June 2016).
- ICAO. ICAO: Annex 15 to the Convention on International Civil Aviation—Aeronautical Information Services; ICAO: Montreal, QC, Canada, 2015. [Google Scholar]
- ICAO. ICAO: Annual Report of the Council; ICAO: Montreal, QC, Canada, 2018. [Google Scholar]


| Name of Stage | |
|---|---|
| 1 | Strength test of the turf layer to a depth of 0.3 m below the ground level. |
| 2 | Test of the load bearing capacity of the natural pavement layer to a depth of 0.15 m below the ground level. |
| 3 | Testing the load bearing capacity of the natural pavement layer from a depth of 0.15 m to a depth of 0.50 m below the ground level. |
| 4 | Testing the load bearing capacity of the natural pavement layer from a depth of 0.50 m to a depth of 0.85 m below the ground level. |
| 5 | Checking the condition of the subsoil up to a depth of 2.0 m below the ground level. |
| 6 | Identification of the subsoil up to a depth of 2.0 m below the ground level. |
| 7 | Analysis of the measurement results. |
| 8 | Determination of the Californian load capacity ratio CBR for the tested AFE. |
| The Layer Strength σ (MPa) | Load Bearing Capacity CBR (%) | Natural Pavement Condition |
|---|---|---|
| σ ≥ 1.0 | CBR ≥ 15 | good |
| σ < 1.0 | CBR < 15 | bad |
| Load Bearing Capacity CBR (%) | Natural Pavement Condition |
|---|---|
| CBR ≥ 15 | good |
| 8 ≤ CBR < 15 | sufficient |
| CBR < 8 | bad |
| Load Bearing Capacity CBR (%) | Natural Pavement Condition |
|---|---|
| CBR ≥ 15 | good |
| 8 ≤ CBR < 15 | sufficient |
| CBR < 8 | bad |
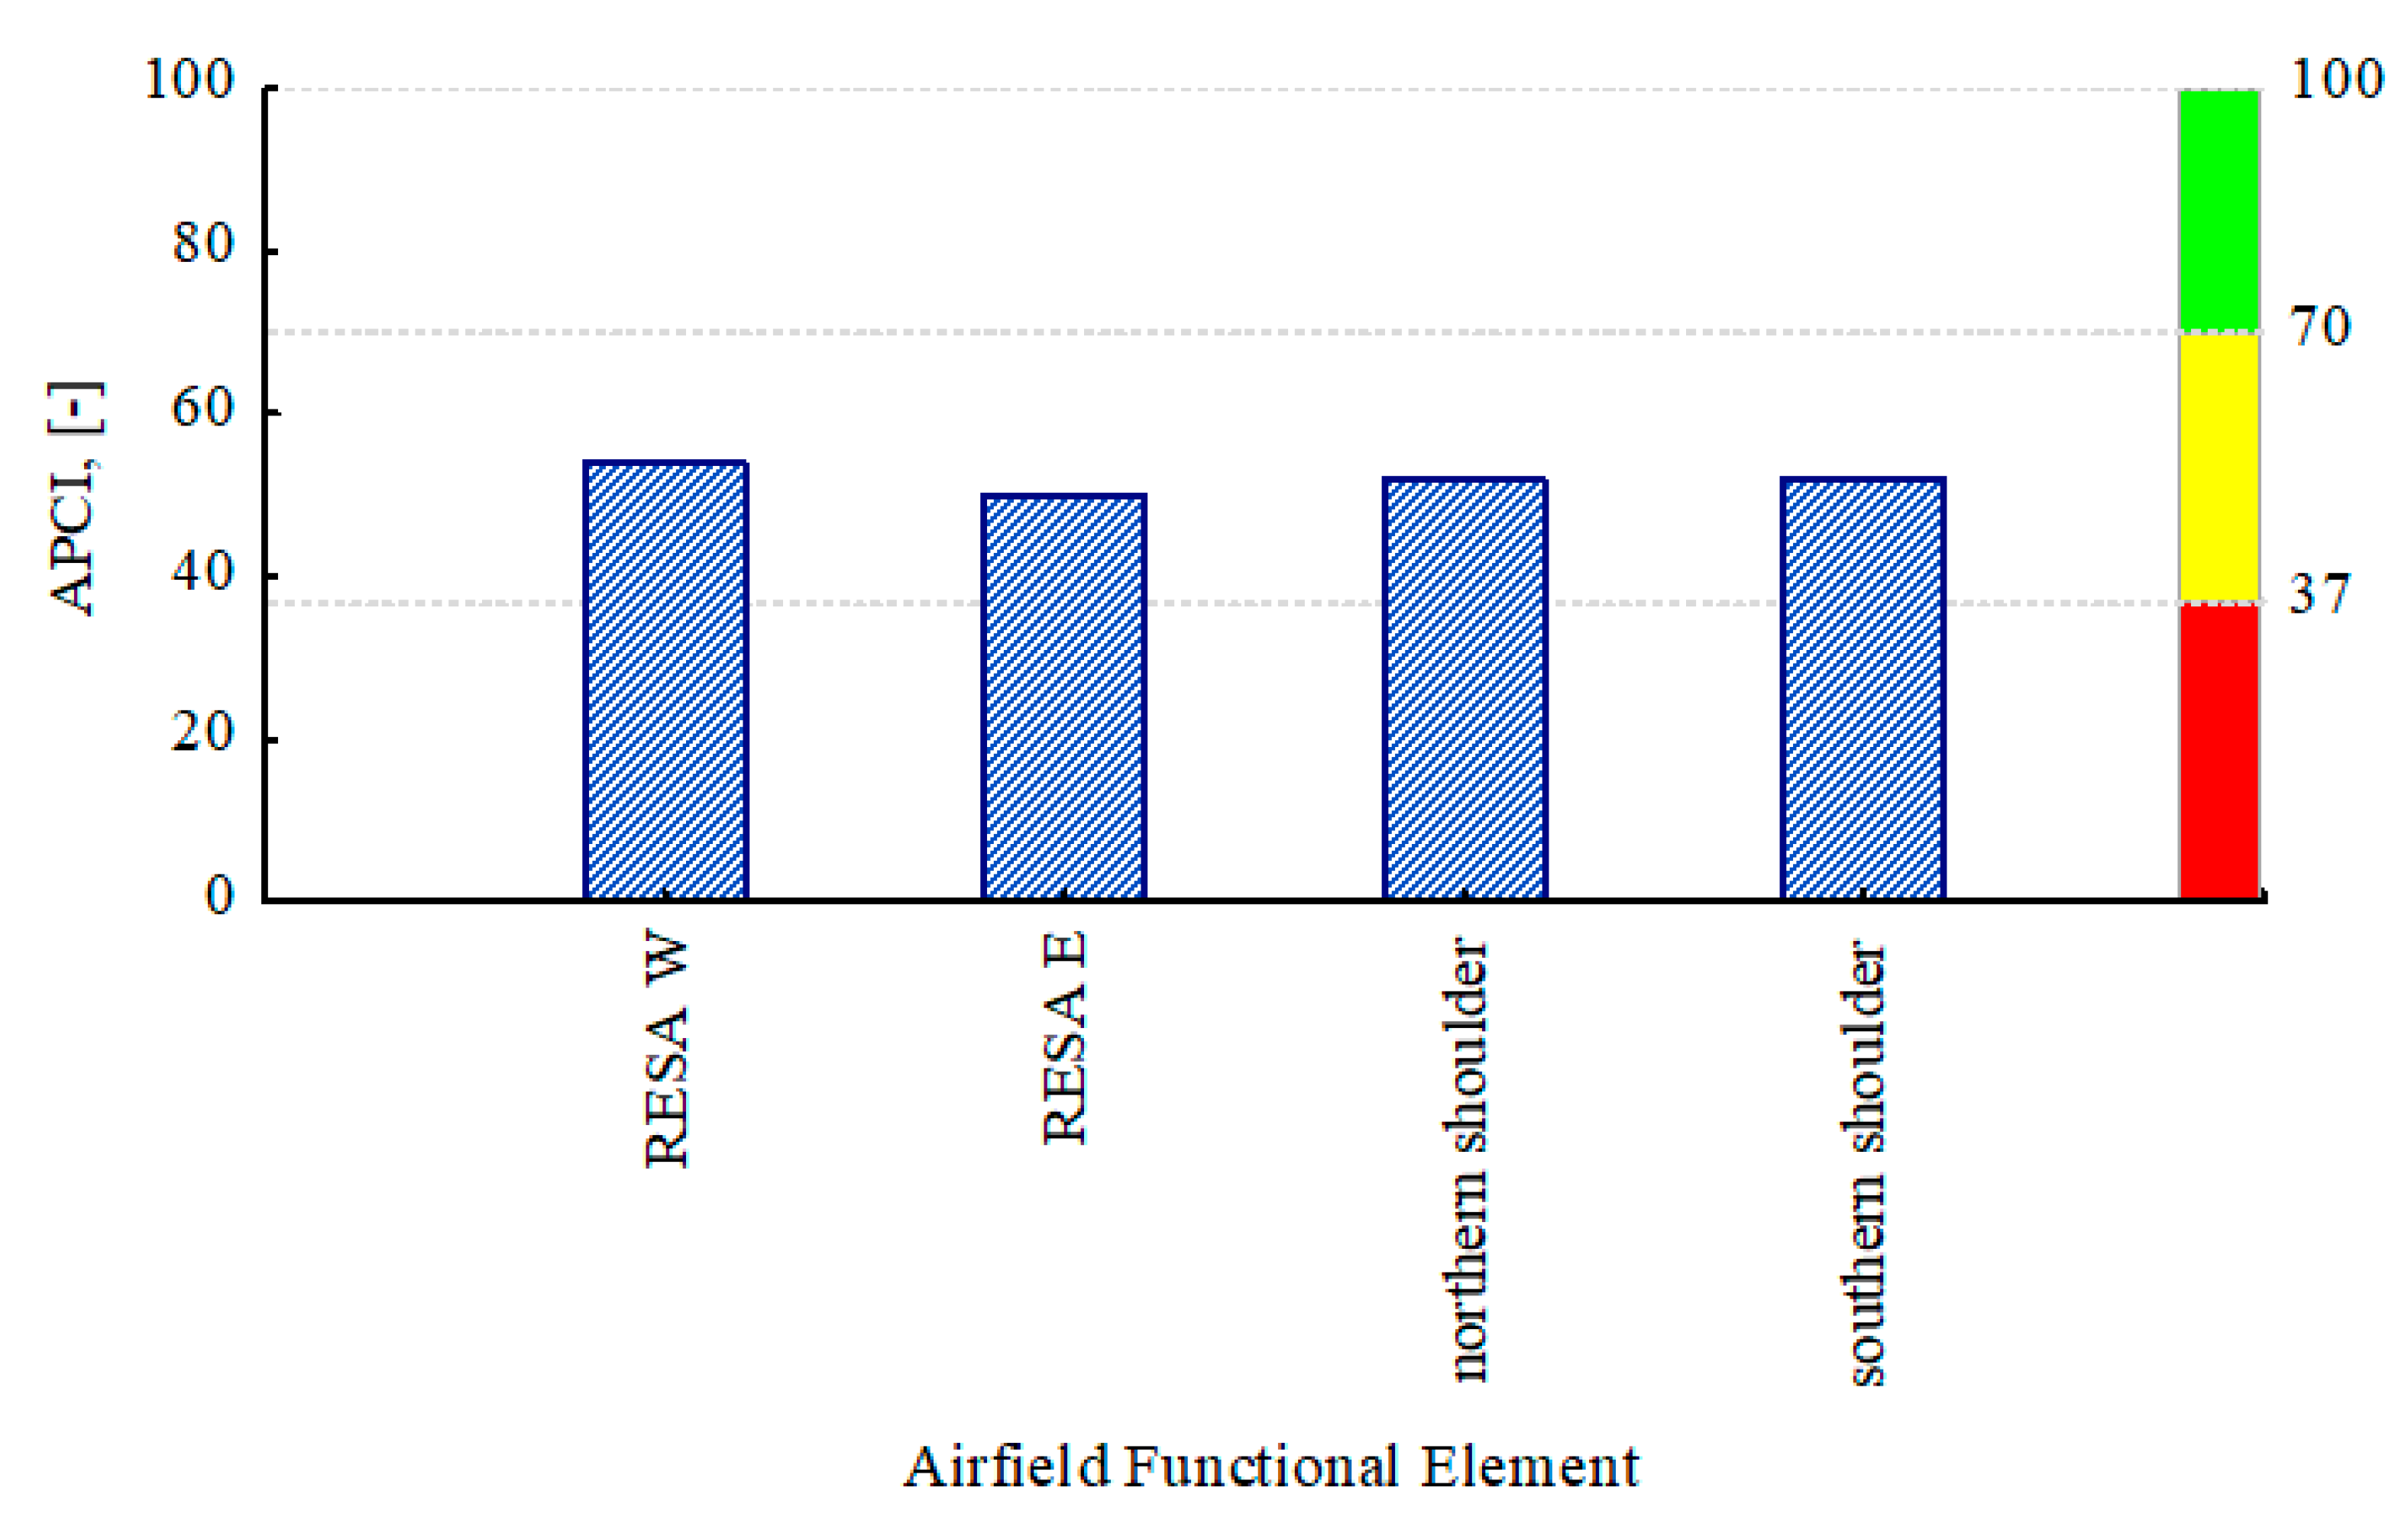
| Condition | Assessment | Definition |
|---|---|---|
| Good | 71—100 | The pavement is in good technical condition, it has little or no deteriorations and requires only routine conservation works. |
| Sufficient | 38—70 | The surface is in a sufficient technical condition, it has low and medium deteriorations. Routine and major repairs need to be carried out in a short time. |
| Bad | 0—37 | The pavement is in a bad technical condition, it has highly harmful deteriorations which cause operational problems. Maintenance work should include immediate repairs and reconstructions. |
| Airfield Functional Element (AFE) | Area (m2) |
|---|---|
| western runway end safety area (RESA W) | 31,500 |
| eastern runway end safety area (RESA E) | 31,500 |
| northern shoulder | 318,750 |
| southern shoulder | 311,000 |
| AFE | CBR, [%] | WCBR, (-) | |
|---|---|---|---|
| Layer 0–15 cm | Layer 15–85 cm | ||
| RESA_W | 9.1 | 24.2 | 0.50 |
| RESA_E | 10.7 | 16.8 | 0.46 |
| northern shoulder | 11.1 | 19.7 | 0.47 |
| southern shoulder | 10.6 | 17.3 | 0.46 |
| AFE | σ (MPa) |
|---|---|
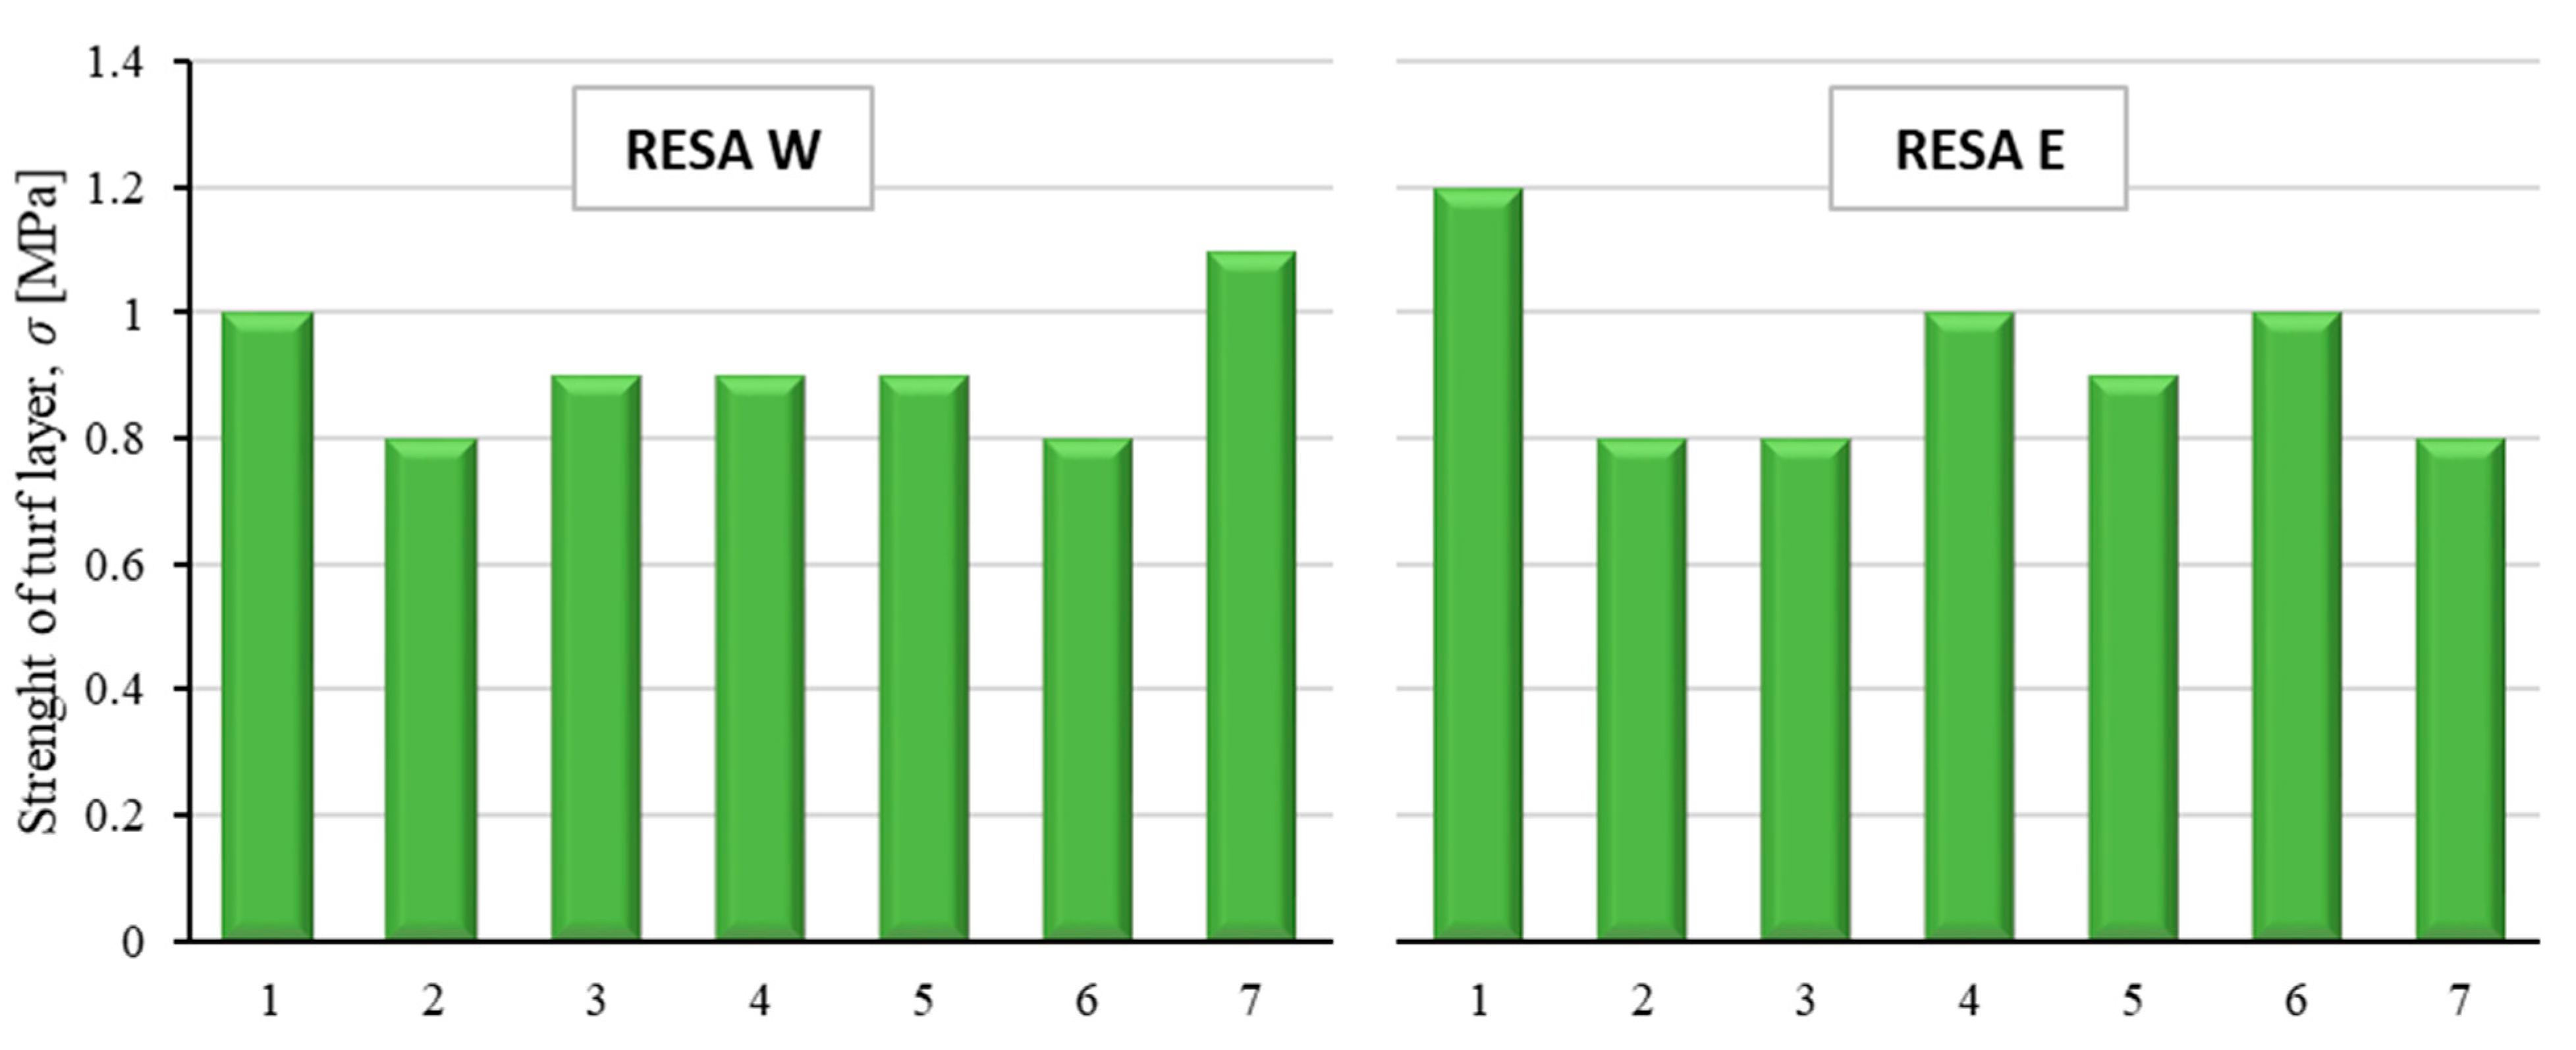
| RESA_W | 0.9 |
| RESA_E | 0.9 |
| northern shoulder | 1.0 |
| southern shoulder | 1.1 |
| AFE | σ (MPa) | WCBR (-) | APCINN (-) |
|---|---|---|---|
| RESA_W | 0.9 | 0.50 | 54 |
| RESA_E | 0.9 | 0.46 | 50 |
| northern shoulder | 1.0 | 0.47 | 52 |
| southern shoulder | 1.1 | 0.46 | 52 |
Publisher’s Note: MDPI stays neutral with regard to jurisdictional claims in published maps and institutional affiliations. |
© 2021 by the authors. Licensee MDPI, Basel, Switzerland. This article is an open access article distributed under the terms and conditions of the Creative Commons Attribution (CC BY) license (https://creativecommons.org/licenses/by/4.0/).
Share and Cite
Wesolowski, M.; Iwanowski, P. Evaluation of Natural Airfield Pavements Condition Based on the Airfield Pavement Condition Index (APCI). Appl. Sci. 2021, 11, 6139. https://doi.org/10.3390/app11136139
Wesolowski M, Iwanowski P. Evaluation of Natural Airfield Pavements Condition Based on the Airfield Pavement Condition Index (APCI). Applied Sciences. 2021; 11(13):6139. https://doi.org/10.3390/app11136139
Chicago/Turabian StyleWesolowski, Mariusz, and Pawel Iwanowski. 2021. "Evaluation of Natural Airfield Pavements Condition Based on the Airfield Pavement Condition Index (APCI)" Applied Sciences 11, no. 13: 6139. https://doi.org/10.3390/app11136139