Article

Baseline Air Monitoring of Fine Particulate Matter and Trace Elements in Ontario’s Far North, Canada

1
Environmental Monitoring and Reporting Branch, Ontario Ministry of the Environment, Conservation and Parks, 125 Resources Road, Etobicoke, ON M9P 3V6, Canada
2
Air Quality Research Division, Environment and Climate Change Canada, 335 River Road, Ottawa, ON K1A 0H3, Canada
3
Laboratory Services Branch, Ontario Ministry of the Environment, Conservation and Parks, 125 Resources Road, Etobicoke, ON M9P 3V6, Canada
*
Author to whom correspondence should be addressed.
Appl. Sci. 2021, 11(13), 6140; https://doi.org/10.3390/app11136140
Submission received: 30 May 2021 / Revised: 24 June 2021 / Accepted: 26 June 2021 / Published: 1 July 2021

Abstract

:
Large mineral deposits have been discovered in Ontario’s Far North and are being considered for further development. Particulate matter and trace elements can be emitted from potential mining activities and these air pollutants are associated with health risks and harmful to the sensitive ecosystem. An air monitoring station, powered by solar panels and a wind turbine, was established in this near-pristine area to monitor baseline levels of fine particulate matter (PM2.5) and trace elements downwind of a proposed mine site. Levels of PM2.5 and trace elements observed from 2015 to 2018 were much lower than measurements observed in southern Ontario, suggesting minimal influence of primary emissions in the study area. One episodic PM2.5 event in July 2015 was attributable to wildfire emissions in northern Ontario. Only 8 out of the 31 target elements were detected in 25% or more of the samples. Good correlations among As, Se, Pb, and Sb, between Mn and Fe, as well as between Ce and La indicated they originated from long-range atmospheric transport from the south. Ontario’s Ambient Air Quality Criteria were not exceeded for any target air pollutants. Four years of air measurements filled the data gap of baseline information in this near-pristine study area and can be used to assess impacts of potential mining activities in the future. Field operations during this study period indicated that the battery-powered air instruments and meteorological sensors worked well in the harsh environment of Ontario’s Far North even in cold winter months. The field experiences gained in this study can be applied to future air monitoring activities in harsh environments where no direct power supply is available and site access is limited.

1. Introduction

The Ring of Fire area is located in Ontario’s Far North in the James Bay Lowlands which is dominated by northern peatlands and a globally significant carbon store [1]. Large mineral deposits have been discovered in this near-pristine area including the Black Thor chromite deposit, estimated as at least 220 million tonnes of chromite, and the Eagle’s Nest nickel–copper deposit. Both deposits are being considered for further development [2,3]. It is, however, environmentally and logistically challenging to conduct mining and ore-processing activities in this sensitive ecosystem [4].
Particulate matter and trace elements can be emitted from mining activities, such as drilling, blasting, hauling, collection, and transportation [5]. Fine particulate matter (PM2.5) refers to particles with an aerodynamic diameter less than 2.5 micrometers. PM2.5 can penetrate deep into the respiratory system due to its small size. Major components of PM2.5 in southern Ontario are typically nitrate, sulphate, elemental carbon, organic matter, and particle-bound water. Higher nitrate levels are common in cold months whereas sulphate is usually more elevated during warm months [6]. PM2.5 also contains trace levels of elements [6,7], which are emitted to the environment naturally or are released from various industrial activities (e.g., mining, smelting, and combustion) [8]. Exposure to PM2.5 is associated with various health effects, including asthma, cardiovascular and lung disease, and premature death [9,10,11,12,13,14]. Some heavy metals are associated with health risks and categorized as human carcinogens [15,16,17]. The International Agency for Research on Cancer classified outdoor air pollution and particulate matter as carcinogenic to humans based on evidence of carcinogenicity in humans and experimental animals [18]. Trace elements in PM2.5 are further subject to atmospheric deposition that can lead to build-up in soils and surface waters. They are also transported over long distances by air from source regions to remote areas due to their persistence in the environment [19].
PM2.5 and trace elements are routinely monitored in populated southern Ontario to assess long-term trends and their associations with changing emissions by using continuous and integrated methods [6,20,21]. However, no air quality data were available in the Ring of Fire area. Baseline air monitoring is needed to fill the data gap and can be used to assess impacts of potential mining development on ambient levels of PM2.5 and trace elements, and to help characterize associated emissions. The long-term air monitoring stations usually have direct power supply and are easily accessible to perform routine instrument maintenance. Air instruments for PM2.5 and trace elements are housed in a temperature-controlled shelter or on a roof-top [6,20,21,22]. However, air monitoring in the near-pristine Far North encountered logistical challenges since there is neither direct power supply nor all-season roads to access the monitoring site. Furthermore, ambient temperatures can drop below −30 °C in winter months. Lack of the power supply and the harsh environment greatly limited selection of air monitoring instruments to be deployed in the field. The Ring of Fire area is accessible by winter roads during cold months and by helicopter flights, which poses constraints on regular site visits. The main objectives of this study were: (1) to establish an air monitoring platform on peatlands in the Ring of Fire area, (2) to assess field performance of battery-powered air instrumentation in the harsh environment of Ontario’s Far North, especially during the colder winter months, (3) to measure and report on baseline levels of PM2.5 and trace elements downwind of the proposed Eagle’s Nest mine site, and (4) to compare air measurements to Ontario’s Ambient Air Quality Criteria (AAQC) to determine the potential human health implications.

2. Materials and Methods

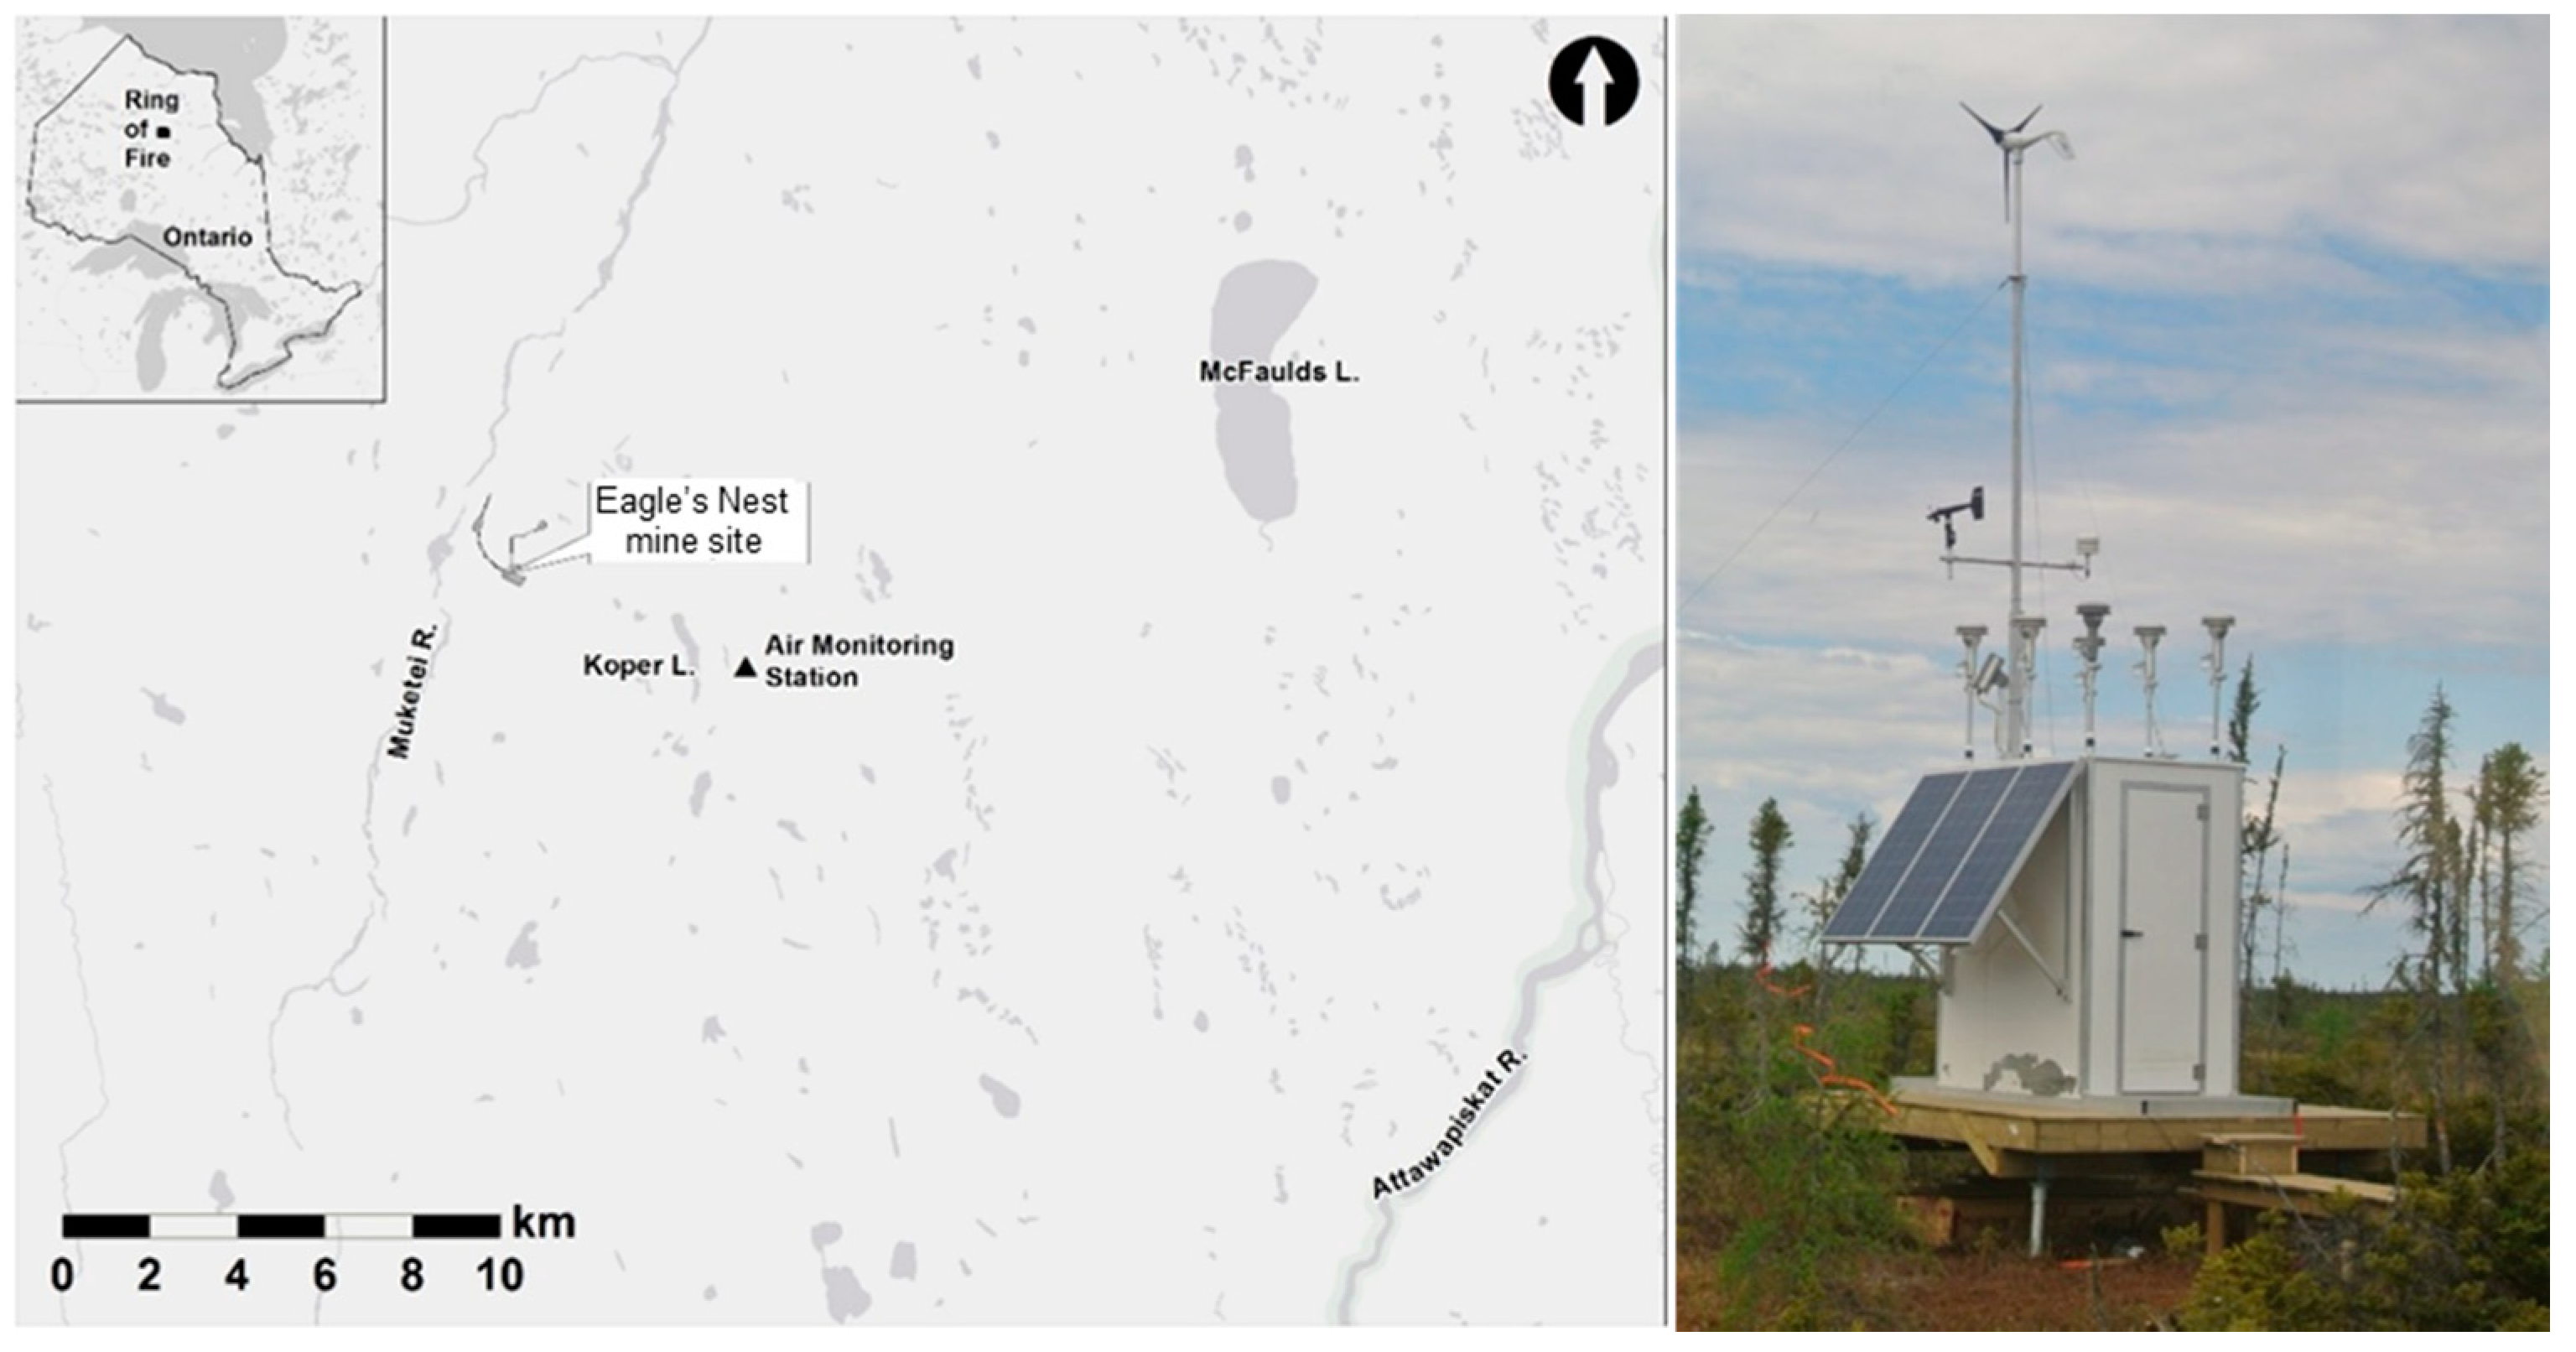
2.1. Air Monitoring Shelter

A custom aluminum shelter (4-foot width × 6-foot length × 8-foot height) was constructed to house the air monitoring instrumentation and associated power system. It was fabricated from welded structural aluminum members and included a 24-inch-wide entry door with locking mechanism and weatherproof gaskets. A 22-foot detachable telescoping fold-over aluminum mast was installed on the opposite side of the entry door where the wind turbine and meteorological sensors were deployed. A total of six watertight inlet tube fittings were fixed to the roof of the shelter to hold the sampler inlet tubes, the bases of which were further fastened to the interior walls. A data logger (Campbell Scientific CR1000) was integrated into the station and was programmed to log measurements from the station’s meteorological sensors and to monitor battery compartment temperature, as well as to control sampling events. All sampling events were initiated and controlled by the data logger according to a defined sampling schedule. The data logger was programmed with the sampling schedule, data averaging intervals, and file output formats using LoggerNet (Campbell Scientific, Logan, UT, USA).
Power for the off-grid air monitoring station was provided by three 150 W solar panels and one wind turbine with a peak output of 200 W. All power-producing components utilized a 12 VDC operating system. A total of six regenerative power batteries were equipped with the peak reserve capacity of 672 Ah. The batteries were connected to a maximum power point tracking (MPPT) charge controller to maximize solar and wind collection efficiency. A remote battery temperature sensor connected to the controller was used to optimize charging. A second controller was integrated within the power supply system to divert excess wind power. Individual batteries had a nominal rating of 6 VDC. An array of three batteries in parallel by two sets in series provided the required 12 VDC, which reduced the risk of charging imbalances and allowed the system to function with fewer than six batteries. All cables were rated for −40 °C.

2.2. Instrumentation

Six PQ100 samplers manufactured by BGI Incorporated of Waltham, Massachusetts were installed in the air monitoring shelter. The PQ100 sampler is a U.S. EPA-approved federal reference method for PM10 and capable of operating directly from a 12 VDC power source (U.S. EPA, 2011). Prior to sampling, each PQ100 sampler was calibrated for flow rate, temperature, and atmospheric pressure using a BGI DeltaCal. The PQ100 samplers were operated at a flow rate of 16.7 L per minute. Six PQ100 systems included a standard U.S. EPA PM10 size selective inlet, a PM2.5 very sharp cut cyclone (VSCC), an anodized aluminum down tube, and a 47 mm filter cassette holder. The PQ100 samplers had modular design including a pump module, microprocessor, on-screen programming, and volumetric flow control. The pump module was connected to the sample collection components via a flexible hose. The pumps were placed on a workbench and the inlet tubes/filter holders were located on the other side of the shelter. The PQ100 samplers had a customized version of BGI firmware which allowed sampling events to be controlled by the CR1000 data logger. The data logger was programmed in advance to execute all sampling events according to pre-scheduled field trips.
The meteorological sensors deployed to the air monitoring shelter included a RM Young Model 05103-45 Alpine Wind Sensor, and a Model 083 combined ambient temperature/relative humidity sensor from Met One Instruments. In September 2016, a Vaisala weather transmitter WXT 520 was installed to concurrently monitor wind speed, wind direction, ambient temperature, and relative humidity. All meteorological sensors were mounted on the cross-arm of the wind turbine mast.

2.3. Establishment of the Air Monitoring Station

The air monitoring station established in the Ring of Fire area was located at 52°42′45.33″ N/86°13′40.92″ W, southeast of the proposed Eagle’s Nest mine site (Figure 1). The air shelter and sampling systems were tested in Toronto and then transported to the Far North using winter roads in March 2015. The station was established in June 2015 in a bog area east of Koper Lake. Four galvanized screw piles (3-inch diameter × 11-foot length) were installed approximately 9 feet below the ground surface as supporting points, and a wood deck (10-foot width × 10-foot length) was built on top of the screw piles. A board walk (1.5-foot width × 40-foot length) was built between the air station and a helicopter pad to minimize the impact on the surrounding vegetation and helicopter exhaust/helicopter downwash on the ambient air monitoring. The shelter was placed on the wood deck using a helicopter.

2.4. Air Sampling and Laboratory Analysis

The Environment and Climate Change Canada (ECCC) National Air Pollution Surveillance (NAPS) program collects 24 h integrated samples to determine ambient levels of particulate matter and elements across Canada on a 6-day or 3-day basis [6]. Where possible, the air sampling in the Ring of Fire was scheduled on days when NAPS air samples were collected so that the analytical results could be compared with other monitoring locations in southern Ontario. Samples were kept in ice-packed coolers during transportation and stored in the fridge in the lab.
Particulate mass was measured by weighing the Teflon filters before and after the field sampling using a microbalance (Mettler-Toledo MX5, Highstown, NJ, USA) by the ministry’s Laboratory Services Branch (LaSB) [23]. Prior to measurements, the microbalance room was maintained at a temperature of 20–26 °C with the relative humidity controlled at 37–47% over a 60 h period. The air filters collected in 2015–2017 were further analyzed for 25 elements using acid digestion and inductively-coupled plasma mass spectrometry (ICP-MS) by ECCC’s NAPS lab, including beryllium (Be), aluminum (Al), titanium (Ti), vanadium (V), chromium (Cr), manganese (Mn), iron (Fe), cobalt (Co), nickel (Ni), copper (Cu), zinc (Zn), arsenic (As), selenium (Se), strontium (Sr), molybdenum (Mo), silver (Ag), cadmium (Cd), tin (Sn), antimony (Sb), barium (Ba), lanthanum (La), cerium (Ce), thallium (Tl), lead (Pb), and uranium (U). Details of the analytical method for the elements are reported elsewhere [6,24]. The air filters collected in 2018 were analyzed by LaSB for 29 elements, mainly the ones listed above, with the inclusion of boron (B), phosphorus (P), sulfur (S), calcium (Ca), palladium (Pd), and platinum (Pd), but not La and Ce.

2.5. Quality Assurance and Quality Control (QA/QC)

Meteorological measurements and diagnostics data were retrieved weekly from the air monitoring station via a satellite modem. The continuous meteorological measurements from the RM Young and Vaisala WXT 520 instruments were reviewed and compared to identify any anomalies which were invalidated accordingly. Analytical results for the PM2.5 mass and elements came with flags/comments associated with individual samples which were used to validate the analytical results. Twenty-nine travel blanks were collected to track potential contamination associated with the pre-treatment of the air filters, transportation between the lab and the air monitoring station, field sampling, and laboratory analyses. The blanks were treated as regular air samples for analytical purposes. Method detection limits (MDLs) for the entire process (including the sampling and lab analyses) were calculated from the mean of the blanks plus three times the standard deviation by applying a nominal air volume of 24 m3. Prior to the calculation, outliers were identified by the Chauvenet’s criterion statistical test [25]. All analytical data were compared against individual MDLs (Table S1). Data below the MDLs were replaced with ½ MDLs.

2.6. Conditional Probability Function

The conditional probability function (CPF) was employed to identify potential sources of air pollutants measured at the air monitoring station [26,27,28]. The CPF gives the direction(s) of potential sources but does not identify a specific geographic location. Conditional probability models compute the likelihood of an air mass impacting a downwind receptor with a high concentration of a given pollutant [29,30]. The threshold for the definition of “high concentration” in many studies, e.g., the 75th percentile, is usually arbitrary and may be an over-simplification. The CPF is an extension of the potential source contribution function (PSCF) model and was used for the surface meteorological data collected at the air monitoring station (i.e., the receptor). For a given air mass arriving at the receptor from a given wind sector characterized by the angle Δθ, CPF is defined as follows.
CPFΔθ = mΔθ/nΔθ
where nΔθ is the total number of times air masses arrive from sector Δθ (set at 10° and multiples thereof here) and mΔθ is the number of times the air masses that arrive from Δθ are greater than the pre-defined criterion/threshold value (in this case, median of the element concentrations > MDL). For those wind sectors with few events (nΔθ value less than the average number of events per sector), the CPF value was down-weighted by a factor of 0.5. In simpler terms, the CPF of a given pollutant can be thought of as its pollution rose normalized by the wind rose. The CPF indicates probabilities of potential sources to the receptor and is thus unitless [31].

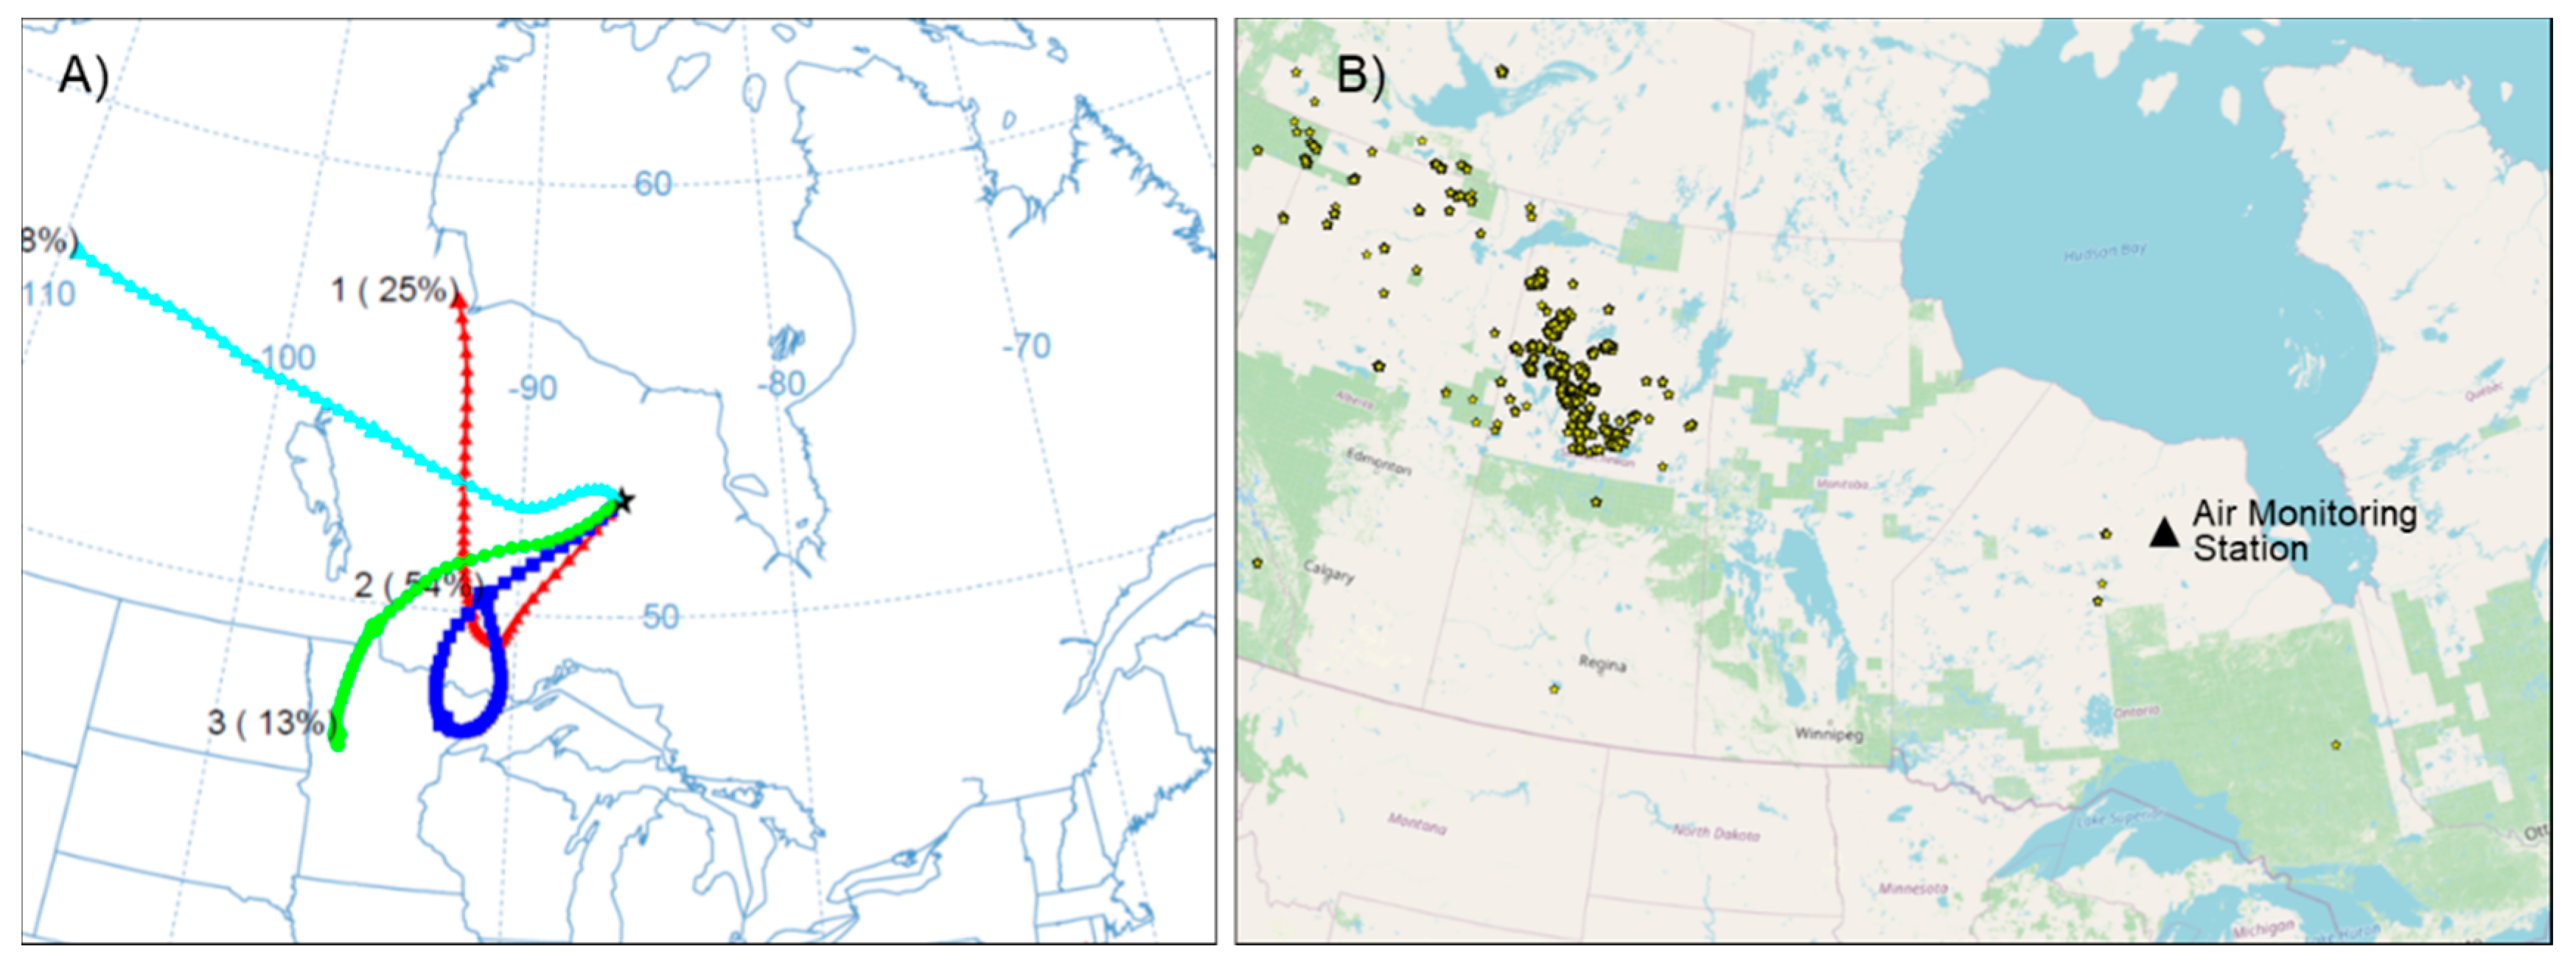
2.7. Air Mass Back-Trajectories and Analysis

Three-day back-trajectories were obtained from NOAA’s Hybrid Single-Particle Lagrangian Integrated Trajectory model with an arrival height of 500 m above the ground once every hour over the 24 h periods of interest (5 July and 26 September 2015) discussed in the subsequent section. A K-means clustering algorithm [32,33] was then applied to the twenty-four air mass back-trajectories to group them based on similar wind directions and speeds.

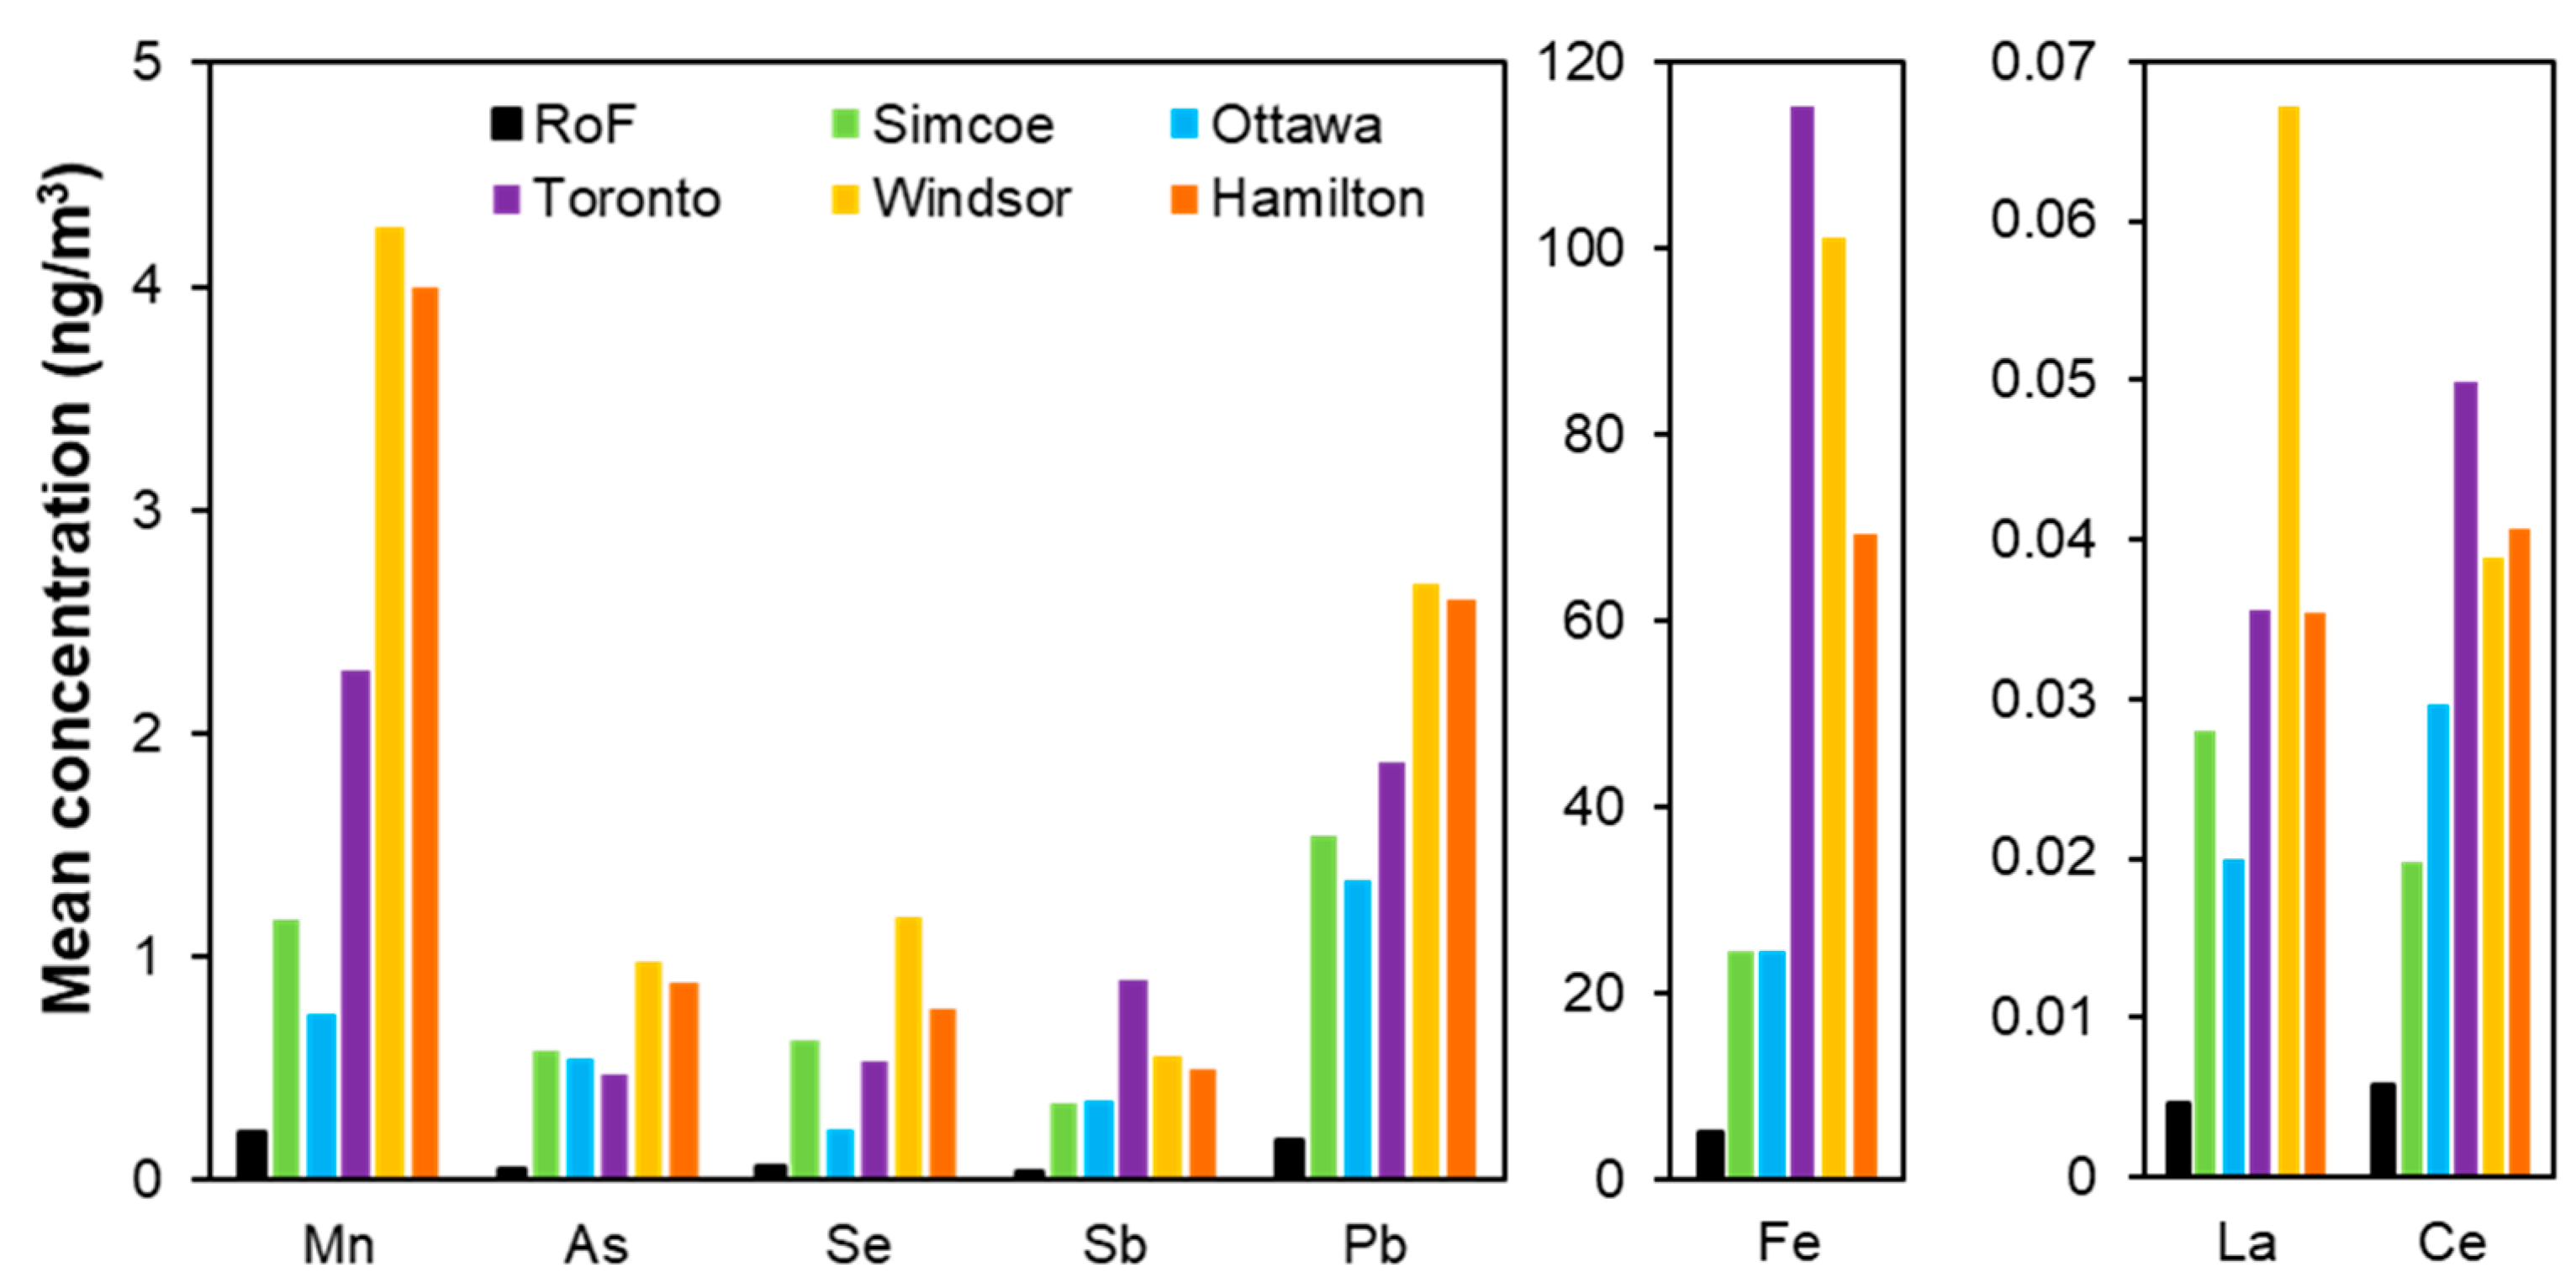
3. Results and Discussion

The RM Young wind monitor was in operation from June 2015 to 2018 to measure hourly wind speed and wind direction. By removing calm winds (i.e., wind speeds of 1 m/s or less), wind roses at the air station showed that the predominant winds were from north/south in spring (Figure 2A), north/southwest in summer (Figure 2B), and northwest/southwest in fall (Figure 2C) and winter (Figure 2D). When winds came from the northwest, the air monitoring station was downwind of the proposed Eagle’s Nest mine site (Figure 1); therefore, long-term air monitoring at this location could shed light on the impacts of the proposed mining activities on ambient levels of air pollutants and the characteristics of air-related emissions.
As indicated earlier, the RM Young and Vaisala WXT 520 instruments were co-located from September 2016 to February 2018 to test and compare their suitability for remote deployments. The concurrent measurements indicated nearly identical wind directions, i.e., mostly originating from the northwest and southwest directions (Figure 2E,F). Both instruments worked well in cold temperatures except that the Vaisala device recorded a few hours of “0” values for wind speed and direction when temperatures were close to the freezing point or a few degrees below it. It is believed that these abnormal readings were likely related to freezing raining and/or ice accumulated on the top of the Vaisala device.
Measurements of hourly temperature and relative humidity were conducted concurrently using the Met One and Vaisala WXT520 instruments. Data comparison showed that temperatures were fairly comparable between the two instruments and linearly correlated (slope 0.98, intercept −1.1, and R2 0.99). However, the Met One device recorded temperatures a few degrees higher than the Vaisala sensor on a few occasions. Comparison to the meteorological measurements collected by Environment and Climate Change Canada at Lansdowne House (52°11′44″ N 87°56′3″ W) suggests that temperatures were overestimated by the Met One device during those occasional events. Measurements from the Vaisala instrument showed that ambient temperatures ranged from −38 to 31 °C from September 2016 to February 2018. The low temperatures provided a good opportunity to test the off-grid air monitoring equipment. Overall, all meteorological instruments deployed at the air monitoring station worked well in collecting hourly data even in cold temperatures. Similarly, RH measurements by the two instruments were comparable and linearly correlated (slope 1.0, intercept 2.6, and R2 0.97). Since there are limited meteorological measurements in this remote location, concurrent measurements using different instruments are valuable to validate the data and evaluate the field performance of these instruments.
A total of 46 air samples collected in 2015–2018 were analyzed for PM2.5 mass and trace elements. Table 1 summarizes statistics for 24 h concentrations of PM2.5 and eight individual trace elements (Mn, Fe, As, Se, Sb, La, Ce, and Pb). A complete list for all target elements and concentrations in individual samples can be found in Table S1 of the Supplementary Materials. PM2.5 was found above the MDL in 63% of the samples, ranging from 0.75 to 19 µg/m3, with an average of 3.0 µg/m3 and a median of 2.2 µg/m3. PM2.5 was monitored hourly at the ministry’s Air Quality Health Index (AQHI) air monitoring stations in southern Ontario that include both urban and rural locations [34]. The average PM2.5 concentration for samples collected at the Ring of Fire station was lower than those observed at the AQHI stations in southern Ontario (Figure 3). PM2.5 measurements generally reflected regional background levels in this near-pristine area with fewer contributions from primary emissions.
The maximum PM2.5 concentration was observed on 5 July 2015. Potential source regions for this elevated event were assessed by analyzing air mass back-trajectories. The 24 three-day back-trajectories obtained for this day were then grouped into four clusters based on similar wind directions and speeds by K-means clustering. The four clusters suggested that the air mass mostly originated from the southwest and west before it arrived at the air station (Figure 4A). The Canadian Wildland Fire Information System showed that active wildfires were reported west of the air monitoring station during this time period (Figure 4B). The only element with elevated concentrations in this day was Cd, which has been reported to be related with forest fires emissions [35,36,37]. Therefore, the episodic PM2.5 concentration likely arose from wildfires in northern Canada. The maximum 24 h PM2.5 concentrations ranged from 13 to 53 µg/m3 in 2015–2018 among the AQHI stations in southern Ontario. The maximum PM2.5 concentration (i.e., 19 µg/m3) observed in the Ring of Fire area was within this range.
Levels of elements were fairly low in all air samples and mostly below the method detection limits. Eight of them were detected in 25% or more of the samples, including Mn, Fe, As, Se, Sb, La, Ce, and Pb. Total chromium (including hexavalent chromium) was only detected in three samples and concentrations ranged from 0.46 to 0.62 ng/m3 (Table S1), indicating that the Black Thor chromite deposit had little impact on regional air quality.
Ontario’s AAQC are based on protection against adverse effects on human health or the environment [38]. Twenty-four-hour AAQCs for the total suspended particulate (TSP) fraction are available for 25 of the 31 analyzed elements. In addition, 24 h AAQCs for the PM10 fraction are available for Mn, Ni, and U, and a 24 h AAQC for the PM2.5 fraction is available for Mn. The comparison among Mn’s AAQCs reveals that the AAQC for the TSP fraction is two times that of the AAQC for the PM10 fraction and four times that of the AAQC for the PM2.5 fraction. Therefore, the 24 h AAQC for the PM2.5 fraction were calculated from the TSP fraction using a conversion factor of 4 as shown in Table S1. No target elements were found to exceed these calculated 24 h AAQCs (in ng/m3) for the PM2.5 fraction in any of the air samples.
Trace elements in PM2.5 were routinely monitored at five stations in southern Ontario [6,28]. Average concentrations from June 2015 to February 2018 for eight select elements at the Ring of Fire monitoring station were much lower than those observed in southern Ontario (Figure 5). Multiple-year measurements of trace elements in PM2.5 showed that potential sources of these elements in southern Ontario included local and transboundary sources of coal combustion (enriched in sulphate, nitrate, and Se), non-ferrous metal smelting (As and Pb), and steel making (Fe, Mn and Zn) [31]. Fe is also emitted from traffic in urban communities like Toronto and Hamilton [21].
Ambient levels of As, Se, Pb, and Sb were found to be highly correlated when these elements were concurrently detected (Figure 6A–C), suggesting common emission sources. Worldwide, coal burning is an anthropogenic source of many toxic elements in air. Xie et al. [39] previously reported good correlation between As and Se in PM10 collected in Taiyuan where raw coals are largely produced and consumed. As, Se, and Sb were found in airborne particles near coal-fired power generation stations [40,41]. Similarly, Mn and Fe were found to correlate well when both were detected (Figure 6D), potential sources of which include iron and steel industries [42,43], coal-fired power generation [44], and coal mining [5]. In the present study, these elements are attributable to long-range atmospheric transport input from source regions since there are currently no industrial activities in the Ring of Fire area.
La and Ce are light rare earth elements (REEs) naturally found in the upper continental crust (UCC). Wind can blow small particles containing REEs from the earth’s surface to the atmosphere. La and Ce have similar physical-chemical properties and they are often found together. The ratio of La to Ce in UCC was reported to be around 0.5 [45]. La and Ce are also contained in cracking catalysts used by petroleum refineries [46,47]. The catalyst material is released to air during the refinery process. Consequently, La and Ce were found in airborne particulate matter [46,48,49,50]. The La/Ce ratio from fluid catalytic cracking (FCC) units is enriched and generally higher than 1 [46,51]. La-enrichment factors in particulate matter were used to trace emissions from the petroleum refining industry [51]. Both La and Ce were detected in 16 out of the 40 samples collected in the Ring of Fire area and they were linearly correlated (Figure 6E). La/Ce ratios ranged from 0.5 to 1.5 with mean 0.8 and median 0.7. The wide range of the ratios indicates mixed sources of La and Ce in this area. The median ratio 0.7 aligns well with the median 0.69 observed at six air monitoring stations across Canada [51]. The highest La/Ce ratio of 1.5 in the Ring of Fire area was observed on September 26, 2015. Levels of other metals were elevated in this sample as well (e.g., Mn, As, Se, Sb, and Pb). Transportation and transformation in the atmosphere do not change the La/Ce ratio given their similar physical-chemical properties. Four clusters of back-trajectories for this 24 h sampling period suggest that elevated trace elements likely originated from long-range transport from the Great Lakes region (Figure 6F).
Figure 7 shows CPF plots for PM2.5 and select elements to identify directions of potential sources at the Ring of Fire station (i.e., the receptor) when their concentrations were above the MDLs by using the entire dataset. Potential sources of these pollutants appeared similar and originated from the southwest and southern directions. No potential sources were identified from the northwest where the proposed Eagle’s Nest mine site is located. Given few local emission sources in the Far North, these pollutants could be related to long-range atmospheric transport from low latitudes where there are industrial and traffic emissions.

4. Conclusions

An off-grid air monitoring station was established in a remote and near-pristine location in Ontario’s Far North to monitor regional background levels of PM2.5 and trace elements using a system powered by batteries and recharged with solar and wind power. The shelter was built on a solid permafrost layer approximately 9 feet below the ground level and did not experience any shifting of its position due to the freeze–thaw cycles. The six batteries provided enough power to run air and meteorological instrumentation even in cold winter conditions. However, the batteries were incapable of fully charging after four winters in the field and were replaced as part of the station maintenance. The PQ100 samplers ran well year-round except for a few samples that collected an air volume that was less than the target of 24 m3. In these instances, the samplers stopped in the middle of a sampling event during the winter, presumably due to less sunlight and consequently less battery power. A power monitor is recommended to better manage the power supply especially during winter months when daytime is short and temperatures are low.
A total of 46 air samples and hourly meteorological data were collected from 2015 to 2018. The data collected in 2015–2018 are representative of baseline levels of PM2.5 and trace elements in this region. These measurements can be used to assess the impacts of mining activities on ambient air quality should the proposed development occur. The dominant winds were found to be from the northwest and southwest indicating that the air monitoring station was generally located downwind of the proposed Eagle’s Nest mine site and is thus suitable for assessing the potential impacts of the proposed mining activities on regional air quality. PM2.5 concentrations were generally lower than measurements at AQHI monitoring stations in southern Ontario, suggesting minimal influence of local primary emissions. The maximum 24 h PM2.5 concentration was 19 µg/m3, which was attributable to wildfire emissions in northern Ontario.
Levels of trace elements were quite low and only 8 out of the 31 quantified elements were detected in 25% or more of the samples. Concentrations were lower than those observed at stations in southern Ontario during 2015–2018. The monitoring data were further compared against calculated 24 h AAQCs to assess health implications of air pollutants. No target elements were found to exceed these calculated 24 h AAQCs (in ng/m3) for the PM2.5 fraction in any of the air samples. Ambient levels of As, Se, Pb, and Sb were highly correlated, suggesting common emission sources of these elements likely from long-range transport of coal combustion emissions. Similarly, good correlation between Mn and Fe suggests common sources, likely associated with iron and steel industries and coal combustion. The potential sources of PM2.5 and seven elements appeared fairly similar with potential sources from southwestern and southern directions. No potential sources were identified from the proposed Eagle’s Nest mine site. Given little local emission sources in Ontario’s Far North, these pollutants are attributable to long-range atmospheric transport from the south.
Measurements from 2015 to 2018 showed that the air instruments and meteorological sensors worked well in the harsh environment of Ontario’s Far North. Field experience gained over the course of this monitoring campaign can help future air monitoring efforts in other similarly challenging environments.

Supplementary Materials

The following is available online at https://www.mdpi.com/article/10.3390/app11136140/s1, Table S1: Air concentrations of PM2.5 (µg/m3) and elements (ng/m3) in individual samples.

Author Contributions

Y.S., U.S., A.M., M.N., C.C. and A.T. contributed to the study design and field work. V.C., E.D.-Z., A.K. and T.S. led the laboratory analyses. Y.S., U.S. and A.M. led the data analyses and manuscript preparation. All authors contributed to data interpretation, provided critical revisions to the manuscript, and approved the final version. All authors have read and agreed to the published version of the manuscript.

Funding

This work was funded by Ontario Ministry of the Environment, Conservation and Parks.

Data Availability Statement

The data presented in this study are available on request from the corresponding author. The data are not publicly available and will be posted on Ontario’s Open Data Catalogue.

Acknowledgments

Environment and Climate Change Canada’s National Air Pollution Surveillance program is acknowledged for the trace elements data collected in southern Ontario.

Conflicts of Interest

The authors declare no conflict of interest.

References

  1. Packalen, M.S.; Finkelstein, S.A.; McLaughlin, J.W. Carbon storage and potential methane production in the Hudson Bay Lowlands since mid-Holocene peat initiation. Nat. Commun. 2014. [Google Scholar] [CrossRef] [PubMed] [Green Version]
  2. Chong, J. Resource Development in Canada: A Case Study on The Ring of FIRE (Background Paper); Library of Parliament: Ottawa, ON, Canada, 2014; Available online: https://epe.lac-bac.gc.ca/100/201/301/weekly_checklist/2014/internet/w14-26-U-E.html/collections/collection_2014/bdp-lop/bp/2014-17-eng.pdf (accessed on 30 June 2021).
  3. Hjartarson, J.; McGuinty, L.; Boutilier, S.; Majernikova, E. Beneath the surface: Uncovering the economic potential of Ontario’s Ring of Fire; Ontario Chamber of Commerce Canada: Torono, ON, Canada, 2014. [Google Scholar]
  4. Beukes, J.P.; du Preez, S.P.; van Zyl, P.G.; Paktunc, D.; Fabritius, T.; Päätalo, M.; Cramer, M. Review of Cr (VI) environmental practices in the chromite mining and smelting industry–Relevance to development of the Ring of Fire, Canada. J. Clean. Prod. 2017. [Google Scholar] [CrossRef]
  5. Pandey, B.; Agrawal, M.; Singh, S. Assessment of air pollution around coal mining area: Emphasizing on spatial distributions, seasonal variations and heavy metals, using cluster and principal component analysis. Atmos. Pollut. Res. 2014. [Google Scholar] [CrossRef] [Green Version]
  6. Dabek-Zlotorzynska, E.; Dann, T.F.; Kalyani Martinelango, P.; Celo, V.; Brook, J.R.; Mathieu, D.; Ding, L.; Austin, C.C. Canadian National Air Pollution Surveillance (NAPS) PM2.5speciation program: Methodology and PM2.5chemical composition for the years 2003–2008. Atmos. Environ. 2011. [Google Scholar] [CrossRef]
  7. Saffari, A.; Daher, N.; Shafer, M.M.; Schauer, J.J.; Sioutas, C. Seasonal and spatial variation in reactive oxygen species activity of quasi-ultrafine particles (PM0.25) in the Los Angeles metropolitan area and its association with chemical composition. Atmos. Environ. 2013. [Google Scholar] [CrossRef]
  8. Nriagu, J.O. A global assessment of natural sources of atmospheric trace metals. Nature 1989. [Google Scholar] [CrossRef]
  9. Atkinson, R.W.; Kang, S.; Anderson, H.R.; Mills, I.C.; Walton, H.A. Epidemiological time series studies of PM2.5 and daily mortality and hospital admissions: A systematic review and meta-analysis. Thorax 2014. [Google Scholar] [CrossRef] [Green Version]
  10. Brunekreef, B.; Holgate, S.T. Air pollution and health. Lancet 2002. [Google Scholar] [CrossRef]
  11. Kim, K.-H.; Kabir, E.; Kabir, S. A review on the human health impact of airborne particulate matter. Environ. Int. 2015. [Google Scholar] [CrossRef]
  12. Landrigan, P.J.; Fuller, R.; Acosta, N.J.R.; Adeyi, O.; Arnold, R.; Basu, N.N.; Baldé, A.B.; Bertollini, R.; Bose-O’Reilly, S.; Boufford, J.I.; et al. The Lancet Commission on pollution and health. Lancet 2018. [Google Scholar] [CrossRef] [Green Version]
  13. Lu, F.; Xu, D.; Cheng, Y.; Dong, S.; Guo, C.; Jiang, X.; Zheng, X. Systematic review and meta-analysis of the adverse health effects of ambient PM2.5 and PM10 pollution in the Chinese population. Environ. Res. 2015. [Google Scholar] [CrossRef]
  14. Pope, C.A.; Ezzati, M.; Dockery, D.W. Fine-Particulate Air Pollution and Life Expectancy in the United States. N. Engl. J. Med. 2009. [Google Scholar] [CrossRef] [Green Version]
  15. Jaishankar, M.; Tseten, T.; Anbalagan, N.; Mathew, B.B.; Beeregowda, K.N. Toxicity, mechanism and health effects of some heavy metals. Interdiscip. Toxicol. 2014. [Google Scholar] [CrossRef] [Green Version]
  16. Järup, L. Hazards of heavy metal contamination. Br. Med. Bull. 2003. [Google Scholar] [CrossRef] [Green Version]
  17. Tchounwou, P.B.; Yedjou, C.G.; Patlolla, A.K.; Sutton, D.J. Heavy metal toxicity and the environment. Mol. Clin. Environ. Toxicol. 2012. [Google Scholar] [CrossRef] [Green Version]
  18. Loomis, D.; Grosse, Y.; Lauby-Secretan, B.; El Ghissassi, F.; Bouvard, V.; Benbrahim-Tallaa, L.; Guha, N.; Baan, R.; Mattock, H.; Straif, K.; et al. The carcinogenicity of outdoor air pollution. Lancet Oncol. 2013. [Google Scholar] [CrossRef]
  19. Duce, R.A.; Tindale, N.W. Atmospheric transport of iron and its deposition in the ocean. Limnol. Oceanogr. 1991. [Google Scholar] [CrossRef]
  20. Su, Y.; Sofowote, U.; Debosz, J.; White, L.; Munoz, A. Multi-year continuous PM2.5 measurements with the Federal Equivalent Method SHARP 5030 and comparisons to filter-based and TEOM measurements in Ontario, Canada. Atmosphere 2018, 9, 191. [Google Scholar] [CrossRef] [Green Version]
  21. Sofowote, U.M.; Di Federico, L.M.; Healy, R.M.; Debosz, J.; Su, Y.; Wang, J.; Munoz, A. Heavy metals in the near-road environment: Results of semi-continuous monitoring of ambient particulate matter in the greater Toronto and Hamilton area. Atmos. Environ. X 2019. [Google Scholar] [CrossRef]
  22. Ambient Air Monitoring and Quality Assurance/Quality Control Guidelines-National Air Pollution Surveillance Program. Canadian Council of Ministers of the Environment. 2019. Available online: ccme.ca/en/res/ambientairmonitoringandqa-qcguidelines_ensecure.pdf (accessed on 30 June 2021).
  23. The Determination of Suspended Particulates on Low-Volume Teflon Filters (46.2 mm Diameter) by Gravimetry, Ministry of the Environment and Climate Change, Toronto. 2017. Available online: http://hkadtmk.org/wcac2019/files/downloads/WCAC2019-Abstract-Book.pdf (accessed on 30 June 2021).
  24. Celo, V.; Ewa Dabek-Zlotorzynska, E.D.-Z.; Mathieu, D.; Okonskaia, I. Validation of a Simple Microwave-Assisted Acid Digestion Method Using Microvessels for Analysis of Trace Elements in Atmospheric PM2.5 in Monitoring and Fingerprinting Studies. Open Chem. Biomed. Methods J. 2010, 3, 141–150. [Google Scholar] [CrossRef] [Green Version]
  25. Kennedy, J.B.; Neville, A. Basic Statistical Methods for Engineers and Scientists; Thomas, Y., Ed.; Crowell Company: New York, NY, USA, 1976. [Google Scholar]
  26. Kim, E.; Hopke, P.K.; Edgerton, E.S. Source identification of atlanta aerosol by positive matrix factorization. J. Air Waste Manag. Assoc. 2003. [Google Scholar] [CrossRef] [PubMed] [Green Version]
  27. Kim, E.; Hopke, P.K.; Kenski, D.M.; Koerber, M. Sources of fine particles in a rural Midwestern U.S. Area. Environ. Sci. Technol. 2005. [Google Scholar] [CrossRef]
  28. Pekney, N.; Davidson, C.; Zhou, L.; Hopke, P. Application of PSCF and CPF to PMF-modeled sources of PM2.5 in Pittsburgh. Aerosol Sci. Technol. 2006. [Google Scholar] [CrossRef] [Green Version]
  29. Ashbaugh, L.L.; Malm, W.C.; Sadeh, W.Z. A residence time probability analysis of sulfur concentrations at grand Canyon National Park. Atmos. Environ. 1985. [Google Scholar] [CrossRef]
  30. Cheng, M.D.; Hopke, P.K.; Barrie, L.; Rippe, A.; Olson, M.; Landsberger, S. Qualitative Determination of Source Regions of Aerosol in Canadian High Arctic. Environ. Sci. Technol. 1993. [Google Scholar] [CrossRef]
  31. Sofowote, U.M.; Su, Y.; Dabek-Zlotorzynska, E.; Rastogi, A.K.; Brook, J.; Hopke, P.K. Sources and temporal variations of constrained PMF factors obtained from multiple-year receptor modeling of ambient PM2.5data from five speciation sites in Ontario, Canada. Atmos. Environ. 2015. [Google Scholar] [CrossRef]
  32. Abdalmogith, S.S.; Harrison, R.M. The Use of Trajectory Cluster Analysis to Examine the Long-Range Transport of Secondary Inorganic Aerosol in the UK. Atmos. Environ. 2005. [Google Scholar] [CrossRef] [Green Version]
  33. Dorling, S.R.; Davies, T.D.; Pierce, C.E. Cluster analysis: A technique for estimating the synoptic meteorological controls on air and precipitation chemistry-Method and applications. Atmos. Environ. Part A. Gen. Top. 1992. [Google Scholar] [CrossRef]
  34. Air Quality in Ontario 2018 Report. Ministry of the Environment, Conservation and Parks. Available online: https://www.ontario.ca/document/air-quality-ontario-2018-report (accessed on 30 June 2021).
  35. Hutton, M. Sources of cadmium in the environment. Ecotoxicol. Environ. Saf. 1983, 7. [Google Scholar] [CrossRef]
  36. Nriagu, J.O. Global inventory of natural and anthropogenic emissions of trace metals to the atmosphere. Nature 1979. [Google Scholar] [CrossRef]
  37. Williams, C.R.; Harrison, R.M. Cadmium in the atmosphere. Experientia 1984. [Google Scholar] [CrossRef]
  38. Ontario’s Ambient Air Quality Criteria (Sorted by Contaminant Name). Ministry of the Environment. Toronto, Canada. 2012. Available online: https://www.ncceh.ca/sites/default/files/FINAL_Field%20Inquiry-Crematoria%20emissions%20and%20air%20quality%20impacts_EN.pdf (accessed on 30 June 2021).
  39. Xie, R.K.; Seip, H.M.; Wibetoe, G.; Nori, S.; McLeod, C.W. Heavy coal combustion as the dominant source of particulate pollution in Taiyuan, China, corroborated by high concentrations of arsenic and selenium in PM10. Sci. Total Environ. 2006. [Google Scholar] [CrossRef] [PubMed]
  40. Shah, P.; Strezov, V.; Prince, K.; Nelson, P.F. Speciation of As, Cr, Se and Hg under coal fired power station conditions. Fuel 2008. [Google Scholar] [CrossRef]
  41. Narukawa, T.; Takatsu, A.; Chiba, K.; Riley, K.W.; French, D.H. Investigation on chemical species of arsenic, selenium and antimony in fly ash from coal fuel thermal power stations. J. Environ. Monit. 2005, 7. [Google Scholar] [CrossRef]
  42. Marris, H.; Deboudt, K.; Flament, P.; Grobéty, B.; Gieré, R. Fe and Mn oxidation states by TEM-EELS in fine-particle emissions from a Fe-Mn alloy making plant. Environ. Sci. Technol. 2013, 47. [Google Scholar] [CrossRef]
  43. Setyan, A.; Flament, P.; Locoge, N.; Deboudt, K.; Riffault, V.; Alleman, L.Y.; Schoemaecker, C.; Arndt, J.; Augustin, P.; Healy, R.M.; et al. Investigation on the near-field evolution of industrial plumes from metalworking activities. Sci. Total Environ. 2019, 668. [Google Scholar] [CrossRef]
  44. Yi, H.; Hao, J.; Duan, L.; Tang, X.; Ning, P.; Li, X. 2008 Fine particle and trace element emissions from an anthracite coal-fired power plant equipped with a bag-house in China. Fuel 2008, 87. [Google Scholar] [CrossRef]
  45. Wedepohl, K.H. The composition of the continental crust. Geochim. Cosmochim. Acta 1995. [Google Scholar] [CrossRef]
  46. Kulkarni, P.; Chellam, S.; Fraser, M.P. Lanthanum and lanthanides in atmospheric fine particles and their apportionment to refinery and petrochemical operations in Houston, TX. Atmos. Environ. 2006. [Google Scholar] [CrossRef]
  47. Olmez, I.; Gordon, G.E. Rare earths: Atmospheric signatures for oil-fired power plants and refineries. Science 1985, 229, 966–968. [Google Scholar] [CrossRef]
  48. Dai, Q.; Li, L.; Li, T.; Bi, X.; Zhang, Y.; Wu, J.; Liu, B.; Gao, J.; Gu, W.; Yao, L.; et al. Atmospheric signature and potential sources of rare earth elements in size-resolved particulate matter in a Megacity of China. Aerosol Air Qual. Res. 2016. [Google Scholar] [CrossRef] [Green Version]
  49. Suzuki, Y.; Suzuki, T.; Furuta, N. Determination of Rare Earth Elements (REEs) in Airborne Particulate Matter (APM) Collected in Tokyo, Japan, and a Positive Anomaly of Europium and Terbium. Anal. Sci. 2010. [Google Scholar] [CrossRef] [Green Version]
  50. Suzuki, Y.; Hikida, S.; Furuta, N. Cycling of rare earth elements in the atmosphere in central Tokyo. J. Environ. Monit. 2011. [Google Scholar] [CrossRef] [Green Version]
  51. Celo, V.; Dabek-Zlotorzynska, E.; Zhao, J.; Bowman, D. Concentration and source origin of lanthanoids in the Canadian atmospheric particulate matter: A case study. Atmos. Pollut. Res. 2012. [Google Scholar] [CrossRef] [Green Version]
Figure 1. Location of the Ring of Fire air monitoring station and its external view.
Applsci 11 06140 g001
Figure 2. Seasonal wind roses from June 2015 to February 2018 measured by RM Young (AD). Comparison of wind roses between concurrent measurements by RM Young and Vaisala WXT 520 from September 2016 to February 2018 (E,F). In each circular plot, directions the wind blew from are sorted into 36 equal arc segments with 10° for each segment and the length of each “spoke” around the circle indicates the frequency with which the wind blew from that direction. The 0° refers to the north.
Applsci 11 06140 g002
Figure 3. Average PM2.5 concentrations in 2015–2018 at the Ring of Fire (RoF) station and other AQHI stations in southern Ontario. The average at the RoF was calculated from 46 24 h samples and those at the AQHI stations were calculated from continuous hourly concentrations.
Applsci 11 06140 g003
Figure 4. (A) Clusters of air mass back-trajectories when the highest PM2.5 concentration of 19 µg/m3 was observed on 5 July 2015, and (B) active wildfires near the air station on the same day (http://cwfis.cfs.nrcan.gc.ca/interactive-map, (accessed on 30 June 2021)). Each colour in (A) indicates an air mass back-trajectory cluster and time percentage of that air mass originating from that cluster by using 24 air mass back-trajectories. Yellow stars in (B) represent active wildfires.
Applsci 11 06140 g004
Figure 5. Average concentrations of trace elements during the monitoring period at the Ring of Fire (RoF) station and five stations in southern Ontario. The total number of samples was: 46 at RoF, 409 at Simcoe, 249 at Ottawa, 480 at Toronto, 384 at Windsor, and 433 at Hamilton.
Applsci 11 06140 g005
Figure 6. Linear correlation between Se, Pb, Sb, and As (AC), between Fe and Mn (D), as well as between La and Ce (E), and air mass back-trajectories arriving at the Ring of Fire station on 26 September 2015. Each color in (F) indicates an air mass back-trajectory cluster and time percentage of that air mass originating from that cluster by using 24 air mass back-trajectories.
Applsci 11 06140 g006
Figure 7. CPF plots for PM2.5, As, Se, Pb, Sb, Mn, La, and Ce. In each circular plot, directions centered on the receptor site are sorted into 36 equal arc segments with 10° each segment, and the solid line represents probabilities of potential sources to the receptor site. The 0° refers to the north.
Applsci 11 06140 g007
Table 1. Statistics for air concentrations of PM2.5 (µg/m3) and select elements (ng/m3) measured at the Ring of Fire air monitoring station.
PM2.5
(µg/m3)
Concentration (ng/m3)
MnFeAsSeSbLaCePb
Minimum0.750.133.00.0120.0100.0150.00160.00160.055
Maximum190.71200.400.410.250.0230.0261.2
Mean3.00.225.20.0550.0660.0390.00460.00580.18
Median2.20.133.00.0120.0100.0150.00160.00340.055
Standard deviation0.490.0240.670.0120.0140.00790.000920.000950.036
Interquartile range3.10.112.40.0450.0680.0250.00310.00540.13
MDL1.50.276.10.0240.0210.0290.00310.00320.11
>MDL63%26%26%43%48%33%40%55%37%
Publisher’s Note: MDPI stays neutral with regard to jurisdictional claims in published maps and institutional affiliations.

