
Hydraulic Vibration and Possible Exciting Sources Analysis in a Hydropower System

Abstract
:1. Introduction
2. Research Object Description
3. Materials and Mathematical Model
3.1. Governing Equations
3.2. Transfer Matrix and Hydraulic Impedance Methods
3.2.1. Field Matrix
3.2.2. Point Matrix
3.3. Hydraulic Vibration Analysis
3.3.1. Free Vibration Analysis
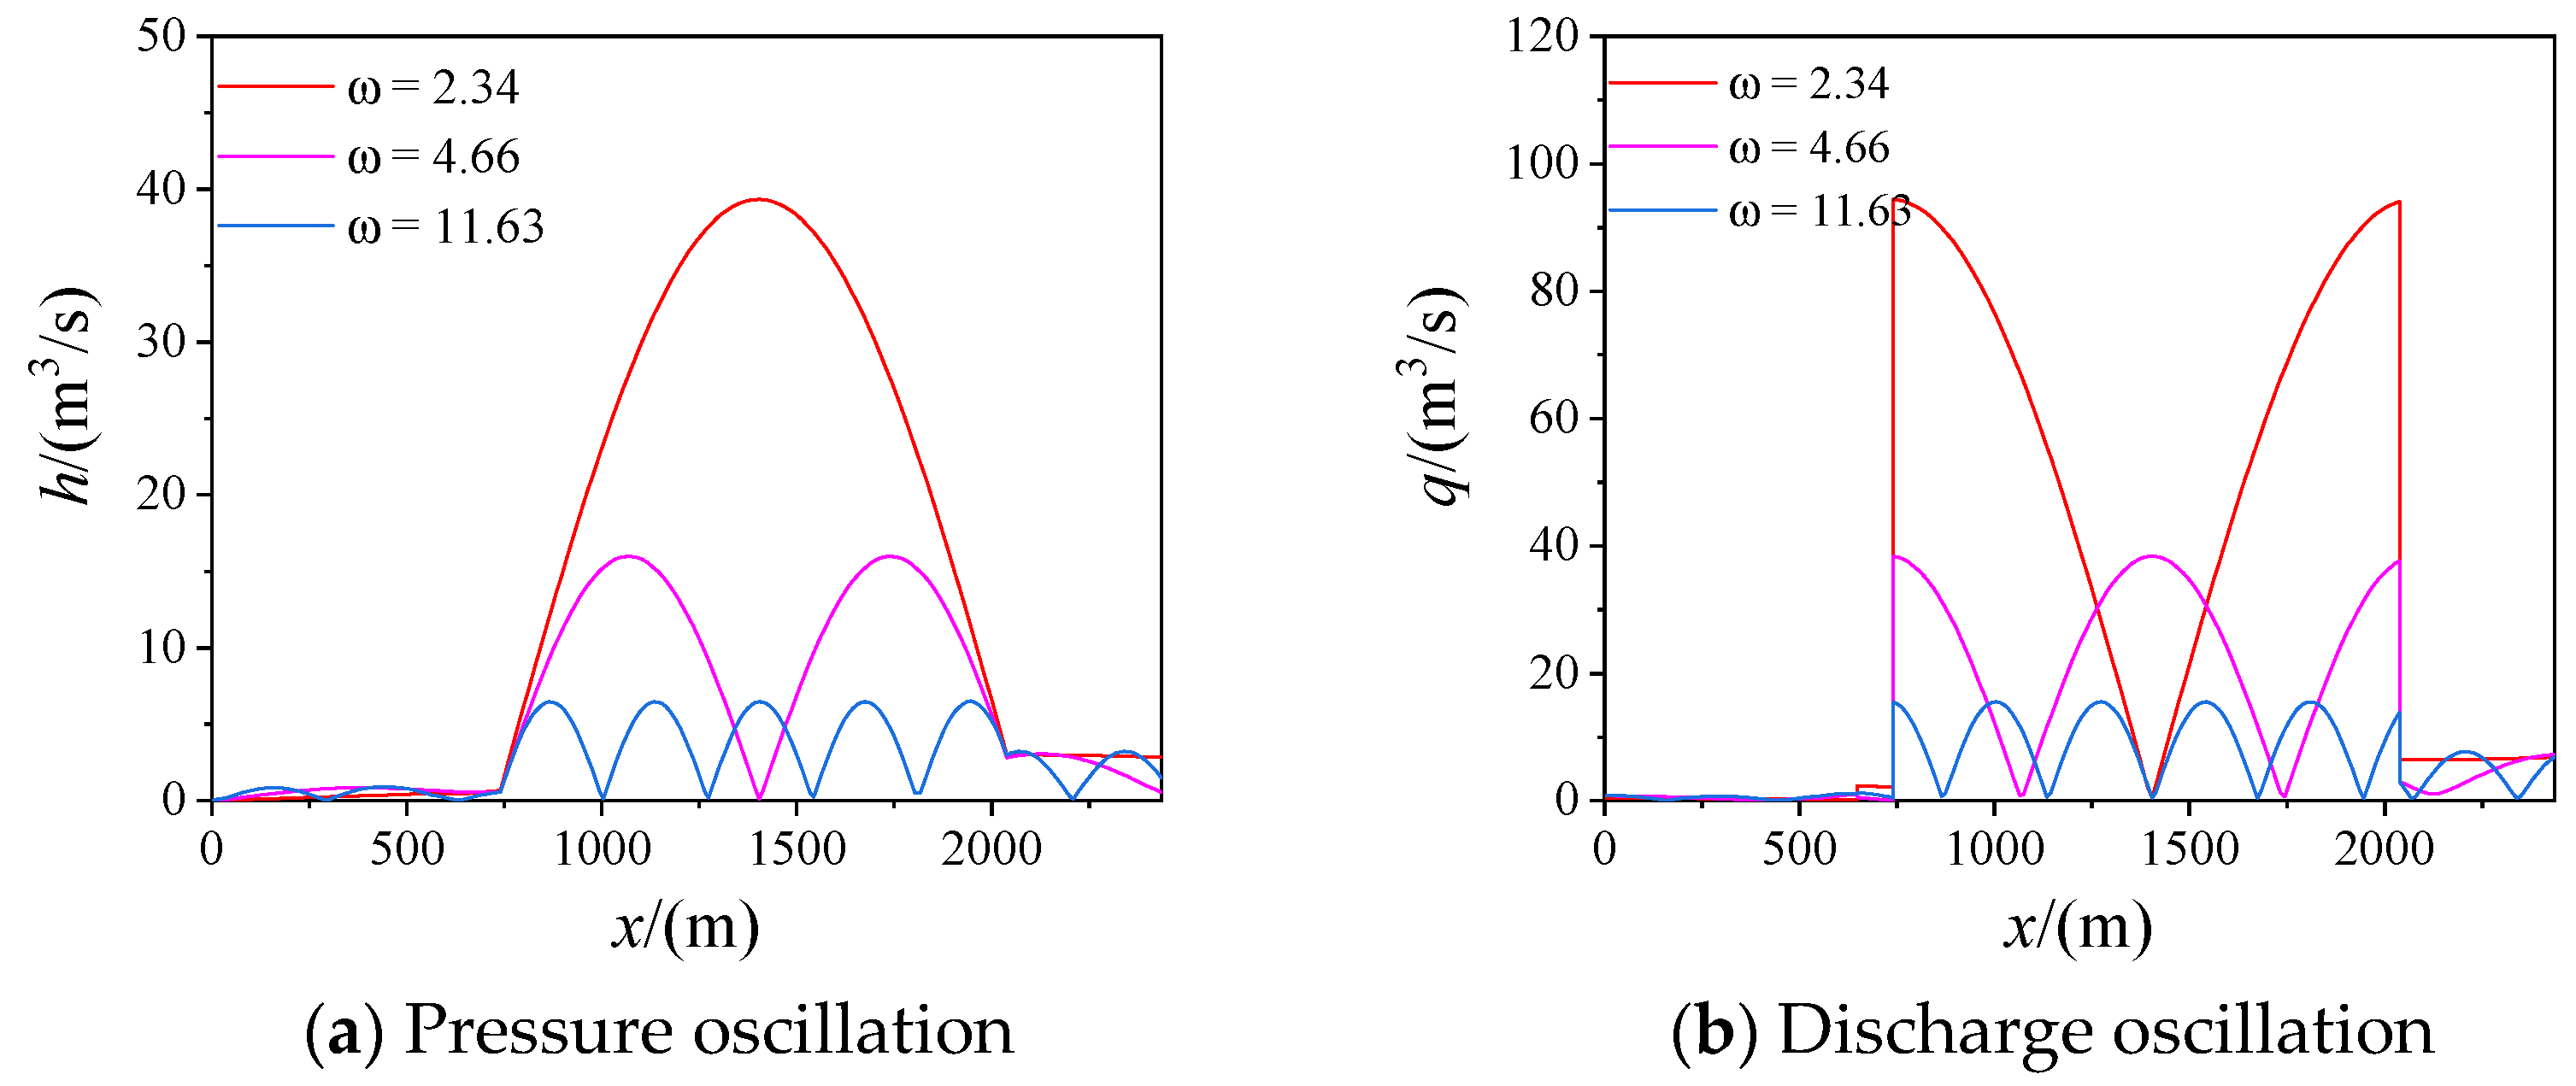
3.3.2. Forced Vibration Analysis
3.4. Mathematical Model of Pressurized Flow in the System
4. Results and Discussions
4.1. Pressure Fluctuation in the Flow Passage
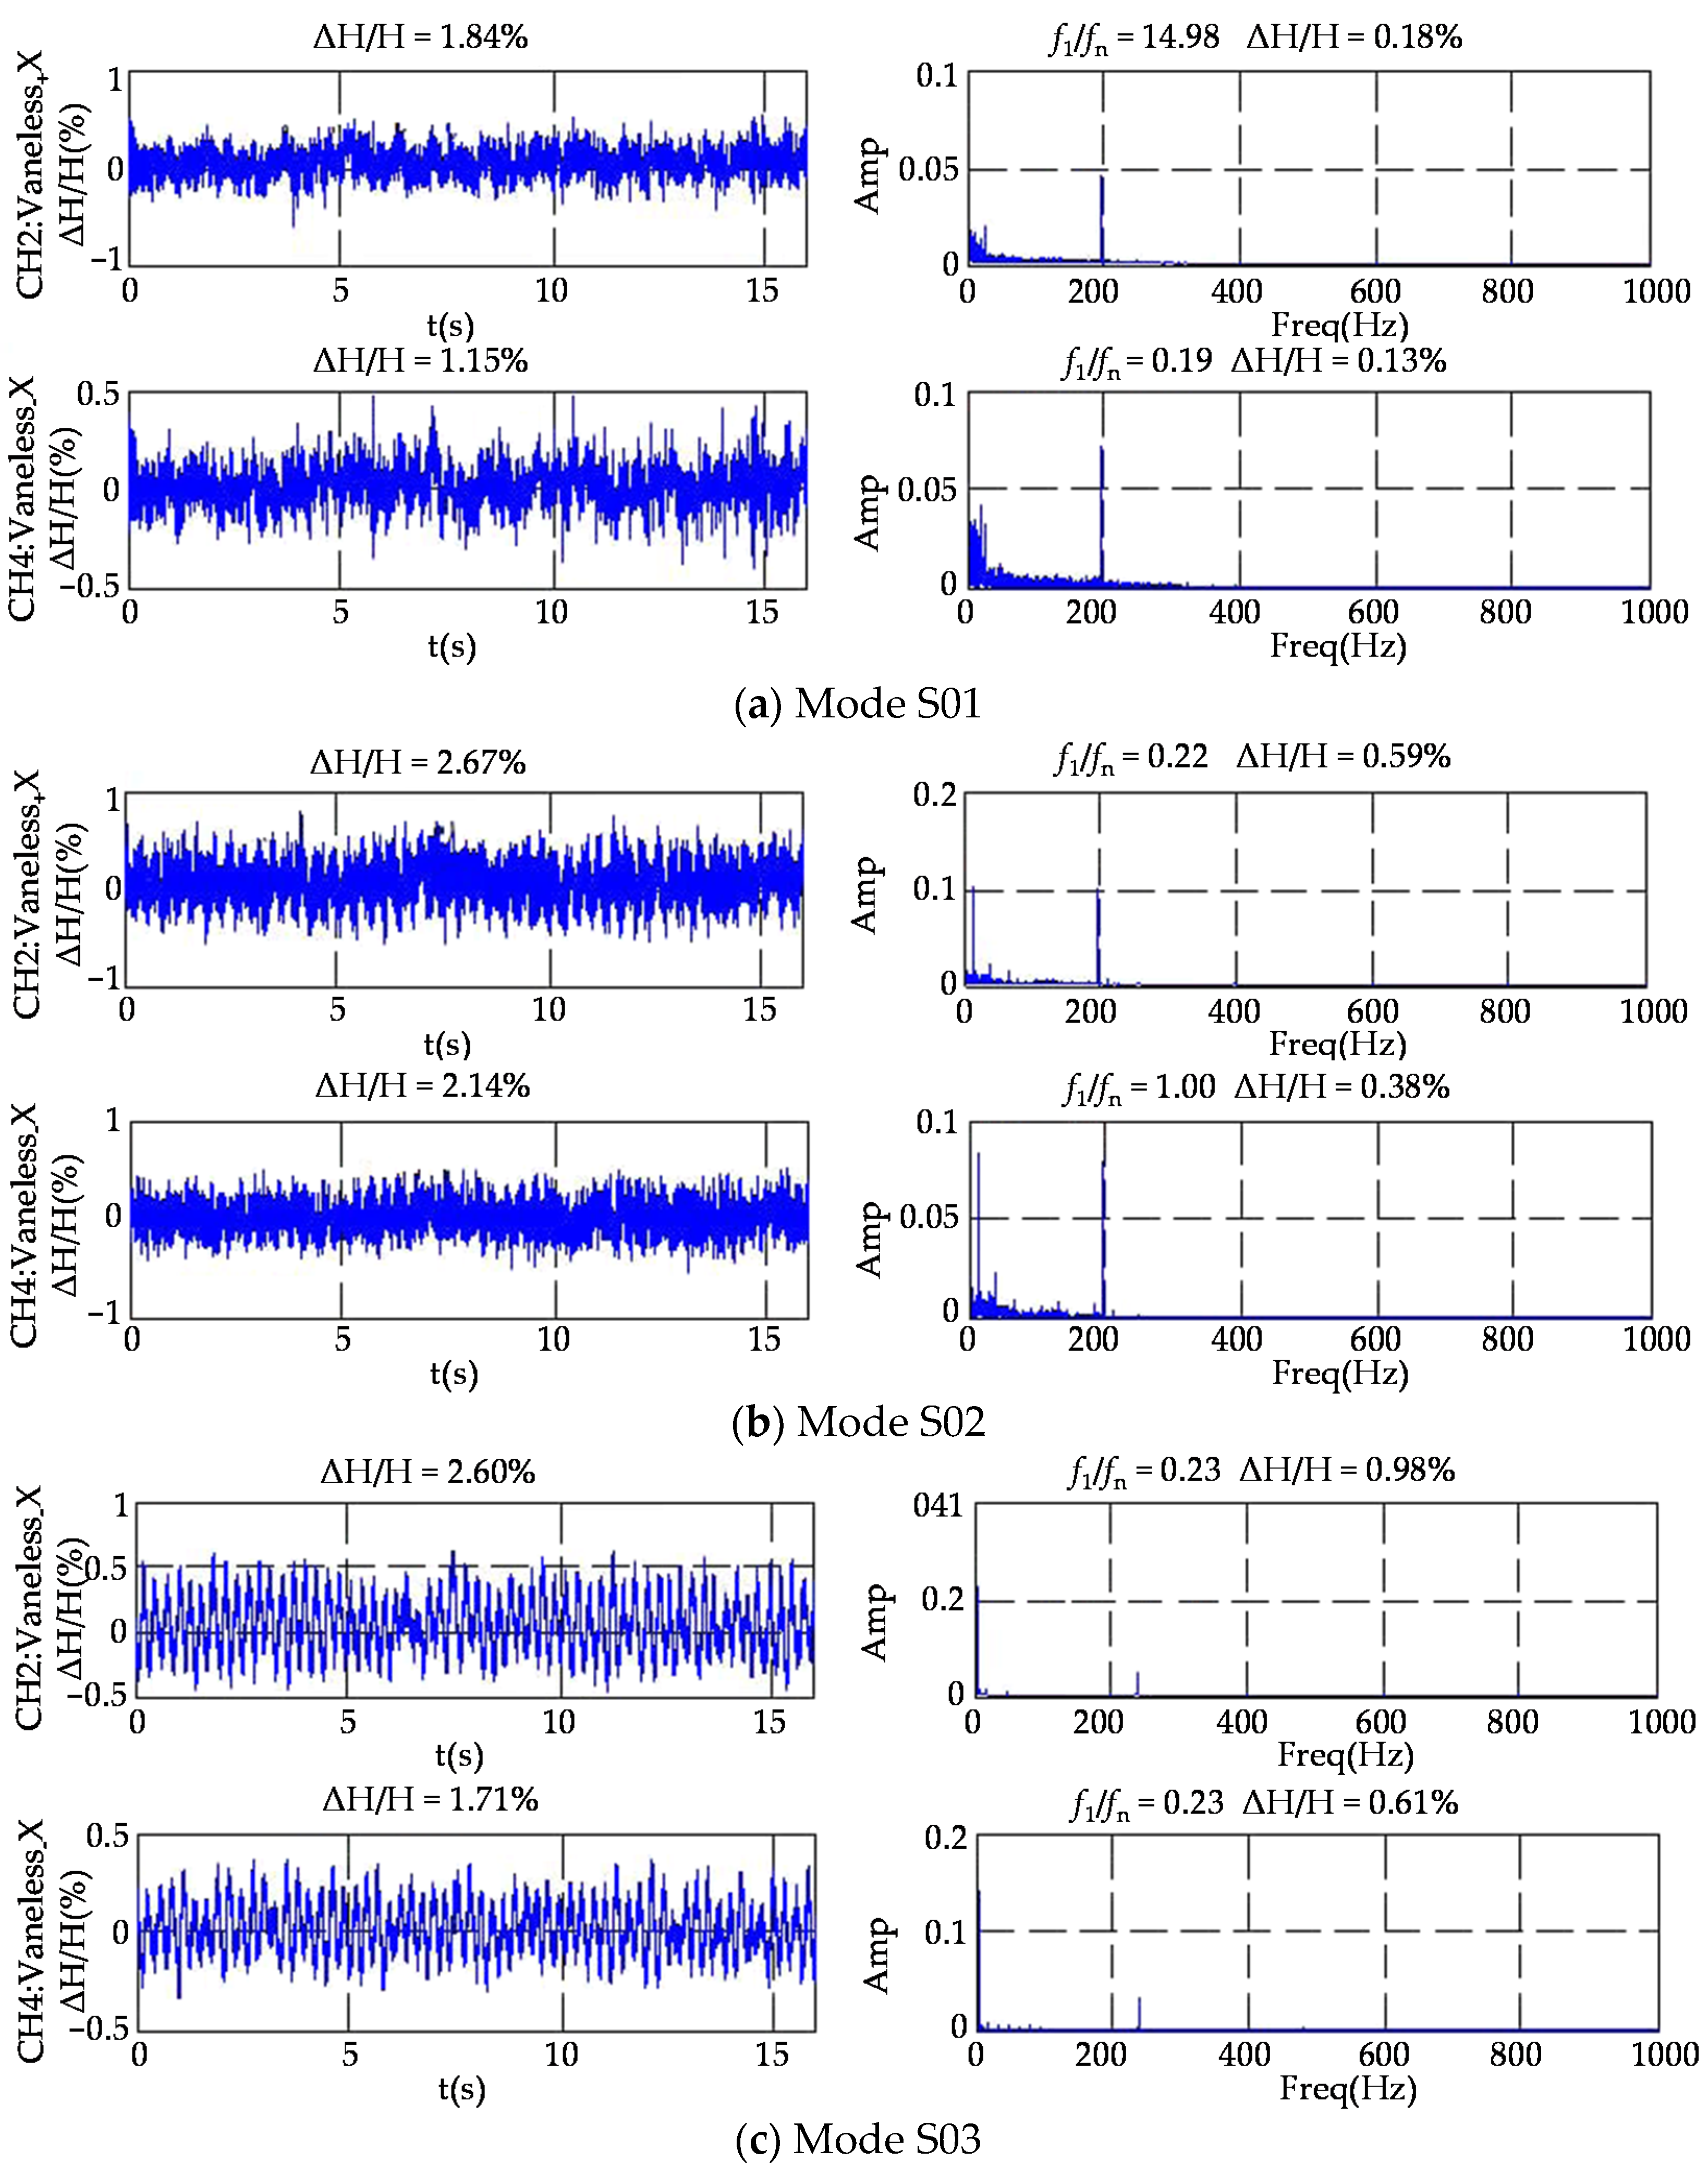
4.1.1. Pressure Fluctuation in Vaneless Space
4.1.2. Pressure Fluctuation in the Draft Tube
4.2. Numerical Computation
4.2.1. Natural Frequencies
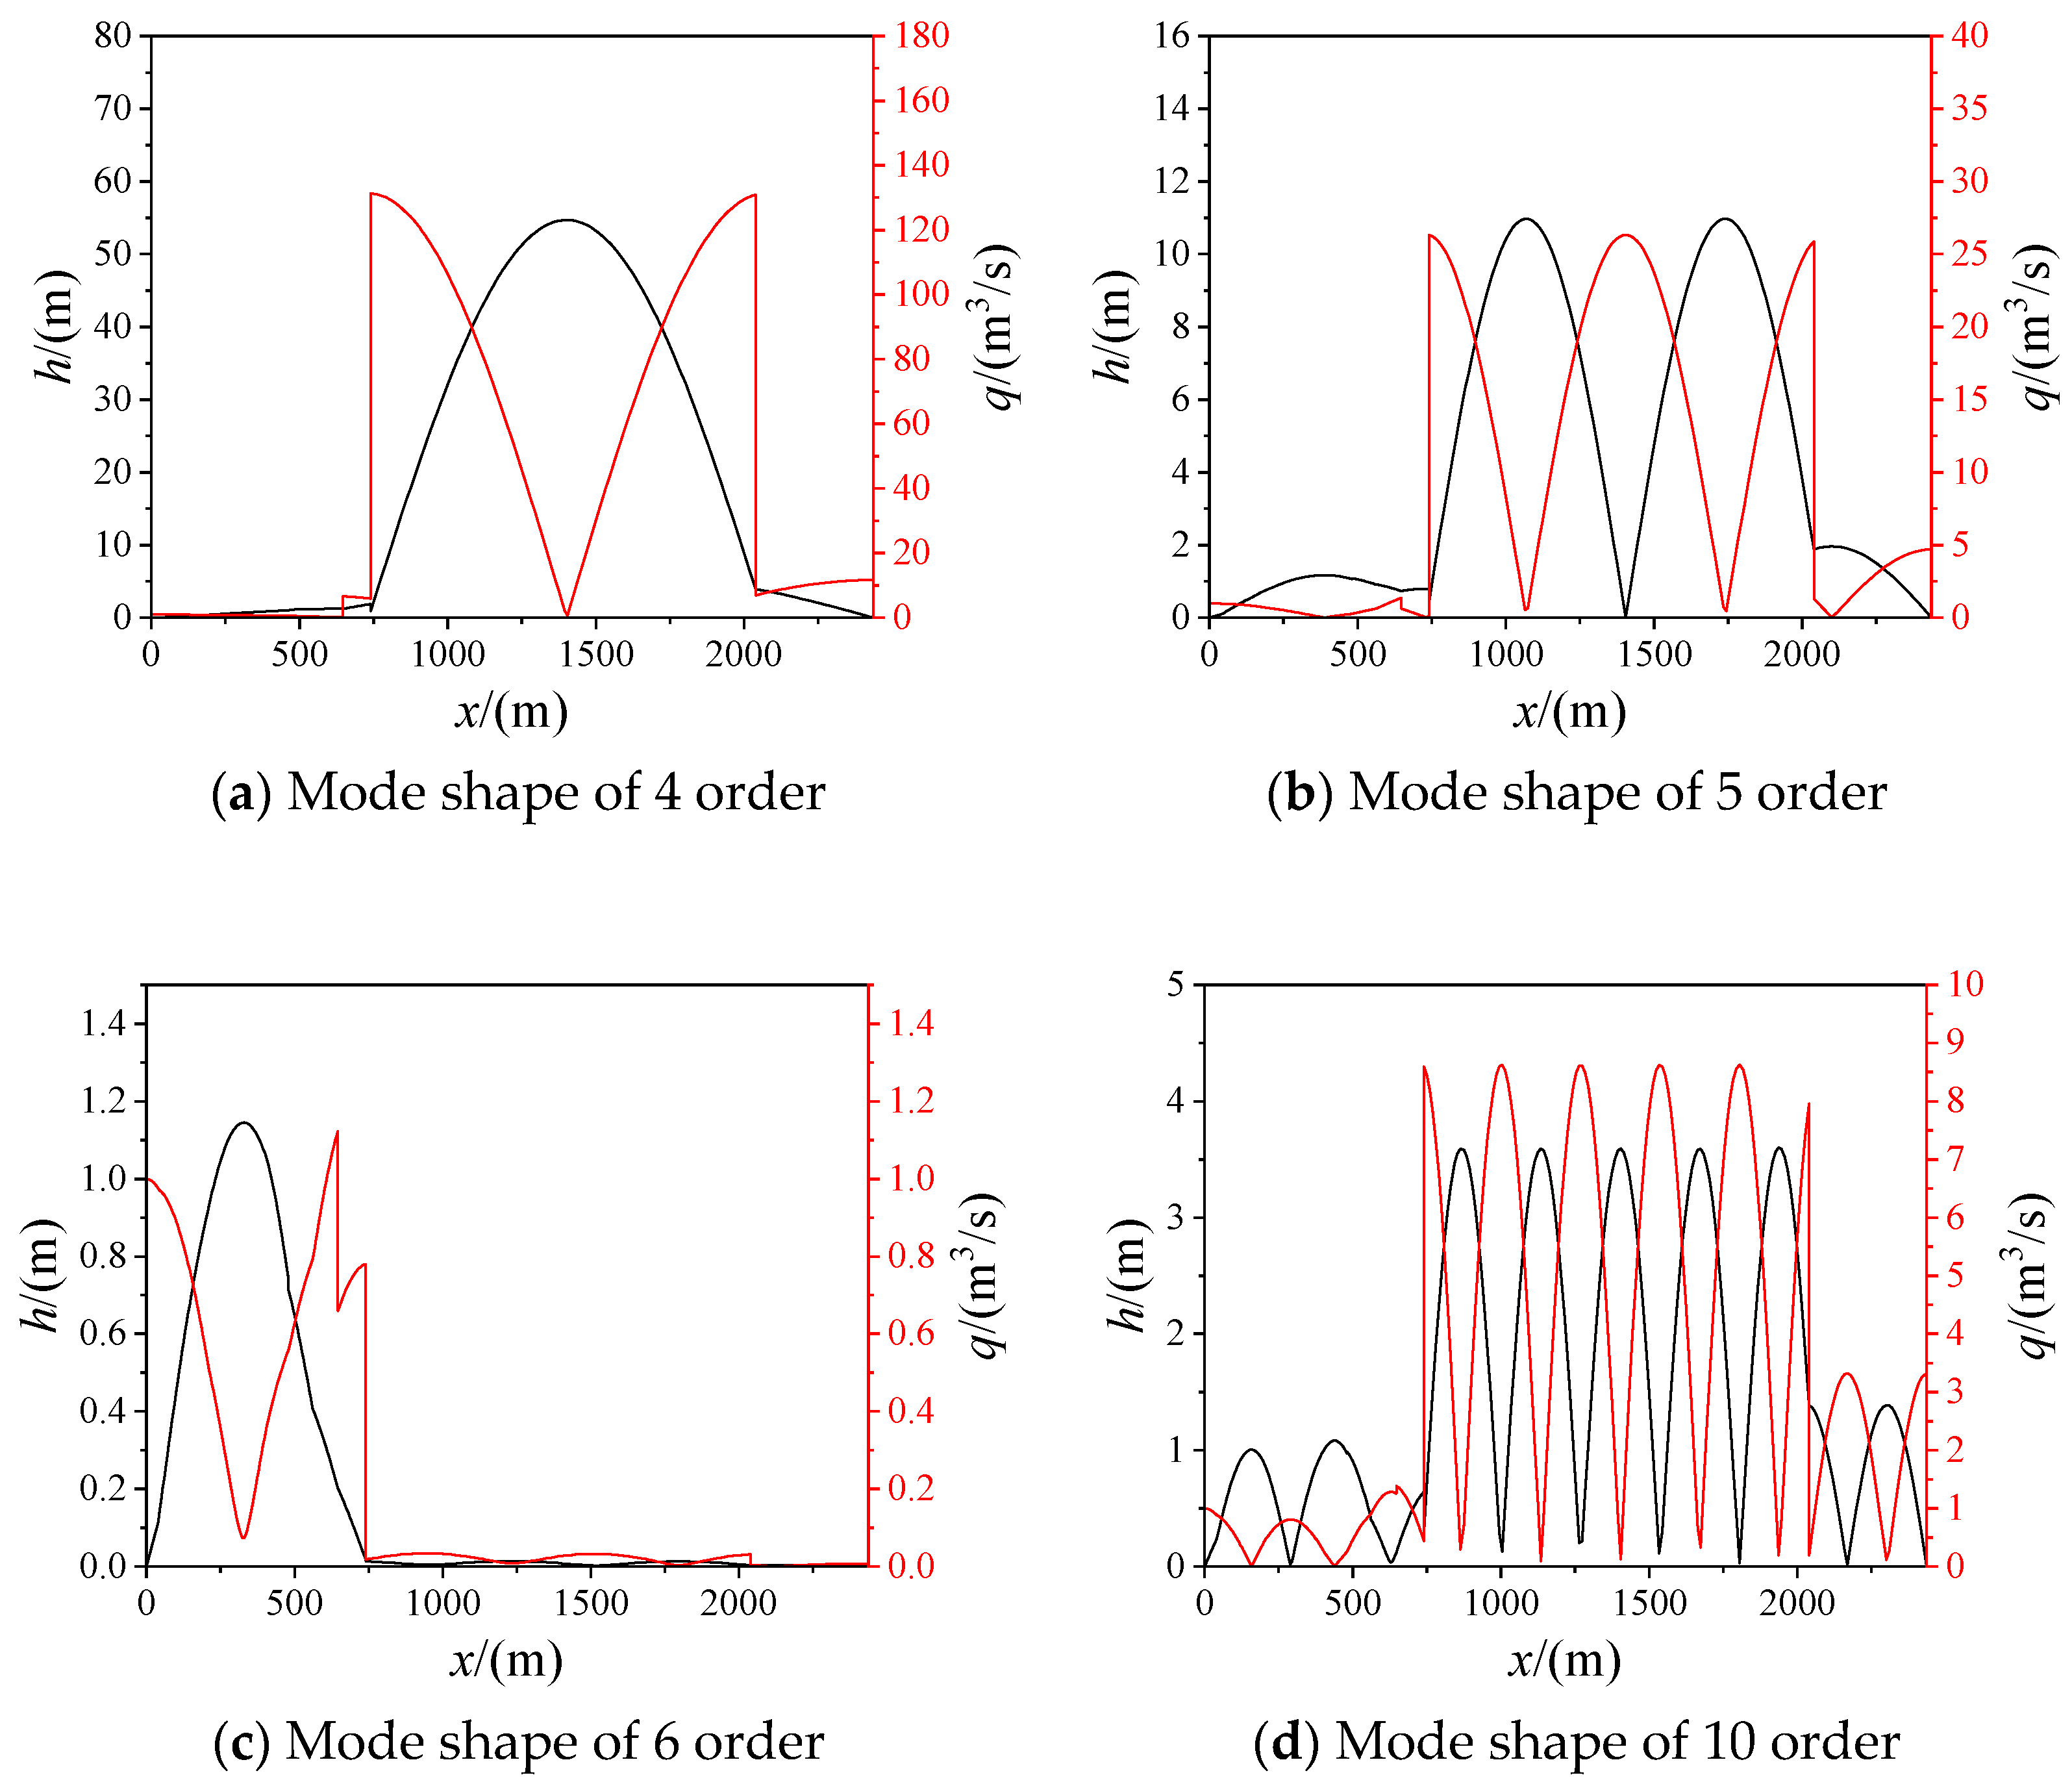
4.2.2. Mode Shapes
4.3. Comparative Analysis
5. Conclusions
Author Contributions
Funding
Acknowledgments
Conflicts of Interest
References
- Li, X.; Chen, Z.; Fan, X.; Cheng, Z. Hydropower development situation and prospects in China. Renew. Sustain. Energy Rev. 2018, 82, 232–239. [Google Scholar] [CrossRef]
- Bilgili, M.; Bilirgen, H.; Ozbek, A.; Ekinci, F.; Demirdelen, T. The role of hydropower installations for sustainable energy development in Turkey and the world. Renew. Energy 2018, 126, 755–764. [Google Scholar] [CrossRef]
- Trivedi, C.; Gogstad, P.J.; Dahlhaug, O.G. Investigation of the unsteady pressure pulsations in the prototype Francis turbines—Part 1: Steady state operating conditions. Mech. Syst. Signal Process. 2018, 108, 188–202. [Google Scholar] [CrossRef] [Green Version]
- Glowacz, A.; Glowacz, W.; Kozik, J.; Piech, K.; Gutten, M.; Caesarendra, W.; Liu, H.; Brumercik, F.; Irfan, M.; Faizal Khan, Z. Detection of Deterioration of Three-phase Induction Motor using Vibration Signals. Meas. Sci. Rev. 2019, 19, 241–249. [Google Scholar] [CrossRef] [Green Version]
- Li, D.; Fu, X.; Zuo, Z.; Wang, H.; Li, Z.; Liu, S.; Wei, X. Investigation methods for analysis of transient phenomena concerning design and operation of hydraulic-machine systems—A review. Renew. Sustain. Energy Rev. 2019, 101, 26–46. [Google Scholar] [CrossRef]
- Müller, A.; Favrel, A.; Landry, C.; Yamamoto, K.; Avellan, F. On the physical mechanisms governing self-excited pressure surge in Francis turbines. IOP Conf. Ser. Earth Environ. Sci. 2014, 22. [Google Scholar] [CrossRef] [Green Version]
- Trivedi, C. Time-dependent inception of vortex rings in a Francis turbine during load variation: Large eddy simulation and experimental validation. J. Hydraul. Res. 2019, 58, 790–806. [Google Scholar] [CrossRef]
- Zhang, L.; Wu, Q.; Ma, Z.; Wang, X. Transient vibration analysis of unit-plant structure for hydropower station in sudden load increasing process. Mech. Syst. Signal Process. 2019, 120, 486–504. [Google Scholar] [CrossRef]
- Trivedi, C.; Gandhi, B.; Michel, C.J. Effect of transients on Francis turbine runner life: A review. J. Hydraul. Res. 2013, 51, 121–132. [Google Scholar] [CrossRef]
- Goyal, R.; Gandhi, B.K.; Cervantes, M.J. Transient Pressure Measurements in the Vaneless Space of a Francis Turbine during Load Acceptances from Minimum Load. J. Phys. Conf. Ser. 2018, 1042. [Google Scholar] [CrossRef]
- Guo, L.; Liu, J.; Wang, L.; Qin, D.; Wei, X. Pressure fluctuation propagation of a pump turbine at pump mode under low head condition. Sci. China Technol. Sci. 2014, 57, 811–818. [Google Scholar] [CrossRef]
- Zuo, Z.; Liu, S.; Sun, Y.; Wu, Y. Pressure fluctuations in the vaneless space of High-head pump-turbines—A review. Renew. Sustain. Energy Rev. 2015, 41, 965–974. [Google Scholar] [CrossRef]
- Cheng, H.; Zhou, L.; Liang, Q.; Guan, Z.; Liu, D.; Wang, Z.; Kang, W. A method of evaluating the vortex rope strength in draft tube of Francis turbine. Renew. Energy 2020, 152, 770–780. [Google Scholar] [CrossRef]
- Kumar, S.; Cervantes, M.J.; Gandhi, B.K. Rotating vortex rope formation and mitigation in draft tube of hydro turbines—A review from experimental perspective. Renew. Sustain. Energy Rev. 2021, 136. [Google Scholar] [CrossRef]
- Qin, D.; Xu, Y.; Liu, W.; Wei, X.; Zhao, Y.; Meng, X. Experimental study of the influence of Thoma number and model testing head on pressure fluctuation in draft tube of a Francis turbine. IOP Conf. Ser. Earth Environ. Sci. 2016, 49. [Google Scholar] [CrossRef] [Green Version]
- Yu, A.; Zou, Z.; Zhou, D.; Zheng, Y.; Luo, X. Investigation of the correlation mechanism between cavitation rope behavior and pressure fluctuations in a hydraulic turbine. Renew. Energy 2020, 147, 1199–1208. [Google Scholar] [CrossRef]
- Zhang, X.; Zeng, W.; Cheng, Y.; Yang, Z.; Chen, Q.; Yang, J. Mechanism of Fast Transition of Pressure Pulsations in the Vaneless Space of a Model Pump-Turbine During Runaway. J. Fluid Eng. 2019, 141. [Google Scholar] [CrossRef]
- Zhang, W.; Chen, Z.; Zhu, B.; Zhang, F. Pressure fluctuation and flow instability in S-shaped region of a reversible pump-turbine. Renew. Energy 2020, 154, 826–840. [Google Scholar] [CrossRef]
- Zhang, X.; Cheng, Y.; Yang, Z.; Chen, Q.; Liu, D. Influence of rotational inertia on the runner radial forces of a model pump-turbine running away through the S-shaped characteristic region. IET Renew. Power Gener. 2020, 14, 1883–1893. [Google Scholar] [CrossRef]
- Li, D.; Sun, Y.; Zuo, Z.; Liu, S.; Wang, H.; Li, Z. Analysis of Pressure Fluctuations in a Prototype Pump-Turbine with Different Numbers of Runner Blades in Turbine Mode. Energies 2018, 11, 1474. [Google Scholar] [CrossRef] [Green Version]
- Li, D.; Wang, H.; Qin, Y.; Li, Z.; Wei, X.; Qin, D. Mechanism of high amplitude low frequency fluctuations in a pump-turbine in pump mode. Renew. Energy 2018, 126, 668–680. [Google Scholar] [CrossRef]
- Su, W.-T.; Binama, M.; Li, Y.; Zhao, Y. Study on the method of reducing the pressure fluctuation of hydraulic turbine by optimizing the draft tube pressure distribution. Renew. Energy 2020, 162, 550–560. [Google Scholar] [CrossRef]
- Zhu, L.; Zhang, R.-Z.; Yu, A.; Lu, L.; Luo, X.-W. Suppression of vortex rope oscillation and pressure vibrations in Francis turbine draft tube using various strategies. J. Hydrodyn. 2021. [Google Scholar] [CrossRef]
- Bosioc, A.I.; Tănasă, C. Experimental study of swirling flow from conical diffusers using the water jet control method. Renew. Energy 2020, 152, 385–398. [Google Scholar] [CrossRef]
- Tănasă, C.; Bosioc, A.; Muntean, S.; Susan-Resiga, R. A Novel Passive Method to Control the Swirling Flow with Vortex Rope from the Conical Diffuser of Hydraulic Turbines with Fixed Blades. Appl. Sci. 2019, 9, 4910. [Google Scholar] [CrossRef] [Green Version]
- Kan, K.; Zheng, Y.; Chen, H.; Zhou, D.; Dai, J.; Binama, M.; Yu, A. Numerical simulation of transient flow in a shaft extension tubular pump unit during runaway process caused by power failure. Renew. Energy 2020, 154, 1153–1164. [Google Scholar] [CrossRef]
- Yin, C.; Yang, J.; Zeng, W.; Cheng, Y. Simulation of the simultaneous load rejection processes of two parallel pump turbines using a 1D–3D approach. IOP Conf. Ser. Earth Environ. Sci. 2019, 240. [Google Scholar] [CrossRef]
- Zhang, X.; Cheng, Y.; Yang, Z.; Chen, Q.; Liu, D. Water column separation in pump-turbine after load rejection: 1D-3D coupled simulation of a model pumped-storage system. Renew. Energy 2021, 163, 685–697. [Google Scholar] [CrossRef]
- Palikhe, S.; Zhou, J.; Bhattarai, K.P. Hydraulic Oscillation and Instability of a Hydraulic System with Two Different Pump-Turbines in Turbine Operation. Water 2019, 11, 692. [Google Scholar] [CrossRef] [Green Version]
- Zhou, J.; Chen, Y. Discussion on Stochastic Analysis of Hydraulic Vibration in Pressurized Water Diversion and Hydropower Systems. Water 2018, 10, 353. [Google Scholar] [CrossRef] [Green Version]
- Landry, C.; Favrel, A.; Müller, A.; Nicolet, C.; Avellan, F. Local wave speed and bulk flow viscosity in Francis turbines at part load operation. J. Hydraul. Res. 2016, 54, 185–196. [Google Scholar] [CrossRef]
- Wu, Y.; Liu, S.; Dou, H.-S.; Wu, S.; Chen, T. Numerical prediction and similarity study of pressure fluctuation in a prototype Kaplan turbine and the model turbine. Comput. Fluids 2012, 56, 128–142. [Google Scholar] [CrossRef]
- Wiley, E.B.; Streeter, V.L.; Suo, L. Fluid Transients in Systems; Prentice Hall: Englewood Cliffs, NJ, USA, 1993. [Google Scholar]
- Chaudhry, M.H. Applied Hydraulic Transients; Springer: Berlin, Germany, 2014. [Google Scholar]


| No. | L(m) | D(m) | No. | L(m) | D(m) | No. | L(m) | D(m) |
|---|---|---|---|---|---|---|---|---|
| 1 | 41.0 | 15.925 | 11 | 24.55 | 17.145 | 21 | 61.1 | 11.460 |
| 2 | 166.446 | 10.999 | 12 | 93.25 | 16.456 | 22 | 60.85 | 17.145 |
| 3 | 47.124 | 10.203 | 13 | 41.0 | 15.925 | 23 | 24.55 | 17.145 |
| 4 | 104.50 | 10.203 | 14 | 167.938 | 10.999 | 24 | 74.0 | 16.456 |
| 5 | 47.124 | 10.203 | 15 | 47.124 | 10.203 | 25 | 103.745 | 17.628 |
| 6 | 31.88 | 9.053 | 16 | 104.50 | 10.203 | 26 | 972.805 | 17.628 |
| 7 | 42.4 | 8.600 | 17 | 47.124 | 10.203 | 27 | 100.0 | 17.605 |
| 8 | 20.0 | 11.460 | 18 | 31.88 | 9.053 | 28 | 122.166 | 17.605 |
| 9 | 61.1 | 11.460 | 19 | 42.4 | 8.600 | 29 | 397.048 | 17.605 |
| 10 | 60.85 | 17.145 | 20 | 20.0 | 11.460 |
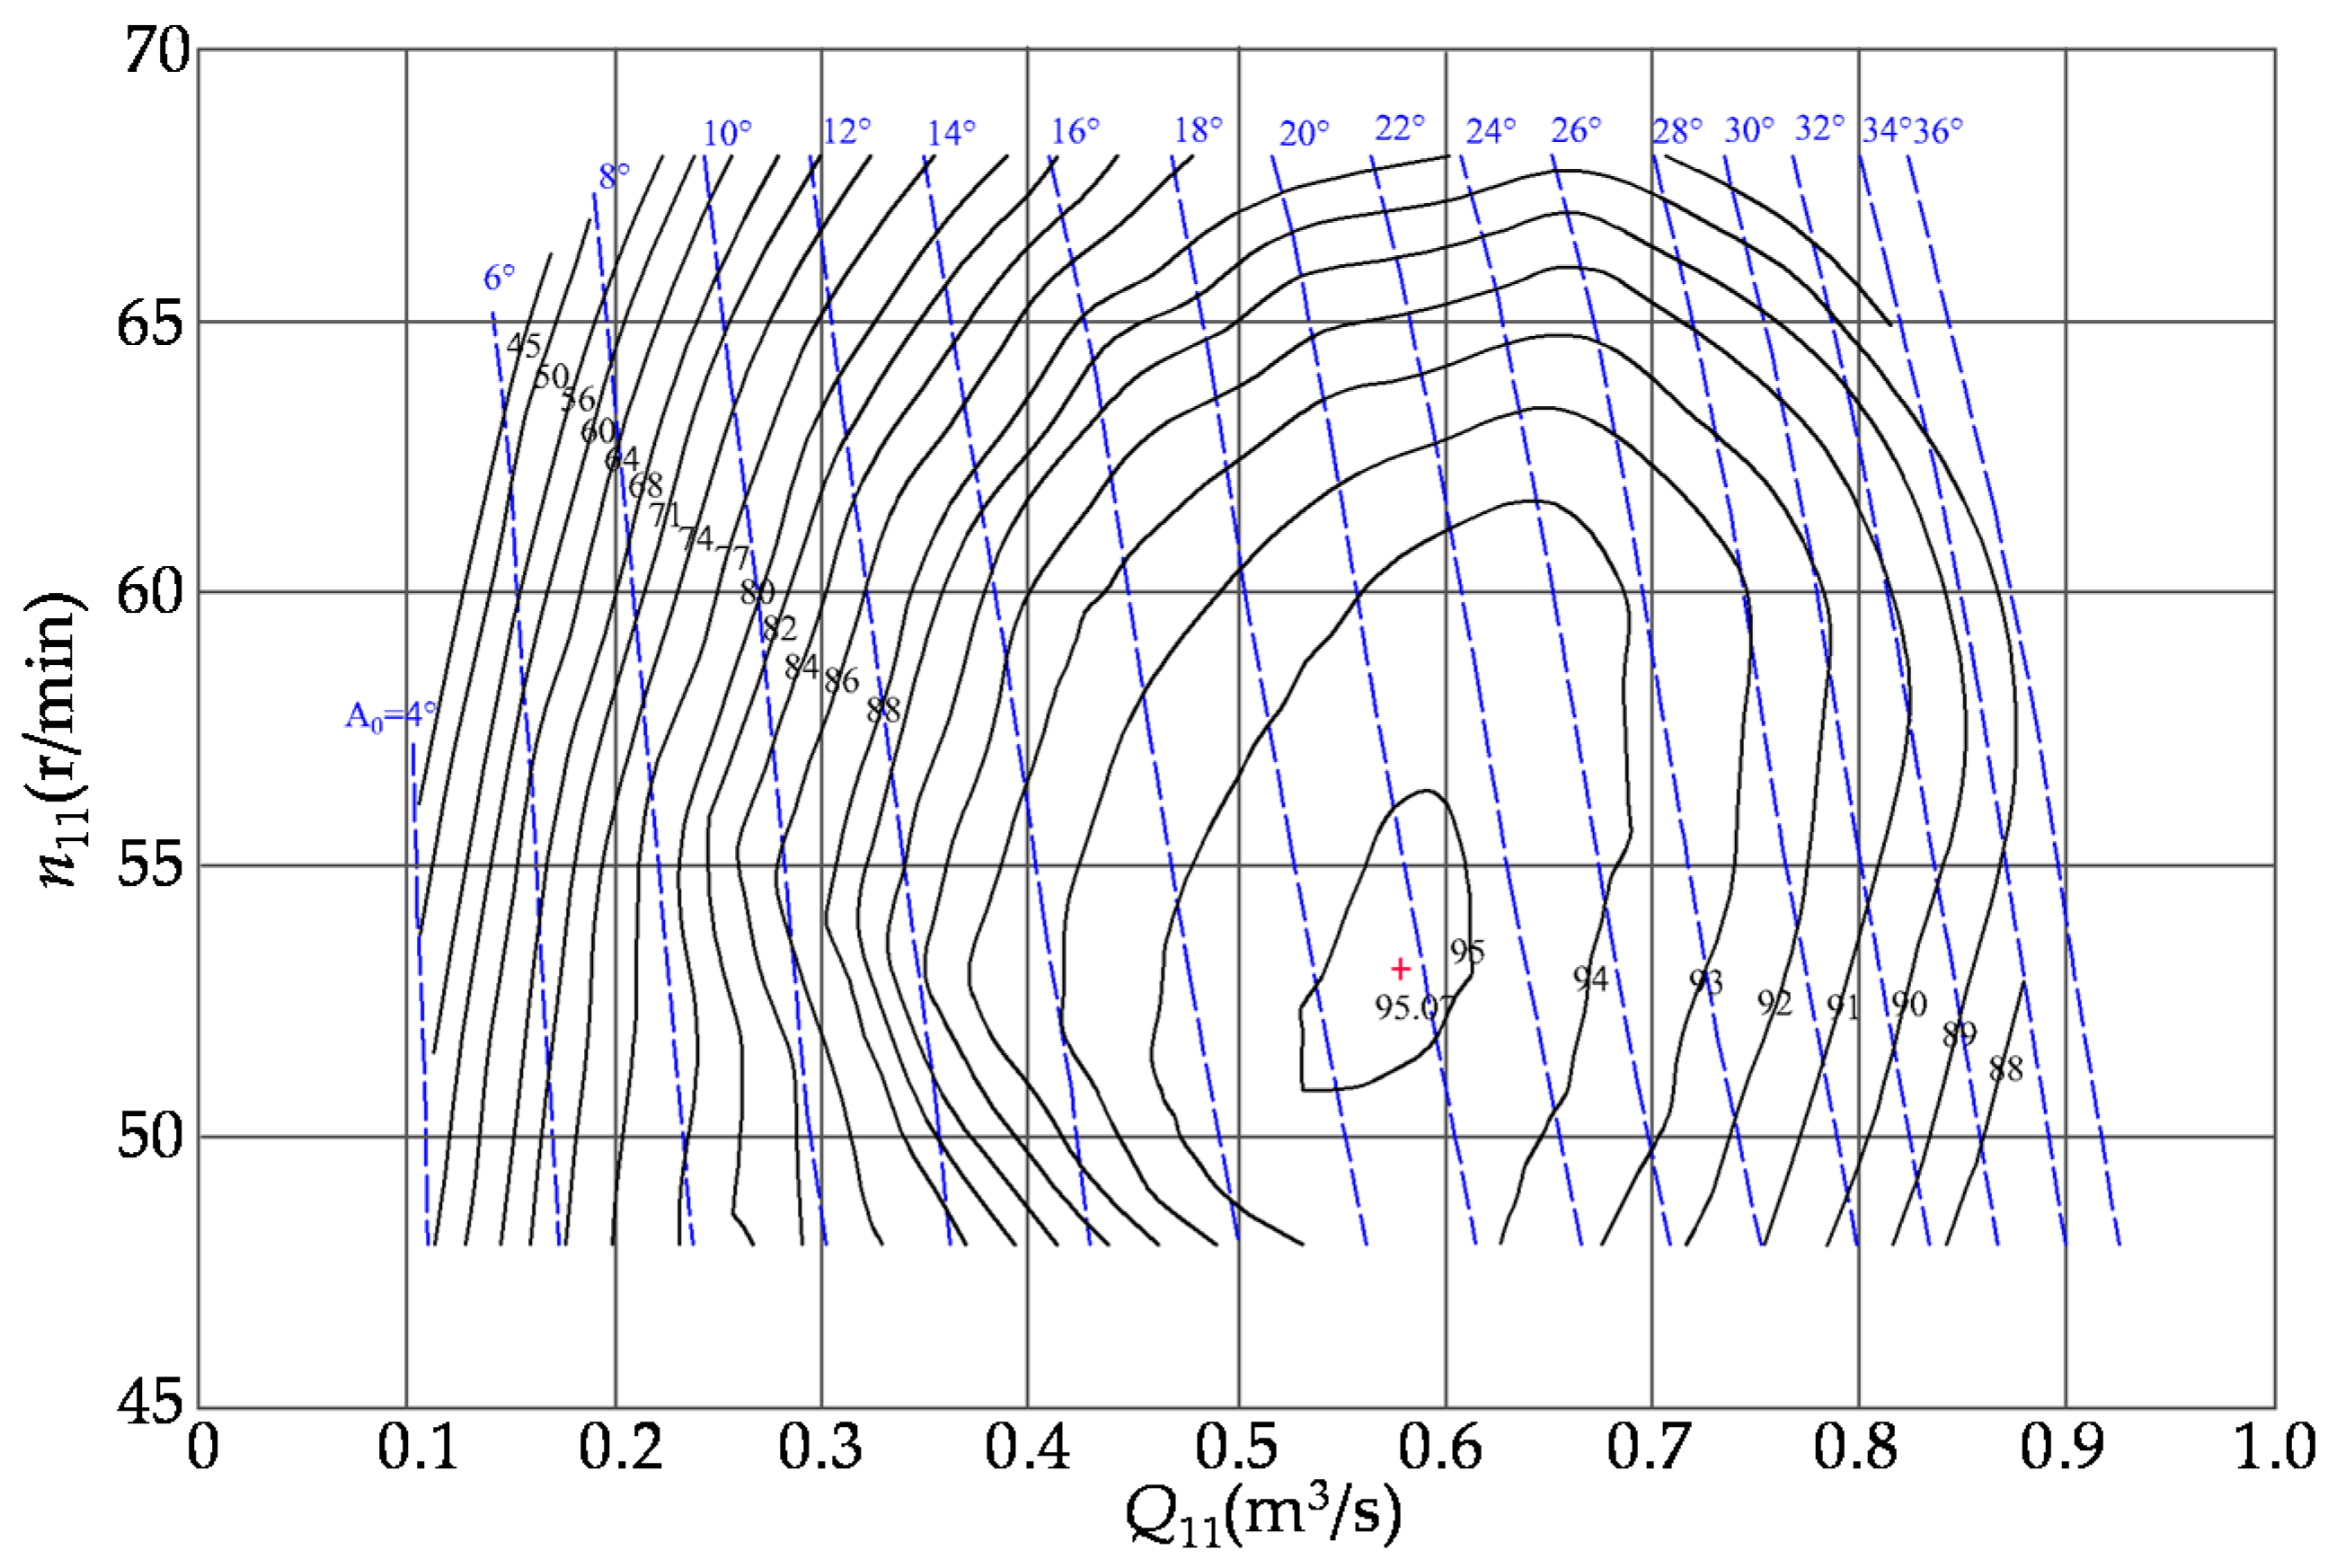
| Mode | a (°) | n11 (r/min) | Q11 (L/s) | Hm (m) | P (MW) | Pr (%Pt) |
|---|---|---|---|---|---|---|
| S01 | 7.88 | 60.21 | 145.99 | 29.91 | 301.11 | 29.67 |
| S02 | 12.63 | 60.15 | 249.77 | 30.32 | 607.72 | 59.87 |
| S03 | 14.12 | 73.16 | 260.64 | 29.88 | 346.43 | 48.32 |
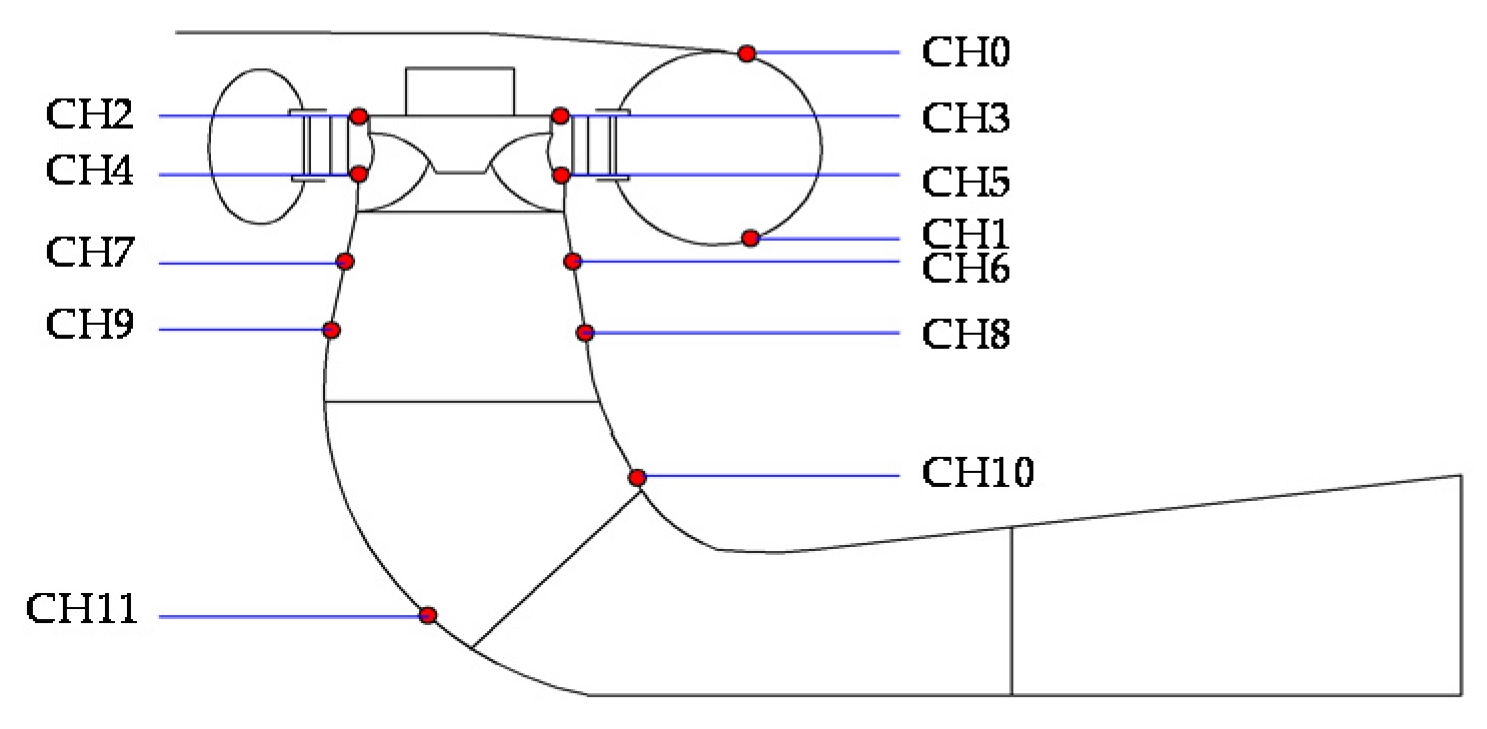
| Mode | CH0 | CH1 | CH2 | CH3 | CH4 | CH5 | CH6 | CH7 | CH8 | CH9 | CH10 | CH11 |
|---|---|---|---|---|---|---|---|---|---|---|---|---|
| S01 | 1.88 | 1.86 | 1.84 | 1.78 | 1.51 | 1.74 | 3.95 | 3.53 | 3.12 | 3.13 | 1.81 | 2.86 |
| S02 | 1.91 | 1.88 | 2.67 | 3.02 | 2.14 | 2.54 | 2.68 | 2.86 | 2.63 | 3.36 | 1.54 | 2.28 |
| S03 | 1.27 | 1.25 | 2.60 | 2.50 | 1.71 | 2.38 | 4.34 | 3.69 | 3.78 | 4.33 | 2.28 | 4.14 |
| Mode | CH0 | CH1 | CH2 | CH3 | CH4 | CH5 | CH6 | CH7 | CH8 | CH9 | CH10 | CH11 |
|---|---|---|---|---|---|---|---|---|---|---|---|---|
| S01 | 0.1 | 0.1 | 15 | 15 | 0.2 | 0.2 | 1.6 | 1.5 | 0.2 | 0.2 | 0.2 | 0.2 |
| S02 | 0.0 | 0.1 | 0.2 | 0.2 | 1.0 | 0.2 | 0.2 | 0.2 | 0.4 | 0.4 | 0.2 | 0.2 |
| S03 | 0.0 | 0.0 | 0.2 | 0.2 | 0.2 | 0.2 | 0.2 | 0.2 | 0.2 | 0.2 | 0.2 | 0.2 |
| Order kth | Case 1 | Case 2 | ||
|---|---|---|---|---|
| σ | ω | σ | ω | |
| 1 | −0.0046 | 0.0284 | −0.0046 | 0.0284 |
| 2 | −0.0048 | 0.2597 | −0.0048 | 0.2599 |
| 3 | −0.0025 | 0.3640 | −0.0025 | 0.3640 |
| 4 | −0.0038 | 2.3428 | −0.0038 | 2.6017 |
| 5 | −0.0036 | 4.6627 | −0.0036 | 5.1799 |
| 6 | −0.3048 | 5.5526 | −0.3041 | 6.1735 |
| 7 | −0.0044 | 6.8170 | −0.0044 | 7.5732 |
| 8 | −0.0055 | 7.4851 | −0.0055 | 8.3165 |
| 9 | −0.0265 | 9.4424 | −0.0276 | 10.4924 |
| 10 | −0.0034 | 11.6914 | −0.0034 | 12.9902 |
Publisher’s Note: MDPI stays neutral with regard to jurisdictional claims in published maps and institutional affiliations. |
© 2021 by the authors. Licensee MDPI, Basel, Switzerland. This article is an open access article distributed under the terms and conditions of the Creative Commons Attribution (CC BY) license (https://creativecommons.org/licenses/by/4.0/).
Share and Cite
Shen, A.; Chen, Y.; Zhou, J.; Yang, F.; Sun, H.; Cai, F. Hydraulic Vibration and Possible Exciting Sources Analysis in a Hydropower System. Appl. Sci. 2021, 11, 5529. https://doi.org/10.3390/app11125529
Shen A, Chen Y, Zhou J, Yang F, Sun H, Cai F. Hydraulic Vibration and Possible Exciting Sources Analysis in a Hydropower System. Applied Sciences. 2021; 11(12):5529. https://doi.org/10.3390/app11125529
Chicago/Turabian StyleShen, Aili, Yimin Chen, Jianxu Zhou, Fei Yang, Hongliang Sun, and Fulin Cai. 2021. "Hydraulic Vibration and Possible Exciting Sources Analysis in a Hydropower System" Applied Sciences 11, no. 12: 5529. https://doi.org/10.3390/app11125529