1. Introduction
The COVID-19 pandemic has threatened our normal coexistence during the last year. The pandemic public health menace was declared on 11 March 2020 by the World Health Organisation (WHO) [
1], assuming the expansion of the virus worldwide.
This has been caused by a respiratory virus known as the severe acute respiratory syndrome (SARS-CoV-2), which is a variant of the coronavirus family [
2]. Particularly, SARS-CoV-2 is closely related to two bat-derived SARS-like coronaviruses found in China in 2018 [
3] but still more research must be done to conclude which animal has served as intermediate host for the transmission of this virus to humans [
4,
5]. COVID-19 has followed the outbreak of two past emerging coronaviruses in the last two decades (SARS-CoV and MERS-CoV) with superior fatality rates but less capacity to survive and be transmitted to novel hosts [
6,
7].
Consequently, the rapid worldwide spread of the COVID-19 outbreak is explained by the virus’ ability to persist with infectious capacity in human bodies [
8] and the ability to easily propagate among humans [
9,
10]. In addition, COVID-19 has shown an initial asymptomatic stage since alveolar macrophages, which are likely the first cells to encounter SARS-CoV-2 during the infection are incapable of sensing the virus in the first stages [
11]. This asymptomatic behavior of the virus has been demonstrated to play a key role in the virus propagation, even doubling the effect of the symptomatic cases [
12].
This silent transmission is a challenge for controlling the virus, which has promoted the contact tracing strategy for detecting possible asymptomatic transmissions in the close contacts of detected infected people [
13]. Recently, some apps have extended contact tracing to anonymous people through mobile applications for increasing the efforts to contain the virus propagation [
14] although some controversial discussions have been generated to maintain the protection of the user’s data [
15].
However, all the technology deployed for dealing with the virus has shown insufficient capacity to totally eradicate the virus during the last year. The problem is that the more people infected, the more possibilities for the virus to mutate and better adapt to their hosts [
16] being able to reinfect past patients [
17] or becoming an endemic virus. Some reports suggest that this final endemic phase of the SARS-CoV-2 could be less harmful than the common cold [
18].
Meanwhile, the virus is dynamically adapting to being able to expand the replication of its RNA to a greater number of people. In this sense, in the last months, novel SARS-CoV-2 strains have been detected in the UK (B.1.1.7), South Africa (501Y.V2), Brazil (P.1) or recently in Nigeria (B.1.525). Recent studies suggest that the transmission advantage of the UK strain can boost from 50% to 75% the previous coronavirus strain [
19] thus increasing the number of positive tested people in December and January in the UK, forcing a novel lockdown in the country for controlling the outbreak promoted by the prevalence of the new strain. Similar behaviors of the other strains are being observed, therefore, the fight against SARS-CoV-2 is still a challenging topic.
However, optimistic signs have started to appear due to the recent surge of vaccines to protect the population. The necessity for developing the vaccines in a record time has promoted a new generation of vaccines not based on inactivated virus, live attenuated virus or purified proteins from the virus [
20].
These novel vaccines are based on the development of sequence information alone, not depending on the ability to culture the virus, thus speeding up the development of new vaccines. These vaccines have been approved for use in humans, showing effective protection against the virus and their rollout has started with the hope of ending the pandemic strength. However, this rollout has been controversial due to the large number of people needed to be vaccinated to achieve herd immunity [
21,
22], the acceptance of the people to receive a vaccine [
23] and the doubts about the effectiveness of the vaccines against the new strains [
24].
Therefore, many issues still have to be solved in this unprecedented global health crisis and living with the virus seems it will last at least a few more months. The main difficulty is to control the virus spread together with other implications derived from the measures implemented to face possible novel outbreaks. This has caused an interruption of normal educational activities [
25], severe economic impacts [
26], hostelry closures [
27] or the appearance of other different health problems related with confinement periods [
28].
Consequently, scientists are studying the transmission of the SARS-CoV-2 [
29]. Especially, studies conducted in indoor environments, where the infection rates increase [
30], have highlighted the importance of the airborne transmission of the virus [
29] suggesting humid places [
31], providing ventilation systems to continually renovate the air [
32], wearing face masks [
33], controlling CO
2 concentrations [
34] and guaranteeing an interpersonal distance of more than 2 m [
35], to prevent the propagation of the virus.
In this last sense, keeping social distance has been demonstrated to be difficult in indoor spaces when the people are moving around [
36] but that is not the case when people maintain their location in a fixed position. This is the case for students in their classrooms, tables in hostelry or seats in the cinema. The proven effect of the interpersonal distance when wearing face masks in indoor spaces for reducing the contagion probability of the SARS-CoV-2 [
33] inspired our past research on the optimisation of table location in schools [
37].
For this reason, we analyse in this paper a novel problem that surged in the pandemic (i.e., the intelligent table disposition to maximise the social distance in a closed environment) which allows the design of safer indoor environments in public places during the pandemic. Although governments have suggested following regular patterns of table location for satisfying the interpersonal distance demands in indoor places, this is not the most appropriate space design to take advantage of the particularities of the room.
Thus, we previously introduced a Genetic Algorithm (GA) optimisation for the TLP during the COVID-19 pandemic [
37]. The TLP is very close to the Node Location Problem (NLP) [
38] which is a combinatorial problem that has been assigned as NP-Hard [
39] suggesting its addressing from a metaheuristic technique.
This GA proved to be efficient in regular environments, such as school classrooms, but the definition of obstacles inside the potential region for the tables to be located significantly increased the difficulties during the optimisation process. In addition, the exploration of local regions around the location of a particular table (i.e., the neighbourhoods of a table) represented a challenge for optimisations without introducing knowledge during the optimisation process. This problem produced sub-optimal locations for the utmost tables not using all the available space for locating these particular tables.
For these reasons, we propose in this paper a Memetic Algorithm (MA) optimisation of the TLP in a hostelry application environment. This MA combines the ability of the GA to diversify the search for optimal potential regions of the space of solutions with a Local Search (LS) procedure [
40] which allows the introduction of knowledge in the optimisation process, addressing the restrictions of the hostelry needs for providing an optimal service to the clients.
The TLP can be defined as a discontinuous optimisation problem since its fitness evaluations can notably differ for contiguous table dispositions. This is due to the exclusive evaluation of the close tables to maintain the maximum interpersonal distance in the tables of the restaurants. This makes the TLP to be not-globally addressable by derivative processes since the relation among the coordinates of the tables (i.e., the decision variables of the optimisation) is changing during the optimisation process. However, the function is locally derivable if we consider a fixed situation of the table disposition, thus allowing the definition of a direction of maximum increase of the fitness for a particular table. This statement encourages the consideration of a Gradient Based Local Search (GBLS) technique for locally improving some individuals of the GA population. We take advantage of this situation in this paper to define a MA for the TLP improving our previous optimisation results in an actual hostelry application with its particularities.
The remainder of the paper is organised as follows: we define the TLP and present the scenario of application in
Section 2, we introduced the MA together with the GBLS procedure in
Section 3, the optimisation results are presented in
Section 4 while
Section 5 concludes the paper.
2. Problem Definition and Scenario of Application
The TLP is an NP-Hard combinatorial optimisation problem [
37]. It is similar to the coverage NLP in which the designer looks for an optimal deployment of sensors in space for maximising the capabilities of a sensor network [
41,
42]. In the TLP, the objective is the finding of the optimal Cartesian coordinates of the tables in space (i.e., the decision variables) to particularly fit a table disposition in an indoor environment both allowing the introduction of the highest number of tables and the guaranteeing of the maximum distance among the tables to preserve the social distance in the COVID-19 pandemic.
These are inverse optimisation criteria. While the introduction of a higher number of tables reduces the maximum reachable distance among the tables, the reduction of the number of tables to be located allows a higher distance among the tables. Therefore, the designer must choose between the maximisation of the number of tables while maintaining the social distance or increasing the distance for a predetermined number of tables.
In this section, we address the TLP through its mathematical characterisation, a state-of-art revision of the close NLP for defining the typical methodologies to solve this problem and the definition of the real scenario in which we perform the table location optimisation.
2.1. Mathematical Characterisation
The TLP aims to find the optimal combination of tables in space maintaining the social distancing. This combinatorial problem must be discretized in order to explore a contained number of possible solutions configuring an exploratory attainable problem [
43]. The number of possible combinations can be calculated as follows:
where
P is the number of possible combinations of tables in the defined scenario,
the number of tables to be located in the scenario and
the number of the possible locations for the tables defined through the discretization of the scenario. This discretization has been done based on slightly changes in the attainment of the optimal fitness values of the TLP [
37].
Therefore, a set can be defined containing all the possible solutions of the TLP. The aim is to find the subset which is formed by the coordinates of each of the tables in space which maximises the fitness function.
Therefore, the mathematical model for the optimisation of the TLP is detailed hereafter:
where
are the lower and upper bound for the Cartesian coordinates of the tables in the defined environment;
U is the subset of
T containing the forbidden regions of the simulations environment for locating any table (e.g., the bar counter or regions for the movement of the waiters or clients) and
the Euclidean distance among two different tables
i and
j of the subset
, being
greater than the minimum interpersonal distance
, in this paper, 1.5 m as established by the Spanish legislation. The distance from table
i to the closest obstacle is defined as
, which must be greater than the serving distance
, for the waiter to attend all tables.
The introduction of the Euclidean distance as a way to measure the quality of a table disposition and as a restriction in the TLP makes it to be a non-linear optimisation. This definition, together with the discontinuity of the fitness function, favour the introduction of metaheuristics for addressing this research problem.
2.2. State-of-the-Art Methodologies for the TLP
The recent surge of the TLP during the COVID-19 pandemic has promoted the lack of scientific background in analysing the TLP. However, it is a problem that is very close to the coverage NLP. In the case of the NLP, the objective is to guarantee the coverage of a sensor network meeting the design requirements. Therefore, the solution of this problem entails the location of the sensor nodes in a determined location to ensure an effective link among the target and the sensor nodes in all the coverage range [
44].
This leads to two different optimisation problems: the location of the minimum number of nodes to assure the coverage in all the regions of interest of the sensor network or maximising the system properties for a pre-determined number of sensor nodes. These are exactly the inverse criteria of the TLP: maximising the number of tables in a particular space keeping the social distancing or maximising the distance between the tables for a pre-determined number of tables.
In addition, the TLP must also be treated as a combinatorial non-linear discontinuous optimisation as the NLP in Non-Line-of-Sight scenarios [
45]. Therefore, we can conclude that the bibliography of the NLP is optimal to address the TLP due to the absence of appropriate research at the moment and the closeness of the two problems.
Although exact solutions to the NLP are proposed in the literature [
46], the most extended methodologies are the metaheuristics, due to the huge dimension of the space of solutions. This is also the case for the TLP. The firefly algorithm [
47], the grey wolf optimiser [
48], GA [
49,
50], simulated annealing [
51], the elephant herding optimisation [
52], cuckoo search [
53] or MA [
45,
54,
55] have been proposed for the NLP.
In this paper, we analyse the consideration of the MA for the TLP, which has shown an excellent adaptation to large-scale global optimisation problems [
56] which is especially suitable for addressing the TLP. We propose an extended and enhanced methodology for the TLP with regards to our previous research, which first stated the problem and solved it through GAs [
37].
Particularly, GA permits more flexibility for the adaptation to the TLP due to the large number of encodings and genetic operators that we studied in our previous work [
37]. In addition, the GA enables a good exploration stage of the space of solutions which allows the finding of potential good locations for the tables which are later enhanced through the GBLS and also allows an optimal control pressure in the hyperparameters of the optimisation to achieve competitive performance in large-scale problems with discontinuities in the fitness function such as the TLP.
For these reasons, a MA, containing a GA as the base algorithm of the optimisation, has been selected for the TLP instead of other hybridisations of LS with other heuristic algorithms such as particle swarm [
57,
58,
59].
The selection of a GBLS procedure is based on the local derivability of the problem, achieving an improvement of the fitness value of the GA individuals.
We apply a GBLS procedure based on the local derivability of the problem in order to improve the fitness of the GA individuals.
This process is applied gradually to the tables of the optimisation from the more promising candidate tables to improve their properties (i.e., minimum distance with the other tables) to the least based on the value of the gradient calculation and we control not to introduce the particular table in a conflict zone with other different tables making the LS procedure ineffective. This allows us to improve our previous results thus supposing a novelty for the TLP.
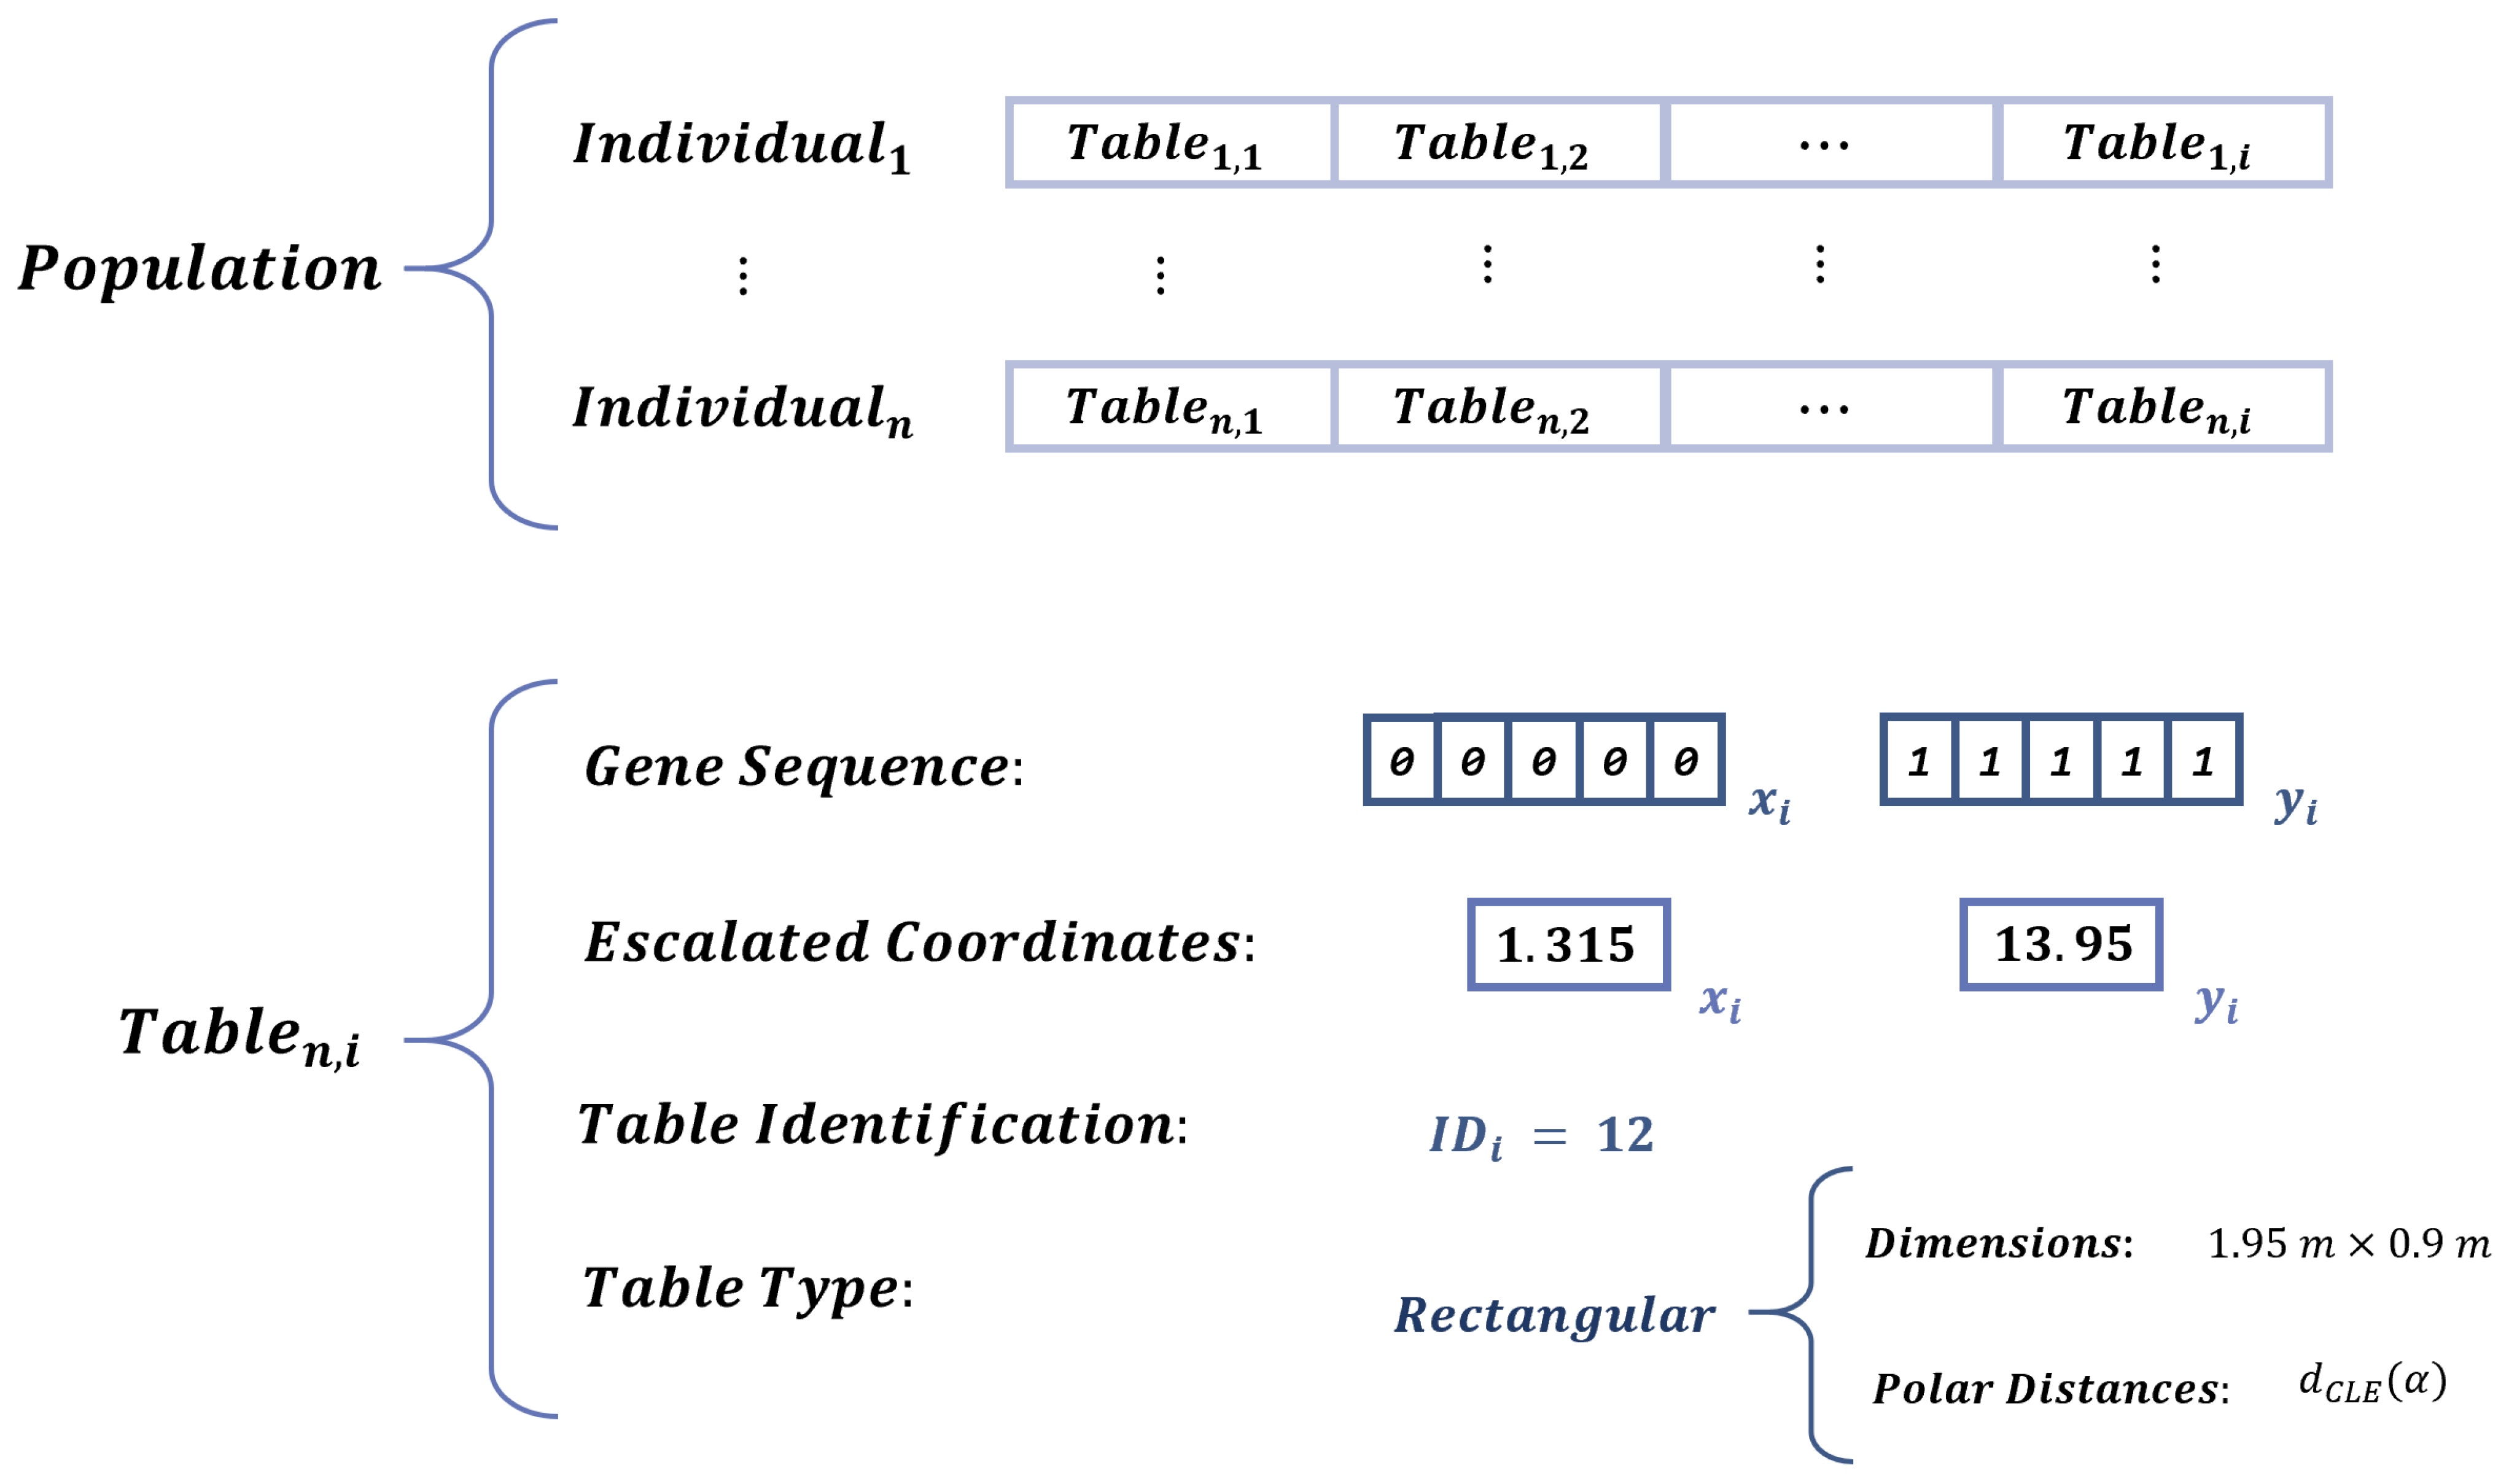
2.3. Table Characterisation
The TLP aims to obtain the table distribution that maximises the interpersonal distance separation. However, certain aspects regarding the table characterisation of the problem must be specified for each scenario of application.
In previous studies [
37], a GA was proposed for solving the TLP in a conventional classroom environment. In these scenarios, each table contains a single student, thus the desired separation can be defined as the Euclidean distance from student to student.
However, the hostelry sector requires a different approach. In common restaurant or pub tables, multiple individuals are expected to be allocated around each table. Moreover, the number and position of the chairs around the table may differ depending on the client’s requirements.
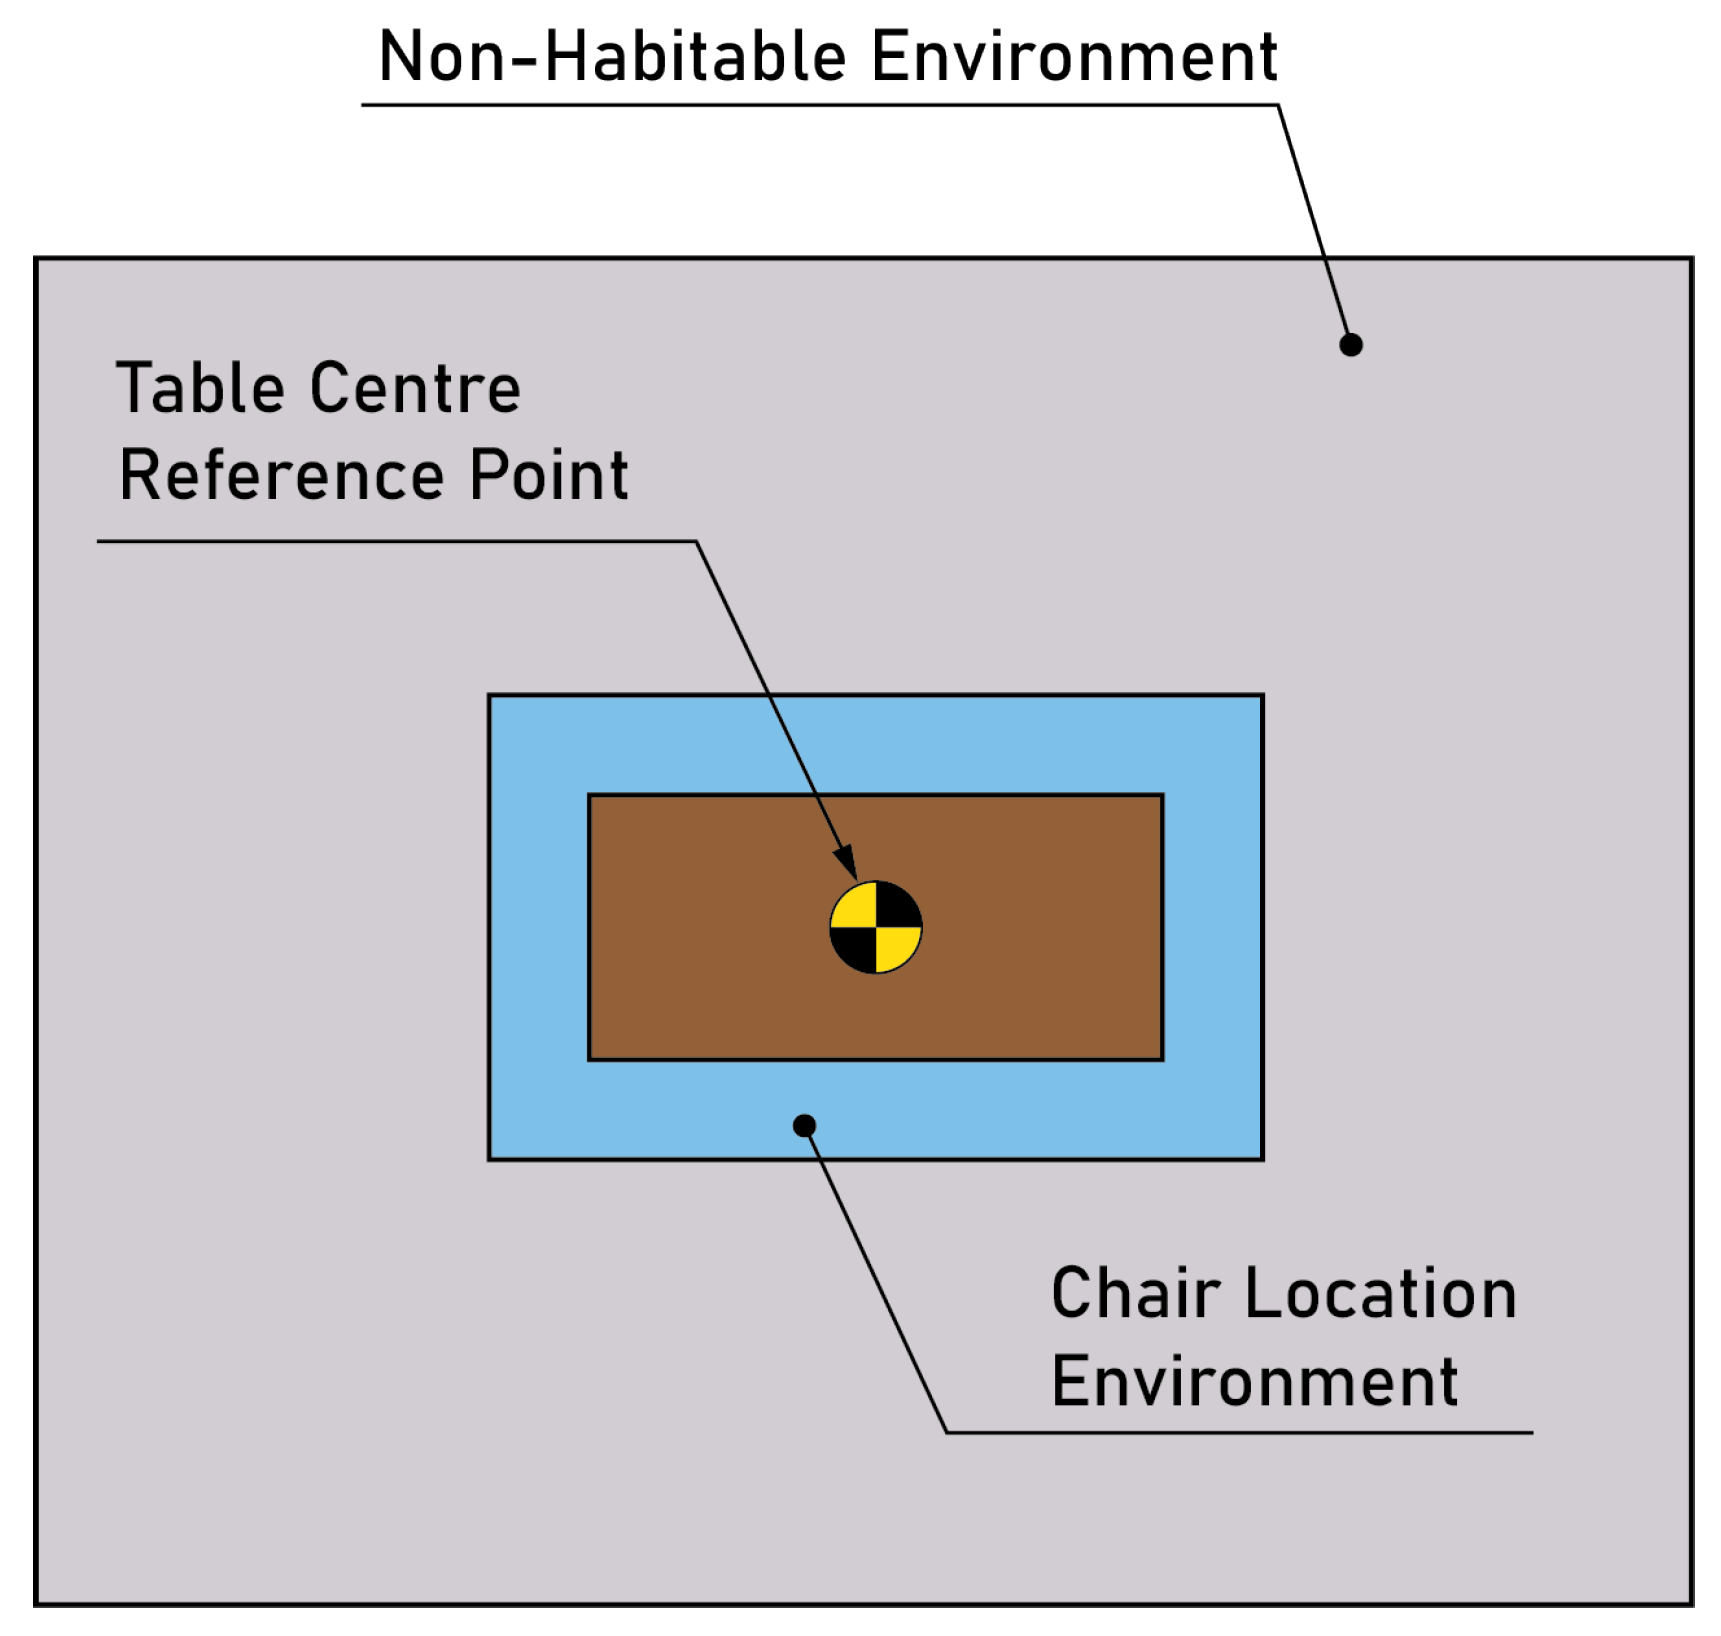
Therefore, in search of a more flexible approach, we have defined a Chair Location Environment (CLE) around the table where the diners are expected to be allocated. The definition of this environment isolate the chair placement from the TLP, resulting in a greater flexibility for the restaurant manager.
However, the evolution from a singular chair point to the CLE also reshapes the Non-Habitable Environment (NHE) from the resulting circle from the student perspective analysed in previous studies to a rectangular that contains the CLE, as shown in
Figure 1.
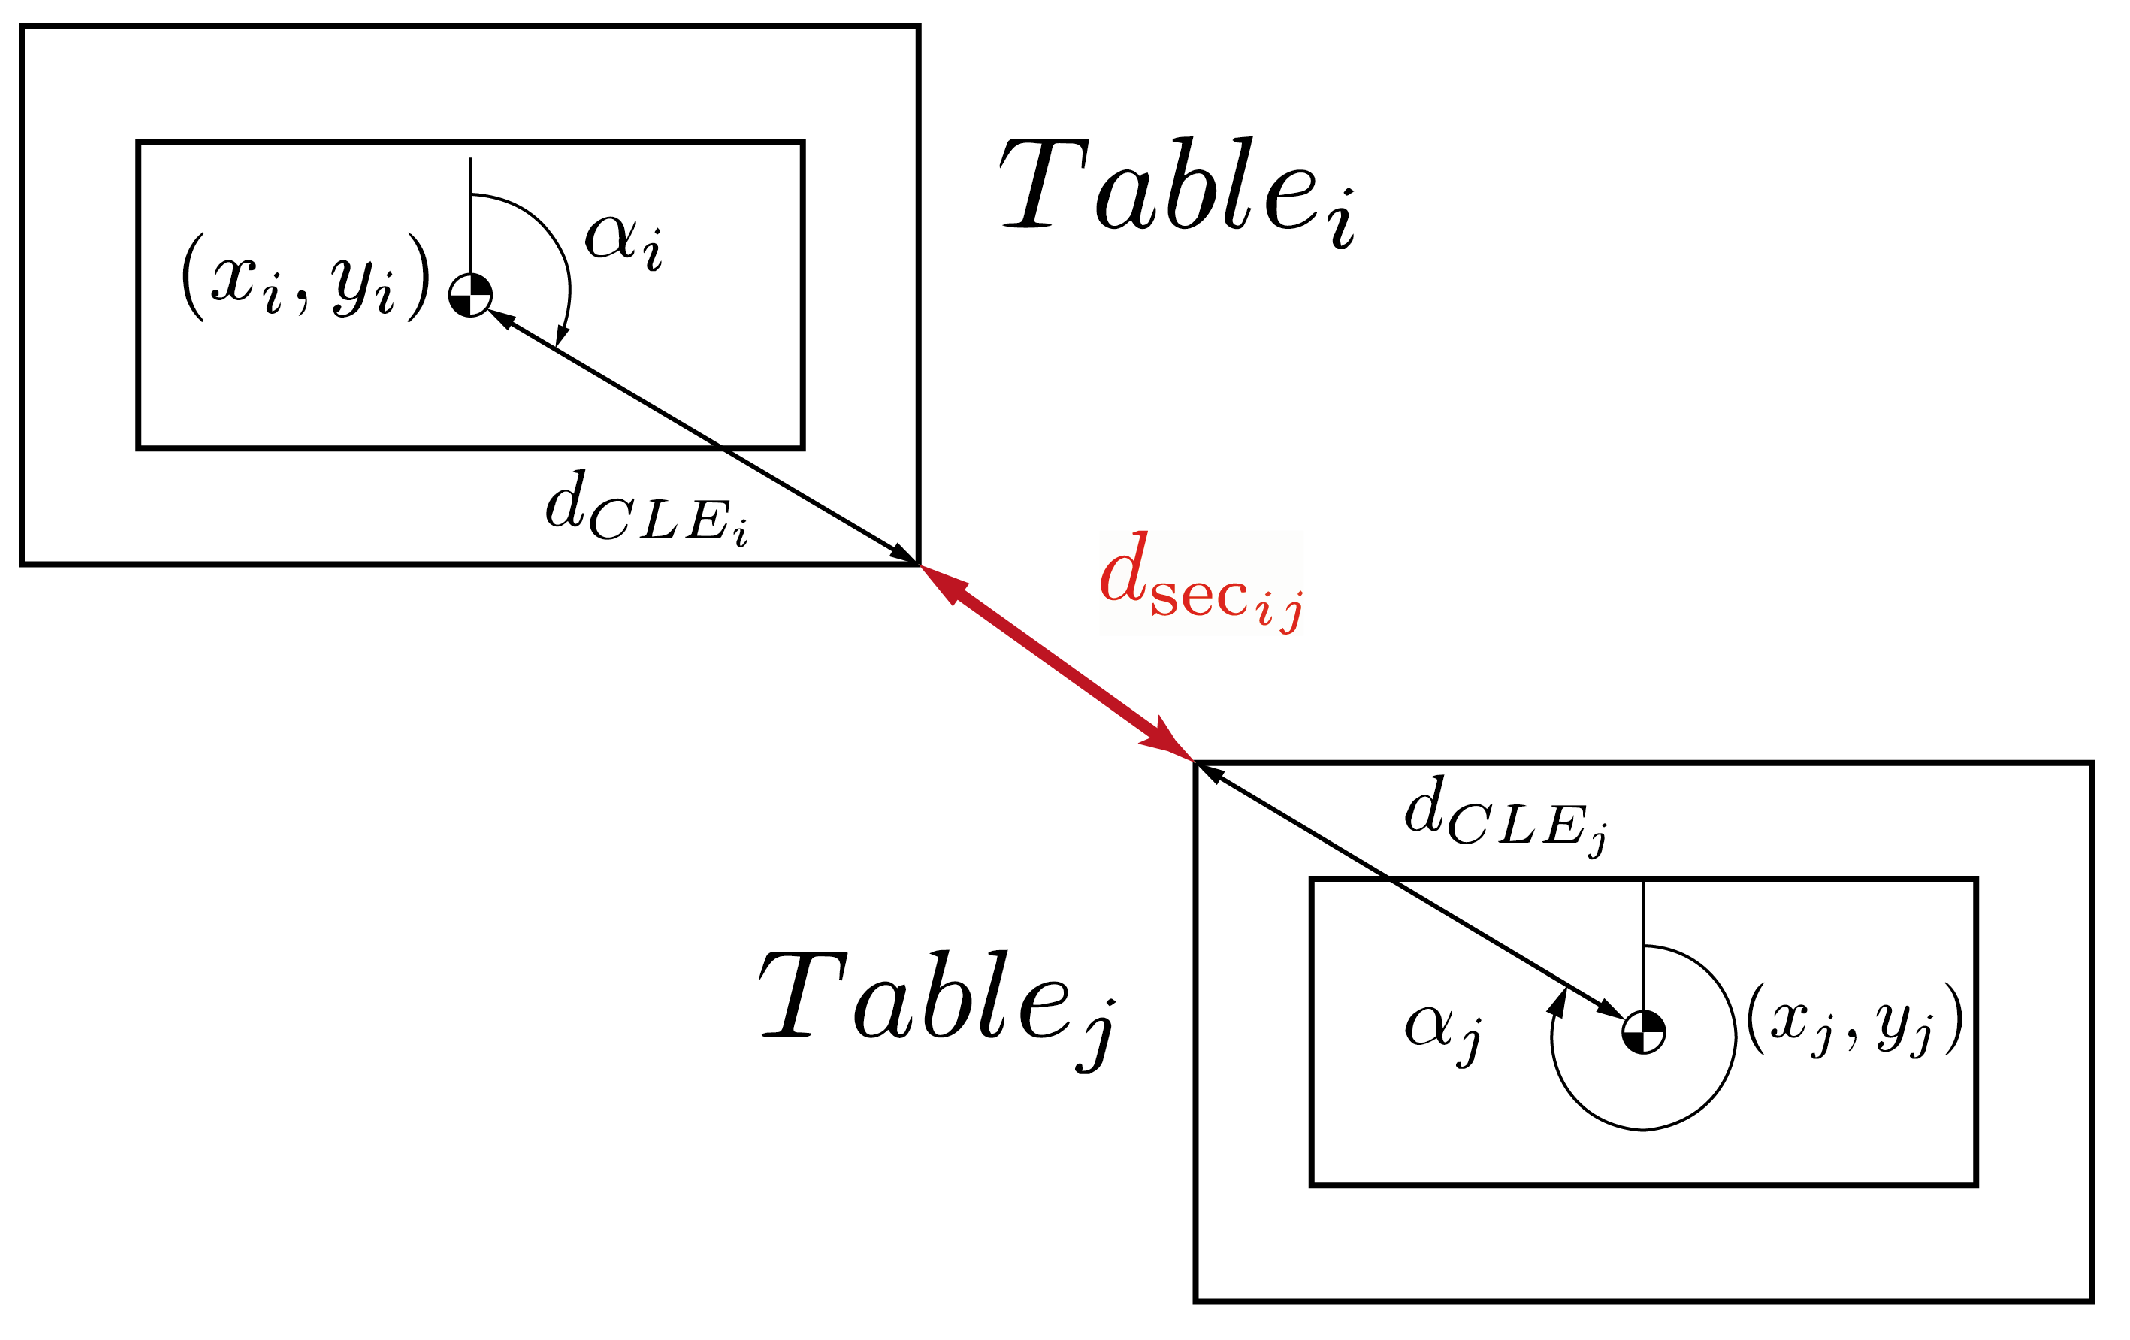
However, the implementation of the CLE as a limiting region must be taken into consideration when obtaining the interpersonal distance separation. Nevertheless, knowing the dimensions of each region, it is possible to deduce the equivalent distance of intersection between the CLE of pairs of tables.
Figure 2 shows the table interaction chart. The geometry of the selected rectangular tables results in a variation of the security distance with the angle of incidence between tables as stated in Equation (
3).
where
is the Euclidean distance from table-to-table centres.
Therefore, the CLE dimensions being known, it is possible to deduce these distances from the angle of intersection () between tables. However, the MA optimisation proposed requires the evaluation of this table interaction during a considerable number of iterations. The resulting CLE distances could be obtained through some trigonometric relations. However, these operations introduce an increment in complexity from the initial Euclidean distance, resulting in a significant increase in the computational cost required for the optimisation.
Nevertheless, it is possible to improve the efficiency of this evaluation by predetermining a polar distribution of the
distance for a discrete distribution of intersection angles. This distribution can be generated before the MA takes place, kept stored inside the table codification for future evaluations, as shown in
Figure 3.
The proposed polar definition of the CLE distances achieved an increase of up to 80% in time efficiency, reducing the complexity of the distance algorithm from trigonometric evaluations to finding values in a stored list, thus improving the overall efficiency of the MA optimisation.
2.4. Real Scenario for the TLP Optimisation
The TLP represents a considerable problem for a wide variety of establishments. In previous studies [
37] a GA optimisation was presented for optimising the table distribution in multiple classrooms of the Marist Brothers School San José in the city of León, Spain.
However, the application of this optimisation is not limited to educational scenarios. Through limited variations regarding the table characterisation, it is possible to perform the table distribution optimisation in different environments.
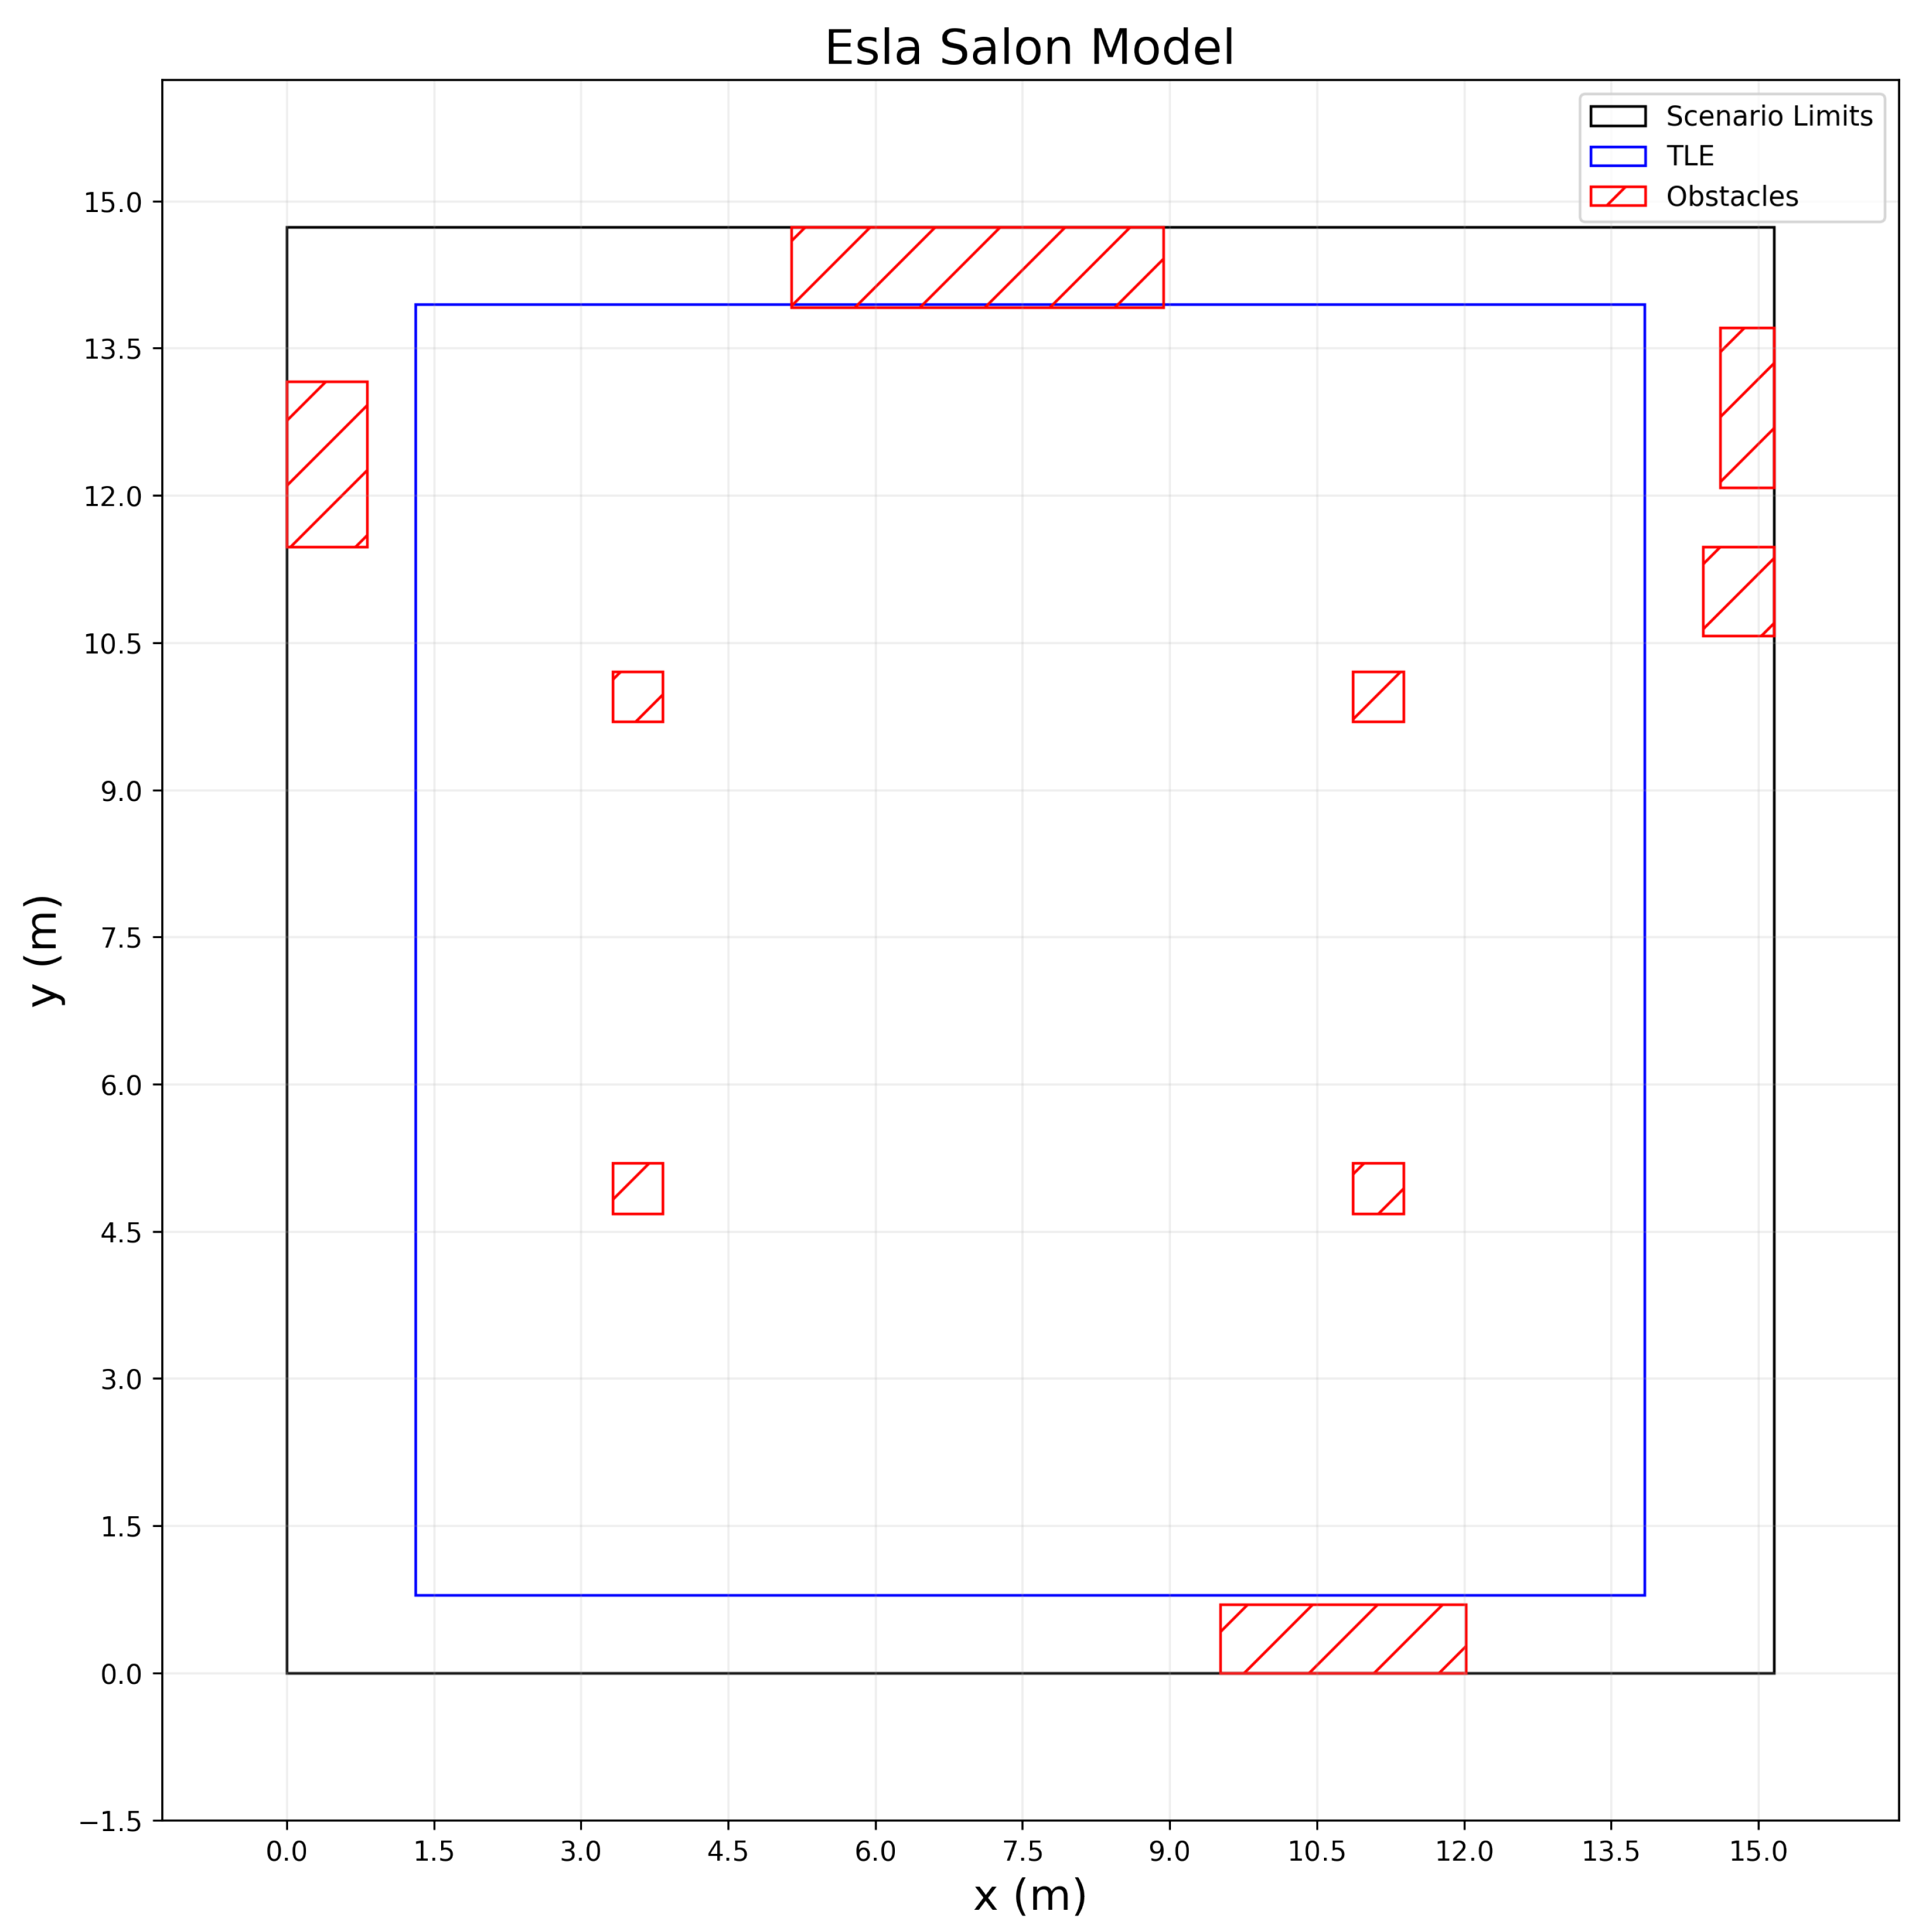
Therefore, in this paper, the TLP is addressed for the Esla Salon at the Conde Luna Hotel in the city of León, Spain. The Esla Salon is a flexible space whose table disposition varies depending on the customer requirements. Hence, the managers of the establishment rearrange the table dimensions and locations depending on the celebration and the number of customers. As told by the managers, this task proved a significant challenge, especially for grand celebrations, where limited space was available for waiters to assist the diners.
Moreover, the complexity of this task escalated substantially with the introduction of the COVID-19 measures, restricting the maximum number of people allocated and enforcing a minimum interpersonal distance separation. Thus, the implementation of this scenario for the TLP optimisation proved ideal due to the required flexibility and limitations.
The modelling of the Esla Salon is based on the definition of three different regions. The first region represents the scenario limits, thus containing the rest of the regions. The second area is defined as the Table Location Environment (TLE), it represents the real limits where a table centre can be located. Therefore, the difference between these two regions depends on the table measurements, the CLE and other considerations such as the introduction of additional space for waiters.
Finally, the third and last region consist of the obstacles or prohibited regions for table placement. As shown in
Figure 4, certain areas of the Esla Salon, such as exits and columns represent a direct restriction for the table placement.
These obstacles are represented in consideration to their true dimension, however, in the MA optimisation, the prohibited areas are referred to the table centre, taking into consideration the table dimensions and other imposed limits for the CLE.
Therefore,
Table 1 shows the implemented measurements and properties obtained from the studied scenario.
One of the main advantages of the proposed optimisation is its capability for obtaining the optimal table distribution for the specified table requirements. Therefore, two optimisation strategies are available when planning a table arrangement.
The first strategy is to allocate the maximum number of tables (i.e., maximum capacity) while satisfying the imposed restrictions. On the other hand, the second strategy aims to obtain the most disperse distribution for a sub-optimal number of tables (i.e., maximum dispersion).
Furthermore, the table dimensions and other parameters shown in
Table 1 correspond to a singular configuration of banquet in the Esla Salon. Therefore, it could be possible to modify these parameters depending on the manager requirements, achieving a greater degree of flexibility, thus improving the table distribution for conventional usage, regardless of COVID-19 restrictions.
3. Memetic Algorithm Optimisation for the TLP
3.1. MA Fundamentals
The Memetic Algorithm (MA) is a specialisation method that is particularised for a concrete domain. This technique was first defined by P. Moscato [
40] in 1989 based on the concept of “meme” introduced by Richard Dawkins [
60] in 1976. This concept alludes to the evolution of the genes that form the individual through the cultural context, reaching better individuals by the introduction of explicit knowledge about the problem to be solved (i.e., it is not an exclusively biological evolution).
MAs are mainly applied in the field of combinatorial optimisation because of their success in solving NP-hard problems [
61,
62]. In the literature its implementation can be observed in diverse problems such as frequency allocation [
63], traffic optimisation [
64], evolutionary robotics of virtual bots [
65], training of neural networks [
66], job-shop scheduling problem [
67], node location problem [
38,
68], cryptanalysis [
69], graph colouring [
70], even for influence maximisation in social networks [
71].
The application of this algorithm in the literature is linked to the complexity of the problem to be addressed. The TLP problem we address in this manuscript is categorised as NP-Hard [
37], therefore it is not possible to reach an optimal solution in polynomial time. Moreover, the complexity of the fitness function, the discretization of the solution space, and its non-derivability precise the application of a heuristic technique.
The objective of the MA is to actively guide individuals towards the resolution of the problem of study. MA perform individual improvements in each of the population solutions by alternating local search (LS) techniques and genetic operators. In each LS run, it is determined which individuals are introduced to the algorithm through the selection operator (i.e., it is a first competition process). Subsequently, the LS procedure allows individuals to carry out self-improvement for better adapting to the problem [
72]. At the end of the LS execution, the individuals have another selection procedure to determine which survive and become members of the population through the replacement operator.
Throughout the following sections, we discuss in depth the configuration of the implemented Lamarckian MA (i.e., the individual improved by the LS replaces its predecessor [
73] as opposed to changing only its fitness) as well as the LS (i.e., we implement a metaheuristic technique instead of an exact approach) and the definition of the used neighbourhood [
38].
Furthermore, prior to each LS execution, it is necessary to analyse the individuals in the population to determine those that can be improved. In order to achieve favourable results, it is essential to strike a balance between the number of individuals to be introduced into the LS and the computation time of the algorithm. The function that determines the selection criteria of the individuals in the population is a decisive factor.
Elitism is a technique employed in metaheuristic algorithms that preserves the set of best individuals in the population at each iteration. The implementation of this strategy makes possible both to ensure that the algorithm never gets worse results and that it favours the final convergence of the population [
74]. Therefore, the algorithms enhance its performance rapidly through increased genetic quality at every iteration.
The LS chooses a set of elite individuals present in the population pool. Since the implemented algorithm is a substitution algorithm, obtaining an improvement over it does not affect its premature convergence (i.e., the existence of individuals with similar characteristics in the population favours convergence, so it is important to maintain diversification).
The selection of the same elitist individuals over several executions weakens the LS performance significantly. Hence, it is necessary to establish another set of individuals in order to avoid introducing exclusively elite individuals that have already reached their maximum improvement. For this reason, a random set of the population is selected in this paper to be executed together with the elites, enhancing the improvement potential of the MA.
3.2. Implementation of MA for the TLP
In previous studies, a GA implementation was presented for multiple scenarios. The proposed algorithm achieved results with mean distances up to 20% greater than any conventional strategy proposed for the optimal location of tables. However, some aspects regarding the convergence of the GA had room for improvement.
The complexity of the TLP scales with the number of tables introduced, being the separation of a moving table dependant of the coordinates of the adjacent tables. Therefore, a suboptimal placement of a particular table induces an undesired convergence for the rest of the table grid.
This problem proved significant when allocating the utmost tables, forming the grid periphery. It is required for the TLP optimisation to exploit all the available space for each scenario. However, in order to utilise all the existing room, it is necessary that the utmost tables are positioned at the scenario limits, thus leaving space for other tables to expand.
Nonetheless, the evolution of the GA individuals to this state proved remarkable troublesome. The degree of diversification required for the individuals to evolve to this state also compromised the convergence to an adequate solution.
Hence, the introduction of a LS that intensifies the most adequate tables into the optimal position could substantially improve the algorithm convergence and final solution.
However, the complexity of the problem is not reachable from a direct LS methodology. In order to obtain the most adequate solution, the exploration and intensification capabilities of a GA are required. Consequently, the most appropriate methodology is a combination of a GA evolution and an LS intensification, thus an MA optimisation.
3.3. MA Pseudo-Code
Algorithm 1 details the structure of the proposed MA for the TLP. Once defined, the scenario limits and table properties before the MA takes place, the algorithm elaborates a polar discretization of the CLE distances between tables. The stored discretization of the angle-to-distance relations will be imported on every distance evaluation, thus improving the overall efficiency of the optimisation substantially.
Moreover, once an original random distribution of the tables is created, the MA optimisation commences with the fitness evaluation of the population. The fitness value of each individual is obtained through a two-step fitness evaluation, detailed in previous studies [
37].
The fitness evaluation methodology is composed of two different evaluation phases. The first phase evaluates the validity of the proposed table distribution. Penalisations are assigned when the table distribution does not accomplish the distance separation requirements or certain tables are located in prohibited region. Thus, the following penalisations are evaluated:
| Algorithm 1: MA for the TLP (Table Dimensions, N, n, TLE, Obstacles, Convergence criteria,, LS Criteria, LS Depth) |
![Applsci 11 04957 i001]() |
The first step of the evaluation analyses the table restrictions, resulting in penalisations for extremely close tables or tables allocated in prohibited regions. These penalisations are proportional to the number of invalid tables and the severity of the infractions, being these values obtained from the following expressions:
where
is the penalisation for tables located inside a prohibited region, being
J the number of misplaced tables inside an obstacle and
a weight hyperparameter.
measures the sum of the squared distance deviations from the 1.5 reference meters, being
L the number of misplaced tables that contain distances under the required distance.
Once evaluated, these penalisations, the fitness evaluation methodology is selected accordingly to the obtained values. The individuals whose table distribution contains invalid table placements are evaluated through Equation (
5):
being the resulting value of this methodology contained in the interval
, where
l represents the number of computed distances,
.
Nonetheless, the non-penalisation of the individual causes the fitness value to be obtained through
, reaching a fitness value greater than 0. This segregation serves the purpose of enforcing the imposed restrictions into the MA convergence while preserving a valid proportional convergence to the desired solution.
where
is the mean distance;
is the standard deviation of the distance distribution;
l represents the number of computed distances,
;
n is the number of tables;
is a weight hyperparameter and
is the maximum distance for two tables to be considered close enough for distance evaluation.
Once evaluated, the population proceeds to the selection, crossover and mutation operators. These genetic operators have been selected experimentally according to the problem requirements of diversification and intensification [
75].
Furthermore, when the LS Criteria is fulfilled the LS algorithm takes place. This LS Criteria is introduced as LS Frequency parameter that enables the LS intensification once a certain number of generations have concluded.
The LS intensifies a certain number of candidates from the Population pool. Nonetheless, the selection criteria of some of these candidates is based on their fitness value, thus a certain percentage of the LS individuals is composed of the Elitist individuals.
However, a definite percentage of the LS individuals is obtained from random individuals, which enables a greater degree of exploration for the desired solution.
Therefore, for each selected individual, the LS intensifies each individual through multiple iterations, defined as LS Depth [
76]. In each iteration, a singular table from the intensified individual is selected.
This table selection evaluates the potential of each table movement, taking into consideration multiple parameters such as the number of adjacent tables and the minimum distance achieved. The adequate definition of the most appropriate table proved essential for the LS and MA optimisation performance. The designed algorithm and evaluated parameters of the table selection are detailed in
Section 3.4.
Once selected, the Gradient Based LS sequence takes place, where the selected table will move several times in the most appropriate direction, the GBLS methodology is detailed in
Section 3.5.
Finally, after the LS intensification, each individual is reevaluated with the modifications introduced by the LS algorithm. The individuals whose fitness value improved are implemented into the population pool, replacing their initial candidates, improving the convergence performance.
3.4. Table Selection for the GBLS
The selection of the most appropriate table for the GBLS plays a vital role in the fitness value improvement and the overall MA convergence. Moreover, due to the complexity of the TLP, an optimal table selection for every possible scenario is unreachable. However, we can elaborate a series of evaluations for guiding the table selection into the desired strategy.
One of the main objectives for the LS implementation is the exploration and exploitation of all available space. In previous studies, the utmost tables did not exploit completely the available space, due to the complexity of the table interaction. Nevertheless, an evaluation of the number of adjacent tables is conducted in order to deduce the tables located at the grid periphery.
Moreover, due to the table distribution distance restrictions, the two-stepped fitness evaluation proposed proved troublesome at evolving from the first step to the second one. In these individuals, certain tables remained under the desired 1.5 m restrictions, limiting the individual improvement. Hence, another parameter of the proposed table selection takes into consideration the minimum distance of each particular table, specially for invalid distances under the requested value.
Furthermore, the Esla Salon presented a significant challenge for the table distribution convergence when a higher number of tables was requested. The addition of the main columns of the Salon, along the restrictive table limits compromised the first stages of the algorithm convergence, when tables could not avoid all the existing obstacles of the scenario.
Therefore, another parameter was introduced into the selection algorithm that promoted the tables located inside a prohibited region. The GBLS algorithm was modified for these individuals in order to successfully avoid any existing obstacle, thus improving the overall performance of the optimisation.
Nevertheless, as stated before, due to the problem complexity, it is impossible to address every possible scenario in an optimum way. As a result, two additional considerations were implemented for directing the table selection.
In order to explore multiple tables in each LS application and to avoid the periodic intensification of a single table, a restriction was implemented so that every table could only be selected once per LS Frequency. However, once selected, every table can be moved multiple times, thus achieving all potential improvement for the particular table.
On the other hand, an additional random parameter
was implemented for the table selection for introducing some diversity into the table selection, which improved the performance of the LS significantly. Thus, the final selection intensity is deduced from the following expression.
where
is the selection intensity for each table, the selected table presents the minimum
among all tables;
is the number of proximate tables;
and
are weight hyperparameters and
is a
penalisation for the tables located inside a prohibited region.
The resulting complexity of the table selection algorithm represents the complexity of the TLP, and the necessity of a LS implementation along a genetic algorithm intensification and diversification capabilities.
3.5. Gradient Based Local Search
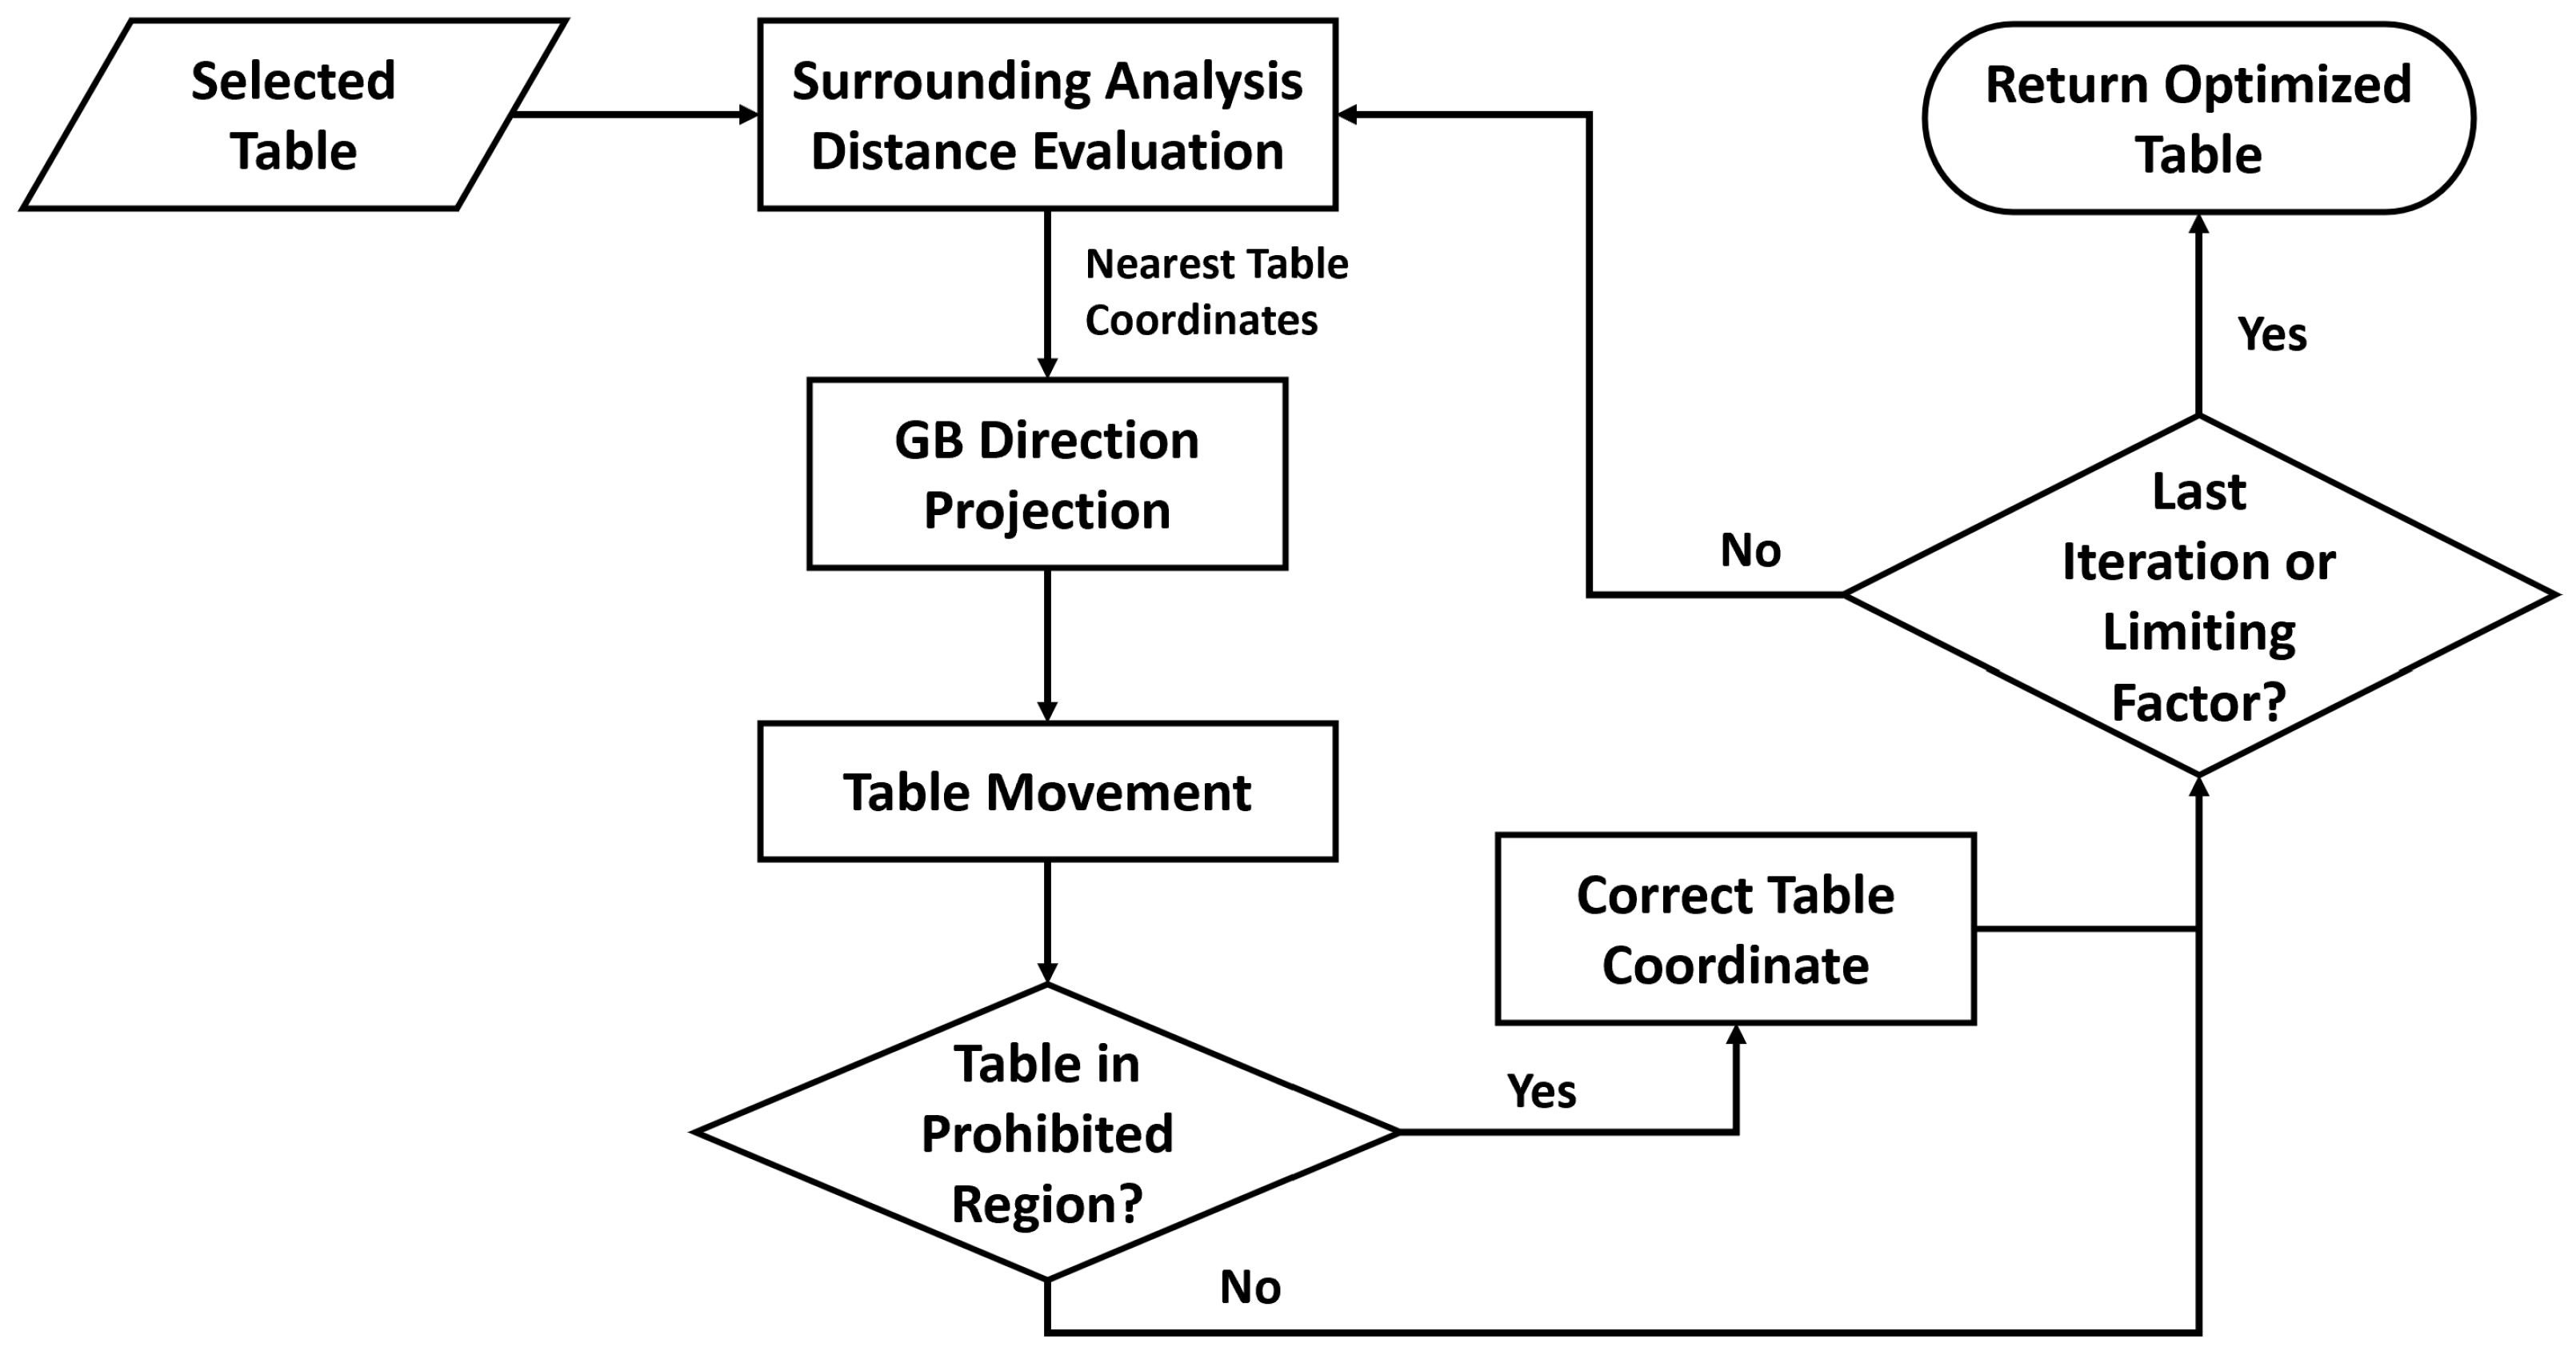
Once a table has been selected for the LS intensification, the GBLS procedure takes place. The objective of this algorithm is to modify the coordinates of the given table, moving it in the most appropriate direction.
Likewise to the optimal table selection, the definition of the optimal direction represents a considerable problem in the TLP, where a table position quality is dependant of all other adjacent tables.
Therefore, although it is possible to deduce the optimal direction of movement from the coordinates through the distance gradient, the obtained direction results unfavourable for the optimisation convergence to the desired solution for many scenarios. The minimum distance requirement, the presence of obstacles and the considerable number of possible table combinations compromises the performance of a global gradient approach.
However, the implementation of a local gradient, evaluated at the nearest table, proved an adequate solution for the proposed problems. The direction obtained from the local gradient, shown in Equation (
8), indicates the most appropriate direction of movement locally. This direction is then projected into the nearest diagonal direction due to the addressing of a discrete optimisation in the TLP.
where
are the coordinates of the selected table and
are the coordinates of the nearest table.
Once the selected table is moved into the deduced location, the table surroundings are reevaluated. If the table entered a prohibited region, the table position is redirected to the nearest point outside the obstacle area. After this evaluation, the distances to adjacent tables are reevaluated, and the closest table is anew obtained.
Once the nearest table is redefined, the previously detailed procedure resumes until a certain number of iterations have been completed or a certain limiting factor takes place (e.g., like the position of the selected table in a scenario corner). The resulting methodology, shown in
Figure 5 achieved adequate solutions, due to the flexibility of the movement projection and local gradient evaluation. However, the performance of this GBLS is significantly dependant on the quality of the selected table, thus the importance of this selection.
Furthermore, if the GBLS starts with a table located inside an obstacle, the algorithm considers the obstacle’s centre as the most proximate table, avoiding the obstacle collision evaluation. Therefore, after a sufficient number of iterations, the selected table finally escapes from the collided obstacle or improves its location in the global table disposition.
4. Results
In this section, the MA optimisation for the TLP in the hostelry application proposed is analysed and compared to the GA developed in previous studies [
37]. The MA and every simulation was coded and executed in the Python software environment. All simulations were performed with an Intel(R) i7 2.4 GHz of CPU and 16 GB of RAM.
The presented results were obtained from the same simulation parameters, shown in
Table 2.
Furthermore, the LS hyperparameters selected for the MA simulations are shown in
Table 3.
Two different configurations have been analysed for the Esla Salon. The first configuration is a 18 table distribution. It is deduced from previous simulations that this is the maximum number of tables to be positioned inside the proposed scenario, thus, the first configuration represents the maximum capacity problem.
On the other hand, the second configuration is a 15 table distribution. In this analysis, we aim to obtain the table distribution that optimises the available distance among tables with a suboptimal capacity, therefore, a maximum dispersion problem.
Furthermore, multiple tests have been executed with the GA and MA with the optimisation hyperparameters shown in
Table 2 and
Table 3, being the best solution of each configuration selected for comparison.
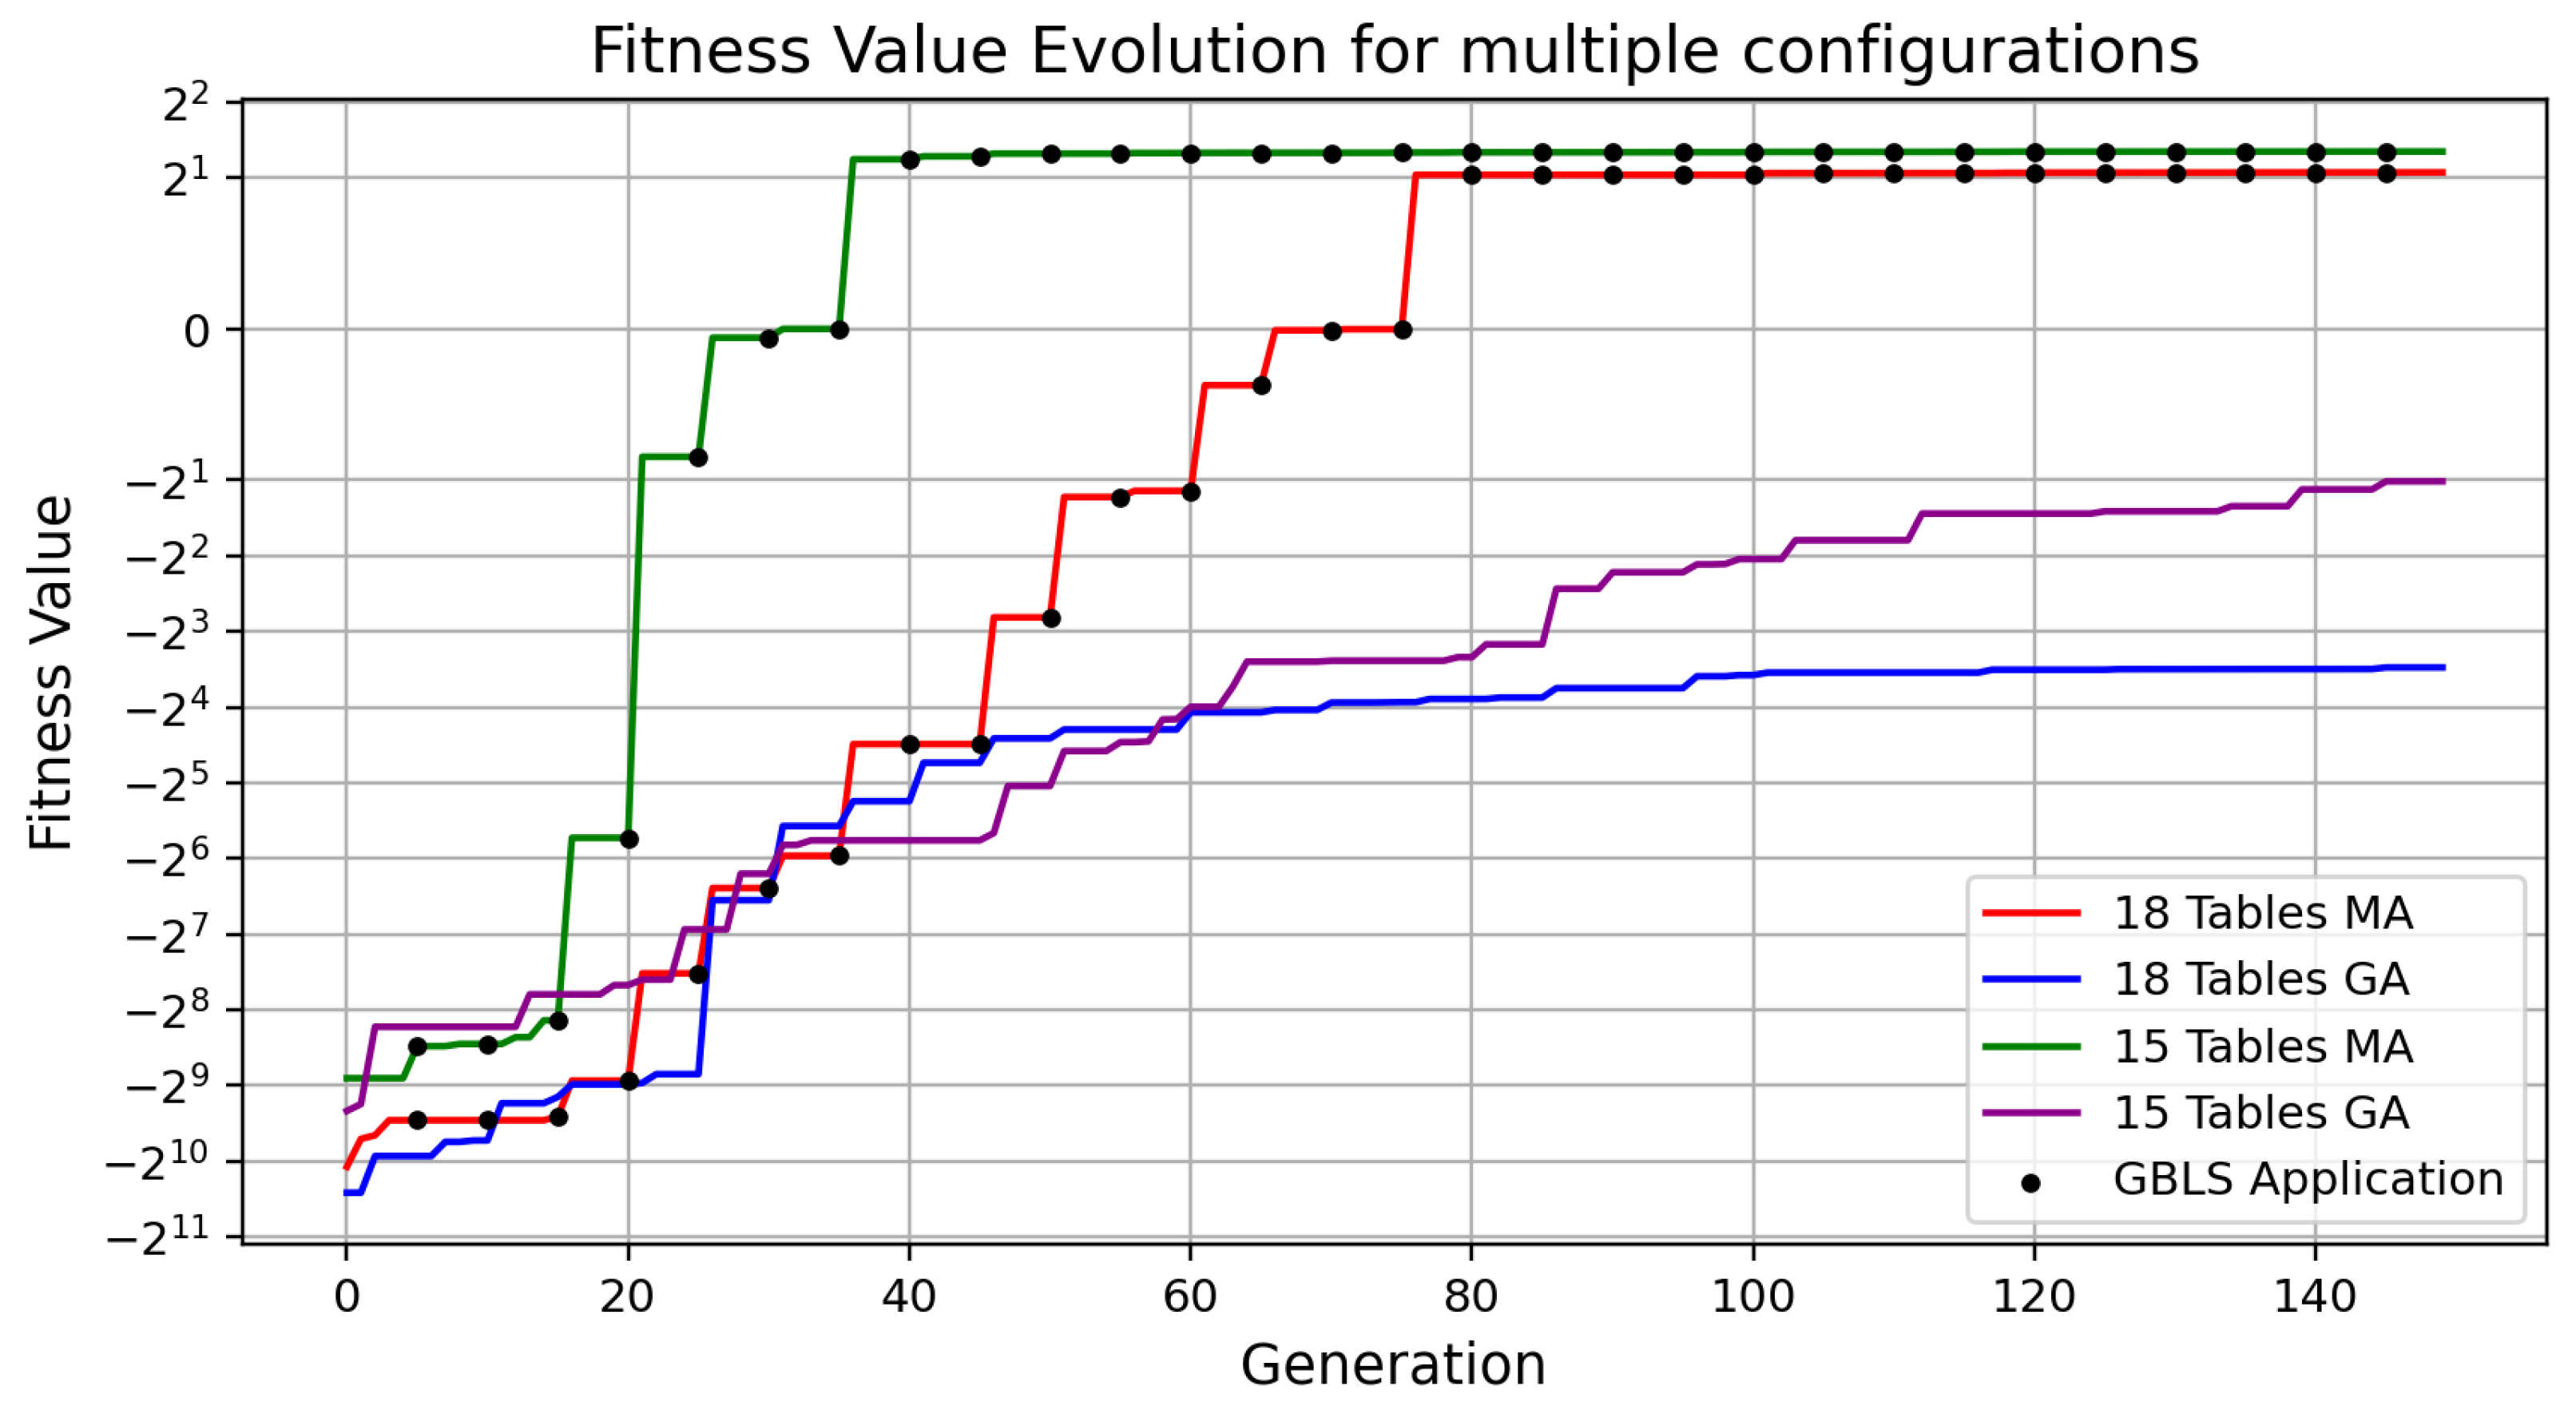
Figure 6 shows the fitness value evolution of every proposed configuration throughout the generations.
Figure 6 shows a considerable improvement for both MA techniques in the overall optimisation performance and obtained solution. The fitness value improvement with each LS application denotes the effectiveness of the proposed methodology.
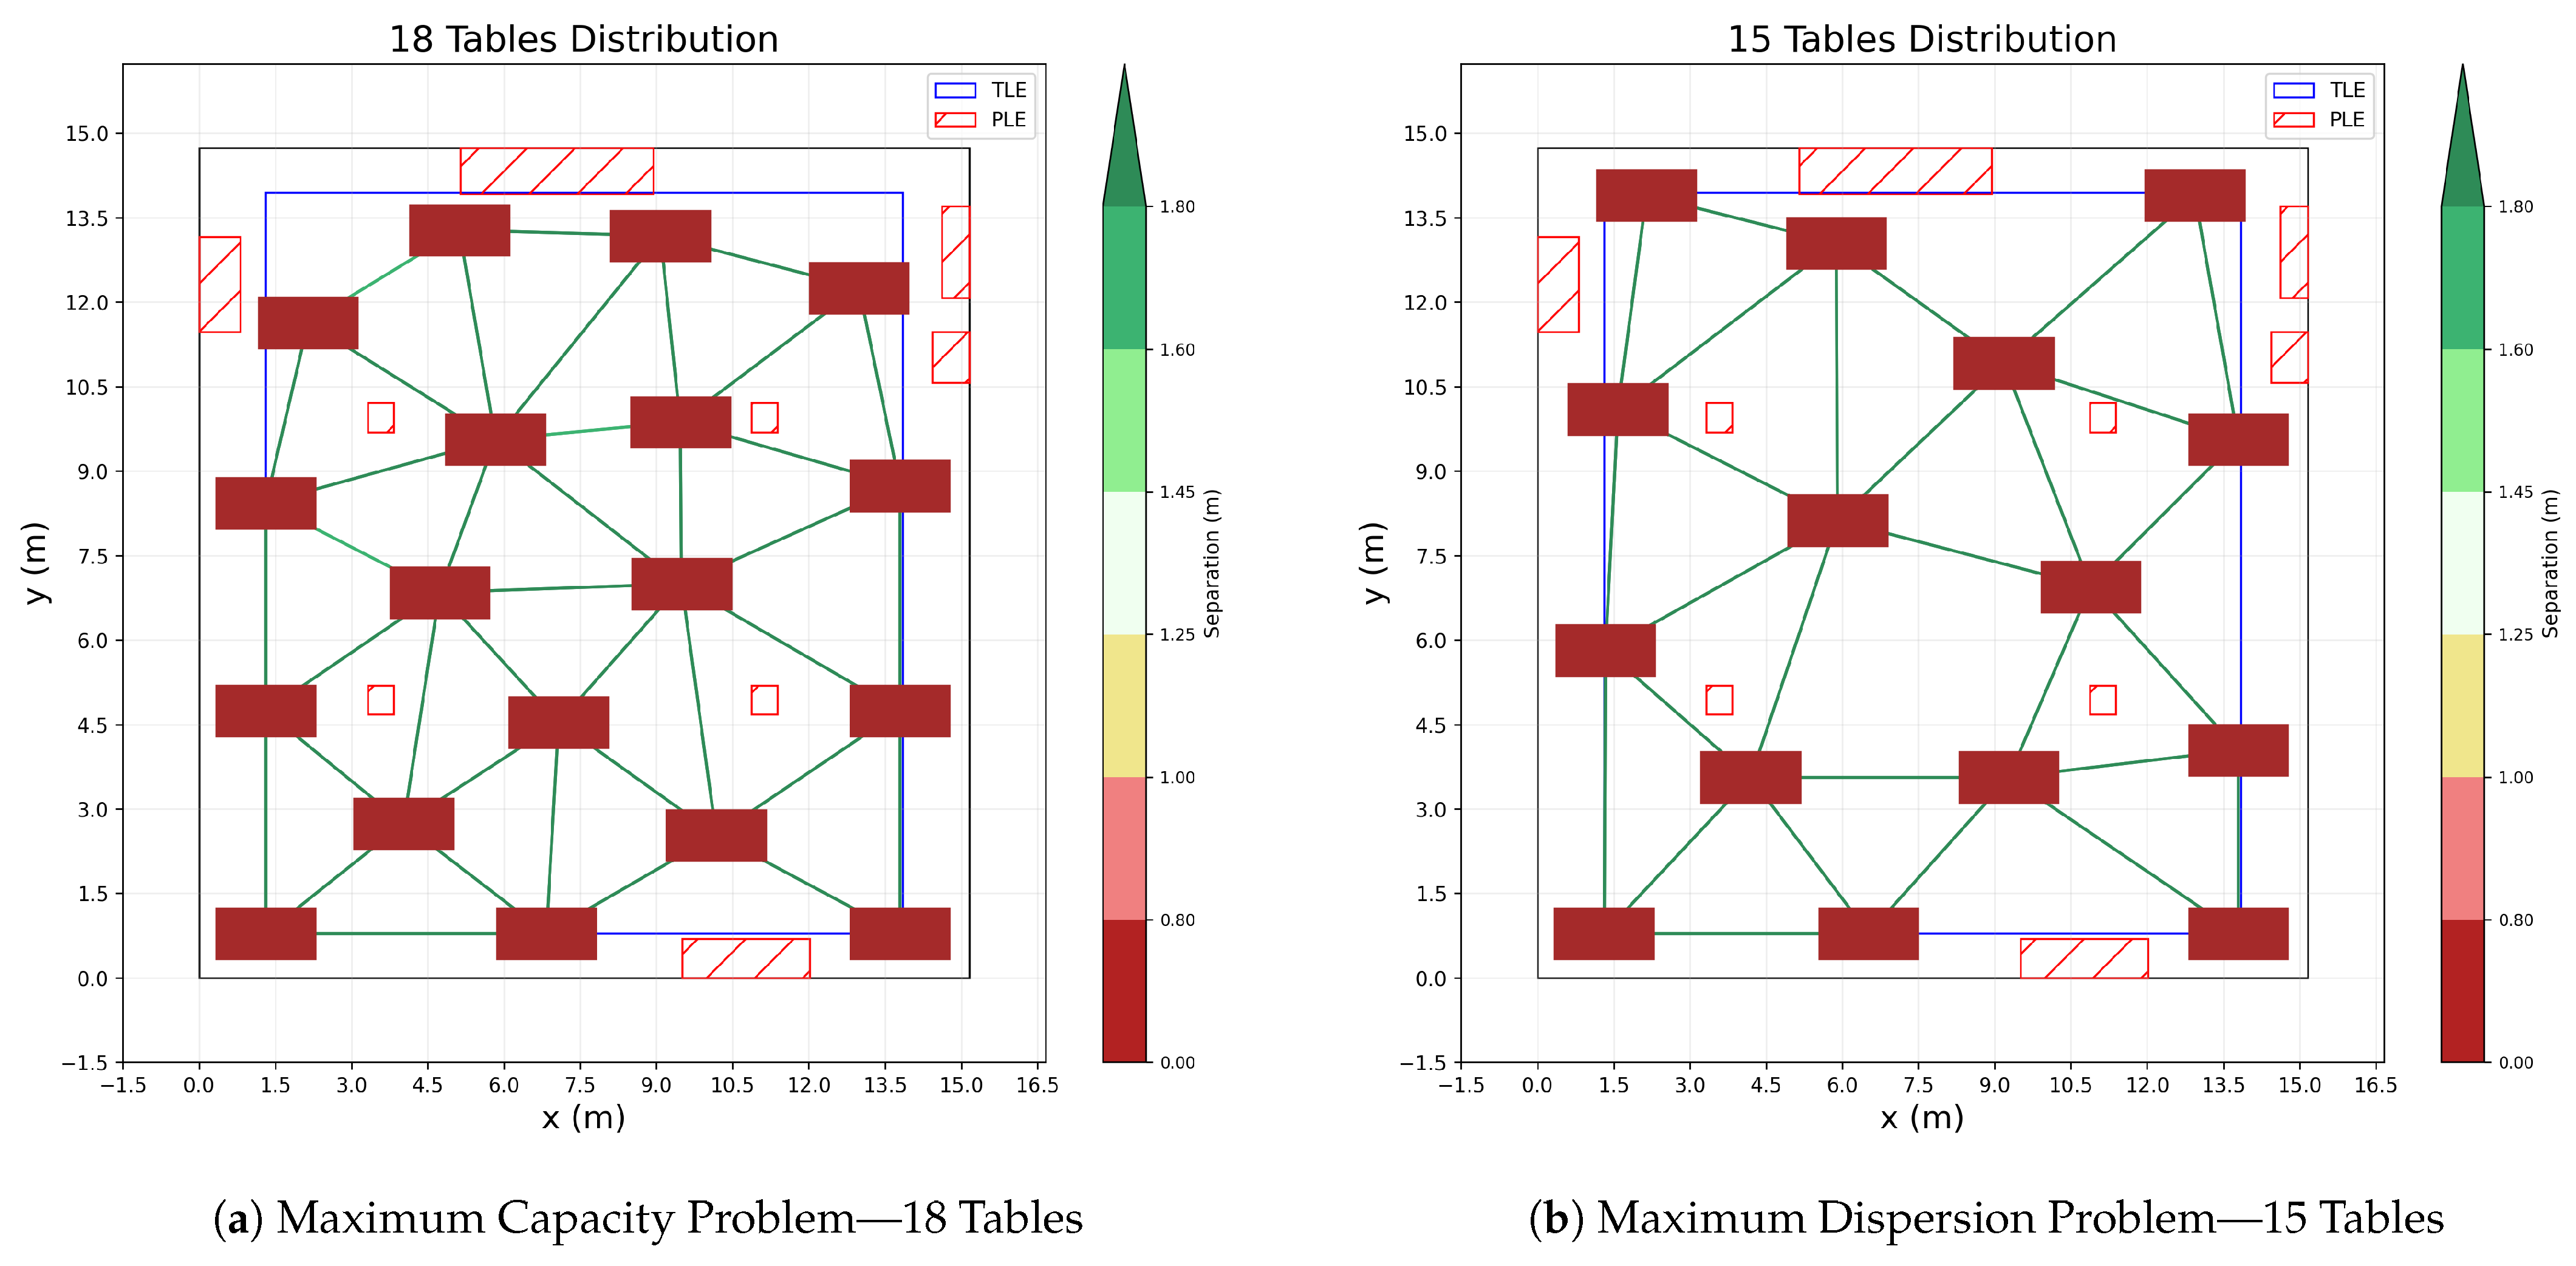
The achieved solutions by the MA optimisation for each configuration is shown in
Figure 7.
As shown in
Figure 7a,b, the MA obtained a valid and adequate solution for the configuration proposed, thus proving its viability for multiple scenarios and configurations. Finally,
Table 4 shows the mean distance obtained from these optimisations.
The obtained distance distribution shown in
Table 4 satisfies all measures and restrictions established by the Spanish legislation for the hostelry sector. Therefore, the achieved solutions represent safe and valid table arrangements for restaurants and other hostelry business in Spain.
Moreover, the flexibility of this methodology exceeds the distance restrictions for the COVID-19 pandemic, it could be possible to request a certain distribution of tables for daily exploitation of the spaces. Other restrictions such as Line-Of-Sight to a particular point or distribution of points (i.e., theater or work tables) represent significant tasks for daily managing these areas, and a flexible algorithm like the one proposed in this paper represents a potential solution to these problems.
5. Conclusions
The COVID-19 pandemic has critically impacted our normal coexistence. The quick contagion rate and the severity of the virus effects have reshaped our way of living. Social distancing, face masks and hydroalcoholic gels are some of the rules adopted for containing the virus propagation.
However, these measures were particularly severe for indoor spaces, such as schools, universities, bars and restaurants, where the low air renovation present in these scenarios significantly increased the risk of contagion. Therefore, the authorities have widely proposed a requirement of minimum distance separation for these establishments.
The managers of these indoor spaces have endured a significant challenge in obtaining a valid table distribution that fulfils the given restrictions while preserving the maximum number of tables allowed for enduring the pandemic. This problem, defined as the Table Location Problem, is categorised as NP-Hard due to the considerable number of possible solutions.
Furthermore, as a result of the existing dependency between adjacent tables in the distance distribution, an exact solution for this problem is unfeasible, thus the use of metaheuristics for this problem is recommended.
In our previous works, a GA optimisation has been deployed in multiple real classrooms. the obtained results achieved a valid distance distribution that improved both mean separation and number of students in these scenarios. However, due to the problem complexity, the algorithm convergence was compromised for high obstacle density scenarios with a substantial number of tables.
Therefore, in this paper, we introduce for the first time, to the authors’ best knowledge, a Memetic Algorithm optimisation for the TLP that combines the convergence of a GA with a Gradient Based Local Search for improving the optimisation performance.
The introduced Local Search selects and moves tables with a significant improvement potential in the most appropriate direction. This methodology achieves a considerable improvement of the distance optimisation by successfully guiding the convergence into the optimal direction, avoiding obstacles, reallocating erratic tables and exploring the entirety of the available space.
Moreover, the MA improvement over the original GA opens the proposed optimisation algorithm for more adverse scenarios, additional restrictions or various configurations. In this paper, multiple configurations have been analysed for the Esla Salon, a flexible space inside the Conde Luna Hotel, in the city of León.
The results show that the MA achieved adequate distributions for maximum capacity and maximum dispersion configurations, which the base GA was unable to reach. The flexibility denoted by the MA results is ideal for scenarios such as the Esla Salon, where multiple table configurations are arranged every day for various celebrations. Moreover, the TLP is not necessarily constricted to the COVID pandemic, proving its value for the daily management of these establishments, thus fulfilling the main objectives of this paper.


